mitogenomic perspectives into sciaenid fishes' phylogeny and evolution origin in the new world
TRANSCRIPT

Gene 539 (2014) 91–98
Contents lists available at ScienceDirect
Gene
j ourna l homepage: www.e lsev ie r .com/ locate /gene
Mitogenomic perspectives into sciaenid fishes' phylogeny and evolutionorigin in the New World
Tianjun Xu ⁎, Da Tang, Yuanzhi Cheng, Rixin WangLaboratory of Fish Biogenetics & Immune Evolution, College of Marine Science, Zhejiang Ocean University, Zhoushan 316022, China
⁎ Corresponding author. Tel./fax: +86 580 2550826.E-mail address: [email protected] (T. Xu).
0378-1119/$ – see front matter © 2014 Elsevier B.V. All rhttp://dx.doi.org/10.1016/j.gene.2014.01.048
a b s t r a c t
a r t i c l e i n f oArticle history:Accepted 15 January 2014Available online 29 January 2014
Keywords:SciaenidaeMitochondrial genomePhylogenyDivergence timeOrigin
Sciaenid fishes are widely distributed throughout the coastal waters and estuaries of the world. A total of 23 gen-era of this family are endemic to the OldWorld. However, evolutionary relationships among OldWorld sciaenidfishes and their origin have remained unresolved despite their diversity and importance. Besides, hypothesesthat explain the origin and biogeographical distribution of sciaenid fishes are controversial. In this study, thecomplete mitochondrial genome sequences of seven representative sciaenid species were determined and awell-resolved tree was recovered. This new timescale demonstrated that the sciaenid originated during thelate Jurassic to early Cretaceous Period. The estimated origin time of sciaenid fish is 208 Mya, and the origin ofOld World sciaenid is estimated at 126 Mya. Reconstruction of ancestral distributions indicated a plesiomorphicdistribution and center of origin in the New World, with at least one lineage subsequently dispersed to the OldWorld. Moreover, we conclude that the common ancestors of Old World sciaenid fishes were derived fromspecies of NewWorld.
© 2014 Elsevier B.V. All rights reserved.
1. Introduction
Sciaenid fishes (Croaker or drum fish, family Sciaenidae) are com-mercially important fish groups in temperate to tropical coastal watersand estuaries throughout the world. They are particularly abundant atthe mouths of large continental rivers, but are poorly known as groupsthat lived in seawater (Sasaki, 1989). This family comprises 67 to 78 gen-era, of which 23 are endemic to the Old World (Chao, 1986). Externalmorphological features exhibited by the family are diverse, especiallyin body form and mouth position. Structures related to sound produc-tion, gas bladder and otolith structures are also markedly diverse,which is a distinctive feature of this family. Although sciaenid fisheshave attracted a great deal of attention frombiologists, whohave focusedon systematics, evolution and zoogeographics, interrelationships ofmostOldWorld Sciaenidae genera and the origin of Sciaenidae have remainedelusive for a long time.
Morphological disparity among theOldWorld sciaenidfishes has re-sulted in numerous conflicting phylogenetic hypotheses (Figs. 1A–H).Chu et al. (1963) classified the sciaenid fishes of China and adjacentareas based on five characters including structure of gas bladder, otolith,sensory pores on snout, lower jaw, and dentition. In their taxonomy,subfamily Argyrosominae and Pseudosciaeninae were sister-groups.The former is composed of the genera Argyrosomus and Nibea, and thelatter of the genera Atrobucca, Miichthys, Collichthys and Pseudosciaena(Fig. 1A). Whether the two subfamilies are monophyletic groups orjust artificial assemblages has been widely debated (Mohan, 1969;
ights reserved.
Taniguchi, 1970; Trewavas, 1962). Trewavas (1962) and Mohan(1969) pointed out that Chu et al.'s classification lacks sampling mate-rials from the Indian Ocean. In contrast to Chu et al.'s taxonomy,Argyrosominaewas considered to be polyphyletic in subsequent hypoth-eses based on more samples and more morphological characters.Taniguchi (1970) and Mohan (1969) suggested a close affinity betweenAtrobucca, Argyrosomus, and Nibea, although the interrelationshipsamong these genera are uncertain (Figs. 1D and F). Moreover, Taniguchi(1969a, 1969b), Trewavas (1977) and Sasaki (1989) placed Argyrosomusand Nibea into separate main clades (Figs. 1B, C, G and H). Besides Chuet al.'s conclusion (1963), monophyly of Pseudosciaeninae was alsorecovered in the study by Taniguchi (1970) in which sciaenid fishes phy-logenywas analyzed based on the feature of dentition (Fig. 1E). These re-sults, however, are in conflict with reports by Taniguchi (1969a, 1969b),Mohan (1969), Trewavas (1977) and Sasaki (1989), in which Miichthyswas not grouped with Collichthys and Pseudosciaena, but placed intodifferent main clades (Figs. 1B, C, F, G and H). Because of a lack of clearsynapomorphies, and often unclear character homology, the ability ofthese morphological characters to resolve phylogenetic relationships islimited.
Previous molecular investigations of Old World sciaenid fishes phy-logeny have relied primarily on partial mitochondrial or nuclear genesequences, which offered controversial resolutions or support valueswere in general low (Figs. 1I–Q). Hypotheses based on such shortsequences are conflicting and the interrelationship of many genera isstill uncertain (Figs. 1I–Q). Deep nodes in the constructed phylogenetictrees were generally weak, suggesting that short sequences might notbe sufficient to solve a particularly difficult phylogenetic problem. Ithas been shown that the use of complete mitochondrial genome

92 T. Xu et al. / Gene 539 (2014) 91–98
sequences minus non-coding sequences is more powerful than singlegene sequences. Moreover, complete mitochondrial genome is asmall-scale genome suitable for complete sequencing and thus provides
Fig. 1. Alternative phylogenetic hypotheses of the sciaenid fishes. A) Morphology-based hypoth1970). E)Morphology-based hypothesis of Tanguichi in, 1970. F) Morphology-based hypothesibased hypothesis of Sasaki (1989). I-M) Molecular -based hypotheses of Chen (2007), Meng etMolecular-based hypothesis of Cheng et al. (2010). Q)Molecular-based hypothesis ofMa et al. (trees) or blue (in molecular data-based trees).
substantial amount of DNA and amino acid data for phylogeny recon-struction. Several phylogenetic studies have significantly advanced ourunderstanding of fish evolution by using sequences derived from
esis of Chu et al. (1963). B–D)Morphology-based hypotheses of Taniguchi (1969a, 1969b,s ofMohan (1969). G)Morphology-based hypothesis of Trewavas (1977). H)Morphology-al (2004) and Tong et al (2007). N, O) Molecular-based hypotheses of Liu et al. (2010). P)2012). Species used in the present studywere colored as red (inmorphological data-based
93T. Xu et al. / Gene 539 (2014) 91–98
completemitochondrial genomedata (Inoue et al., 2010; Nakatani et al.,2011; Yamanoue et al., 2011).
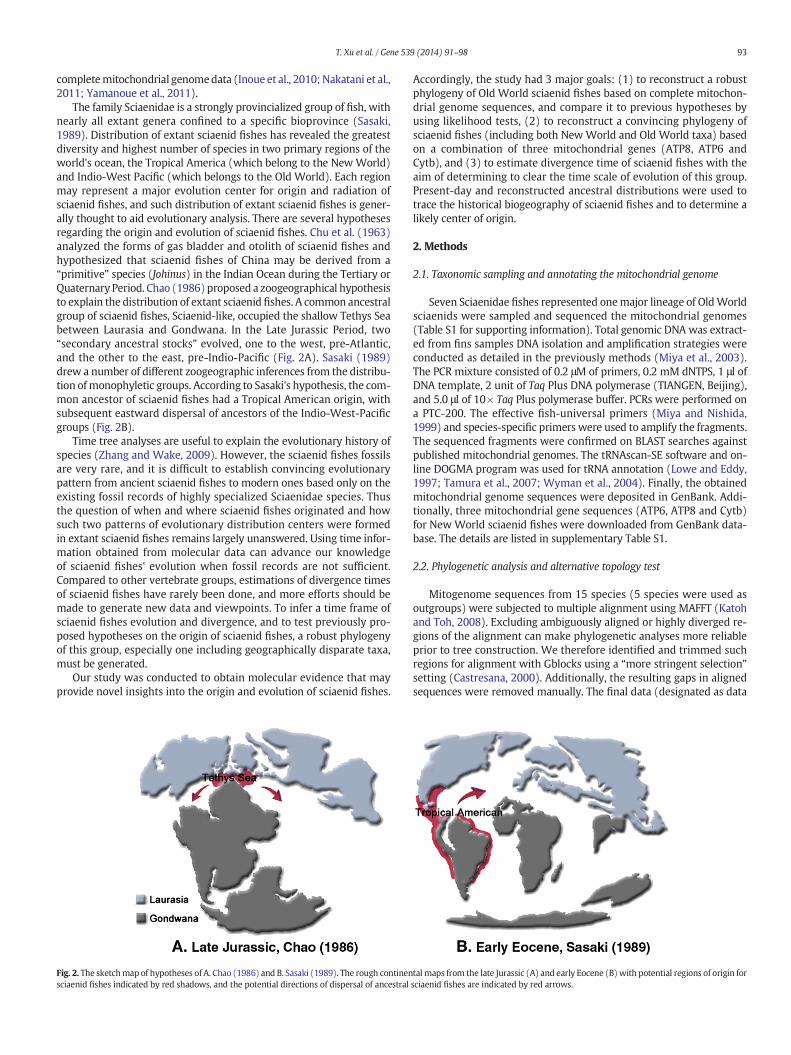
The family Sciaenidae is a strongly provincialized group of fish, withnearly all extant genera confined to a specific bioprovince (Sasaki,1989). Distribution of extant sciaenid fishes has revealed the greatestdiversity and highest number of species in two primary regions of theworld's ocean, the Tropical America (which belong to the New World)and Indio-West Pacific (which belongs to the Old World). Each regionmay represent a major evolution center for origin and radiation ofsciaenid fishes, and such distribution of extant sciaenid fishes is gener-ally thought to aid evolutionary analysis. There are several hypothesesregarding the origin and evolution of sciaenid fishes. Chu et al. (1963)analyzed the forms of gas bladder and otolith of sciaenid fishes andhypothesized that sciaenid fishes of China may be derived from a“primitive” species (Johinus) in the Indian Ocean during the Tertiary orQuaternary Period. Chao (1986) proposed a zoogeographical hypothesisto explain the distribution of extant sciaenid fishes. A common ancestralgroup of sciaenid fishes, Sciaenid-like, occupied the shallow Tethys Seabetween Laurasia and Gondwana. In the Late Jurassic Period, two“secondary ancestral stocks” evolved, one to the west, pre-Atlantic,and the other to the east, pre-Indio-Pacific (Fig. 2A). Sasaki (1989)drew a number of different zoogeographic inferences from the distribu-tion of monophyletic groups. According to Sasaki's hypothesis, the com-mon ancestor of sciaenid fishes had a Tropical American origin, withsubsequent eastward dispersal of ancestors of the Indio-West-Pacificgroups (Fig. 2B).
Time tree analyses are useful to explain the evolutionary history ofspecies (Zhang and Wake, 2009). However, the sciaenid fishes fossilsare very rare, and it is difficult to establish convincing evolutionarypattern from ancient sciaenid fishes to modern ones based only on theexisting fossil records of highly specialized Sciaenidae species. Thusthe question of when and where sciaenid fishes originated and howsuch two patterns of evolutionary distribution centers were formedin extant sciaenid fishes remains largely unanswered. Using time infor-mation obtained from molecular data can advance our knowledgeof sciaenid fishes' evolution when fossil records are not sufficient.Compared to other vertebrate groups, estimations of divergence timesof sciaenid fishes have rarely been done, and more efforts should bemade to generate new data and viewpoints. To infer a time frame ofsciaenid fishes evolution and divergence, and to test previously pro-posed hypotheses on the origin of sciaenid fishes, a robust phylogenyof this group, especially one including geographically disparate taxa,must be generated.
Our study was conducted to obtain molecular evidence that mayprovide novel insights into the origin and evolution of sciaenid fishes.
Fig. 2. The sketchmap of hypotheses of A. Chao (1986) and B. Sasaki (1989). The rough continensciaenid fishes indicated by red shadows, and the potential directions of dispersal of ancestral
Accordingly, the study had 3 major goals: (1) to reconstruct a robustphylogeny of Old World sciaenid fishes based on complete mitochon-drial genome sequences, and compare it to previous hypotheses byusing likelihood tests, (2) to reconstruct a convincing phylogeny ofsciaenid fishes (including both New World and Old World taxa) basedon a combination of three mitochondrial genes (ATP8, ATP6 andCytb), and (3) to estimate divergence time of sciaenid fishes with theaim of determining to clear the time scale of evolution of this group.Present-day and reconstructed ancestral distributions were used totrace the historical biogeography of sciaenid fishes and to determine alikely center of origin.
2. Methods
2.1. Taxonomic sampling and annotating the mitochondrial genome
Seven Sciaenidae fishes represented onemajor lineage of OldWorldsciaenids were sampled and sequenced the mitochondrial genomes(Table S1 for supporting information). Total genomic DNA was extract-ed from fins samples DNA isolation and amplification strategies wereconducted as detailed in the previously methods (Miya et al., 2003).The PCR mixture consisted of 0.2 μM of primers, 0.2 mM dNTPS, 1 μl ofDNA template, 2 unit of Taq Plus DNA polymerase (TIANGEN, Beijing),and 5.0 μl of 10× Taq Plus polymerase buffer. PCRs were performed ona PTC-200. The effective fish-universal primers (Miya and Nishida,1999) and species-specific primers were used to amplify the fragments.The sequenced fragments were confirmed on BLAST searches againstpublished mitochondrial genomes. The tRNAscan-SE software and on-line DOGMA program was used for tRNA annotation (Lowe and Eddy,1997; Tamura et al., 2007; Wyman et al., 2004). Finally, the obtainedmitochondrial genome sequences were deposited in GenBank. Addi-tionally, three mitochondrial gene sequences (ATP6, ATP8 and Cytb)for New World sciaenid fishes were downloaded from GenBank data-base. The details are listed in supplementary Table S1.
2.2. Phylogenetic analysis and alternative topology test
Mitogenome sequences from 15 species (5 species were used asoutgroups) were subjected to multiple alignment using MAFFT (Katohand Toh, 2008). Excluding ambiguously aligned or highly diverged re-gions of the alignment can make phylogenetic analyses more reliableprior to tree construction. We therefore identified and trimmed suchregions for alignment with Gblocks using a “more stringent selection”setting (Castresana, 2000). Additionally, the resulting gaps in alignedsequences were removed manually. The final data (designated as data
tal maps from the late Jurassic (A) and early Eocene (B)with potential regions of origin forsciaenid fishes are indicated by red arrows.
94 T. Xu et al. / Gene 539 (2014) 91–98
set 1) consisted of 7560 positions from the 13 protein-coding genes,2368 positions from the two rRNA genes, and 1482 positions from the22 tRNA genes (name of the data matrix was designated as 12nRTn,where 1, 2, R and T represent 1st codon position, 2nd codon position,rRNA gene and tRNA gene, respectively, and the subscript “n” denotesnucleotide). Third codon positions were excluded to reduce substitu-tional saturations. Unambiguous aligned sequences were divided intofour partitions depending on the data set 12nRTn. Best-fit evolutionarymodels were chosen for each partition with jModeltest under AIC andBIC (Posada, 2008). RAxML ver. 7.2.8 andMrBayes 3.2were used to con-duct data-partitioning-based tree reconstructions (Huelsenbeck andRonquist, 2001; Stamatakis, 2006). The constrained tree topologieswith reference to the alternative hypotheses (Fig. 1) were createdman-ually and then subjected to Tree-Puzzle to perform the Kishino–Haseawa (KH) and Shimodaira–Hasegawa (SH) tests. The site-wiselog likelihood scores were computed for each tree (Schmidt et al,2002). To calculate the statistical significance of the differences in likeli-hood, the output file containing the site-wise log likelihood scorewas subject to CONSEL (Shimodaira and Hasegawa, 2001). Probabilitiesof alternative phylogenetic hypotheses were calculated using thelikelihood-based approximately unbiased (AU) test as implemented inCONSEL (Shimodaira, 2002).
2.3. Tracing ancestral biogeographic ranges
To identify the ancestral biogeographic range of sciaenid fishes, wefirst reconstructed a phylogenetic tree of sciaenid fishes representingthe New World and Old World species based on three mitochondrialgenes (ATP8, ATP6 and partial Cytb genes, total length 1508 bp, desig-nated as data set 2). Inference of ancestral distributions was madeusing Mesquite software packages (Maddison and Maddison, 2010) bylikelihood-based analysis on the phylogenetic tree of sciaenid fishes.Each taxon of sciaenid fishes was assigned to one of two distributionalregions: New World (Character coded as 0) and Old World (Charactercoded as 1). The regions were chosen based on the known range ofeach taxon.
2.4. Divergence time estimation
Bayesian molecular dating was carried out by using the MCMCTreeprogram in the PAML 4.6 software package (Yang, 2007). The treeinferred from the three mitochondrial genes was used as the referencetopology. Bayesian molecular dating was performed with an ingrouproot of 192 Mya, which refers to the split of Tetraodontiformes +Perciformes and Gasterosteiformes + Scorpaeniformes (Yamanoueet al., 2006). The independent rates (IR) model, which has beenconsidered more appropriate for divergence time estimation than cor-related rates model in recent studies (Zhong et al., 2009), was used tospecify the prior of rates among internal nodes. We used 126–235 Myaas constraint points for the Gasterosteiformes + Scorpaeniformesseparation, which were estimated based on fossil and molecular evi-dences (Yamanoue et al., 2006). Loose bound for the root was set atb500 Mya.
To diagnose possible failure of the Markov chains to reach station-arity, at least two MCMC analyses were performed with two differentseeds. In each analysis, approximation with a burn-in period of50,000 cycles was obtained, and every 50 cycles was taken to create atotal of 10,000 samples. Similar results were observed in two runs.
3. Results
3.1. Phylogenetic relationships and likelihood tests
Partitioned Bayesian and maximum likelihood analyses based on 15whole mitochondrial genome sequences resulted in a well-resolvedtree, with nearly all the internal branches supported by high bootstrap
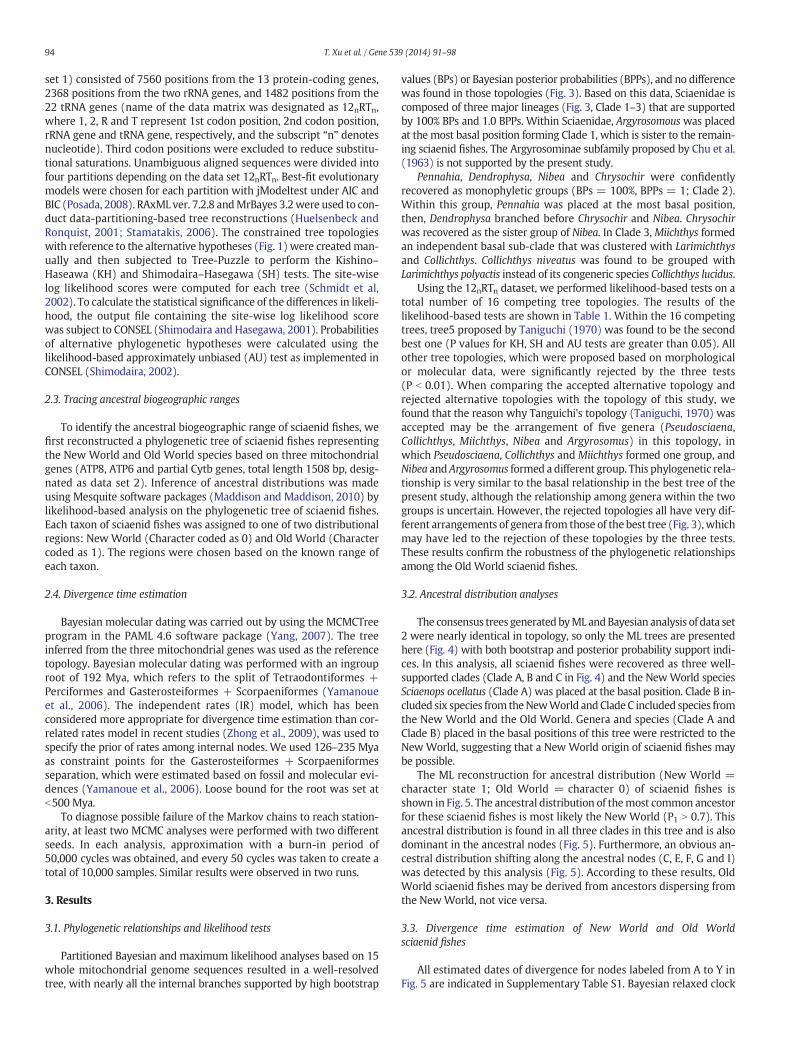
values (BPs) or Bayesian posterior probabilities (BPPs), and no differencewas found in those topologies (Fig. 3). Based on this data, Sciaenidae iscomposed of three major lineages (Fig. 3, Clade 1–3) that are supportedby 100% BPs and 1.0 BPPs. Within Sciaenidae, Argyrosomous was placedat the most basal position forming Clade 1, which is sister to the remain-ing sciaenid fishes. The Argyrosominae subfamily proposed by Chu et al.(1963) is not supported by the present study.
Pennahia, Dendrophysa, Nibea and Chrysochir were confidentlyrecovered as monophyletic groups (BPs = 100%, BPPs = 1; Clade 2).Within this group, Pennahia was placed at the most basal position,then, Dendrophysa branched before Chrysochir and Nibea. Chrysochirwas recovered as the sister group of Nibea. In Clade 3, Miichthys formedan independent basal sub-clade that was clustered with Larimichthysand Collichthys. Collichthys niveatus was found to be grouped withLarimichthys polyactis instead of its congeneric species Collichthys lucidus.
Using the 12nRTn dataset, we performed likelihood-based tests on atotal number of 16 competing tree topologies. The results of thelikelihood-based tests are shown in Table 1. Within the 16 competingtrees, tree5 proposed by Taniguchi (1970) was found to be the secondbest one (P values for KH, SH and AU tests are greater than 0.05). Allother tree topologies, which were proposed based on morphologicalor molecular data, were significantly rejected by the three tests(P b 0.01). When comparing the accepted alternative topology andrejected alternative topologies with the topology of this study, wefound that the reason why Tanguichi's topology (Taniguchi, 1970) wasaccepted may be the arrangement of five genera (Pseudosciaena,Collichthys, Miichthys, Nibea and Argyrosomus) in this topology, inwhich Pseudosciaena, Collichthys and Miichthys formed one group, andNibea and Argyrosomus formed a different group. This phylogenetic rela-tionship is very similar to the basal relationship in the best tree of thepresent study, although the relationship among genera within the twogroups is uncertain. However, the rejected topologies all have very dif-ferent arrangements of genera from those of the best tree (Fig. 3),whichmay have led to the rejection of these topologies by the three tests.These results confirm the robustness of the phylogenetic relationshipsamong the Old World sciaenid fishes.
3.2. Ancestral distribution analyses
The consensus trees generated byML andBayesian analysis of data set2 were nearly identical in topology, so only the ML trees are presentedhere (Fig. 4) with both bootstrap and posterior probability support indi-ces. In this analysis, all sciaenid fishes were recovered as three well-supported clades (Clade A, B and C in Fig. 4) and the NewWorld speciesSciaenops ocellatus (Clade A) was placed at the basal position. Clade B in-cluded six species from theNewWorld andClade C included species fromthe New World and the Old World. Genera and species (Clade A andClade B) placed in the basal positions of this tree were restricted to theNew World, suggesting that a New World origin of sciaenid fishes maybe possible.
The ML reconstruction for ancestral distribution (New World =character state 1; Old World = character 0) of sciaenid fishes isshown in Fig. 5. The ancestral distribution of themost common ancestorfor these sciaenid fishes is most likely the New World (P1 N 0.7). Thisancestral distribution is found in all three clades in this tree and is alsodominant in the ancestral nodes (Fig. 5). Furthermore, an obvious an-cestral distribution shifting along the ancestral nodes (C, E, F, G and I)was detected by this analysis (Fig. 5). According to these results, OldWorld sciaenid fishes may be derived from ancestors dispersing fromthe New World, not vice versa.
3.3. Divergence time estimation of New World and Old Worldsciaenid fishes
All estimated dates of divergence for nodes labeled from A to Y inFig. 5 are indicated in Supplementary Table S1. Bayesian relaxed clock
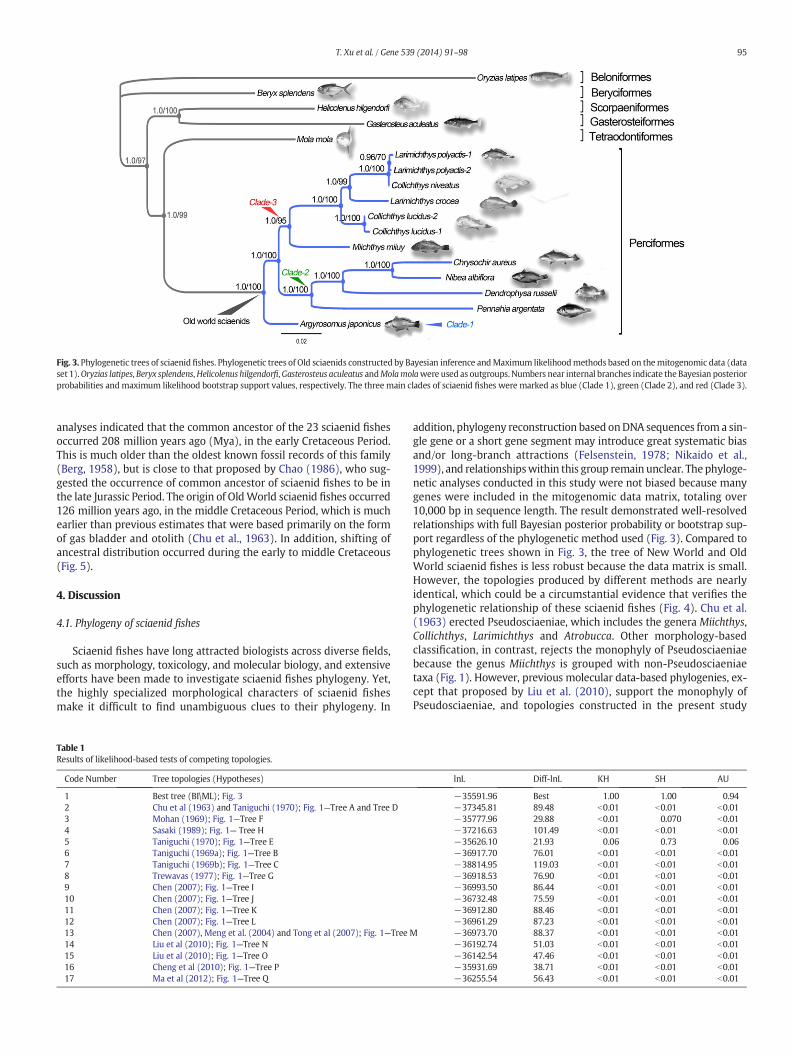
Fig. 3. Phylogenetic trees of sciaenidfishes. Phylogenetic trees of Old sciaenids constructed by Bayesian inference andMaximum likelihoodmethods based on themitogenomic data (dataset 1).Oryzias latipes, Beryx splendens,Helicolenus hilgendorfi,Gasterosteus aculeatus andMolamolawere used as outgroups. Numbers near internal branches indicate theBayesian posteriorprobabilities andmaximum likelihood bootstrap support values, respectively. The three main clades of sciaenid fishes were marked as blue (Clade 1), green (Clade 2), and red (Clade 3).
95T. Xu et al. / Gene 539 (2014) 91–98
analyses indicated that the common ancestor of the 23 sciaenid fishesoccurred 208 million years ago (Mya), in the early Cretaceous Period.This is much older than the oldest known fossil records of this family(Berg, 1958), but is close to that proposed by Chao (1986), who sug-gested the occurrence of common ancestor of sciaenid fishes to be inthe late Jurassic Period. The origin of OldWorld sciaenid fishes occurred126 million years ago, in the middle Cretaceous Period, which is muchearlier than previous estimates that were based primarily on the formof gas bladder and otolith (Chu et al., 1963). In addition, shifting ofancestral distribution occurred during the early to middle Cretaceous(Fig. 5).
4. Discussion
4.1. Phylogeny of sciaenid fishes
Sciaenid fishes have long attracted biologists across diverse fields,such as morphology, toxicology, and molecular biology, and extensiveefforts have been made to investigate sciaenid fishes phylogeny. Yet,the highly specialized morphological characters of sciaenid fishesmake it difficult to find unambiguous clues to their phylogeny. In
Table 1Results of likelihood-based tests of competing topologies.
Code Number Tree topologies (Hypotheses)
1 Best tree (BI\ML); Fig. 32 Chu et al (1963) and Taniguchi (1970); Fig. 1—Tree A and Tree D3 Mohan (1969); Fig. 1—Tree F4 Sasaki (1989); Fig. 1— Tree H5 Taniguchi (1970); Fig. 1—Tree E6 Taniguchi (1969a); Fig. 1—Tree B7 Taniguchi (1969b); Fig. 1—Tree C8 Trewavas (1977); Fig. 1—Tree G9 Chen (2007); Fig. 1—Tree I10 Chen (2007); Fig. 1—Tree J11 Chen (2007); Fig. 1—Tree K12 Chen (2007); Fig. 1—Tree L13 Chen (2007), Meng et al. (2004) and Tong et al (2007); Fig. 1—Tree14 Liu et al (2010); Fig. 1—Tree N15 Liu et al (2010); Fig. 1—Tree O16 Cheng et al (2010); Fig. 1—Tree P17 Ma et al (2012); Fig. 1—Tree Q
addition, phylogeny reconstruction based onDNA sequences from a sin-gle gene or a short gene segment may introduce great systematic biasand/or long-branch attractions (Felsenstein, 1978; Nikaido et al.,1999), and relationshipswithin this group remain unclear. The phyloge-netic analyses conducted in this study were not biased because manygenes were included in the mitogenomic data matrix, totaling over10,000 bp in sequence length. The result demonstrated well-resolvedrelationships with full Bayesian posterior probability or bootstrap sup-port regardless of the phylogenetic method used (Fig. 3). Compared tophylogenetic trees shown in Fig. 3, the tree of New World and OldWorld sciaenid fishes is less robust because the data matrix is small.However, the topologies produced by different methods are nearlyidentical, which could be a circumstantial evidence that verifies thephylogenetic relationship of these sciaenid fishes (Fig. 4). Chu et al.(1963) erected Pseudosciaeniae, which includes the genera Miichthys,Collichthys, Larimichthys and Atrobucca. Other morphology-basedclassification, in contrast, rejects the monophyly of Pseudosciaeniaebecause the genus Miichthys is grouped with non-Pseudosciaeniaetaxa (Fig. 1). However, previous molecular data-based phylogenies, ex-cept that proposed by Liu et al. (2010), support the monophyly ofPseudosciaeniae, and topologies constructed in the present study
lnL Diff-lnL KH SH AU
−35591.96 Best 1.00 1.00 0.94−37345.81 89.48 b0.01 b0.01 b0.01−35777.96 29.88 b0.01 0.070 b0.01−37216.63 101.49 b0.01 b0.01 b0.01−35626.10 21.93 0.06 0.73 0.06−36917.70 76.01 b0.01 b0.01 b0.01−38814.95 119.03 b0.01 b0.01 b0.01−36918.53 76.90 b0.01 b0.01 b0.01−36993.50 86.44 b0.01 b0.01 b0.01−36732.48 75.59 b0.01 b0.01 b0.01−36912.80 88.46 b0.01 b0.01 b0.01−36961.29 87.23 b0.01 b0.01 b0.01
M −36973.70 88.37 b0.01 b0.01 b0.01−36192.74 51.03 b0.01 b0.01 b0.01−36142.54 47.46 b0.01 b0.01 b0.01−35931.69 38.71 b0.01 b0.01 b0.01−36255.54 56.43 b0.01 b0.01 b0.01

Fig. 4. Phylogenetic trees of NewWorld and OldWorld sciaenid fishes. Phylogenetic trees constructed by Bayesian inference andmaximum likelihoodmethods based on threemitochon-drial genes (ATP6, ATP8 and Cytb) (data set 2).Oryzias latipes, Beryx splendens,Helicolenus hilgendorfi,Gasterosteus aculeatus andMolamolawere used as outgroups. Numbers near internalbranches indicate theML bootstrap support values and Bayesian posterior probabilities, “–” indicates that no such topologywas found in Bayesian tree. All the sciaenidfisheswere groupedinto threemain clades (CladeA, Clade B and Clade C). Clades including the NewWorld sciaenid fisheswere colored as red, and Clades including the OldWorld sciaenid fisheswere coloredas blue.
96 T. Xu et al. / Gene 539 (2014) 91–98
support this phylogeny (Fig. 1). Both morphological classification andmolecular classification reject the monophyly of Argyrosominae (Chuet al., 1963) because Nibea and Pennahia are not merged into onegroup. Thus, findings of our study support previous classifications andreject the erection of Argyrosominae.
Phylogenies of the genera Pennahia, Chrysochir, Nibea andDendrophysa based on morphological and molecular data were confi-dently rejected by likelihood tests (KH, SH and AU). These four generawere recovered as a monophyletic group that is a sister group ofPseudosciaeniae. Such topology was subsequently confirmed in phylo-genetic analysis based on three mitochondrial genes. Clades A and Bonly contain New World genera and were placed at the basal position(Fig. 4). Clade C comprises of both New World and Old World sciaenidfishes. This result is comparable to the phylogenetic tree previouslyconstructed based onmorphological characters (Sasaki, 1989). Such to-pology may indicate that New World species placed in clades A and Bwere more “primitive” than Old World species and a common ancestorof NewWorld species split to at least three lineages, and at least one lin-eage may have become the common ancestor of Old World sciaenidfishes.
4.2. The origin of sciaenid fishes
The time for the origin of sciaenid fishes is still a controversialtopic. The earliest geologic occurrence of this family is thought tobe from middle to late Eocene in the Gulf region of North Americaand the family does not appear in European fossil records until thelower Oligocene (Breard and Stringer, 1999; Frizzell and Dante,
1965; Koken, 1888; Nolf, 2003; Nolf and Stringer, 2003). Berg(1958) also reported that the oldest known fossils of sciaenid fishesare from the Eocene epoc (40–50 Mya). Additionally, Sasaki (1989)mentioned that the oldest fossil record of a sciaenid otolith is fromthe Eocene Gulf. While these results seem to point to an Eocene ori-gin of sciaenid fishes, Chao (1986) reported that the oldest fossilsciaenid is an otolith record of Otholithus bornholmiensis from Liasin Denmark (Malling and Grönwall, 1909) and this record points toa much older origin than the generally accepted late Cretaceous ori-gin of Perciformes (Lagler et al., 1977; McAllister, 1986). Further-more, Chao (1986) proposed a hypothesis on a late Jurassic originof Sciaenidae. Regarding the time of origin of extant sciaenid fishesliving along coaster waters of China, Chu et al. (1963) hypothesizedthat sciaenid fishes of Chinamight have come from a “primitive” spe-cies (Johinus) in the Indian Ocean during Tertiary or QuaternaryPeriod. Our estimated molecular time for the origin of sciaenid fishesis much older than those of fossil-based predictions. This new time-scale indicates that sciaenid fishes originated during the early Creta-ceous Period at the latest. This result is compatible with Chao's lateJurassic origin hypothesis. Although otolith-based fossil records ofsciaenid fishes are rich in Eocene Gulf (Takeuchi and Huddleston,2008), we think this only means that there were large populationsof many sciaenid species during the Eocene epoch in the Gulf regionof North America. Moreover, some otolith-based fossil records foundin Eocene Gulf represent highly specialized species (such as Pogoniasand Totoaba), not the common ancestral species of this family. Tak-ing these points together, we propose that the origin of sciaenid fish-es occurred during the late Jurassic to early Cretaceous.

Fig. 5. Timetree derived from the Bayesian relaxed-molecular clockmethod and Ancestral distributions assigned bymaximum likelihood analysis. Horizontal bars indicate 95% credible inter-vals of the divergence time estimates. Internal nodes were codedwith letters A to Y.ML reconstructions of ancestral habitats are indicated on selected nodes with pie charts showing the like-lihoods for two character states (red, NewWorld; blue, Old World).
97T. Xu et al. / Gene 539 (2014) 91–98
4.3. Origin and biogeographic distribution of sciaenid fishes
The region of origin of sciaenid fishes remains a controversial topic.Chao (1986) hypothesized that the shallow Tethy Sea between Laurasiaand Gondwanaland is the place where a common ancestral group ofsciaenid fishes occurred, and two “secondary ancestral stocks” evolved,one to thewest, pre-Atlantic, and the other to the East, pre-Indio-Pacific,from that region. In fact, this hypothesis matches the vicariance model,in which vicariance is proposed to have led to the splitting and subse-quent independent evolution of a common ancestral group of sciaenidfishes. If Chao's hypothesis is true, two main clades, of which onecontains the New World species and the other contains the Old Worldspecies in the phylogenetic tree should be expected. However, a cladecontaining New World species was found to be first grouped with OldWorld species in phylogenetic tree, and other clades containing onlyNew World species were found at the basal position of the tree. This
evidence suggests that the New World may be the region wheresciaenid fishes originated, and dispersal, rather than vicariance, shapedthe two evolutionary center distribution patterns of sciaenid fishes. Incontrast Chao's hypothesis, Sasaki (1989) noted that 14 extant sciaenidgenera possess an Amphi-American distribution and the Sciaenidaefamily possibly originated in a restricted area of the New World. Fur-thermore, the North American otolith-based fossil records of theSciaenidae strongly support the hypothesis that Tropical America wasthe major evolutionary center for this family. Our new distributionreconstructing analysis (Fig. 5) supports Sasaki's hypothesis thatsciaenid fishes originated in the New World, and also indicated thatthe common ancestors of Old World sciaenid fishes may be derivedfrom species of the New World.
Wewere unable to collectmoreOldWorld sciaenid samples becausethese species are on the brink of extinction. However, we believe thatthe molecular phylogenetic analysis and biogeographic reconstruction

98 T. Xu et al. / Gene 539 (2014) 91–98
of sciaenid fishes described in this study will provide important newinsights into the evolution of this morphologically diverse group. Weappeal for a Worldwide investigation using genetic resource on theseendangered sciaenid fishes.
Conflict of interest
The authors report no conflicts of interest.
Acknowledgments
This study was supported by the National Natural Science Founda-tion of China (31272661) and the Zhejiang Provincial Natural ScienceFoundation (LY13C040001). We thank Prof. Shenglong Zhao for sam-pling and morphologically identifying.
Appendix A. Supplementary data
Supplementary data to this article can be found online at http://dx.doi.org/10.1016/j.gene.2014.01.048.
References
Berg, L.S., 1958. System de rezenten und fossilen Fischaratigen und Fische. Veb. DeutscherVerlag der Wissenschaften, Berlin.
Breard, S.Q., Stringer, G.L., 1999. Integrated paleoecology and marine vertebratefauna of the Stone City Formation (middle Eocene). Gulf. Coast Assoc. Geol. Soc.49, 132–143.
Castresana, J., 2000. Selection of conserved blocks from multiple alignments for their usein phylogenetic analysis. Mol. Biol. Evol. 17, 540–552.
Chao, N.L., 1986. A synopsis on zoogeography of the Sciaenidae. Indo-Pacific fish biol-ogy: proceedings of the Second International Conference on Indo-Pacific Fishes.In: Uyeno, T., Arai, R., Taniuchi, T., Matsuura, K. (Eds.), Ichthyol. Soci. Jap. Tokyo,pp. 570–589.
Chen, Q.M., 2007. Molecular Phylogeny of the Sciaenidae in China. Jinan University,GuangZhou.
Cheng, Y.Z., Xu, T.J., Shi, G., Wang, R.X., 2010. Complete mitochondrial genome of themiiuy croaker Miichthys miiuy (Perciformes, Sciaenidae) with phylogenetic consider-ation. Mar. Genomics 3, 201–209.
Chu, Y.T., Lo, Y.L., Wu, H.L., 1963. A Study on the Classification of the Sciaenid Fishes ofChina, with Description of New Genera and Species. Science Technology Press.
Felsenstein, J., 1978. Cases in which parsimony or compatibility methods will be positivelymisleading. Syst. Biol. 27, 401–410.
Frizzell, D., Dante, J., 1965. Otoliths of some early Cenozoic fishes of the Gulf Coast.J. Paleontol. 39, 687–718.
Huelsenbeck, J.P., Ronquist, F., 2001. MRBAYES: Bayesian inference of phylogenetic trees.Bioinformatics 17, 754–755.
Inoue, J.G., et al., 2010. Evolutionary origin and phylogeny of the modern holocephalans(Chondrichthyes: Chimaeriformes): a mitogenomic perspective. Mol. Biol. Evol. 27,2576–2586.
Katoh, K., Toh, H., 2008. Recent developments in the MAFFTmultiple sequence alignmentprogram. Brief. Bioinform. 9, 286–298.
Koken, E., 1888. Neue untersuchungen an Tertiären fischotolithen. Z. deut. Geol. Ges. 40,274–305.
Lagler, K.F., Bardach, J.E., Miller, R.R., 1977. Ichthyology, 2nd ed. JohnWiley and Sons, NewYork 506.
Liu, S.F., Chen, L.L., Dai, F.Q., Zhuang, Z.M., 2010. Application of DNA barcoding gene CO1for classifying family Sciaenidae. Oceanol. Limnol. Sin. 2, 10.
Lowe, T.M., Eddy, S.R., 1997. TRNAscan-SE: a program for improved detection of transferRNA genes in genome sequence. Nucleic Acids Res. 25, 955–964.
Ma, C.Y., Ma, L.B., Ni, Y., Shen, A.L., Zhang, Y., 2012. Molecular phylogenetic relationshipsof 13 Sciaenidae species in the China Sea based on RAG1 gene sequences. J. Fish.China 36, 9–16.
Maddison, W.P., Maddison, D.R., 2010. Mesquite: a Modular System for EvolutionaryAnalysis. Version 2.73 Arizona Board of Regents on Behalf of the University ofArizona, Tuscon, Arizona, U.S.A.
Malling, C., Grönwall, K.A., 1909. En fauna in Bornholm Lias. Medd. Dan. Geol. Foren. 15,271–316.
McAllister, D.E., 1986. Evolution of branchiostegals and classification of teleostome fishes.Nat. Mus. Can. Bull. 221–239.
Meng, Z.N., Zhuang, Z.P., Ding, S.X., Jin, X.S., Su, Y.Q., Tang, Q.S., 2004. Molecular phylogenyof eight Sciaenid species (Perciformes, Sciaenidae) in the China Sea based onmitochondrial 16S rRNA sequence. Prog. Nat. Sci. 14, 514–521.
Miya, M., Nishida, M., 1999. Organization of the mitochondrial genome of a deep-Sea fish,Gonostoma gracile (Teleostei: Stomiiformes): first example of transfer RNA generearrangements in bony fishes. Mar. Biol. 1, 416–426.
Miya, M., et al., 2003. Major patterns of higher teleostean phylogenies: a new perspectivebased on 100 complete mitochondrial DNA sequences. Mol. Phylogenet. Evol. 26,121–138.
Mohan, R.S.L., 1969. A synopsis of the Indian genera of the fishes of the family Sciaenidae.Indian J. Fish 16, 82–98.
Nakatani, M., Miya, M., Mabuchi, K., Saitoh, K., Nishida, M., 2011. Evolutionary history ofOtophysi (Teleostei), a major clade of the modern freshwater fishes: Pangaean originand Mesozoic radiation. BMC Evol. Biol. 11, 177.
Nikaido, M., Rooney, A.P., Okada, N., 1999. Phylogenetic relationships among cetartiodactylsbased on insertions of short and long interpersed elements: hippopotamuses are theclosest extant relatives of whales. Proc. Natl. Acad. Sci. 96, 10261–10266.
Nolf, D., 2003. Revision of the American otolith-based fish species described by Koken in1888. Louvain Geol. Surv. 12, 1–19.
Nolf, D., Stringer, G.L., 2003. Late Eocene (Priabonian) fish otoliths from the Yazoo Clay atCopenhagen, Louisiana. Louvain Geol. Surv. 13, 1–23.
Posada, D., 2008. JModelTest: phylogeneticmodel averaging. Mol. Biol. Evol. 25,1253–1256.
Sasaki, K., 1989. Phylogeny of the family Sciaenidae, with notes on its zoogeography(Teleostei: Perciformes). Mem. Fac. Fish. Hokkaido Univ. 36, 1–137.
Schmidt, H.A., Strimmer, K., Vingron,M., Haeseler, A.V., 2002. Tree-Puzzle: maximum like-lihood phylogenetic analysis using quartets and parallel computing. Bioinformatics 18,502–504.
Shimodaira, H., 2002. An approximately unbiased test of phylogenetic tree selection. Syst.Biol. 51, 492–508.
Shimodaira, H., Hasegawa,M., 2001. CONSEL: for assessing the confidence of phylogenetictree selection. Bioinformatics 17, 1246–1247.
Stamatakis, A., 2006. RAxML-VI-HPC: maximum likelihood-based phylogenetic analyseswith thousands of taxa and mixed models. Bioinformatics 22, 2688–2690.
Takeuchi, G.T., Huddleston, R.W., 2008. A new early miocene species of Pogonias (Teleostei:Sciaenidae) based on otoliths from California. Bull. South. Calif. Acad. Sci. 107, 68–80.
Tamura, K., Dudley, J., Nei, M., Kumar, S., 2007. MEGA4: Molecular Evolutionary GeneticsAnalysis (MEGA) software version 4.0. Mol. Biol. Evol. 24, 1596–1599.
Taniguchi, N., 1969a. Comparative osteology of the sciaenid fishes from Japan and itsadjacent waters—I Neurocranium. Jpn. J. Ichthyol. 16, 55–67.
Taniguchi, N., 1969b. Comparative osteology of the sciaenid fishes from Japan and itsadjacent waters—II. Vertebrae. Jpn. J. Ichthyol. 16, 153–156.
Taniguchi, N., 1970. Comparative osteology of the sciaenid fishes from Japan and itsadjacent waters—III. Premaxillary and dentary. Jpn. J. Ichthyol. 17, 135–140.
Tong, X., et al., 2007. Sequence analysis of mitochondrial 16S rRNA gene fragment inChups croaker (Nibea coibor). Mar. Fish. Res. 28, 85–91.
Trewavas, E., 1962. A basis for classifying the sciaenid fishes of tropical West Africa. Ann.Mag. Nat. Hist. 5, 167–176.
Trewavas, E., 1977. The sciaenid fishes (croakers or drums) of the Indo-West-Pacific.Trans. Zool. Soc. London 33, 253–541.
Wyman, S.K., Jansen, R.K., Boore, J.L., 2004. Automatic annotation of organellar genomeswith DOGMA. Bioinformatics 20, 3252–3255.
Yamanoue, Y., Miya, M., Inoue, J.G., 2006. The mitochondrial genome of spotted greenpufferfish Tetraodon nigroviridis (Teleostei: Tetraodontiformes) and divergence timeestimation among model organisms in fishes. Gen. Genet. Syst. 81, 29–39.
Yamanoue, Y., Miya, M., Doi, H., Mabuchi, K., Sakai, H., Nishida, M., 2011. Multipleinvasions into freshwater by Pufferfishes (Teleostei: Tetraodontidae): a mitogenomicperspective. PLoS ONE 6, e17410.
Yang, Z., 2007. PAML 4: phylogenetic analysis by maximum likelihood. Mol. Biol. Evol. 24,1586–1591.
Zhang, P., Wake, M.H., 2009. A mitogenomic perspective on the phylogeny and biogeogra-phy of living caecilians (Amphibia: Gymnophiona). Mol. Phylogenet. Evol. 53, 479–491.
Zhong, B., Yonezawa, T., Zhong, Y., Hasagwa, M., 2009. Episodic evolution and adaptationof chloroplast genomes in ancestral grasses. PLoS One 4, e5297.