mitochondrial localization of high mobility group a1 proteins
TRANSCRIPT
MITOCHONDRIAL LOCALIZATION OF HIGH MOBILITY GROUP A1 PROTEINS
By
GREGORY ALLAN DEMENT
A dissertation submitted in partial fulfillment of the requirements for the degree of
DOCTOR OF PHILOSOPHY
WASHINGTON STATE UNIVERSITY School of Molecular Biosciences
December 2005
© Copyright by Gregory Allan Dement, 2005
All Rights Reserved

To the Faculty of Washington State University: The members of the committee appointed to examine the dissertation of Gregory Allan Dement find it satisfactory and recommend that it be accepted. __________________________ Chair __________________________ __________________________ __________________________ __________________________ __________________________
ii

ACKNOWLEDGEMENT
I would like to thank Dr. Ray Reeves for his enthusiastic and encouraging
mentorship that has allowed me to become independent and successful in my scientific
research. Also, I thank my committee members for their advice and guidance.
To all the members of The Reeves Lab past and present, thanks for the
contributions you have made to my research. Particularly, I am grateful for the guidance
that Dr. Nathan Treff offered me during the early stages of my graduate work and am
thankful for his continued assistance in the advancement of my research and scientific
career. Also, I would like to thank Dr. Dale Edberg for his insight into experimental
approaches that have helped my research significantly. I would like to thank Dr. Jennifer
Adair for her motivational work ethic, scientific advice, and personal encouragement.
Finally, I thank Scott Maloney for his involvement in recent work that has yielded
promising results featured in this dissertation.
Outside of lab, I thank Rob Fisher for his friendship and scientific ideas that have
helped me get to this point in my career and life. Thanks to Sheri Mahan for helping me
through all the aspects of my graduate career. And, thanks to Linda Rico for her
encouragement and support during my dissertation preparation.
Finally, I thank my mother, father, and brother for there unconditional support
and God for giving me strength.
iii

MITOCHONDRIAL LOCALIZATION OF HIGH MOBILITY GROUP A1 PROTEINS
Abstract
By Gregory Allan Dement, Ph.D. Washington State University
December 2005
Chair: Raymond Reeves
High mobility group A1 (HMGA1) proteins classically act within the nucleus of
mammalian cells as architectural transcription factors that regulate the expression of
numerous genes. However, HMGA1 proteins were found in both the cytoplasm and
mitochondria of wild-type murine NIH3T3 cells and transgenic human MCF-7 breast
cancer epithelial cells expressing a hemaglutinnin tagged-HMGA1a fusion protein.
Initial synchronization studies revealed a dynamic, cell cycle-dependent translocation of
HMGA1 proteins from the nucleus into the cytoplasm and mitochondria of NIH3T3 cells.
Furthermore, preliminary functionality studies utilizing a modified “chromatin”
immunoprecipitation protocol revealed that HMGA1 retains its DNA binding capabilities
within the mitochondria and associates with the regulatory D-loop region in vivo. As an
effect of HMGA1 over-expression mitochondrial DNA (mtDNA) levels in transgenic
MCF-7 cells were reduced by approximately 2-fold relative to wild-type while the
mitochondrial NADH Dehydrogenase 2 gene transcript was up-regulated approximately
4-fold . Corresponding to reduced mtDNA levels, flow cytometric analysis revealed that
overall mitochondrial mass was reduced in these cells as well. In order to determine the
effects of these alterations to mtDNA replication studies, cell survival studies were
iv

performed and showed an increased sensitivity of the HMGA1 over-expressing cells to
treatment with the inhibitor of glycolysis, 2-deoxy-D-glucose, indicating an overall
deficiency in cellular oxidative phosphorylation. These findings may implicate HMGA1
proteins in the mechanism by which tumor cells display a Warburg glycolytic phenotype.
HMGA1 in the mitochondria may also negatively affect the ability of the organelle to
repair reactive oxygen species induced DNA damage contributing to overall tumor
progression. Together, these observations reveal the novel mitochondrial localization of
the HMGA1 proteins and present several possible mechanisms by which the translocated
form of the protein may participate in mitochondria associated processes related to
normal and abnormal cell function.
v
TABLE OF CONTENTS
Page
ACKNOWLEDGMENT....................................................................................................iii
ABSTRACT.......................................................................................................................iv
LIST OF TABLES...........................................................................................................viii
LIST OF FIGURES............................................................................................................ix
CHAPTER
1. INTRODUCTION..............................................................................................1
Overview.............................................................................................................3
HMGA1: Structure and Molecular Function......................................................5
HMGA1: Nuclear Localization and Function...................................................10
HMGA1: Biological Functions and Cancer Progression..................................13
Mitochondria: General Function and Role in Cancer Biology.........................16
Figures...............................................................................................................20
References.........................................................................................................30
2. DYNAMIC MITOCHONDRIAL LOCALIZATION OF NUCLEAR TRANSCRIPTION FACTOR HMGA1...........................................................36
Abstract.............................................................................................................37 Introduction.......................................................................................................38 Materials and Methods......................................................................................41 Results...............................................................................................................48 Discussion.........................................................................................................56 Acknowledgements...........................................................................................60
vi
Figures...............................................................................................................62 References.........................................................................................................84
3. HMGA1 PROTEINS ACT AS TRANSCRIPTIONAL REGULATORS WITHIN THE MITOCHONDRIA AND ALTER OVERALL ORGANELLE RELATED CELLULAR FUNCTION....................................89
Abstract.............................................................................................................90 Introduction.......................................................................................................92 Materials and Methods......................................................................................97 Results.............................................................................................................102 Discussion.......................................................................................................106 Tables and Figures..........................................................................................111 References.......................................................................................................123 4. CONCLUSION AND FUTURE WORK: HMGA1 Proteins and Mitochondrial Biology: New Directions for Cancer Research................................................126 Mechanisms of HMGA1 Translocation..........................................................128 Transcriptional Activity of HMGA1 in Mitochondria....................................134 HMGA1 Mediated Alterations to Mitochondrial Function............................138 HMGA1 Mediated Inhibition of Mitochondrial DNA Repair........................142 Closing Remarks.............................................................................................144 References.......................................................................................................146
vii

LIST OF TABLES
1. Relative Quantitation of Mitochondrial DNA Levels.................................................111 2. Relative Quantitation of Mitochondrial NADH Dehydrogenase Subunit 2 Gene Transcript Levels........................................................................................................114
viii

LIST OF FIGURES
1. Illustration of HMGA1 Proteins as Integrating ‘Hubs’ of Nuclear Function.............21 2. HMGA1 Mediated IL-2Rα Gene Promoter Activation..............................................23 3. Structure of the AT-Hook DNA Binding Motif of HMGA1 Proteins........................25 4. Detailed Map of the Mitochondrial Genome..............................................................27 5. Schematic of Mitochondrial Genome Replication Initiation......................................29 6. Immunolocalization of HMGA1 Proteins in Non-Synchronized NIH3T3.................63 7. Immunolocalization of HMGA1 Proteins in Synchronized NIH3T3 Cells ...............65 8. Co-localization of HMGA1 with Mitochondria in NIH3T3 Cells..............................67 9. Control Experiments for Electron Microscopic Immunogold Localization Studies of HMGA1 Proteins in Synchronized NIH3T3 Cells.....................................................69 10. General Pattern of Anti-HMGA1 Immunogold Labeling of NIH3T3 Cells...............71 11. High Magnification Photographs of Mitochondrial HMGA1 Immunogold Labeling in NIH3T3 Cells..........................................................................................................73 12. Immunolocalization of HMGA1 Proteins in Non-Synchronized MCF-7 Cells.........75 13. Western Blot Analysis of HA7C Subcellular Fractions.............................................77 14. Chromatin Immunoprecipitation (ChIP) Showing Association of HMGA1 with the D-loop Control Region of the Mitochondrial Genome...............................................79 15. Mitochondrial Immunogold Particles versus Total Cell Particles..............................81
16. Anti-caspase 3 Western Blot Analysis of Hs578T Subcellular Fractions..................83
17. Amplification Plots Quantitating mtDNA Levels in MCF-7 Cells..........................113
18. Amplification Plots Quantitating ND2 Transcript Levels in MCF-7 Cells..............116
19. FACS Analysis Demonstrating Reduced Mitochondrial Mass in HA7C Cells........118
ix

20. 2-Deoxyglucose Sensitivity Differential Between HA7C and MCF-7 Cells...........120
21. Reduced Ability of HA7C Cells to Repair Mitochondrial DNA Damage................122
x
CHAPTER 1
INTRODUCTION
Mitochondrial Localization of High Mobility Group A1 Proteins

Contained in this dissertation is a presentation of findings describing a novel
subcellular localization pattern and subsequent mitochondrial function for the high
mobility group A1 (HMGA1) family of non-histone chromatin proteins. In Chapters 2
and 3, following a general overview in Chapter 1 of the HMGA1 proteins and their role
in a variety of biological processes, are detailed descriptions of the molecular biological
and biochemical assays utilized and the data they generated. Briefly, indirect
immunofluorescence, electron microscopic immunolocalization, and Western Blot
studies were performed with a polyclonal antibody probe to endogenous HMGA1
proteins in cell cycle stage synchronized and non-synchronized NIH3T3 murine
fibroblast cells. In order to confirm the data obtained from these studies, MCF-7 breast
cancer epithelial cells, with and without a hemaglutinnin (HA) tagged HMGA1
transgene, were subjected to similar assays utilizing both a polyclonal antibody to
HMGA1 and a monoclonal antibody to the HA tag. Furthermore, a non-probe approach
involving transfection of an HMGA1-Green Fluorescent Protein (GFP) fusion construct
into NIH3T3 cells was used as an independent method for determining protein
localization in live cells.
With confirmed mitochondrial localization of HMGA1, functional studies were
initiated to determine the biological role of the proteins in the context of mitochondrial
compartmentalization. Modified “chromatin” immunoprecipitation was utilized to
determine the ability of HMGA1 to associate with mitochondrial DNA and potentially
maintain its function as a transcription factor. Real-time PCR was subsequently
performed to determine the effect of HMGA1 over-expression on both transcription and
replication of the mitochondrial genome. Broader mitochondrial functionality studies
2
included determining the effect of altered HMGA1 levels on mitochondrial mass and the
ability of cells as a whole to survive following treatment with the inhibitor of glycolysis,
2-deoxyglucose. Finally, because concurrent studies in the lab showed that HMGA1
proteins are involved in the inhibition of the DNA nucleotide excision repair (NER)
pathway within the nucleus, gene-specific DNA repair studies within the mitochondria
were also completed by a unique quantitative PCR method.
The remainder of this first chapter provides an overview of the HMGA1 proteins
and their unique features which allow them to function dynamically in a variety of
normal and disease related biological processes.
Overview
Amongst a plethora of specific protein factors acting within the nucleus and
cytoplasm of mammalian cells, HMGA1 proteins have, in recent years, emerged as more
flexible players in a variety of normal and abnormal cellular processes. Unique features
of these small proteins make them capable of diversity in action that is similar to that of
more familiar factors such as p53 and c-Myc, which are known to participate, under tight
regulation, in a wide variety of biological events. Because of their unusual characteristics
and dynamic biological activity, the HMGA1 proteins have become the focus of intense
research. Their potential as a diagnostic marker or even therapeutic target for the
detection or treatment, respectively, of multiple cancer types has provided much of the
motivation for the increased interest. The genesis of such interest came with studies that
revealed the over-expression of the HMGA1 proteins in cancerous or immortalized cell
3
lines, namely, HeLa (Lund et al., 1983) and African green monkey cells (Varshavsky et
al., 1983), which is in contrast to their very low level of expression in normal tissue.
Since the discovery of the HMGA1 proteins and their hallmark distinguishing
characteristics in the 1980’s, basic research coming out of cancer biology and chromatin
laboratories has produced a better understanding of their structural characteristics and
overall role in normal biological processes including embryonic development and the
immune response. It was discovered that the HMGA1 proteins displayed high levels of
phosphorylations (Ostvald et al., 1985), were able to bind and alter DNA structure at
adenine and thymine (AT)-rich sequences without the need for ATP hydrolysis (Lehn et
al., 1988; Solomon et al., 1986), and lacked secondary structure while free in solution
(Evans et al., 1992; Evans et al., 1995; Huth et al., 1997, Lehn et al., 1988). Furthermore,
the proteins were set apart by their small size (10.6-12 kDA), elevated level of basic,
acidic, and proline amino acid residues, acid (5%) solubility, and rapid mobility during
electrophoretic separations (Lund et al., 1983; reviewed in Reeves, 2001). These unique
characteristics distinguish the HMGA1 proteins from most other nuclear and cytoplasmic
proteins, including other members of the HMG protein families, which are abundantly
expressed in normal tissue (Johns, 1982).
As a point of distinction, the HMG proteins as a group are composed of three
different families named HMGA, HMGB, and HMGN (Bustin, 2001), the first of which
contains the HMGA1 isoforms, HMGA1a (107 amino acids (aa); approx. 11.7 kDa) and
HMGA1b (96 aa; approx. 10.6 kDa) (Johnson et al., 1989; Friedmann et al., 1993), that
are the focus of the research presented here. An additional isoform of the HMGA1 gene
family not covered here is named HMGA1c (179 aa; approx. 19.7 kDa). The varying
4

isoforms are a product of alternative mRNA splicing, resulting in a deletion of 11 amino
acids in the HMGA1b isoform when compared to HMGA1a (Johnson et al., 1989;
Reeves and Nissen, 1995). To date, significant differences regarding actual biological
function between these two isoforms have not been definitively identified and thus they
will be referred to in the remainder of this document collectively as HMGA1, which for
the purposes here, excludes the HMGA1c form. As a general statement, HMGA1 has
proven to be a critical protein player in multiple molecular/cellular processes, responding
to many stimuli and participation in a variety of downstream functions. Such functions
include: positive and negative gene regulation; modulation of macromolecular and
chromatin structure; cell growth, differentiation, and embryonic development;
carcinogenesis and others, as reviewed in Reeves, 2001, where the proteins are
appropriately referred to as “hubs of nuclear function” (Fig.1.1.). However, as will be
presented in the remainder of this dissertation, the function of the HMGA1 proteins is
even more dynamic than originally thought, and in fact, is not restricted to nuclear
function alone. A detailed description of the structure, molecular modes of action and
overall cellular functions of the HMGA1 proteins follows in the remainder of this
introductory chapter.
HMGA1: Structure and Molecular Function
HMGA1 proteins are original members of a relatively new class of gene
regulatory proteins called architectural transcription factors (Grosschedl et al., 1994) for
their ability to recognize structural rather than sequence specific benchmarks of B-form
DNA and alter that structure in a variety of ways upon binding (Reeves and Nissen,
5

1990). This feature allows the proteins to associate with many different distorted or
unusual DNA structures. For example, HMGA1 is capable of binding to restricted
regions of DNA on the surface of nucleosome core particles and inducing localized
changes in the rotational setting of the nucleosomal DNA (Reeves and Wolffe, 1996). It
has been proposed that HMGA1 proteins are indeed intimately involved in the process of
chromatin remodeling via their unique ability to bind to different regions of nucleosomes
and induce these conformational changes in the DNA (Reeves et al., 2000; Reeves and
Wolffe, 1996; Reeves and Nissen, 1993). The changes are thought to allow transcription
factors access to enhancer and promoter elements by relaxing what would normally be
restrictive DNA/core particle interactions. Such a mode of action provides a partial
explanation of how HMGA1 is capable of gene expression activation.
The chromatin relaxation model of activation extends to the independent process
of actual transcriptional initiation during which HMGA1 mediates the formation of
enhanceosome structures over the promoters of inducible genes (Fig.1.2) (reviewed in
Reeves and Beckerbauer, 2001). While the possibility of their role in initial chromatin
remodeling of inhibitory positioned nucleosomes is intriguing and under investigation,
the HMGA1 proteins have been definitively shown to interact directly with both enhancer
and promoter elements of inducible genes such as IFN-β (Falvo, et al., 1995) and IL-2Rα
(John et al., 1995; John et al., 1996) to assist in transcriptional initiation. Additionally,
HMGA1 acts like a ‘molecular glue’ during this process by association with other protein
factors necessary for the completion of the enhanceosome structure and the recruitment
of basal transcriptional machinery. As a general rule, HMGA1 proteins function in most
scenarios by binding to AT-rich DNA, introducing structural changes in the substrate,
6

and mediating protein-protein interactions. These events are made possible through the
action of what is referred to as AT-hook DNA binding motifs.
All members of the HMGA family of proteins are unified by the presence of AT-
hooks that preferentially bind to stretches of DNA within the narrow minor groove. Each
protein has a set of three functional motifs that have an invariant peptide core
palindromic sequence Pro-Arg-Gly-Arg-Pro (i.e. P-R-G-R-P) flanked by conserved
positively charged residues (Reeves and Nissen, 1990). While free in solution, these
DNA binding regions, along with the rest of the protein, as mentioned previously, lack
detectable secondary structure as determined by either NMR or CD analyses (Evans et
al., 1995; Huth et al., 1997; Lehn et al., 1988). Intriguingly however, upon binding
within the minor groove of B-form DNA, the motif takes on a planar, crescent-shaped
configuration (see Fig 1.3 for details) due to flexibility restrictions resulting from the
trans positioned proline residues on either side of the central glycine (Evans et al., 1995).
The conformational change from non-structured to structured allows for optimal contacts
between the peptide motif and AT-rich minor groove and is a major factor contributing to
flexible substrate recognition (Huth et al., 1997). Disordered-to-ordered conformational
changes in the AT-hook peptide motifs during substrate binding are accompanied by
structural changes in the substrate as well (Lehn et al., 1988). Such changes are a
primary mechanism by which HMGA1 proteins affect gene activation.
While full-length HMGA1 proteins can bend, straighten, unwind and induce loop
formation in linear DNA substrates in vitro (Chase et al., 1999; Reeves and Wolffe, 1996;
Slama-Schwok et al., 2000), it is interesting to note that studies show a lack of similar
conformational changes when a single AT-hook motif is bound to the same substrate
7

(Huth et al., 1997). Further investigation into this occurrence revealed that multiple AT-
hooks must bind to multiple AT-stretches of a given DNA substrate in order to induce
significant conformational changes (Li et al., 2000). While the exact mechanism by
which the proteins are able to recognize and alter specific substrates is unknown, it is
likely that the spacing of the AT-hook motifs on a single HMGA1 protein is important.
Essentially, the number and spacing of the motifs serves as a “bar code reader” to identify
binding targets, and yet allow for association with many different types of platforms due
to the relatively non-sequence specific binding requirement (Radic et al., 1992; Reeves et
al., 1987; Reeves and Nissen, 1990). Thus, when considering the potential specific sites
or, more broadly, genes that HMGA1 proteins will associate with, the spacing and
number of AT-rich segments within a promoter or enhancer element are important.
However, computer based algorithms to predict potential binding sites based on this
criterion have proven difficult to develop, a likely result of the existence of many
variables involved in the dynamic ability of HMGA1 to flexibly interact with both
proteins and DNA. Demonstrating this point, the proposed mechanisms for HMGA1
interaction with, and conformational alteration of, a given DNA substrate include: (i)
neutralization of negative charges on the DNA backbone; (ii) the binding of each of three
AT-hooks from an individual HMGA1 protein to distant regions of a DNA molecule; (iii)
the cooperative binding of multiple HMGA1 molecules to localized regions of the DNA;
and (iv) the non-covalent cross-linking of different DNA molecules by a single HMGA1
protein (reviewed in Reeves, 2001). Additionally, HMGA1 proteins are capable of
simultaneously interacting with protein partners and altering their conformation/function
to assist in the DNA interactions/alterations required for enhanceosome formation and
8

gene activation. In contrast to such gene activation events, HMGA1 is also involved in
gene repressor complex formation by similar molecular interactions. Regardless of the
complexities surrounding the binding characteristics and substrate specificities of
HMGA1 proteins, their general requirement for AT-rich DNA sequences, coupled with
their ability to interact with a variety of protein partners, allows for promiscuous
interaction with many different substrate types. It is this flexibility that is a major
contributor in the ability of HMGA1 proteins to act in a variety of cellular processes
involving DNA interactions, the list of which is growing rapidly and is restricted only to
DNA elements containing AT-rich regions separated by a varying number (n = 0-5) of
nucleotides (Radic et al., 1992; Reeves et al., 1987; Reeves and Nissen, 1990).
Importantly, the activities of the proteins have been shown to be specifically regulated by
various intra- and extracellular stimuli that ultimately lead to differential post-
translational modifications and subsequent alterations in molecular function.
It is now known that HMGA1 function is regulated by a variety of in vivo post-
translational modifications including phosphorylation, acetylation, and methylation,
among others (Banks et al., 2000; Edberg et al., 2004; Reeves and Beckerbauer, 2001).
These differential modifications are a result of both cell-cycle dependent and various
environmental stimuli that serve to trigger specific signaling pathways. Downstream
effects of the secondary biochemical modifications include changes in the ability of the
HMGA1 protein to interact with a variety of protein and DNA substrates. As covered
latter in the introduction of Chapter 2, HMGA1 modification mediated by specific factors
results in specific changes to HMGA1 function and plays a significant role in subnuclear
and possibly subcellular protein localization patterns. Currently, there is ample evidence
9

supporting dynamic, post-translational modification regulated, subnuclear localization
patterns for the HMGA1 proteins. Such controlled changes in nuclear localization
provide a basis for understanding the novel subcellular localization patterns of the
HMGA1 proteins presented in this dissertation.
HMGA1: Nuclear Localization and Function
To date, localization studies, in conjunction with molecular biological and
biochemical data, have supported an exclusive nuclear role for the HMGA1 proteins.
Within the nucleus, it has become evident that the proteins are quite mobile and can be
regulated in a variety of ways to function within distinct subnuclear regions that
correspond to specific cellular functions. In fact, localization studies have been
instrumental in revealing novel functions for the HMGA1 proteins as well as confirming
their previously characterized roles.
Shortly following their discovery in HeLa cells, the HMGA1 proteins were
actually designated as alpha proteins because of their ability to bind in vitro to AT-rich
alpha-satellite DNA from chromatin preparations made from green monkey kidney cells
(Varshavsky et al., 1983; Strauss and Varshavsky, 1984). Subsequently, another early
localization study, utilizing immunofluorescence, confirmed the role of the proteins in
chromatin structure by showing their specific association with G/Q- and C- bands of
mammalian metaphase chromosomes (Disney et al., 1989). Specific association of
HMGA1 with defined regions of metaphase chromosomes, as observed, suggested that
the proteins were in some way involved with the changes in chromatin structure that
occur during the chromosome condensation cycle and cell division (Disney et al., 1989;
10

Reeves, 1992). Support for this suggestion came from co-localization results that
demonstrated the presence of HMGA1, along with both histone H1 and topoisomerase II,
at scaffold/matrix attachment regions (SARs/MARs) (Saitoh and Laemmli, 1994). These
AT-rich sequences are components of metaphase chromosome structure and are thought
to be involved in the regulation of chromosome dynamics and gene expression due to
their location at the base of loops of gene-containing DNA. In fact, HMGA1 proteins
were shown to antagonize histone H1 binding, thus inhibiting the general H1-mediated
repression of gene accession and making transcriptional initiation possible (Käs et al.,
1993). This localization characteristic confirms a model proposed for the mechanism of
HMGA1 gene activation that involves a global alteration to large regions of chromatin
structure. That is, the proteins act as “anti-repressors” by competitive SAR binding and
displacement of inhibitory proteins such as histone H1 (Zhao et al., 1993).
More recent immunocytochemical studies, based on the hypothesis that the
specific interaction of HMGA1 with AT-rich DNA might result in chromatin context
specific functions, have revealed sub-populations of HMGA1 proteins within the nucleus
(Amirand et al., 1998). Focusing on subnuclear localization patterns, the authors
identified three areas of HMGA1 staining that corresponded to heterochromatin,
decondensed chromatin, and the general nucleoplasm. These findings were consistent
with data showing that HMGA1 is involved in the binding of AT-rich satellite repeats
clustered at centromeres and telomeres, and of randomly dispersed satellite DNA
sequences, SARs (Zhao et al., 1993), and gene regulatory elements (Falvo, et al., 1995;
John et al., 1995; John et al., 1996). Similar double immunolabeling results showed co-
localization of HMGA1 with key nuclear components such as NuMA, SC-35, and
11
TAFII70, proteins known to play a role in transcription related events (Tabellini et al.
2001). In general, these localization based studies confirm the role of the HMGA1
proteins as dynamic regulators of gene transcription at the level of large chromatin
reorganization and more restricted localized effects at the nucleosomal level as covered in
the previous section.
An even more recent study regarding HMGA1 localization within the nucleus was
focused on chromatin on/off rates and the effect of post-translational modifications on
their mobility and function. Briefly, it was determined, using HMGA1-GFP fusion
proteins and fluorescence recovery after photobleaching (FRAP) assays, that HMGA1 is
a highly mobile component of euchromatin, heterochromatin, and mitotic chromosomes.
Furthermore, it was shown that the kinetic properties of HMGA1a proteins are controlled
by the number of functional AT-hooks present and are regulated by differential patterns
of phosphorylation. That is, increasing phosphorylation levels were correlated to
increased residence times on heterochromatin and chromosomes, as compared to
euchromatic regions (Harrer et al., 2004). Overall, this study supports previous work
suggesting that the HMGA1 proteins are indeed major players in both local and global
changes in chromatin structure. It is important to restate that these structural changes
mediated by HMGA1 are carefully regulated events that serve to specifically up or down
regulate the expression of genes that code for proteins involved in a variety of biological
processes including abnormal cellular events such as transformation and cancerous
progression. Also, while these functions have been well described in the context of the
nucleus and chromatin structure, the binding requirements of HMGA1 proteins are such
that any gene element with enrichment in AT content is a potential target for regulation.
12
As will be described in Chapters 2 and 3, the genomes of mammalian mitochondria are
quite high in AT content and thus possess high potential for binding and transcriptional
regulation by HMGA1 proteins.
HMGA1: Biological Functions and Cancer Progression
HMGA1 proteins are involved in the normal biological processes of embryonic
development as evidenced by their maximal expression during this period (Chiappetta et
al., 1996). Considerable data supports the original idea that the proteins are involved in
the control of cell growth and differentiation in the embryo (Bustin and Reeves, 1996).
That is, premature gene transcription was shown to be inducible in early mouse embryos
by the microinjection of HMGA1 alone (Beaujean et al, 2000). Also, HMGA1 has been
implicated in controlling the growth and differentiation of adipocytes (Melillo et al.,
2001). Furthermore, HMGA1 expression levels are rapidly induced upon the treatment
of resting normal cells with factors that activate metabolism and growth, indicating that
the proteins play a role in normal cell proliferation (Friedmann et al., 1993; Johnson et
al., 1990; Ogram and Reeves, 1995; Holth et al., 1997). Inducible transcription of
multiple immune related genes has also been demonstrated, revealing the role of HMGA1
in cytokine stimulated immune cell activation (reviewed in Reeves and Beckerbauer,
2001).
Beyond these normal cellular functions, much work regarding the HMGA1
proteins has been in the context of transformed cells and the overall process of
carcinogenesis and metastatic potential. Again, HMGA1 expression levels in normal,
non-proliferating, somatic cells are low to undetectable (Lundberg et al., 1989; Bustin
13
and Reeves, 1996). This is in contrast to the over-expression of the proteins in
neoplastically transformed cells where increased HMGA1 levels are correlated with
increased degrees of malignancy and metastatic potential (reviewed in Tallini and Dal
Cin, 1999). It is important to emphasize that in normal cells high levels of HMGA1 are
quite toxic and effectively induce apoptosis due to a deregulation in cell cycle
progression from the S to the G2/M phase. Several unique post-translational
modifications are observed during the apoptotic process, emphasizing the importance of
these regulatory adducts to the function of HMGA1 proteins (Diana et al., 2001).
Ultimately, cells that survive this process of apoptosis induction are altered in a way that
allows for their aberrant growth and overall cancer phenotype. The phenomenon of
HMGA1 protein over-expression has been demonstrated in a wide variety of clinical
cancer types including those of the breast, prostate, colon, cervix, lung and neural tissues
(reviewed in Reeves and Beckerbauer, 2001). Because of this, as mentioned briefly
above, the HMGA1 proteins have been regarded as potential markers of neoplastic
transformation and increasing metastatic potential, and as a therapeutic target for cancer
treatment. Consideration of the therapeutic potential of HMGA1 inhibition in these
various cancer types brings up the question of causation in regard to the actual role of the
proteins in the process of cancer progression.
Evidence suggests that over-expression of the HMGA1 proteins in cells is indeed
a causative, rather than effectual, factor in the process of carcinogenesis and progression
to a more metastatic phenotype. Such evidence comes from studies utilizing a tissue
culture model and artificial over-expression of the proteins in different immortalized cell
types. It was shown that when HMGA1 proteins were introduced, the cells became
14
capable of anchorage-independent growth in vitro and were able to form highly
malignant and metastatic tumors when injected into nude mice (Wood et al., 2000;
Reeves et al., 2001). From a biochemical standpoint, significant progress in
understanding the mechanism by which HMGA1 proteins promote tumorigenesis came
with an experimental model utilizing transgenic mammalian epithelial cells expressing
full length protein under the control of a tetracycline-responsive promoter (Reeves et al.,
2001). With this transgenic model, HMGA1 protein expression could be induced by the
removal of tetracycline from the growth media and effectively turned off in the presence
of the drug. Results from these studies showed that the epithelial cells only had the
capacity to form metastatic tumors in nude mice when the transgene was on and HMGA1
was being over-expressed. Furthermore, studies in transgenic mice in which HMGA1
over-expression is targeted to lymphoid cells directly demonstrate that HMGA1 is an
oncogene that in vivo can induce highly penetrant, aggressive leukemias and other
lymphoid malignancies (Xu et al., 2004).
In order to look more closely at the actual mechanism of carcinogenesis mediated
by the over-expression of HMGA1 in the mammary epithelial cell model, researchers
employed gene expression profiling. Findings showed that over-expression of the
HMGA1 proteins resulted in the induced expression of distinctive host cell genes known
to take part in tumor initiation, apoptosis, DNA repair, tissue invasion, migration, and
colonization (Reeves et al., 2001). As covered in detail above, the role of the HMGA1
proteins as regulators of transcription are consistent with the observed alterations in gene
expression profiles as a result of their abnormally high expression. In fact, subsequent
studies to verify the effect of HMGA1 on specific genes have supported the hypothesis
15

that the proteins promote progression of cells to a more metastatic state by up-regulating
the expression of tumor promoting genes and down-regulating the expression of genes
the prevent tumor progression (reviewed in Reeves,2001). For example, recent studies,
covered in greater detail in Appendix 1, have shown that HMGA1 is directly involved in
the up-regulation of Kit ligand expression, a protein factor involved in activation of the
cancer progression associated Ras/Erk signaling pathway (Treff et al., 2004). Important
studies, presented in Appendix 2, have also revealed that HMGA1 over-expression
significantly inhibits the ability of the cell to efficiently accomplish nucleotide excision
repair (NER) via down-regulation of repair factors, an observation which could be an
indicator of a major mechanism by which HMGA1 promotes cancerous progression
(Adair et al., 2005). As will be presented in Chapters 2 and 3 of this dissertation, another
potential mechanism by which HMGA1 proteins promote tumorigenesis may involve
their newly discovered mitochondrial localization. A review of mitochondrial biology
and the role of these organelles in cancer etiology reveal multiple potential mechanisms
by which HMGA1 may be affecting their function and subsequent alterations to overall
cellular homeostasis.
Mitochondria: General Function and Role in Cancer Biology
Functioning in a semi-autonomous manner, mammalian mitochondria replicate,
transcribe, and translate their own 16,569 base pair genome (Fig 1.4). The supercoiled,
double-stranded circular mitochondrial (mt)DNA contains 37 genes coding for 13
polypeptides essential for oxidative phosphorylation, 22 tRNAs and 2 rRNAs required for
translation (Anderson et al., 1981; Taanman, 1999). Completion of oxidative
16
phosphorylation requires protein products of all 13 mitochondrial genes and 74 nuclear
genes which, together, form 5 multi-subunit enzymatic complexes of the electron
transport chain (reviewed in Penta et al., 2001). Taking place within the inner
mitochondrial membrane, this system is responsible for 90% of cellular adenosine
triphosphate (ATP) production, the by product of which is high levels of potentially
harmful reactive oxygen species (ROS) within the cell. Due to the proximity of mtDNA
to such concentrated levels of ROS, the genome is vulnerable to the accumulation of
mutations at a much higher rate than the nuclear genome. Because the mitochondrial
genome lacks introns, increased rates of mutations within the organelle translate into
coding sequence errors and subsequent abnormalities in protein production. Strong
correlations, in fact, exist between the occurrence of mtDNA mutations and multiple
cellular disorders, including cancer. Within the context of cancer, altered mitochondrial
morphology as well as changes in mitochondrial enzyme patterns and membrane
transport systems has been observed (Zafar et al., 1982).
The role of mitochondria in carcinogenesis was first considered following
observation, in 1956, that rodent tumors exhibited reduced respiration-coupled oxidative
metabolism and increased glycolysis (Warburg et al., 1956). To date, these observations
have not been explained but new studies suggest that changes to mitochondrial gene
expression profiles observed in cancer cells may be involved in this Warburg phenotype.
That is, deficiencies in the ability of a cell to perform oxidative phosphorylation,
resulting in a switch to a glycolytic phenotype, may be a result of abnormalities at the
mitochondrial genome level. Studies have demonstrated the occurrence of specific
alterations to both overall cellular levels of mtDNA and mitochondrial gene expression
17

levels. In general, tumor cells have increased levels of mtDNA transcripts and either
increases or decreases in levels of cellular mtDNA (Glaichenhaus et al., 1986; Pedersen,
1978; Yamamoto et al, 1989). Because HMGA1 is an oncogenic transcription factor and
localizes to the matrix of the mitochondria (Chapter 2), an overview of mtDNA
transcription/replication is relevant to data presented and hypotheses tested in the
following chapters of this dissertation.
Expression and replication of mtDNA in humans have been studied in some detail
and important factors involved in the processes have been characterized. However, the
manner in which these processes are regulated remains incomplete. Briefly, mtDNA
contains an untranslated regulatory region referred to as the D-loop where both
transcription and replication are initiated and controlled. Within this region are the origin
of heavy-strand (H-strand) replication (OH) and the transcription promoters for the light
(LSP) and heavy (HSP) mtDNA strands (Shadel and Clayton, 1997). A separate distinct
origin of replication (OL) for the light strand (L-strand) exists within a cluster of five
tRNA genes two-thirds of the way around the circular genome. Replication of the
genome begins with the initiation of H-strand synthesis on the D-loop template sequence.
This is followed by initiation of L-strand synthesis which occurs only after H-strand
synthesis is two-thirds complete (Fig 1.5). Transcription from both D-loop positioned
promoters results in the production of polycistronic messages that are subsequently
processed to yield mature DNA for translation. Also requiring RNA processing is the
actual priming of replication that occurs via the formation of an LSP initiated transcript
that creates an RNA-DNA hybrid at OH, allowing for the docking of the mitochondrial
DNA polymerase (pol γ) and DNA synthesis (Chang and Clayton, 1985; Lee and
18

Clayton, 1998). Therefore, protein factors involved in transcriptional initiation are also
important in mtDNA replication.
Currently, only three mammalian proteins are characterized as being directly
involved in mitochondrial transcription. They are the human mitochondrial RNA
polymerase (Tiranti et al., 1997), the high-mobility-group box protein, mtTFA (Fisher
and Clayton, 1988; Parisi and Clayton, 1991), and the transcription factor mtTFB
(McCulloch et al., 2002). The nucleus-encoded DNA binding protein, mtTFA, is an
approximately 25 kDa transcription factor with the ability to interact with DNA in a
manner that is similar to that of HMGA1. That is, mtTFA activates transcription by
binding upstream of promoter start sites and displays inherent flexibility in DNA
sequence specificity. Upon binding, the protein is capable of condensing, unwinding, and
bending DNA at specific sequences of both HSP and LSP (Fisher et al., 1992). Such
observations are intriguing when considering the similar function of the HMGA1 proteins
as described within the nucleus and may indicate that mitochondrial HMGA1 functions in
a similar manner and at similar sequences. This is due in part to the observation that the
AT-hook motif of HMGA1 proteins is known to bind with a higher affinity to DNA
regions also recognized by HMG box proteins (Hill et al., 1999; Hill and Reeves, 1997).
As will be described in greater detail in Chapter 2, the mitochondrial genome is also quite
AT-rich (Bibb et al., 1981) and contains many potential HMGA1 binding sites. The
functional ramifications of HMGA1 localization to mitochondria in regard to observed
D-loop DNA binding (Chapter 2) are studied and discussed in Chapter 3.
19

Figures
Figure 1.1. Diagram illustrating the highly connected nature of the HMGA1 proteins as
integrating ‘hubs’ of various biological activities. The upper portion of the diagram
shows various extra- and intracellular signaling pathways that are known to either
regulate transcription of the HMGA1 genes, control production of HMGA1 proteins
and/or modulate secondary biochemical modifications of pre-existing HMGA1 protein.
The lower portion of the diagram lists various normal and pathological biological
processes in which participation of the HMGA1 proteins has been proposed (Reeves,
2001).
20

Figure 1.1.
21

Figure 1.2. Proposed model for participation of HMGA1 (a.k.a. HMGI/Y) proteins in
two steps of transcriptional activation of the human IL-2Rα gene promoter: chromatin
remodeling and enhanceosome formation (Reeves and Beckerbauer, 2001).
22

Figure 1.2.
23

Figure 1.3. Structure of the second and third DNA-binding domains of the HMGA1a
protein in complex with a synthetic duplex oligonucleotide substrate (Huth et al., 1997.
(A) Representation of an unstructured AT-hook peptide that is free in solution. (B-E)
Various views of the second AT-hook peptide bound to the minor groove of a synthetic
duplex with a central sequence of 5’-AAATTT-3’. (B) The best-fit structure of the
peptide backbone of the second AT hook as it looks when bound to B-form DNA. (C,D)
Co-complex of the second AT-hook with B-form DNA showing the final set of 35 NMR
simulated annealing structures for the peptide backbone (frayed `rope' structure)
superimposed on the DNA (ribbon structure). (C) Side view looking into the DNA minor
groove. (D) Polar view looking down the long axis of the DNA. (E) Polar view of
complex showing the side chains of the arginine residues of the AT hook motif projecting
into the minor groove and making hydrophobic contacts with adenine bases. (F) Side
view of a ball-and-stick model of the third AT hook peptide bound to the minor groove
(Reeves and Becerbauer, 2001).
24
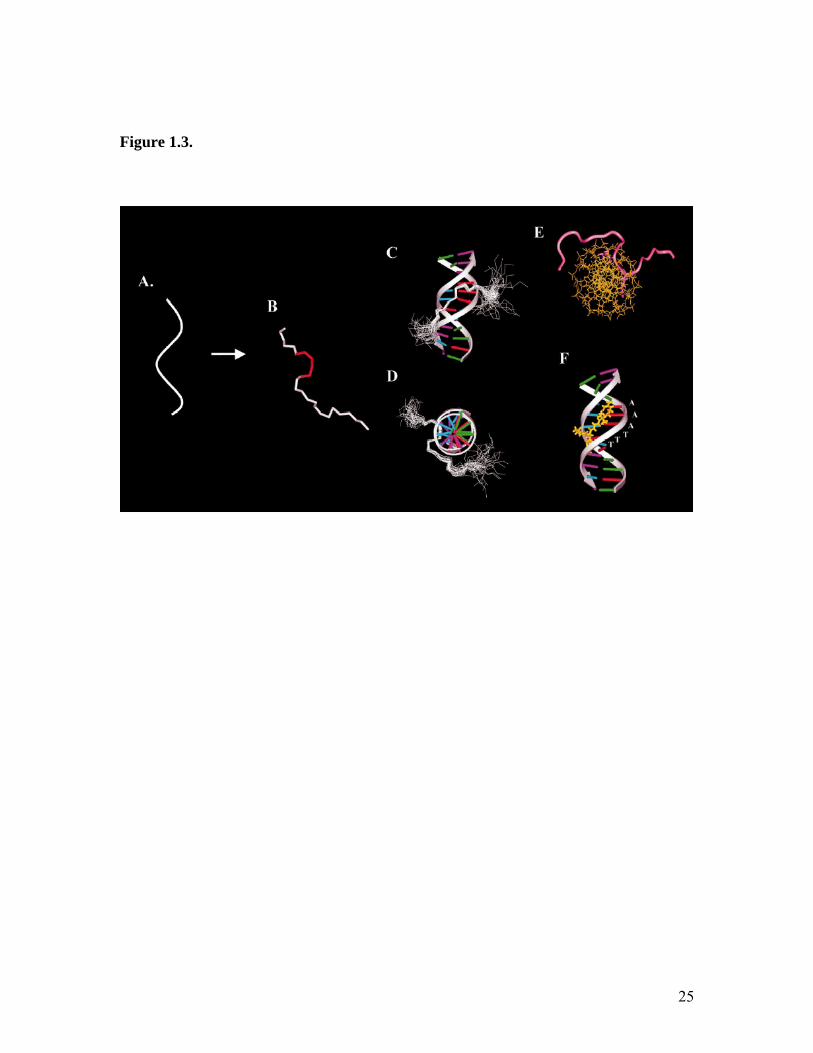
Figure 1.3.
25
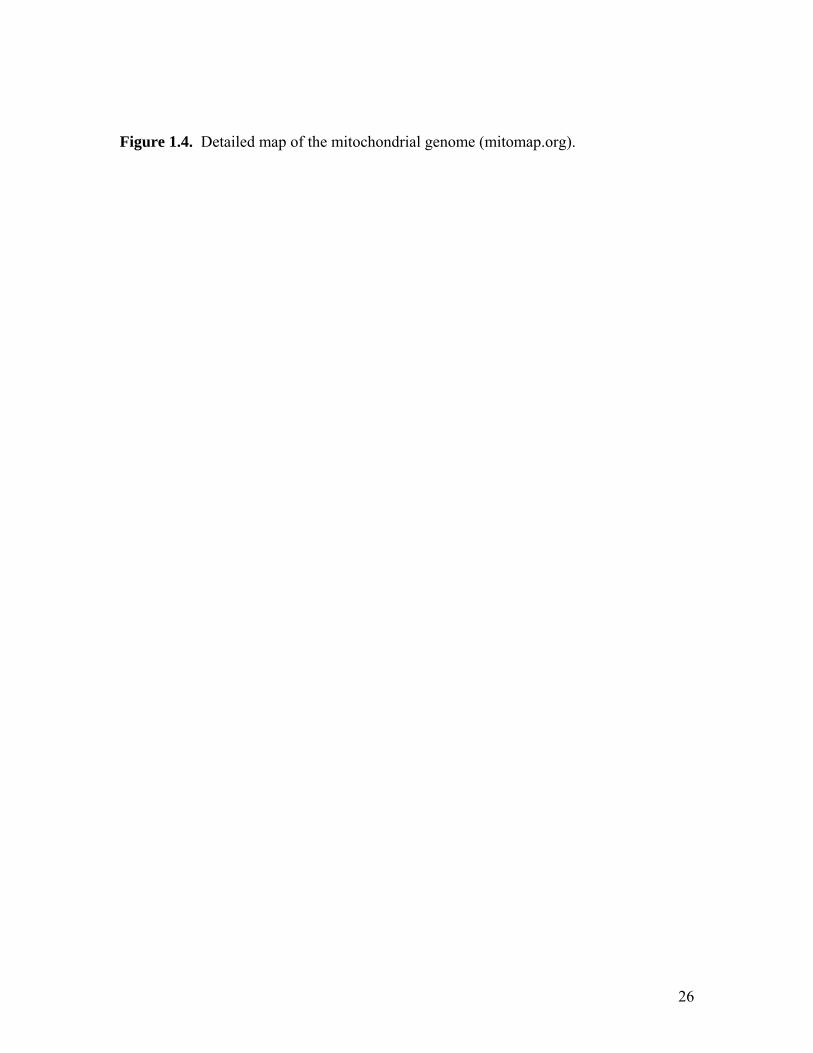
Figure 1.4. Detailed map of the mitochondrial genome (mitomap.org).
26

Figure 1.4.
27

Figure 1.5. Schematic representation of replication initiation of the vertebrate
mitochonodrial genome (Shadel and Clayton, 1997). The circular D-loop form of mtDNA
is shown with the D-loop regulatory region. The mtDNA H-strand and L-strand are
depicted as heavy and thin lines, respectively. The nascent H-strand (D-loop strand, thick
arrows) is shown bound (dashed lines) to the parental L-strand and displacing the
parental H-strand (bubble) to form the D-loop. The origins of H-strand (OH) and L-strand
(OL) synthesis are labeled. The heavy-strand promoter (HSP) and light-strand promoter
(LSP) are depicted as bent arrows in the D-loop regulatory region. Note that LSP
transcripts function both in gene expression (usually encoding eight genes) and DNA
replication, where they are processed to provide RNA primers at OH.
28

Figure 1.5.
29

References Adair, J.E, Y.H. Kwon, G.A. Dement, , and R. Reeves. 2005. Inhibition of
ucleotide Excision Repair by High Mobility Group Protein HMGA1. J. Biol.Chem
ankier, B.G. Barrell, M.H.L. De Brujin, A.R. Coulson, J. Drouin. I.C. peron, D.P. Nierlich, B.A. Roe, F. Sanger, P.H. Schreier, A.J. Smith, R. Staden, and
J.P. Ballini, H. Rezaei, N. Beaujean, D. Jullien, E. Kas, and P. ebey. 1998. Three distinct sub-nuclear populations of HMG-I protein of different
MGI(Y) nonhistone chromatin proteins modulate nucleosome and DNA interactions.
Baly, C. Monod, K. Kissa, D. Jullien., N. Aulner, C. Amirand, . Debey, and E. Käs. 2000. Induction of early transcription in one-cell mouse embryos
M.J., R.A. Van Etten, C.T. Wright, M.W. Walberg, D.A. Clayton. 1981. Sequence nd gene organization of mouse mitochondrial DNA. Cell 2:167-80.
G) chromosomal roteins. Trends Biochem. Sci. 26:152-153.
ity-group chromosomal proteins: rchitectural components that facilitate chromatin function. Prog. Nucleic Acids Res.
Clayton. 1985. Priming of human mitochondrial DNA replication ccurs at the light-strand promoter. Proc. Natl. Acad. Sci. USA 82:351-355.
. Obriecht, nd P.E. Berg. 1999. Binding of HMG-I(Y) elicits structural changes in a silencer of the
ele, S. Battista, F. Trapasso, B.M. erciai, V. Fidanza, V. Giancotti, M. Santoro, A. Simeone, and A. Fusco. 1996. High
M.J. SmerdonN280:32184-32192. Anderson S., A.T. BEI.G. Young. 1981. Sequence and organization of the human mitochondrial genome. Nature. 290:457-465. Amirand, C., A. Viari,Dproperties revealed by co-localization image analysis. J. Cell Sci. 111:3551-3561. Banks, G.C, Y. Li and R. Reeves. 2000. Differential in vivo modifications of the HBiochem. 39:8333-8346. Beaujean, N., C. Bouniol-Pby microinjection of the nonhistone chromosomal protein HMG-I. Dev. Biol. 221:337-354. Bibb,a Bustin, M., 2001. Revised nomenclature for high mobility group (HMp Bustin, M., and R. Reeves. 1996. High-mobilaMol. Biol. 54:35-100. Chang, D.D., and D.A.o Chase, M.B., S.B. Haga, W.D. Hankins, D.M. Williams, Z. Bi, J.W. Stovel, Cahuman beta-globin gene. Am. J. Hematol. 60:27-35. Chiappetta, G., V. Avantaggiato, R. Visconti, M. FedMlevel expression of the HMGI(Y) gene during embryonic development. Oncogene. 13:2439-2446.
30

Diana, F., R. Sgarra, G. Manfioletti, A. Rustighi, D. Poletto, M.T. Sciortino, A. Masand V. Giancott
tino, i. 2001. A link between apoptosis and degree of phosphorylation of high
obility group A1a protein in leukemic cells. J. Biol. Chem. 276:11354-11361.
se hromosomes. J.Cell Biol. 109:1975-1982.
l a proteins in breast cancer cells of differing
etastatic potential. Biochem. 43:11500-11515.
-I protein. Bull. Mag. Reson. 14:171-74.
MR assignments and molecular modeling of a minor groove DNA-binding peptide
om the HMG-I protein. Int. J. Pept. Protein. Res. 45:554-560.
proteins HMGI(Y). Cell 3:1101-1111.
anscription factor 1. Mol. Cell. Biol. 8:3496-3509.
d activator protein,
.Biol. Chem. 267:3358-3367.
-alization of the human HMG-I(Y) nonhistone protein
ene. Nucleic Acids Res. 21:4259-4267.
ne lized or transformed by viral and cellular
ncogenes. EMBO J. 5:1261-1265,
ents ctures. Trends Genet. 10:94-100.
m Disney, J.E., K.R. Johnson, N.S. Magnuson, S.R. Sylvester, and R. Reeves. 1989. High-mobility group protein HMG-I localizes to G/Q- and C-bands of human and mouc Edberg, D.D, J.E. Bruce, W.F. Siems, and R. Reeves. 2004. In vivo post-translationamodifications of the High Mobility Group A1m Evans, J.N., M.S. Nissen, and R. Reeves. 1992. Assignment of the 1H NMR spectrum of a consensus DNA-binding peptide from the HMG1 Evans, J.N., J. Jajicek, M.S. Nissen, G. Munske, V. Smith, and R. Reeves. 1995. 1H and13C Nfr Falvo, J.V., D. Thanos, T. Maniatis. 1995. Reversal of intrinsic DNA bends in the IFN beta gene enhancer by transcription factors and the architectural 8 Fisher, R. P. and D.A. Clayton. 1988. Purification and characterization of human mitochondrial tr Fisher, R.P., T. Lisowsky, M.A. Parisi, and D.A. Clayton. 1992. DNA wraping anbending by a mitochondrial high mobility group-like transcriptionalJ Friedmann, M., L.T. Holth, H.Y. Zoghbi, and R. Reeves. 1993. Organization, inducibleexpression and chromosome locg Glaichenhaus, N., P. Leopold, and F. Cuzin. 1986. Increased levels of mitochondrial geexpression in rat fibroblast cells immortao Grosschedl, R., K. Giese, J. Pagel. 1994. HMG domain proteins: architerctural elemin the assembly of nucleoprotein stru Harrer, M., H. Luhrs, M. Bustin, U. Scheer, and R. Hock. 2004. Dynamic interaction of HMGA1a proteins with chromatin. J. Cell. Sci. 117:3459-3471.
31

Hill, D.A., M.L. Pedulla, and R. Reeves. 1999. Directional binding of HMG-I(Y) on four-way junction DNA and the molecular basis for competitive binding with HMG-1 nd histone H1, Nucl. Acids Res. 27:2135-2144.
3523-3531.
ure of an HMG-I(Y)-DNA complex defines a new rchitectural minor groove binding motif. Nat.Struct.Biol. 8:657-665.
in gene expression: otential role of physical interactions between Elf-1, HMG-I(Y), and NP-kappa B family
ent that binds Stat5, Elf-1, HMG-Y) and GATA family protein. EMBO J. 15:5627-5635.
7.
hnson, K.R., D.A. Lehn, and R. Reeves. 1989. Alternative processing of mRNA’s
ol. Cell. Biol. 9:2114-2123.
al proteins HMG-I and HMG-Y during cellular roliferation. Exp. Cell. Res. 187:69-76.
ening: ction enzyme cleavage of chromatin by
istamycin. EMBO J. 12:115-126.
lation by HMG I family proteins. J. Virol. 74:10965-0974.
tion and R-loop processing. J. Biol. Chem.273:30614-30621.
a Hill, D. and R. Reeves. 1997. Competition between HMG-I(Y), HMG-1 and histone H1on four-way junction DNA. Nucl. Acids Res. 25: Holth, L.T., A.E. Thorlacius, and R. Reeves. 1997. Effects of epidermal growth factor and estrogen on the regulation of the HMG-I/Y gene in human mammary epithelial cell ines. DNA Cell Biol. 16:1299-1309. l
Huth, J.R., C.A. Bewley, M.S. Nissen, J.N. Evans, R. Reeves, A.M. Gronenborn, and G.M. Clore. 1997. The solution structa John, S., R. Reeves, J.X. Lin, R. Child, J.M. Leiden, C.B. Thompson, and L. Leoni. 1995. Regulation of cell-type-specific interleukin-2 receptor alpha-chapproteins. Mol. Cell. Biol. 15:1786-1796. John, S., C.M. Robbins, W. J. Leonard. 1996. An IL-2 response element in the human IL-2 receptor alpha chain promoter is a composite elemI( Johns, E.W. 1982. The HMG chromosomal proteins. Academic Press, New York. p. 18 Joencoding mammalian chromosomal high-mobility-group proteins HMG-I and HMG-Y. M Johnson, K.R., J.E. Disney, C.R. Wyatt, and R. Reeves. 1990. Expression of mRNAs encoding mammalian chromosomp Käs, E., L. Poljak, Y. Acachi, and U.K. Laemmli. 1993. A model for chromatin opstimulation of topoisomerase II and restrid Li, L., K. Yoder, M.S. Hansen, J. Olvera, M.D. Miller, and F.D. Bushman. 2000. Retroviral cDNA integration: stimu1 Lee, D.Y. and D.A. Clayton. 1998. Initiation of mitochondrial DNA replication by transcrip
32

Lehn, D.A., T.S. Elton, K.R. Johnson, and R. Reeves. 1988. A conformational study of
und, T., M. Holtlund, M. Fredrickson, and S.G. Laland. 1983. On the presence of two .)
undberg, K., J.R. Karlson, K. Ingebrigtsen, J. Holtlund, T. Lund, and S.G. Laland. 1989.
cCulloch, V., B.L. Seidel-Rogol, and G.S. Shadel. 2002. A human mitochondrial
elillo, R. M., G.M. Pieranoni, S. Scala, S. Battista, M. Fedele, A. Stella, M.C. De tto,
gram, S.A. and R. Reeves. 1995. Differential regulation of a multipromoter gene: art
stvold, A.C., Holtlund, J., and Laland, S.G. 1985. A novel, highly phosphorylated
arisi, M.A. and D.A. Clayton. 1991. Similarity of human mitochondrial transcription
edersen, P.L. 1978. Tumor mitochondria and bioenergenetics of cancer cells. Prog. Exp.
enta, J.S., F.M. Johnson, J.T. Wachsman, and W.C. Copeland. 2001. Mitochondrial
adic, M.Z., M. Saghbini, T.S. Elton, R. Reeves, and B.A. Hamkalo. 1992. Hoechst to
eeves, R. 1992. Chromatin changes during the cell cycle. Curr. Opin. Cell Biol. 4:413-
the sequence specific binding of HMG-I(Y) with the bovine interleukin-2 cDNA. Biochem. Int. 16:963-971. Lnew high mobility group-like proteins in HeLa S3 Cells. FEBS (Fed. Eur. Biochem. SocLett. 152:163-167. LOn the presence of the chromosomal proteins HMG-I and HMG-Y in rat organs. Biochim. Biophys. Acta 1009:277-279. Mtranscription factor is related to RNA methyltransferases and binds S-adenosylmethionine. Mol. Cell. Biol. 22:1116-1125. MBiasio, G. Chiappetta, V. Fidanza, G. Condorelli, M. Santoro, C.M. Croce, G. Viglieand A. Fusco. 2001. Critical role of the HMGI(Y) proteins in adipocytic cell growth and differentiation. Mol. Cell. Biol. 21:2485-2495. Oselective 12-O-tetradecanoylphorbol-13-acetate induction of a single transcription stsite in the HMG-I/Y gene. J. Biol. Chem. 270:14235-14242. Oprotein of the high-mobility type present in a variety of proliferating and non-proliferating mammalian cells. Eur. J. Biochem. 153:469-475. Pfactor 1 to high mobility group proteins. Science. 252:965-969. PTumor Res. 22:190-274. PDNA in human malignancy. Mutat. Res. 488:119-133. R33258, distamycin A, and high mobility group protein I (HMG-I) compete for bindingmouse satellite DNA. Chromosoma 101:602-608. R423.
33
Reeves, R. 2001. Molecular biology of HMGA proteins: hubs of nuclear function. Gene 277:63-81. Reeves, R., and L. Beckerbauer. 2001. HMGI/Y proteins: flexible regulators of transcription and chromatin structure. Biochem. Biophys. Acta 1519:13-29. Reeves, R., D.D. Edberg, andY. Li. 2001. Architectural transcription factor HMGI(Y) promotes tumor progression and mesenchymal transition of human epithelial cells. Mol. Cell. Biol. 21:575-594. Reeves, R., T.S. Elton, M.S. Nissen, D. Lehn, and K.R. Johnson. 1987. Post-transcriptional gene regulation and specific binding of the nonhistone protein HMG-I by the 3’ untranslated region of bovine interleukin 2 cDNA. Proc. Natl. Acad. Sci.USA 84:6531-6535. Reeves, R., W.J. Leonard, and M.S. Nissen. 2000. Binding of HMG-I(Y) imparts architectural specificity to a positioned nucleosome on the promoter of the human interleukin-2 receptor alpha gene. Mol. Cell. Biol. 20:4666-4679. Reeves, R., and M. S. Nissen. 1990. The A.T-DNA-binding domain of mammalian high mobility group I chromosomal proteins: a novel peptide motif for recognizing DNA structure. J. Biol. Chem. 265:8573-8582. Reeves, R., and M.S. Nissen. 1993. Interaction of high mobility group-I(Y) nonhistone proteins with nucleosome core particles. J. Biol. Chem. 268:21137-21146. Reeves, R., and M.S. Nissen. 1995. Cell cycle regulation and functions of HMG-I(Y). Prog. Cell Cycle Res. 1:337-347. Reeves, R., and A.P. Wolffe. 1996. Substrate structure influences binding of the non-histone protein HMG-I(Y) to free and nucleosomal DNA. Biochemistry. 35: 5063-5074. Saitoh, Y. and U.K. Laemmli. 1994. Methaphase chromosome structure: bands arise from a differential folding path of the highly AT-rich scaffold. Cell 79:609-622. Shadel, G.S. and D.A. Clayton. 1997. Mitochondrial DNA maintenance in vertebrates. Annu. Rev. Biochem. 66:409-435. Slama-Schwok, A., K. Zakrzewska, G. Leger, Y. Leroux, M. Takahashi, E. Kas, and P. Debey. 2000. Structural changes induced by binding of the high-mobility group I protein to a mouse satellite DNA sequence. Biophys. J. 78:2543-2559. Strauss, F. and A. Varshavsky. 1984. A protein binds to a satellite DNA repeat at three specific sites that would be brought into mutual proximity by DNA folding in the nucleosome. Cell. 37:889-901.
34

Taanman, J.W. 1999. The mitochondrial genome: transcription, translation, and replication. Biochim. Biophys. Acta. 1410:103-123. Tabellini, G., M. Riccio, G. Baldini, R. Bareggi, A.M. Billi, V. Grill, P. Narducci, and A.M. Martelli. 2001. Further considerations on the intranuclear distribution of HMGI(Y) proteins. It.J. Anat. Embryol. 106:251-266. Tallini, G. and P. Dal Cin. 1999. HMGI(Y) and HMGI-C dysregulation: a common occurrence in human tumors. Adv. Anat. Pathol. 6:237-246. Tiranti, V. A. Savoia, F. Forti, M.F. D’Apolito, M. Centra, M. Rocchi, and M. Zeviani. 1997. Identification of the gene encoding the human mitochondrial RNA polymerase (h-mtRPOL) by cyberscreening of the Expressed Sequence Tags database. Hum. Mol. Genet. 6:615-625. Treff, N.R., D. Pouchnik, G.A. Dement, R.L. Britt, and R. Reeves. 2004. High-mobility group A1a protein regulates Ras/ERK signaling in MCF-7 human breast cancer cells. Oncogene 23:777-785. Varshavsky, A., L. Levinger, O. Sundin, J. Barsoum, E. Ozkaynak, P. Swerdlow, and D. Finley. 1983. Cellular and SV40 chromatin: replication, segregation, ubiquitination, nuclease hypersensitive sites, HMG-containing nucleosomes, and heterochromatin-specific protein. Cold Spring Harbour Symp. Quant. Biol. 47(Pt.1):511-528. Warburg, O. 1956. On the origin of cancer cells. Science. 123:309-314. Wood, L.J., M. Mukerjee, C.E. Dolde, Y. Xu, J.F. Maher, T.E. Bunton, J.B. Williams, and L.M. Resar. 2000. HMGI/Y, a new c-Myc target gene and potential oncongene. Mol. Cell. Biol. 20:5490-5502. Xu, Y., T.F. Sumter, R. Bhattacharya, A. Tesfaye, E.J. Fuchs, L.J. Wood, D.L. Huso, and L.M. Resar. 2004. The HMGI/Y oncogenes causes highly penetrant, aggressive lymphoid malignancy in transgenic mice and is overexpressed in human leukemia. Cancer Res. 64:3371-3375. Yamamoto, A., S. Horai, and Y. Yuasa. 1989. Increased level of mitochondrial gene expression in polyps of familial polyposis coli patients. Biochem. Biophys. Res. Commun. 159:1100-1106. Zafar, M.N., M. O’Brien, and D. Catovsky. 1982. Similarities in mitochondrial ultrastructure of leukemic cells and ethidium-bromide-treated normal cells. J. Ultrastruct. Res. 81:133-138. Zhao, K., E. Kas, E. Gonzalez, and U.K. Laemmli. 1993. SAR-dependent mobilization of histone H1 by HMG-I/Y in vitro: HMG-I/Y is enriched in H1-depleted chromatin. EMBO J. 12:3237-3247.
35

CHAPTER 2
Dynamic Mitochondrial Localization of Nuclear Transcription Factor HMGA1
36

Abstract
It has been well established that high mobility group A1 (HMGA1) proteins act
within the nucleus of mammalian cells as architectural transcription factors that regulate
the expression of numerous genes. Here, however, we report on the unexpected
cytoplasmic/mitochondrial localization of the HMGA1 proteins within multiple cell
types. Indirect immunofluorescence, electron microscopic immunolocalization, and
western blot studies revealed that, in addition to the nucleus, HMGA1 proteins can also
be found in both the cytoplasm and mitochondria of randomly dividing populations of
wild-type murine NIH3T3 cells and transgenic human MCF-7 breast cancer epithelial
cells expressing a hemaglutinnin tagged-HMGA1a fusion protein. While the molecular
mechanisms underlying these novel subcellular localization patterns have not yet been
determined, initial synchronization studies revealed a dynamic, cell cycle-dependent
translocation of HMGA1 proteins from the nucleus into the cytoplasm and mitochondria
of NIH3T3 cells. Furthermore, preliminary functionality studies utilizing a modified
“chromatin” immunoprecipitation protocol revealed that HMGA1 retains its DNA
binding capabilities within the mitochondria and associates with the regulatory D-loop
region in vivo. We discuss potential new biological roles for the classically nuclear
HMGA1 proteins with regard to the observed nucleocytoplasmic translocation,
mitochondrial internalization, and regulatory D-loop DNA binding.
Key Words: High Mobility Group; NIH3T3; MCF-7; Synchronization; Mitochondria; D-
loop; oncoprotein.
37
Introduction
Exclusive intranuclear localization of the high mobility group A1 (HMGA1)
proteins has been suggested (Amirand et al., 1998). Consistencies of this conclusion with
known HMGA1 function(s) are substantial but do not exclude alternative cytoplasmic
roles for this important, classically nuclear, family of proteins. As a whole, the HMGA1
group of non-histone chromatin proteins represents a class of ‘architectural’ transcription
factors that possess copies of an ‘AT hook’ DNA-binding motif (Reeves and Nissen,
1990). This peptide motif, which is conserved from bacteria to humans and is present in
multiple non-HMGA1 gene regulatory proteins (Aravind and Landsman, 1998),
preferentially associates with the minor groove of AT-rich B-form DNA (Reeves et al.,
1987; Solomon et al., 1986) in a structurally specific manner (Huth et al., 1997; Reeves
and Nissen, 1990). These DNA binding characteristics, along with the ability to
physically interact directly with a range of transcription factors (Reeves, 2001), allows
HMGA1 to play a dynamic role in a variety of important nuclear events.
Results from multiple cellular localization studies support this central nuclear
function for the HMGA1 proteins. Our laboratory has previously demonstrated the
specific association of these proteins with the AT-rich G/Q- and C- bands of human and
mouse chromosomes (Disney et al., 1989). This finding lead to the hypothesis that
HMGA1 proteins are most likely involved in the processes of cell division and chromatin
organization (Reeves and Nissen, 1995). In vitro and in vivo experiments, involving the
use of distamycin A and Hoechst 33258 as competitors of HMGA1 binding, support this
idea (Radic et al., 1992; Wegner and Grummt, 1990). Additional support comes from co-
localization results that demonstrate the presence of HMGA1, along with both histone H1
38
and topoisomerase II, at scaffold/matrix attachment regions (SARs/MARs), sequences
important for metaphase chromosome structure (Saitoh and Laemmli, 1994). Such data
correlate well with biochemical studies implicating HMGA1 in transcriptional regulation,
chromatin organization, and the formation of repressor complexes (Reeves and
Beckerbauer, 2001).
Unique physical and biochemical properties give HMGA1 proteins the ability to
function in the aforementioned array of nuclear processes. These properties do not,
however, exclude the possibility of a non-nuclear role for the proteins. For example,
each protein has three separate AT hook consensus peptides that typically associate with
5 to 6 tandem AT base pairs (Reeves and Nissen, 1990). Any region of DNA known to
be high in AT content is thus a potential candidate for containing HMGA1 binding sites,
regardless of specific sequence. This allows the proteins to directly interact with a
number of platforms including satellite repeats (Strauss and Varshavsky, 1984),
SARs/MARs (Zhao et al., 1993), and multiple gene promoter elements (Reeves and
Beckerbauer, 2001). Functional versatility and mobility is increased by the relative small
size (10.6-12 kDa) (Lund et al., 1983) and inherent flexibility (Lehn et al., 1988) of the
HMGA1 proteins. As free molecules, the proteins have little if any secondary structure
(Evans et al., 1992; Evans et al., 1995; Huth et al., 1997). This characteristic is thought
to play a significant role in the ability of HMGA1 to interact with multiple proteins and
DNA elements as well as to induce conformational changes in these substrates (Reeves
and Beckerbauer, 2001). Such interactions are also enhanced by the large number of
positively charged lysines and arginines that flank the core AT hook peptide (Huth et al.,
1997; Lund et al., 1983).
39
A final distinguishing factor allowing HMGA1 to function in diverse settings is
its array of modified states. Multiple studies have shown that HMGA1 function is
regulated by in vivo post-translational phosphorylation, acetylation, and methylation,
among others (Banks et al., 2000; Edberg et al., 2004; Reeves and Beckerbauer, 2001).
These modifications result from both internal and external signaling events that affect
important biological events such as cellular activation and proliferation, apoptosis, and
cell cycle progression. More specifically, a recent study utilizing fluorescence recovery
after photobleaching (FRAP) analysis demonstrated that reversible phosphorylation
regulates the chromatin binding characteristics of HMGA1 proteins in vivo (Harrer et al.,
2004). Thus, as a general conclusion, secondary biochemical modifications contribute to
the ability of the cell to control both the function and distribution of these highly mobile
and dynamic proteins. Of particular interest for the current study, is the specific
phosphorylation of two HMGA1 threonine residues by cdc2 kinase during the G2/M
phase of the cell cycle (Reeves et al., 1991). The result is a 20-fold decrease in the DNA
binding affinity of the modified protein, indicating the cell stage specific mobilization of
HMGA1 for an as yet undetermined function (Nissen et al., 1991).
Here we report on the apparent cell cycle dependent translocation of the HMGA1
proteins from the nucleus to the cytoplasm and mitochondria in NIH3T3 cells and
transgenic MCF-7 cells over-expressing an HA tagged HMGA1a fusion protein. Both
cell types analyzed reveal preferential nuclear or chromosomal localization of HMGA1
proteins, with occasional cases of cytoplasmic translocation in randomly proliferating cell
populations. However, in a majority of synchronized NIH3T3 cells, during the late S and
G2 stages, these proteins are also found in abundance within both the cytoplasm and
40

mitochondria. In order to determine a functional role for the specific mitochondrial
localization and internalization of HMGA1, a modified chromatin immunoprecipitation
(ChIP) protocol was performed. Interestingly, the results showed that HMGA1 binds, in
vivo within both the parental (HMGA1 non-over-expressing) and transgenic (HMGA1
over-expressing) MCF-7 cells, to the control region of the mitochondrial genome referred
to as the D-loop. These findings not only demonstrate the remarkable dynamic mobility
of the HMGA1 proteins inside living cells but also represent the first report of a bona fide
nuclear chromatin protein specifically binding to the mitochondrial D-loop. This raises
the intriguing possibility that HMGA1 proteins not only contribute to transcription and/or
replication control in mitochondria but also function to coordinate the activities of these
organelles with those of the nucleus.
Materials and Methods
Cell Culture and Synchronization
Briefly, attached monolayer NIH3T3 cells (American Type Culture Collection)
were maintained in Dulbecco’s modified Eagle’s medium (DMEM) supplemented with
10% calf serum, penicillin (100 ug/ml), and streptomycin (50 ug/ml). Partial synchrony
was achieved by seeding cells into 100 mm culture dishes, growing cells to confluence,
and maintaining the cells at confluence for up to 4 days. Confluent cultures were
trypsinized, washed, and seeded onto 100 mm dishes (1X10⁵ cells) for DNA content
analysis or 60 mm dishes (1X10⁴ cells) with sterile glass coverslips for
immunofluorescence. Cells were then harvested at various time points, fixed in cold
absolute ethanol, and stained with 0.01 mg/ml propidium iodide (PI) for DNA content
41

analysis by flow cytometry using a Becton Dickinson FACS Calibur Cytometer and Cell
Quest Software.
The tetracycline-regulated M/tet (referred to as parental) and M/tet/HA-I (referred
to as transgenic) human breast epithelial MCF-7 cells were developed as described
previously (Reeves et al., 2001). Briefly, the parental M/tet (MCF-7/tet-off) cell line was
purchased from Clontech, Palo Alto, CA. This cell line was stably transfected with a
plasmid vector (Clontech) containing the tetracycline response element (pTRE) driving
the expression of a hemaglutinnin (HA)-tagged HMGA1a transgene to generate the
M/tet/HA-I line. M/tet cells were cultured in DMEM supplemented with 10% fetal
bovine serum, penicillin (100 ug/ml), streptomycin (100 ug/ml), and G418 (100 ug/ml) to
maintain selection of the tetracycline transactivator protein gene. M/tet/HA-I cells were
maintained and selected in the same media as for the M/tet, and supplemented with
hygromycin (100 ug/ml) for selection of clones containing the HA-HMGA1a expression
vector. Partial synchronization of the M/tet/HA-I cells was accomplished by treatment of
adherent cells at 50% confluence with 4 mM hydroxyurea (HU) for 24 hours to inhibit
DNA synthesis and arrest the cell cycle at the early S phase. Recovery was accomplished
by the addition of complete growth media after three washes with 1X PBS to remove HU.
Cells were then harvested at various time points up to 24 hours, fixed in cold absolute
ethanol, and stained with 0.01 mg/ml propidium iodide (PI) for DNA content analysis as
described above. For immunofluorescence analysis of synchronized cells, cultures were
grown on sterile glass coverslips before treatment with HU.
42

Antibodies, Fractionation and Western Blot Analysis
Production and characterization of the rabbit polyclonal antibody against reverse-
phase HPLC purified murine HMGA1a protein used in this study has been previously
described (Disney et al., 1989). The IgG fraction of the HMGA1a antiserum was purified
using Staphylacoccus aureus protein A column (Miller and Stone, 1978) and, in some
cases, subsequently purified by affinity chromatography on an HMGA1a-sepharose
column (Harlow and Lane, 1988). Titer and specificity of this antibody was determined
by enzyme-linked immunosorbent assays (ELISA) and western blot analysis. These
techniques showed no cross reactivity to mixed histone preparations, proteins from
human or murine cells, or HMG proteins other than HMGA1a and HMGA1b (Disney et
al., 1989). Mouse monoclonal antibody (clone 12CA5) to an epitope derived from the
hemaglutinnin protein of human influenza virus was a generous gift of J.J. Chen (Chen et
al., 1998).
Fractionation of transgenic MCF-7 cells was performed with a Mitochondrial
Fractionation Kit (Active Motif, Carlsbad, CA) following the recommendations of the
distributor. Briefly, cells were harvested and homogenized on ice with 50 strokes using a
loose fitting 2 ml Dounce homogenizer. This was followed by differential centrifugation
using a table top microcentrifuge. Protein yield was determined by the Biorad Protein
Quantification Assay (Biorad, Hercules, CA), and an equal amount of protein (25 ug)
from each fraction was loaded onto a 15% SDS-polyacrylamide gel. Following transfer
of the proteins to a PVDF membrane, samples were probed with either affinity purified
anti-HMGA1 (MR19) or anti-HA tag antibodies together with anti-Histone H1 (Stressgen
Biotechnology, Victoria, BC, Canada) as a nuclear control. Additional control antibodies
43
used were anti-phosphoMEK1/2 (Cell Signaling Technology) as a cytosolic marker and
anti-65 kDa mitochondrial protein (Chemicon – mAb 1273) as a mitochondrial marker.
Indirect Immunofluorescence
Cells grown on glass coverslips were washed in BRB80 buffer to remove serum
proteins, and fixed with a solution of 0.3% glutaraldehyde or 4% paraformaldehyde
(PFA). Fixed cells were permeabilized with 1% Triton X-100, followed by the reduction
of unreacted aldehydes by the addition of 1 mg/ml sodium borohydride. Coverslips were
then blocked with 8% bovine serum albumin (BSA) in a solution of PBS and 0.1% Triton
X-100 (PBST). The primary antibody (anti-HA tag (1:1000) or anti-HMGA1 (MR19)
(1:500)) was diluted in PBST with 1% BSA and added to the cells for 1 hour at room
temperature. Following three washes with PBST, anti-mouse or anti-rabbit IgG
conjugated with Oregon Green diluted 1:200 in PBST with 1% BSA was added and the
cells were incubated for 1 hour at room temperature. After washing with PBS and water,
the coverslips were mounted on slides with Vectashield (Vector Laboratories,
Burlingame, CA) mounting media containing propidium iodide to stain DNA. Cells were
observed using a Nikon Eclipse TE300 confocal laser (Biorad MRC 1024) scanning
microscope and images were collected using Biorad Laser Sharp acquisition software.
Preparation of NIH3T3 Cells for Electron Microscopy
Culture plates with monolayers of cells were flooded with 20 ml of chemical
fixative containing 1% paraformaldehyde and 1% glutaraldehyde in fetal calf serum
buffered with 30 mM PIPES (pH 7.2). The cells were fixed for 15 minutes at room
44

temperature and rinsed with fetal calf serum twice for 10 minutes. Using a rubber spatula
and fresh fetal calf serum, aliquots of cells were harvested and transferred to a 1.5 ml
Eppendorf tubes and pelleted by centrifugation. The packed cells were dehydrated using
an ethanol series (30, 50, 70, 80, 90, 100%; 10 minutes each) and infiltrated with L.R.
White resin in a stepwise fashion (1:4, 1:2, 1:1, 2:1 resin: ethanol, pure resin; 12-24 hours
each step). The infiltrated pellets were transferred to gelatin capsules (size 00) having a
prepolymerization pad of resin at the bottom and then polymerized at 60oC for 18 hours.
The pellets were cut out of the polymerization blocks, and remounted on a plastic rod
such that the pellet could be cut in cross-sections. This ensured sampling of all cells in
the population regardless of slight differences in density, and thus differential
sedimentation during centrifugation. Thin sections (~ 60 nm) were cut on a diamond
knife using a Sorvall MT5000 ultramicrotome and transferred to uncoated, 200 mesh
nickel grids.
Immunogold Staining:
Grids containing sections were immersed in TBS+BSA (50 mM Tris, 500 mM
NaCl, 0.1% Tween, 1% BSA, pH 7.2). They were then transferred to specific or
preimmune antibody diluted 1:25, 1:50, or 1:100 in TBS+BSA and incubated for 1 to 3
hours at room temperature while shaking. A dilution of 1:25 and incubation for 2 hours
gave the best combination of adequate labeling and low background. The antibodies used
were anti-HMGA1a whole serum or purified IgG’s, anti-HMGA1a synthetic peptide
(Johnson et al., 1989) whole serum, whole preimmune serum and mouse antihistone
monoclonal antibodies in ascites fluid. After incubation in the above antibody solutions,
45

the grids were washed 5 times by immersion in TBS+BSA (10 minutes each while
shaking), and then transferred to Protein A-gold (15 nm, Janssen Pharmaceuticals,
Piscataway, N.J., USA) diluted 1:50 with TBS+BSA, and incubated for 1 hour. For
labeling with murine antihistone antibody, gold-tagged goat anti-mouse antibody was
used in place of protein A-gold (same size and source as above). The grids were then
washed 4 times with TBS+BSA, 3 times with TBST, and 3 times with distilled water (5-
10 minutes each wash). The grids were post-stained with 1% aqueous alkaline lead
citrate and 2% aqueous uranyl acetate and examined and photographed using a Hitachi
300 transmission electron microscope operated at 75 KV accelerating potential. To
quantitatively assess the number of immunogold particles within mitochondria, compared
to other areas of the cell, a pixel selection method employing Adobe Photoshop (ver. 8.0;
Adobe Systems Inc., San Jose, CA) was employed. Briefly, the total cell field for a given
cross section was selected and the immunogold particles counted. For each count, the
number of pixels within the selected region was recorded. This procedure was repeated
for each of the mitochondria within the corresponding cell cross section. Count results
for three cell cross sections showed 21.33±3.59 mitochondrial particles per unit area
compared to 7.37±0.78 total cell particles per unit area. Area was determined by
generating a histogram of the selected region that reports the total number of selected
pixels. The unit of area was arbitrarily set at 50,000 pixels for a direct comparison of
mitochondrial versus total cell particles present within a given area.
46

Modified Chromatin Immunoprecipitation (ChIP):
Immunoprecipitation of croslinked DNA/protein complexes was performed as
described previously (Treff et al., 2004) with several minor changes. Briefly, transgenic
MCF-7 cells over-expressing HMGA1 and parental MCF-7 cells not over-expressing
HMGA1 were crosslinked with formaldehyde at a final concentration of 1%.
Crosslinked cells were then fractionated as described above to collect mitochondria.
Mitochondria were then subjected to the complete ChIP protocol with increased
sonication to achieve complete fragmentation of the DNA. Additionally, salmon sperm
DNA was not added to the Sepharose A protein beads as the high level of mitochondria
in the salmon sperm cells resulted in mitochondrial DNA contamination in all control and
experimental samples during protocol optimization. Immunoprecipitation of
HMGA1/DNA complexes was carried out with polyclonal anti-HMGA1 antibody
(MR19) which recognizes endogenous protein. Following Rnase and Proteinase K
treatment, PCR amplification of phenol extracted and ethanol precipitated DNA was
carried out with two separate primer sets (D-loop Primer Set 1: upper: 5’-
CCCCTCACCCACTAGGATAC-3’, lower: 5’-ACGTGTGGGCTATTTAGGC-3’; and
D-loop Primer Set 2: upper: 5’-GCATTGCGAGACGCTGGAGC-3’, lower: 5’-
TCTGGTTAGGCTGGTGTTAG-3’) specific for regions of the D-loop sequence
identified as containing potential binding sites for HMGA1. Binding site potential was
determined by a Seqweb Pattern Search with the following sequence pattern entry:
(wwwww (N) {0,5} wwwww) where “w” is either an adenine or thymine and “N {0,5}”
is zero to five of any nucleotide. Though this pattern does not provide definitive
47

identification of HMGA1 binding sites, it is effective for determining an increased
probability of binding.
Results
Localization of HMGA1 in Non-synchronized Cell Populations
Immunofluorescence analysis of endogenous HMGA1 in randomly dividing
suspension cultures of human K562 cells and murine Friend erythroleukemia cells (data
not shown) confirmed the primarily nuclear localization patterns that have been
previously observed (Disney et al., 1989). Somewhat surprisingly, in the same
asynchronously growing populations of both cell types, we also observed cytoplasmic
localization of the HMGA1 proteins (data not shown). Because both the K562 and
Friend cells grow in suspension, these analyses involved cytocentrifugation of live cells
onto microscope slides prior to fixation and immunolocalization analysis. As a result,
cellular compartments were sometimes difficult to distinguish by immunofluorescence,
making the observation of non-nuclear HMGA1 localization a possible artifact.
In order to avoid cytocentrifugation steps and facilitate a more accurate analysis
of intracellular protein localization, mouse NIH3T3 cells, which display adherent growth
characteristics, were cultured and prepared for indirect immunofluorescence analysis.
When attached asynchronous populations of NIH3T3 cells were examined, it was found
that most of the cells, like the K562 and Friend cells, exhibited a preferential nuclear or
chromosomal pattern of HMGA1 localization (data not shown).
Nevertheless, some of the NIH3T3 cells from actively proliferating populations
exhibited noticeable cytoplasmic fluorescence. Specifically, it appeared that such
48

fluorescence was more intense at structures similar to mitochondria. In different cells
within the same population, the immunofluorescence was localized either exclusively in
the nucleus (Fig. 2.1A), both in the nucleus and mitochondria (Fig. 2.1, B.1) or, less
intense in the nucleus, with a strong signal in the cytoplasm and mitochondria (Fig. 2.1,
B.2). Overall, patterns of HMGA1 subcellular localization differed from cell to cell in
randomly growing populations, suggesting that cell cycle stage might influence HMGA1
distribution.
Localization of HMGA1 in Synchronized NIH3T3 Cells
To test the idea of cell cycle dependent HMGA1 localization control, NIH3T3
cells were partially synchronized by seeding from contact inhibited cultures. Analysis of
cell cycle stage by flow cytometry confirmed that the cells could be reproducibly induced
to undergo a cycle of partially synchronous replication. From these studies, the
approximate length of the NIH3T3 cell cycle was estimated to be 20 hours with the G1
phase occupying about 10 hours (0-10 hours post-seeding), the S phase 6 hours (10-16
hours post-seeding), and the G2/M phase about 4 hours (16-20 hours post-seeding) (Fig.
2.2A).
With a reproducible and accurate method of partial synchronization, it was
possible to analyze populations of NIH3T3 cells by indirect immunofluorescence at
various time points corresponding to particular cell cycle stages (Fig. 2.2B, C). As
mentioned previously, randomly growing populations displayed fluorescence primarily
over the nucleus with few examples of cytoplasmic and mitochondrial staining. Cells
49

treated with no primary antibody were observed to display negligible, if any, fluorescent
signal in these random populations (data not shown).
In contrast to mixed populations of cells, a regular pattern of HMGA1 localization
was observed in partially synchronized cells. Briefly, at 12 hours post-synchronization
(Fig. 2.2B, 12hr), fluorescence was distributed throughout the nucleus with only low
level cytoplasmic staining and minor localization over mitochondria. Localization
patterns for this population of cells was demonstrative of cells analyzed from 0-12 hours
and thus represented the G1/early-S phase of the NIH3T3 cycle. Mid-S phase, which
occurred at approximately 14 hours (Fig. 2.2B, 14hr) post-seeding, was characterized by
a similar pattern of intense nuclear staining with some cells displaying slightly increased
cytoplasmic fluorescence. By the late S/early G2 stage, which occurred at approximately
16-17 hours (Fig. 2.2B, 16-17hr), a much more intense pattern of
cytoplasmic/mitochondrial immunofluorescent staining was observed. To ensure that
cells analyzed by immunocytochemistry at these specific time points were synchronized
properly and represented a specific cell cycle stage, DNA content analysis was performed
on parallel samples. Results from these analyses showed that the cells observed at each
time point represented highly synchronized cell populations (Fig. 2.2C).
Mitochondrial Immunolocalization Studies in NIH3T3 Cells
Mitochondrial localization of HMGA1 was confirmed by immunofluorescence
co-localization (Fig. 2.3) studies in cell populations16-18 hours post-synchronization.
Previously mentioned findings suggested that a peak of mitochondrial localization
occurred in these late S/G2 cells. Indirect immunofluorescence with anti-HMGA1 (Fig
50

2.3A) combined with prior live cell Mito Tracker Red staining (Fig 2.3B) of late S/G2
NIH3T3 cells revealed co-localization (Fig 2.3C) of HMGA1 with mitochondria. From
these results it was clear that HMGA1 was also found diffuse in the cytoplasm but
concentrated in or around mitochondria.
In order to further confirm this co-localization and look more closely at the sub-
mitochondrial localization of HMGA1, electron microscopy was performed on thin
sections of NIH3T3 cells 16-18 hours post-synchronization (Figs. 2.4-2.6). Results of
control experiments utilizing pre-immune or normal non-immune sera showed low
background and no specific labeling of any cellular structures (Fig. 2.4A). The general
pattern of labeling seen with anti-HMGA1 antibody (Fig. 2.4B) revealed diffuse
cytoplasmic localization with concentration over the nucleus and mitochondria. Most of
this specific antibody labeling was greatly reduced or competed away by the addition of
increasing amounts of pure HMGA1 protein to the antibody prior to labeling (Fig. 2.4C).
In such competition experiments, the residual gold label observed was randomly
distributed over the entire field, including on the grid outside of the cells themselves, and
was thus likely a result of protein precipitation with subsequent physical trapping of the
immunogold particles in these non-specific aggregates (data not shown). Unlike the
studies with anti-HMGA1 antibody, control immunolocalization experiments with anti-
histone antibody showed strictly nuclear labeling (Fig. 2.4D).
A more detailed analysis of the HMGA1 labeling observed in late-S/G2 cells
revealed significant localization within the mitochondria and nucleus (Fig. 2.5). Within
the nucleus, there often appeared to be greater labeling of heterochromatin and the inner
periphery of the nuclear membrane than in the interior nucleoplasm (Fig. 2.5A; data not
51
shown). Low magnification photographs (Figs. 2.5B and C) showed mitochondrial and
nuclear labeling that was noticeably higher than the amounts observed in the general
cytoplasm. A higher magnification photograph of a separate population of mitochondria
also showed heavy labeling over the mitochondria (Fig 2.5D). Numerous mitochondria
(Figs. 2.5B and C) observed in the low magnification photographs, as well as the
counting of immunogold particles, gave additional support to the conclusion that
mitochondrial labeling was not due to random statistical fluctuation. Employing the
quantitative counting method outlined in Materials and Methods, it was determined that
in late S/G2 cells (Fig. 2.5) there was an approximately 3-fold increase in particles per
unit area within the mitochondria versus the entire cell field (mitochondrial particles:
21.33±3.95 per unit area; total cell particles: 7.37±0.78 per unit area). High
magnification views of the distribution of HMGA1 labeling within the mitochondria
allowed for a more detailed description of possible submitochondrial protein localization
patterns (Figs. 2.6A-D). It appeared that labeling was primarily along and between the
mitochondrial cristae, and more generally, within the matrix. Further analysis is required,
however, to precisely define the distribution of HMGA1 proteins within mitochondria.
Nevertheless, these studies clearly demonstrated that HMGA1 proteins are localized to
the nucleus and mitochondria in NIH3T3 cells during the late-S and G2 phases of the cell
cycle.
Localization of HA-HMGA1a Fusion Protein in Non-Synchronized MCF-7 Cells
Although results utilizing the anti-HMGA1 polyclonal antibody were compelling,
as an independent method for assessing the subcellular distribution of HMGA1 proteins,
52

we went further and analyzed the localization patterns of a transgenic hemaglutinnin
(HA) ‘tagged’ HMGA1a protein in a genetically engineered line of MCF-7 breast cancer
epithelial cells over-expressing this protein. A monoclonal anti-HA tag antibody was
used in a series of indirect immunofluorescence experiments to confirm results obtained
for the NIH3T3 cell line. In this way, undetectable cross reactivity of the polyclonal anti-
HMGA1 as a possible explanation for the observed localization patterns could be ruled
out, if in fact similar patterns occurred with the alternative monoclonal antibody probe.
Initial anti-HA antibody control experiments done with the parental MCF-7 cell line
lacking the HA-HMGA1a transgene showed only very low background signal and
confirmed the high specificity of the monoclonal antibody (data not shown).
Transgenic cells in a randomly proliferating population analyzed with the anti-HA
or anti-HMGA1 antibody showed primarily nuclear localization of the fusion protein
with some examples of cytoplasmic and mitochondrial staining in groups of cells (Figs.
2.7A, B). As an additional control, cells treated with the secondary antibody alone
showed little if any background fluorescence (Fig. 2.7C). Overall, examples of
cytoplasmic localization of the transgenic HA-HMGA1a protein were present in
populations of asynchronously growing MCF-7 cells and appeared strikingly similar to
patterns observed in populations of exponentially growing NIH3T3 cells. Cells always
exhibited primarily nuclear localization of HA-HMGA1 with isolated examples of
cytoplasmic and mitochondrial distribution in the cell population.
In order to further demonstrate these HMGA1 protein localization patterns by
independent experimental methods, transgenic MCF-7 cells were fractionated and the
subcellular fractions analyzed by western blot (Fig. 2.8). Using both anti-HA and anti-
53

HMGA1 antibodies in combination with nuclear, cytoplasmic, and mitochondrial control
antibodies, it was found that HMGA1 was present in both the cytoplasm and
mitochondria. Histone H1 was not detectable in these fractions showing that premature
nuclear lysis during the fractionation process was not responsible for the release of
HMGA1 into the cytoplasmic and mitochondrial fractions. An antibody to a 65 kDa
outermembrane mitochondrial protein showed proper enrichment of the organelle while
an anti-posphoMEK1/2 antibody served as a control against contamination of the
mitochondrial fraction with soluble cytoplasmic proteins. Similarly, the purity of the
mitochondrial fraction was further confirmed by it’s lack of reactivity to an antibody
against caspase-3 in Hs578T cells, a line of cancerous human mammary epithelial cells
that express this strictly cytosolic enzyme (unpublished data). These biochemical results
confirmed the phenomenon of cytoplasmic and mitochondrial localization of HMGA1
proteins observed within the NIH3T3 cells, suggesting that the observed redistribution
may be a common theme amongst different mammalian cell types.
HMGA1 Binds to the Regulatory D-loop Region of Mitochondrial DNA
With evidence of mitochondrial internalization and an established role for
HMGA1 in transcriptional control within the nucleus, it was hypothesized that the
proteins may also bind to the AT-rich sequences in the regulatory D-loop region of
mitochondrial DNA (Fig. 2.9A). To test this hypothesis, a “chromatin”
immunoprecipitation protocol (ChIP), modified to accommodate the histone free and
circular mitochondrial genome, was performed. Transgenic MCF-7 cells over-expressing
HA-HMGA1 were crosslinked with formaldehyde and fractionated to collect
54

mitochondria. Sonication of mitochondrial lysates was then optimized to achieve
approximately 500 bp protein/DNA complex fragments prior to pull down with a
polyclonal anti-HMGA1 antibody, pre-immune IgG’s (non-specific), or with no antibody.
Following protein digestion and DNA isolation, PCR was performed using primer sets
specific for two different regions of the mitochondrial D-loop. Primer design was based
on sequence analysis to identify potential AT-rich HMGA1 binding sites (Fig. 2.9A).
Modified ChIP analyses of the regions flanked by primer set 1 within the D-loop
region detected the expected diagnostic PCR amplified band in the samples containing
total cellular DNA, input DNA before antibody pull down and, most importantly, in
samples specifically immunoprecipitated with anti-HMGA1 antibody (Fig. 2.9B). In
marked contrast to these results, ChIP assays performed with primer set 2 which flanked
multiple potential HMGA1 binding sites in the D-loop region (Fig. 2.9A) did not result in
any detectable DNA amplification in the anti-HMGA1 pull down sample (Fig. 2.9B). As
expected, negative control samples without added antibody, with non-specific antibody,
or with pre-immune IgG’s showed no DNA amplification (Fig. 2.9B; data not shown).
Additional control ChIP assays utilizing total transgenic MCF-7 cell lysates and primers
specific for the hypoxanthine-guanine phosphoribosyltransferase (HPRT) promoter,
which lacks significant AT rich sequences and is not known to be regulated by HMGA1,
were also recently performed in the laboratory. Results of these control assays showed
that when crosslinked DNA protein complexes were probed with the same anti-HMGA1
antibody used in the current study, no HPRT promoter DNA was pulled down (Treff et
al., 2004). This further demonstrated that the ChIP protocol employed was effective at
specifically identifying only regions of DNA bound by HMGA1 proteins in both the
55
nucleus and mitochondria of living cells. In order to ensure that over-expression of the
HA-tagged HMGA1 protein was not the cause of mitochondrial internalization and DNA
binding, the protocol was also performed on parental, non-transgenic, MCF-7 cells using
the same antibody to endogenous HMGA1 (Fig. 2.9B). Amplification with primer set 1
was positive in this anti-HMGA1 pull down assay, showing that endogenous protein
expressed at normal cellular levels was capable of mitochondrial internalization and
DNA binding.
Discussion
A number of studies have identified proteins that display changes in subcellular
localization as a function of cell cycle stage and/or stress. Several examples are the cell
cycle regulators, cyclin B1 and D1(Alt et al., 2000; Pines and Hunter, 1991), the DNA
repair protein APE-Ref1 (Tell et al., 2001), several tumor suppressors including BRCA1
(Coene et al., 2005) and p53 (Fabbro and Henderson, 2003), as well as the nuclear orphan
receptor, TR3 (Li et al., 2000). Some of these proteins, such as p53 and TR3, that
translocate from the nucleus to the mitochondria during the induction of apoptosis,
essentially abandon their primary role for a time and take on entirely distinct roles in the
cell (Li et al., 2000; Marchenko et al., 2000). Consistent with these studies, we report
here on the unexpected translocation of the HMGA1 proteins from the nucleus, where
they act as dynamic transcription factors, to the cytoplasm and mitochondria. Such
changes appear to be related to cell cycle stage in NIH3T3 cells (Fig. 2.2). Similar in situ
immunolocalization observations have also been made for HMGA1 redistribution in
murine CTLL2 cells synchronized by interleukin-2 starvation (unpublished data),
56

suggesting that a cell cycle mechanism may exist in different mammalian cell types. At
this point, further studies are being performed to look more closely at cell cycle stage
dependence. To that end, initial live cell imaging results obtained in NIH3T3 cells
transiently expressing an HMGA1-GFP fusion protein indicate that the subcellular
translocation of HMGA1 is rapid and reversible, initiating with an outward movement of
the fusion protein from the nucleus to the cytoplasm (unpublished observation).
The mechanism by which HMGA1 proteins undergo subcellular translocation is
unclear, but several characteristics of these small basic proteins allow for some
speculation. Nuclear import of HMGA1 proteins via nuclear pores is likely given the
presence of a number of amino acid sequences (Evans et al., 1992; Johnson et al., 1988)
that have the potential to act as nuclear localization signals (NLS). While computer
based protein sequence analysis shows the lack of a typical nuclear export signal (NES)
for HMGA1, there is evidence for the NLS mediated outward movement of proteins from
the nucleus (Guiochon-Mantel et al., 1994). Therefore, the nuclear import sequences
could also be important for HMGA1 nuclear export. However, it is possible that
chaperone proteins may also be involved in the transport process in the absence of a
typical NES. As alluded to in the introduction, HMGA1 post-translational biochemical
modifications might also have the potential to regulate the process of transport in any of
the above situations. We are beginning to explore these possibilities and further describe
the mechanism and regulation of HMGA1 subcellular localization changes.
Mitochondrial transport pathways used by HMGA1 to gain access to the interior matrix
(Figs. 2.4-2.6) are difficult to predict at this point. Most nucleus-encoded proteins that
translocate to, and function within, the mitochondria contain N-terminal presequences
57
that are recognized by receptor complexes in the outer (TOM complex) and inner (TIM
complex) membranes (Neupert, 1997; Roise and Schatz, 1988; Schatz, 1996). HMGA1,
like approximately 30% of nucleus-encoded mitochondrial proteins, does not have such a
sequence. In particular, none of the known outer membrane proteins, a number of the
inner membrane proteins, and two matrix proteins (2-isopropylmalate synthetase and 3-
oxoacyl-CoA thiolase) lack typical N-terminal presequences (Hartl et al., 1989). Such
proteins often possess varying internal targeting signals that facilitate organelle entry,
while the mechanism of transport for others is unknown (Diekert et al, 1999).
Imported mitochondrial proteins do possess some general characteristics,
however, and can be placed into three main categories (Hartl et al., 1989; Hartl and
Neupert, 1990; Hoogenraad et al., 2002; Verner and Schatz, 1988). First, they have an
internal amino acid sequence composed of a relatively hydrophobic, hydroxyl-containing
region, flanked by positively charged residues. This sequence is specifically recognized
by the mitochondrial import system. Second, they must be soluble in the cytosol. And
third, they have to assume an unfolded conformation that is suited for translocation into
or across membranes. In this regard, it is notable that HMGA1 proteins are quite soluble,
even in dilute acids (Elton and Reeves, 1985), and have little, if any, folded secondary
structure while free in solution (Huth et al., 1997). Furthermore, HMGA1 proteins
contain an internal stretch of 11 relatively hydrophobic amino acids flanked by positively
charged residues that is quite similar in composition to the mitochondrial-directing
sequences of the matrix-localized 2-isopropylmalate synthetase and 3-oxoacyl-CoA
thiolase proteins (Hartl et al., 1989). The involvement of this internal region of the
HMGA1 proteins in the process of mitochondrial targeting remains to be determined.
58

Based on the cumulative evidence presented here, HMGA1 proteins internalize
into the mitochondria and maintain their typical function as DNA binding proteins. As
flexible dynamic proteins that regulate a host of nuclear genes, it is reasonable to assume
a similar role within the mitochondria, where the genomic DNA is known to be high in
AT content (Bibb et al., 1981). Transcriptional regulation of genes within the
mitochondria is primarily mediated by mitochondrial transcription factor A (Tfam), a
protein factor that contains a high mobility group (HMG) box DNA binding motif
(Clayton, 1992; Parisi and Clayton, 1991). It is of interest to note that the region we
identified as bound by HMGA1 by ChIP analyses (Fig. 2.9) is the same as that shown to
contain binding sites for Tfam (Fisher et al., 1992). While HMGA1 could potentially act
in concert with this transcription factor to increase mitochondrial gene expression, it is
also possible that a competitive relationship exists. This is primarily due to the fact that
the AT-hook motif of HMGA1 proteins is known to bind with a higher affinity to DNA
regions also recognized by HMG box proteins and, as a consequence, will out-compete
them for, or displace them from, substrate binding (Hill et al., 1999; Hill and Reeves,
1997). Such a competitive role for HMGA1 within the mitochondria may serve the
purpose of regulating mitochondrial biogenesis, as this process is intimately coupled to
the transcription of endogenous genes (Siedel-Rogol and Shadel 2002). This raises the
possibility that HMGA1 proteins play an integral part in the control of mitochondrial
metabolism and/or maintenance within dividing cells.
Currently, only a small number of proteins have been demonstrated to bind
specifically to the D-loop in vivo (i.e., TFAM, TFB1M, and TFB2M (Kelly and
Scarpulla, 2004)) and all have been shown to control transcription and/or replication of
59
mitochondrial genes. Because there are still gaps in the current understanding of how
replication and transcription of the mitochondrial genome is controlled, the addition of
HMGA1 to the D-loop binding repertoire is extremely important for a complete
understanding of how mitochondrial function is regulated. Furthermore, to our
knowledge, the findings reported here represent the first example of a known nuclear
transcription factor that localizes to, and maintains its primary DNA-binding activities
within, the mitochondria. Therefore, it is possible that the HMGA1 proteins are active in
coordinating nuclear and mitochondrial processes during different cellular events
including but not limited to cell cycle progress. Finally, the results of this research
extend a common emerging theme in the literature. That is, an increasing number of
proteins (described above) that have previously been regarded as compartmentalized and
restricted to a particular function actually are much more dynamic in both their
subcellular movements and their biological functions. In the case of HMGA1, such
previously unrecognized subcellular localization patterns have the potential to open up
new areas of research concerning mechanisms by which these proteins mediate cellular
proliferation and cancerous progression, and now, regulate mitochondrial function.
Acknowledgments
We would like to thank Drs. J. Disney and K. Johnson for their technical
assistance in the early stages of this work. Electron and confocal microscopy was
conducted by the authors at the WSU Electron Microcopy Center, with much appreciated
assistance from Christine Davitt. Initial GFP live cell imaging studies were performed in
the laboratory of Dr. Eric Shelden. We also thank Dr. Jennifer Adair, Dr. Dale Edberg,
60

and Robert Fisher for technical support and/or manuscript review. The research was
supported, in part, by NIH grants R01-GM46352 and R01-CA104470 (to RR) and NIH
grant R01-CA030720 (to NSM).
61

Figures
Figure 2.1. Intracellular immunolocalization of HMGA1 proteins in proliferating
populations of NIH3T3 cells. Adherent mouse NIH3T3 cells were fixed and treated with
polyclonal rabbit anti-HMGA1 and goat anti-rabbit IgG’s conjugated with Oregon Green.
Panel A: Cells exhibiting primarily nuclear fluorescence. A1: Digital zoom of a select
cell showing nuclear fluorescence. Panel B: Cells exhibiting increased cytoplasmic and
mitochondrial fluorescence. B1: Digital zoom of a select cell showing strong nuclear and
cytoplasmic fluorescence. B2: Digital zoom of a select cell showing decreased nuclear
and strong cytoplasmic/mitochondrial fluorescence. 600X total optical magnification.
62

Figure 2.1
63

Figure 2.2. Panel A: Flow cytometric DNA content analysis showing partial
synchronization of NIH3T3 cultures. Histogram plots of DNA content analysis were
generated and used to determine the percent of cells with a particular content of DNA
where cells containing 2N DNA represented the G1 stage and those with 4N DNA the
G2/M stage. Cells in between these two extremes were considered in the S phase. The
Y-axis represents percent gated cells in a particular cell cycle stage and the X-axis
represents the time point following contact inhibition release. Panels B and C:
Immunolocalization of HMGA1 proteins in partially synchronized NIH3T3 cells at
different stages of the cell cycle. At selected times post-seeding, cells were fixed and
treated with polyclonal rabbit anti-HMGA1 and goat anti-rabbit IgG’s conjugated with
Oregon Green (white). Panel B shows five different cells from populations at the
following times post-seeding: 12 hr; 14 hr; 16 hr; 17 hr. See text for descriptions. 600X
total magnification. Panel C represents flow cytometric DNA content analysis of
parallel synchronized cell populations as verification of cell cycle stage. Histogram plots
were generated from cells fixed and stained with propidium iodide at different time
points following contact inhibition release: 12 hr; 17 hr; 22 hr. Histogram peaks
represent numbers of cells (counts; y axis) at a particular fluorescence intensity (DNA
content; x axis).
64
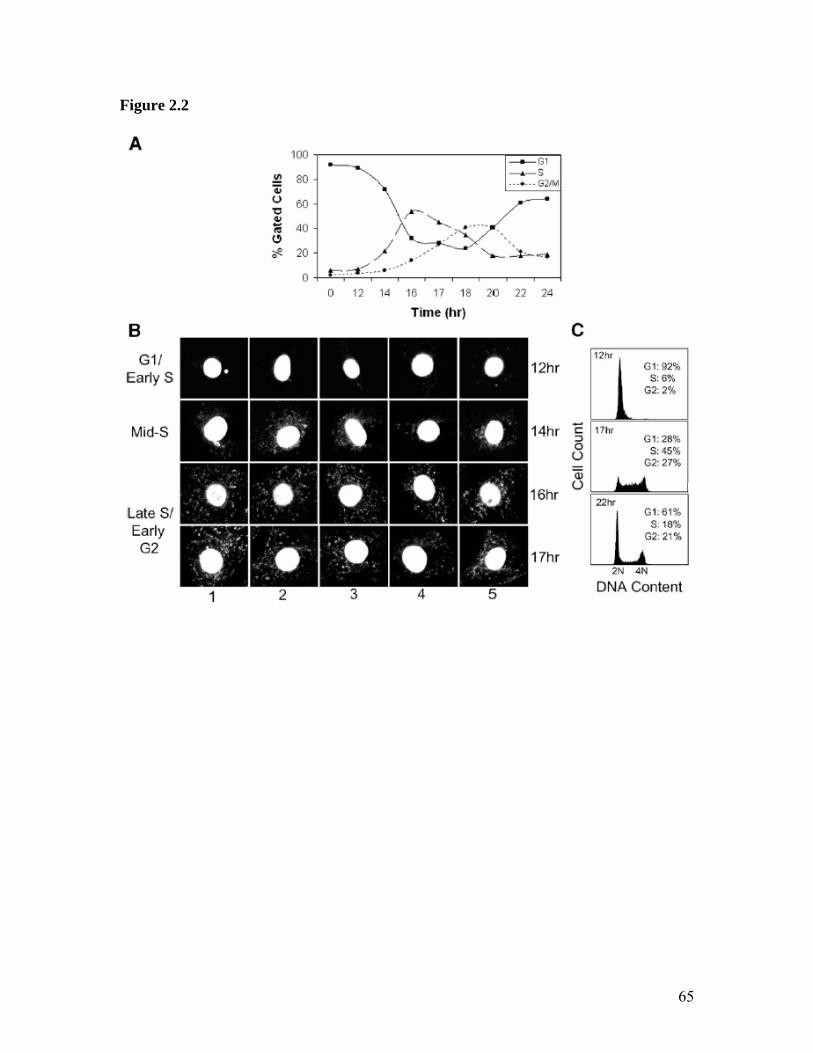
Figure 2.2
65

Figure 2.3: Co-localization of HMGA1 with Mitochondria in NIH3T3 cells 16-18 hours
post-synchronization. Cells were treated with Mito Tracker Red followed by fixation and
probing with anti-HMGA1 and goat anti-rabbit IgG’s conjugated with Oregon Green.
Panel A: HMGA1 signal (green). Panel B: Mitochondrial signal (red). Panel C:
Merged image of the two channels where co-localization is indicated by a color change
(yellow/orange). 600X total magnification.
66

Figure 2.3
67

Figure 2.4: Control and specificity experiments for electron microscopic immunogold
localization studies of HMGA1 proteins in partially synchronized NIH3T3 cells 16-18
hours post-synchronization. Panel A: Control normal, non-immune, serum showing low
background and the lack of specific labeling. Panel B: Anti-HMGA1 antiserum showing
primarily nuclear and mitochondrial labeling with some cytoplasmic signal. Panel C:
Competition experiment in which pure reverse phase HPLC-purified HMGA1 protein
(400 µg/ml) was added to anti-HMGA1 antiserum prior to reaction with NIH3T3 cells.
Panel D: Nuclear pattern of labeling observed with anti-histone monoclonal antibody.
Key: N, nucleus; C, cytoplasm; M, mitochondria. Bar, 1 µm.
68

Figure 2.4
69

Figure 2.5: General pattern and distribution of anti-HMGA1 immunogold labeling of
thin sections of NIH3T3 cells 16-18 hours post-synchronization. Panels A-D: Low
magnification photographs of different cells showing distribution of immunogold
labeling between cell compartments. Labeling of the nucleus and mitochondria is the
strongest with less in the general cytoplasm. Note that the majority of the mitochondrial
gold labeling appears to be internal. Key: as in Fig. 6. Bar, 0.5 µm.
70

Figure 2.5
71

Figure 2.6: High magnification photographs of mitochondrial HMGA1 immunogold
labeling in NIH3T3 cells 16-18 hours post-synchronization. See text for discussion. Bar,
0.5 µm (A and D); 0.25 µm (B and C).
72
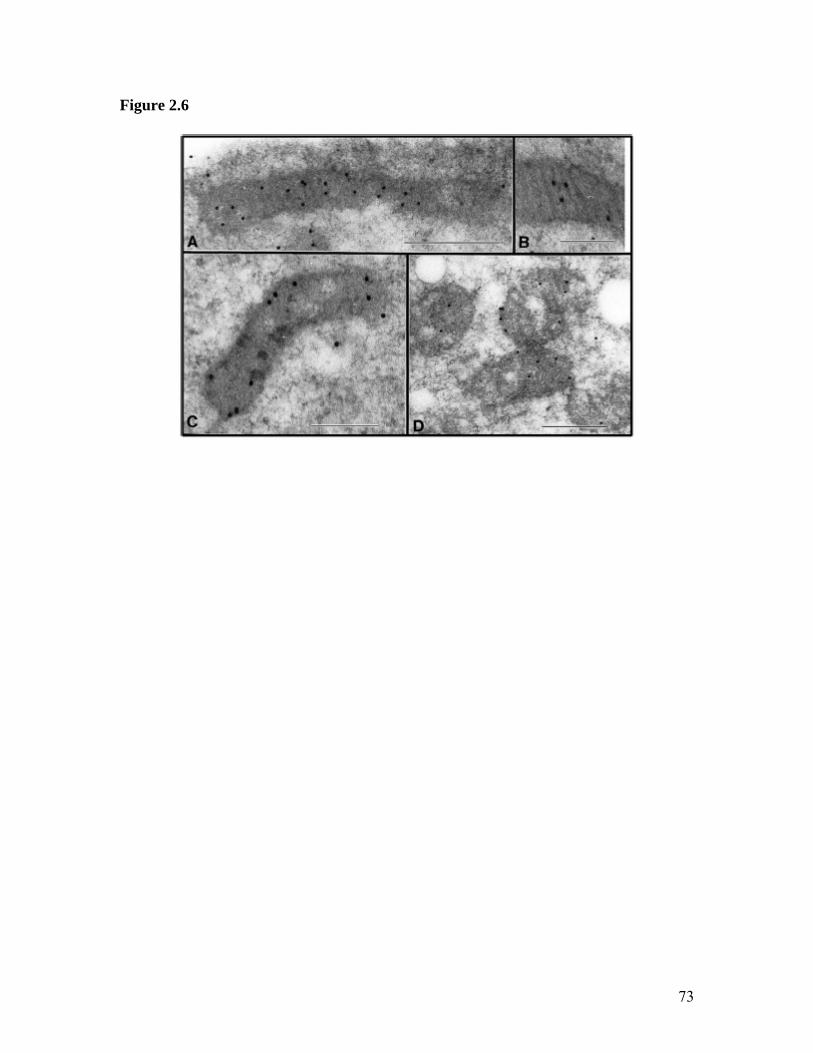
Figure 2.6
73

Figure 2.7: Indirect immunofluorescence analysis of transgenic HA-HMGA1a proteins
in MCF-7 breast epithelial cells. Cells were labeled with mouse anti-HA tag/anti-mouse
Oregon Green (Panel A) or rabbit anti-HMGA1/anti-rabbit Oregon Green (Panel B). As
a negative control samples were treated with the Oregon Green conjugated secondary
antibody alone (Panel C). 600X total magnification.
74
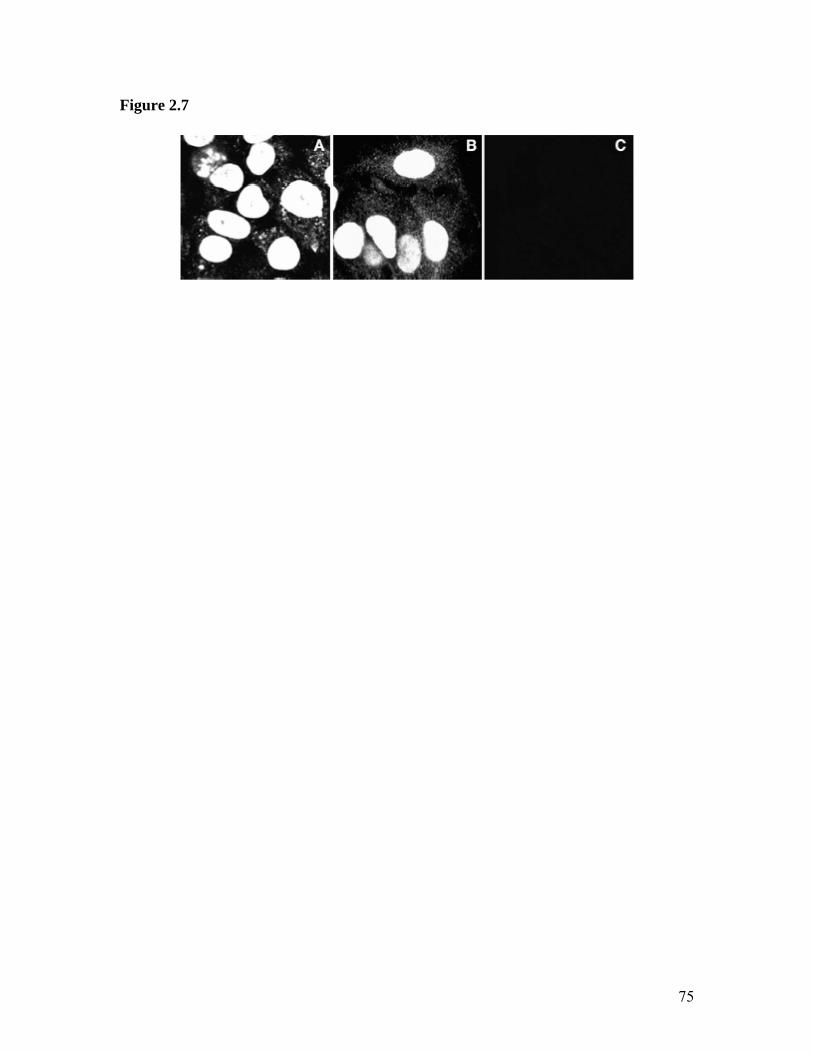
Figure 2.7
75
Figure 2.8: Western blot analysis of transgenic MCF-7 subcellular fractions using
affinity purified polyclonal anti-HMGA1 and monoclonal anti-HA tag antibodies.
Transgenic HMGA1 is shown in the cytoplasm and mitochondria of normally dividing
MCF-7 cells by separate probes used on separate sample sets. In both cases, membranes
were simultaneously treated with anti-Histone H1 antibody to demonstrate that nuclear
contaminants were absent from the cytoplasmic and mitochondrial fractions.
Mitochondrial enrichment was verified with an antibody to a 65 kDa mitochondrial outer
membrane protein (anti-mito). A lack of cytosolic protein contamination in the
mitochondrial fraction was shown by probing with an anti-phosphoMEK1/2 antibody.
Note: The ‘Nucleus/Whole Cell’ fraction is primarily sedimented nuclei but also contains
whole cells that were not completely lysed during the homogenization step of the
fractionation protocol.
76
Figure 2.8
77

Figure 2.9: HMGA1 binds in vivo to the control D-loop region of the mitochondrial
genome as determined by a modified “ChIP” protocol. Panel A: Mitochondrial D-loop
sequence showing primer sets used for analysis, AT rich regions (dashed boxes),
potential HMGA1 binding sites (solid boxes), and the heavy (HSP) and light (LSP) strand
promoter sequences. Panel B: PCR sample analysis showing amplification of the
desired product size in the anti-HMGA1 pull down sample with primer set 1 but not 2.
Positive results are shown for both the transgenic HA-tagged HMGA1 over-expressing
MCF-7 cells and the parental MCF-7 cells expressing normal levels of HMGA1. DNA
sample lane descriptions are as follows. ‘Whole cell DNA’: samples isolated from total
Jurkat cell lysates as an independent positive control. ‘Input’: samples isolated from
mitochondrial lysates prior to antibody pull down as an internal positive control. ‘No
antibody’, ‘non-specific’, and ‘anti-HMGA1’: samples isolated after pull down with no
antibody, preimmune IgG’s, or polyclonal anti-HMGA1, respectively.
78

Figure 2.9
79

Figure 2.1S. Bar graph showing a 3-fold increase in the number of mitochondrial
immunogold particles per unit area versus total cell particles per unit area. Total cell and
mitochondrial regions counted were selected in Adobe Photoshop and the number of
pixels within the selected area recorded. The X-axis represents pixels*1000 where 50
was used as an arbitrary unit of area. The Y-axis represents the number of immunogold
particles.
80
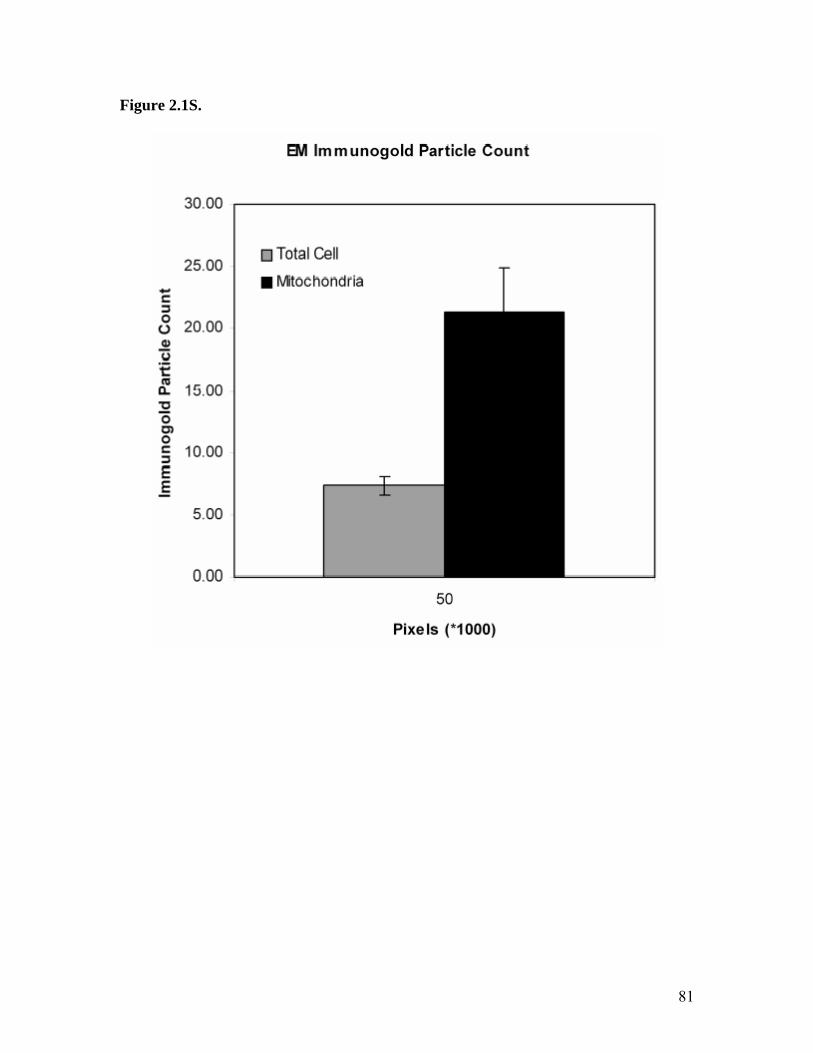
Figure 2.1S.
81
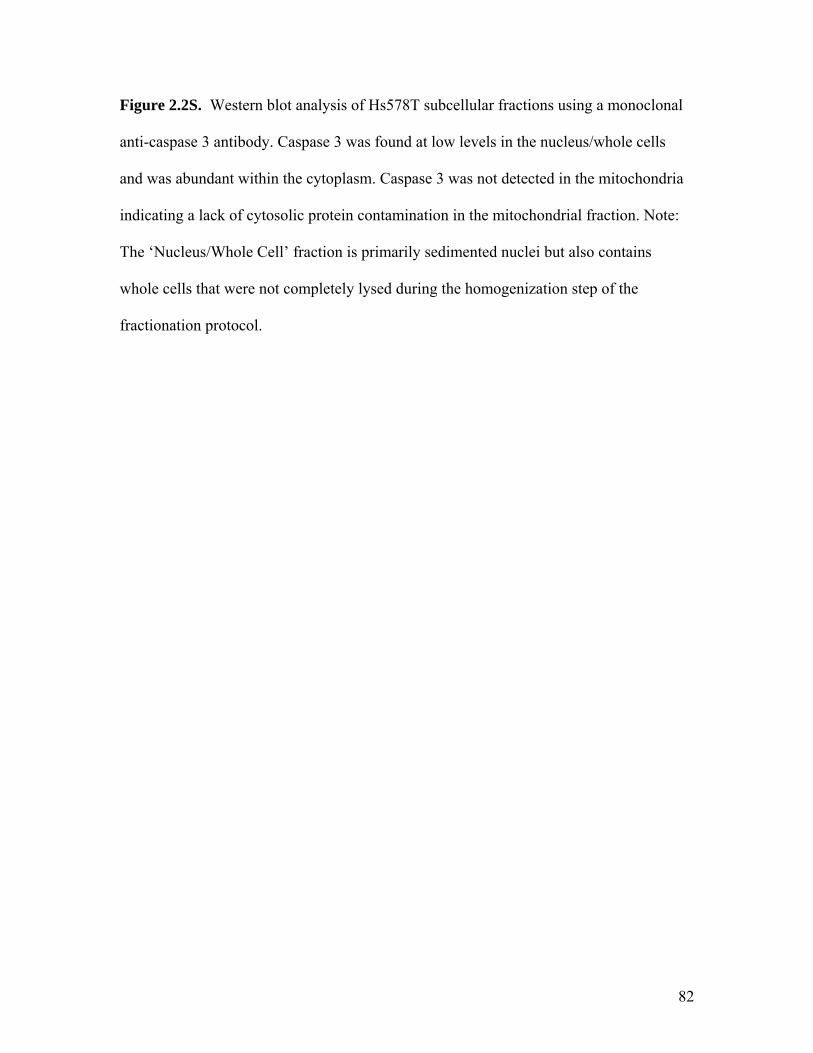
Figure 2.2S. Western blot analysis of Hs578T subcellular fractions using a monoclonal
anti-caspase 3 antibody. Caspase 3 was found at low levels in the nucleus/whole cells
and was abundant within the cytoplasm. Caspase 3 was not detected in the mitochondria
indicating a lack of cytosolic protein contamination in the mitochondrial fraction. Note:
The ‘Nucleus/Whole Cell’ fraction is primarily sedimented nuclei but also contains
whole cells that were not completely lysed during the homogenization step of the
fractionation protocol.
82

Figure 2.2S.
83

References
Alt, J.R., J.L. Cleveland, M. Hannink, and J.A. Diehl. 2000. Phosphorylation-dependent regulation of cyclin D1 nuclear export and cyclin D1-dependent cellular transformation. Genes Dev. 14:3102-3114. Amirand, C., A. Viari, J.P. Ballini, H. Rezaei, N. Beaujean, D. Jullien, E. Kas, and P. Debey. 1998. Three distinct sub-nuclear populations of HMG-I protein of different properties revealed by co-localization image analysis. J. Cell Sci. 111:3551-3561. Aravind L., and D. Landsman. 1998. AT-hook motifs identified in a wide variety of DNA-binding proteins. Nucleic Acids Res. 26:4413-4421. Banks, G.C, Y. Li and R. Reeves. 2000. Differential in vivo modifications of the HMGI(Y) nonhistone chromatin proteins modulate nucleosome and DNA interactions. Biochem. 39:8333-8346. Bibb, M.J., R.A. Van Etten, C.T. Wright, M.W. Walberg, D.A. Clayton. 1981. Sequence and gene organization of mouse mitochondrial DNA. Cell 2:167-80. Chen, J. D.P. Silver, D. Walpita, S.B. Cantor, A.F. Gazdar, G. Tomlinson, F.J. Couch, B.L. Weber, T. Ashley, D.M. Livingston, and R. Scully. 1998. Stable interaction between the products of the BRCA1 and BRCA2 tumor suppressor genes in mitotic and meiotic cells. Mol.Cell 2:317-328. Clayton, D.A. 1992. Transcription and replication of animal mitochondrial DNAs. Int Rev Cytol. 141:217-32. Coene, E.D., M.S. Hollinshead, A.A. Waeytens, V.R. Schelfhout, W.P. Eechaute, M.K. Shaw, P.M. Van Oostveldt, D.J. Vaux. 2005. Phosphorylated BRCA1 is predominantly located in the nucleus and mitochondria. Mol. Biol. Cell 16:997-1010. Diekert, K., G. Kispal, B. Guiard, and R. Lill. 1999. An internal targeting signal directing proteins into the mitochondrial intermembrane space. Proc. Natl. Acad. Sci. USA 96:11752-11757. Disney, J.E., K.R. Johnson, N.S. Magnuson, S.R. Sylvester, and R. Reeves. 1989. High-mobility group protein HMG-I localizes to G/Q- and C-bands of human and mouse chromosomes. J.Cell Biol. 109:1975-1982. Edberg, D.D, J.E. Bruce, W.F. Siems, and R. Reeves. 2004. In vivo post-translational modifications of the High Mobility Group A1a proteins in breast cancer cells of differing metastatic potential. Biochem. 43:11500-11515. Elton, T.S. and R. Reeves. 1985. Purification and postsynthetic modifications of Friend erythroleukemic cell high mobility group protein HMG-I. Anal. Biochem. 157:53-62.
84

Evans, J.N., M.S. Nissen, and R. Reeves. 1992. Assignment of the 1H NMR spectrum of a consensus DNA-binding peptide from the HMG-I protein. Bull. Mag. Reson. 14:171-174. Evans, J.N., J. Jajicek, M.S. Nissen, G. Munske, V. Smith, and R. Reeves. 1995. 1H and 13C NMR assignments and molecular modeling of a minor groove DNA-binding peptide from the HMG-I protein. Int. J. Pept. Protein. Res. 45:554-560. Fabbro, M., and B.R. Henderson. 2003. Regulation of tumor suppressors by nuclear-cytoplasmic shuttling. Exp. Cell. Res. 282:59-69. Fisher, R.P., T. Lisowsky, M.A. Parisi, and D.A. Clayton. 1992. DNA wraping and bending by a mitochondrial high mobility group-like transcriptional activator protein, J.Biol. Chem. 267:3358-3367. Guiochon-Mantel, A., K. DeLabre, P. Lescop, and E. Milgrom. 1994. Nuclear localization signals also mediate the outward movement of proteins from the nucleus. Proc. Natl. Acad. Sci. USA 91:7179-7183. Harlow, E. and D. Lane, Antibodies: A Laboratory Manual. 1988. Cold Spring Harbor, New York. 726 pp. Harrer, M., H. Luhrs, M. Bustin, U. Scheer, and R. Hock. 2004. Dynamic interaction of HMGA1a proteins with chromatin. J. Cell. Sci. 117:3459-3471. Hartl F.U., and W. Neupert. 1990. Protein sorting to mitochondria: evolutionary conservations of folding and assembly. Science 247:930-938. Hartl, F.U., N. Pfanner, D.W. Nicholson, and W. Neupert. 1989. Mitochondrial protein import. Biochim. Biophys. Acta 988:1-45. Hill, D.A., M.L. Pedulla, and R. Reeves. 1999. Directional binding of HMG-I(Y) on four-way junction DNA and the molecular basis for competitive binding with HMG-1 and histone H1, Nucl. Acids Res. 27:2135-2144. Hill, D. and R. Reeves. 1997. Competition between HMG-I(Y), HMG-1 and histone H1 on four-way junction DNA. Nucl. Acids Res. 25:3523-3531. Hoogenraad, N.J., L.A. Ward, and M.T. Ryan. 2002. Import and assembly of proteins into mitochondria of mammalian cells. Biochim. Biophys. Acta 1592:97-105. Huth, J.R., C.A. Bewley, M.S. Nissen, J.N. Evans, R. Reeves, A.M. Gronenborn, and G.M. Clore. 1997. The solution structure of an HMG-I(Y)-DNA complex defines a new architectural minor groove binding motif. Nat.Struct.Biol. 8:657-665.
85
Johnson, K.R., D.A. Lehn, T.S. Elton, P.J. Barr, and R. Reeves. 1988. The chromosomal high mobility group protein HMG-I(Y): complete murine cDNA sequence, genomic structure and tissue expression. J. Biol.Chem. 263:18338-18342. Johnson, K.R., D.A. Lehn, and R. Reeves. 1989. Alternative processing of mRNA’s encoding mammalian chromosomal high-mobility-group proteins HMG-I and HMG-Y. Mol. Cell. Biol. 9:2114-2123. Kelly, D.P. and R.C. Scarpulla. 2004. Transcriptional regulatory circuits controlling mitochondrial biogenesis and function. Genes & Dev. 18:357-368. Lehn, D.A., T.S. Elton, K.R. Johnson, and R. Reeves. 1988. A conformational study of the sequence specific binding of HMG-I(Y) with the bovine interleukin-2 cDNA. Biochem. Int. 16:963-971. Li, H., S.K. Kolluri, J. Gu, M.I. Dawson, X. Cao, P.D. Hobbs, B. Lin, G. Chen, J. Lu, F. Lin, Z. Xie, J.A. Fontana, J.C. Reed,and X. Zhang. 2000. Cytochrome c release and apoptosis induced by mitochondrial targeting of nuclear orphan receptor TR3. Science 289:1159-1164. Lund, T., M. Holtlund, M. Fredrickson, and S.G. Laland. 1983. On the presence of two new high mobility group-like proteins in HeLa S3 Cells. FEBS (Fed. Eur. Biochem. Soc.) Lett. 152:163-167. Marchenko, N.D., A. Zaika, and U.M. Moll, Death signal-induced localization of p53 protein to mitochondria. J. Biol. Chem. 275:16202-16212. Miller, T.J. and O.J. Stone. 1978. The rapid isolation of ribonuclease-free immunoglobin G by protein A-sepharose affinity chromatography. J. Immunol. Meths. 24:111-125. Neupert, W. Protein import into mitochondria. 1997. Annu. Rev. Biochem. 66:863-917. Nissen, M.S., T.A. Langan, and R. Reeves. 1991. Phosphorylation by cdc2 kinase modulates DNA binding activity of high mobility group protein I nonhistone chromatin protein. J. Biol. Chem. 266:19945-19952. Parisi, M.A. and D.A. Clayton. 1991. Similarity of human mitochondrial transcription factor 1 to high mobility group proteins. Science 252:965-969. Pines, J. and T. Hunter. 1992. Human cyclins A and B1 are differentially located in the cell and undergo cell cycle-dependent nuclear transport. J. Cell. Biol. 115:1-17. Radic, M.Z., M. Saghbini, T.S. Elton, R. Reeves, and B.A. Hamkalo. 1992. Hoechst 33258, distamycin A, and high mobility group protein I (HMG-I) compete for binding to mouse satellite DNA. Chromosoma 101:602-608.
86

Roise, D. and G. Schatz. 1988. Mitochondrial presequences. J. Biol. Chem. 263:4509-4511. Reeves, R. 2001. Molecular biology of HMGA proteins: hubs of nuclear function. Gene 277:63-81. Reeves, R., and L. Beckerbauer. 2001. HMGI/Y proteins: flexible regulators of transcription and chromatin structure. Biochem. Biophys. Acta 1519:13-29. Reeves, R., D.D. Edberg, and Y. Li. 2001. Architectural transcription factor HMGI(Y) promotes tumor progression and mesenchymal transition of human epithelial cells. Mol. Cell.Biol. 21:575-594. Reeves, R., T.S. Elton, M.S. Nissen, D. Lehn, and K.R. Johnson. 1987. Post-transcriptional gene regulation and specific binding of the nonhistone protein HMG-I by the 3’ untranslated region of bovine interleukin 2 cDNA. Proc. Natl. Acad. Sci. USA 84:6531-6535. Reeves, R., T.A. Langan, and M.S. Nissen. 1991. Phosphorylation of the DNA-binding domain of nonhistone high-mobility-group I protein by cdc2 kinase: reduction of binding affinity. Proc. Natl. Acad. Sci. USA 88:1671-1675. Reeves, R., and M. S. Nissen. 1990. The AT-DNA-binding domain of mammalian high mobility group I chromosomal proteins: a novel peptide motif for recognizing DNA structure, J. Biol. Chem. 265:8573-8582. Reeves, R., and M.S. Nissen. 1995. Cell cycle regulation and functions of HMG-I(Y). Prog. Cell Cycle Res. 1:337-347. Saitoh, Y. and U.K. Laemmli. 1994. Methaphase chromosome structure: bands arise from a differential folding path of the highly AT-rich scaffold. Cell 79:609-622. Schatz, G. 1996. The protein import system of mitochondria. J. Biol. Chem. 271:31763-31766. Siedel-Rogol, B.L. and G.S. Shadel. 2002. Modulation of mitochondrial transcription in response to mtDNA depletion and repletion in HeLa cells. Nucleic Acids Res. 30:1929-1934. Solomon, M., F. Strauss, and A. Varshavsky, A mammalian high mobility group protein recognizes any stretch of six A-T base pairs in duplex DNA, Proc. Natl. Acad. Sci. USA 83 (1986) 1276-1280. Strauss, F. and A. Varshavsky. 1984. A protein binds to a satellite DNA repeat at three specific sites that would be brought into mutual proximity by DNA folding in the nucleosome. Cell 37:889-901.
87

Tell, G., C. Enrico, A. Pines, I. Paron, C. Pucillo, G. Manzini, A. Bandiera, M.R. Kelley, C.D. Loreto, and G. Damante. Mitochondrial localization of APE/Ref-1 in thyroid cells. Mut. Res. 485:143-152. Treff, N.R., G.A. Dement, J.E. Adair, R.L. Britt, R. Nie, J.E. Shima, W.E. Taylor, and R. Reeves. 2004. Human KIT ligand is positively regulated by HMGA1 in breast and ovarian cancer cells. Oncogene 23:8557-62. Verner K. and G. Schatz. Protein translocation across membranes. Science 241:1307-1313. Wegner M. and F. Grummt. 1990. Netropsin, distamycin and berenil interact differentially with a high-affinity binding site for the high mobility group protein HMG-I. Biochem. Biophys. Res. Commun. 166:1110-1117. Zhao, K., E. Kas, E. Gonzalez, and U.K. Laemmli. 1993. SAR-dependent mobilization of histone H1 by HMGI/Y in vitro: HMGI/Y is enriched in H1-depleted chromatin. EMBO J. 12:3237-3247.
88

CHAPTER 3
HMGA1 Proteins Act as Transcriptional Regulators within the
Mitochondria and Alter Overall Organelle Related Cellular Function
89

Abstract
Recent novel localization findings from our lab placed HMGA1 proteins into the
complex milieu of the mitochondria and raised the intriguing possibility that these
classically nuclear transcriptional regulators may play similar roles within the
mitochondria. Normally functioning to either up- or down-regulate genes within the
nucleus containing promoter and enhancer regions that are high in AT content, the
HMGA1 proteins were not surprisingly found to be capable of binding to the highly AT
rich mitochondrial genome at a particular control region referred to as the D-loop. In
order to elucidate the specific functional role that HMGA1 may be playing in the
mitochondria at this D-loop region, we employed several experimental methods to
analyze mitochondrial gene transcription and replication, as well as overall organelle
related cellular function. Utilizing real-time PCR, it was determined that in transgenic
MCF-7 cells (HA7C) over-expressing an HA-tagged HMGA1 fusion protein,
mitochondrial DNA (mtDNA) levels were reduced by approximately 2-fold relative to
wild-type MCF-7 cells while the mitochondrial NADH Dehydrogenase 2 gene transcript
was up-regulated approximately 4-fold. Corresponding to reduced mtDNA levels, flow
cytometric analysis revealed that overall mitochondrial mass was reduced in these cells as
well. Revealing a possible effect of the organelle changes, cell survival studies showed
an increased sensitivity of the HA7C cells to treatment with an inhibitor of glycolysis, 2-
deoxy-D-glucose, indicating an overall deficiency in cellular oxidative phosphorylation.
Finally, preliminary studies utilizing a unique quantitative PCR method revealed that
HMGA1 in the mitochondria may negatively effect the ability of the organelle to repair
reactive oxygen species (ROS) induced DNA damage. Together, these observations are
90

consistent with previously described cancer phenotypes and reveal several possible
mechanisms by which mitochondrial HMGA1 may affect tumor progression or other
normal or disease related mitochondrial processes.
Key Words: High Mobility Group; MCF-7; Mitochondria; D-loop; transcription factor;
NADH Dehydrogenase subunit 2; glycolysis; oxidative phosphorylation; reactive oxygen
species (ROS); mtDNA damage.
91
Introduction
Mammalian high mobility group A1 (HMGA1) proteins have been established as
dynamic regulators of transcription within the nucleus where they alter global and local
chromatin structure to induce or inhibit gene expression in response to multiple external
and internal cell stimuli (reviewed in Reeves, 2001). Such stimuli usually affect HMGA1
activity in part by causing their post-translational modification which results in changes
to the proteins ability to interact with different DNA and protein substrates (Banks et al.,
2000; Edberg et al., 2004; Reeves and Beckerbauer, 2001). Because of their small size
(10.6-12 kDa) (Lund et al., 1983), inherent flexibility (Lehn et al., 1988), and high levels
of post-translational modifications, the proteins are uniquely equipped to adapt and
function during a variety of biological processes and with multiple distinct substrate types
(Huth et al., 1997) in a highly regulated manner. Additionally, HMGA1 proteins are
unified by their possession of a versatile DNA binding motif called the AT-hook (Reeves
and Nissen, 1990). Each isoform resulting from alternative splicing of the HMGA1 gene
(Johnson et al., 1989; Reeves and Nissen, 1995) contains three separate AT-hooks that
allow the proteins to bind in a structurally specific manner within the minor groove of
AT-rich B-form DNA (Reeves and Nissen, 1990). This characteristic non-sequence
specific DNA binding is a major factor contributing to the proteins ability to bind to
multiple different gene substrates. Finally, the ability of HMGA1 to mediate protein-
protein interactions adds a level of regulated diversity to their activities displayed by their
numerous protein partners and multiple specific gene substrates (reviewed in Reeves and
Beckerbauer, 2001). Recently the number and type of molecular and cellular functions
for the HMGA1 proteins has expanded as a result of these unique characteristics.
92

Two recent studies out of our lab have revealed previously unrecognized
functions for the HMGA1 proteins. First, localization data showed that HMGA1
undergoes nucleocytoplasmic translocation and accumulates in the mitochondria where it
is able to bind to AT-rich DNA within the control D-loop region of the circular
mitochondrial genome (Dement et al., 2005, Chapter 2). Evidence suggests that the
protein moves in a cell-cycle dependent manner and that the movement is directional,
from the nucleus to the cytoplasm and back again. Correlative studies interestingly have
shown the specific post-translational phosphorylation of the HMGA1 proteins by cdc2
kinase during the late G2 stage of the cell cycle, the precise stage at which the
nucleocytoplasmic translocation was shown to occur (Reeves et al., 1991). This
phosphorylation was further shown to reduce the capacity of the proteins to bind to DNA
20-fold, indicating mobilization of the protein and a possible mechanism of translocation
initiation. Regardless of translocation mechanism, the mitochondrial localization of the
HMGA1 proteins opened new areas of research regarding possible organelle specific
functions for the proteins in respect to normal and abnormal cellular functions, including
cancer.
Specifically, as mentioned previously, the mitochondrial genome is quite AT-rich
(Bibb et al., 1981) and because HMGA1 was found associated with the control D-loop
region, the proteins likely play a role in expression and potentially replication of the
mtDNA as these processes are intimately coupled (Siedel-Rogol and Shadel 2002).
Furthermore, because HMGA1 proteins are major contributors to the process of
carcinogenesis, the many abnormalities being discovered in mitochondrial genome
stability and overall organelle, and organelle related, function associated with cancer
93

phenotypes are intriguing. Particularly, it has been shown that mtDNA levels in multiple
different cancer types are significantly altered as are the mitochondrial gene expression
profiles. For example, rat fibroblast cells immortalized by viral and cellular oncogenes
displayed activation of the mitochondrial genes for COXI, COXII, and 16S rRNA
(Glaichennhaus et al., 1986). Activation of genes for ATP6, ND5, cytochrome b, COXI,
and COXII was also observed in papillary thyroid carcinomas as compared to normal
thyroid tissue (Haugen et al., 2003). In fact, a general theme in the literature is the up-
regulation of mitochondrial gene expression in the context of a cancer phenotype, while
both increases and decreases in the levels of tumor cell mtDNA have been reported
(Torroni et al., 1990). However some studies do show reduction in gene activity in
certain cancer types such as glioblastomas (Dmitrenko et al., 2005). Many of these
changes in mtDNA expression and replication are thought to reflect mitochondrial
genomic adaptation to perturbations in cellular energy requirements (Penta et al., 2001).
However, changes to mitochondrial genomic expression and replication may precede
overall cellular metabolic abnormalities associated with cancer.
In fact, the role of mitochondria in carcinogenesis was first considered following
observation, in 1956, that rodent tumors exhibited reduced respiration-coupled oxidative
metabolism and increased glycolysis (Warburg et al., 1956). To date, these observations
have not been explained but the above studies suggest that changes to mitochondrial gene
expression profiles observed in cancer cells may be involved in this Warburg phenotype.
That is, deficiencies in the ability of a cell to perform oxidative phosphorylation,
resulting in a switch to a glycolytic phenotype, may be a result of abnormalities at the
mitochondrial genome level. Furthermore, such changes may result from changes in
94
expression levels of oncoproteins like HMGA1, that are over-expressed in cancers and
likely act as transcriptional regulators within the mitochondria. Another characteristic of
mitochondria within normal and cancer cells is the high level of mtDNA mutations
thought to be related to high level of reactive oxygen species (ROS) generated during
oxidative metabolism
In normal cells, it has been reported that the mutation rate of mtDNA is as much
as two orders of magnitude greater than that of nuclear DNA (Khrapko et al., 1997;
Marcelino and Thilly, 1999; Wang et al., 1997). Due to the lack of introns within
mtDNA, mutations occurring at this high rate likely occur in coding sequences. The
result is possible alterations to the expression levels of proteins involved in the electron
transport chain and increased ROS production leading to additional mutations and further
increases in ROS production. Such a progression of events has the potential to promote
carcinogenesis through the generation of persistent oxidative stress (Toyukuni et al.,
1995). This is consistent with studies showing specific mtDNA mutations within
multiple cancer types including breast (Bianchi et al., 1995), colorectal (Polyak, et al.,
1998), colon (Alonso, et al., 1997), kidney (Horton et al., 1996), and gastric (Tamura et
al., 1999) tissues. In fact, nearly 100 sites not related to other mitochondrial diseases
have been shown to be mutated in tumors (Fliss et al., 2000). While the increased
occurrence of mutations in the mitochondria of cancer cells may be due to persistent
oxidative stress alone, it is possible that a deficiency in the ability of the organelle to
repair the damaged DNA is a contributing factor.
A second recent study from our lab, mentioned above, revealed that the nucleotide
excision DNA repair pathway (NER) within the nucleus is inhibited in breast cancer
95

epithelial MCF-7 cells over-expressing the HMGA1 proteins (Adair et al., 2005).
Regarding a potential function for the HMGA1 proteins within the mitochondria, this
study suggests that a similar inhibition may exist in the presence of the ROS rich
organellar environment. Though UV- induced cyclobutane pyrimidine dimers are not
know to be repaired in the mitochondria via the NER pathway (Clayton et al., 1974),
recent studies support that DNA repair occurs in the mitochondria. These studies have
shown that base excision repair (BER) occurs in the mitochondria as simple
monofunctional alkylating agents are repaired efficiently from mtDNA (Pirsel and Bohr,
1993) and several DNA repair enzymes have been identified in the organelle. These
include AP endonucleases (reviewed in Croteau and Bohr, 1997), uracil DNA
glycosylase (Anderson and Friedberg, 1980), hOGG1 (Takao et al., 1998) and others.
In the current study, we explore the various possible functions that HMGA1
proteins may participate in within the mitochondria. It was hypothesized that the proteins
affect transcription/replication of the mtDNA and subsequently contribute to alterations
in the overall cellular mitochondrial content and metabolic function. Additionally, high
levels of mutations within mtDNA in cancer cells suggested that the over-expression of
HMGA1 within this context may lead to a deficiency in the ability of the mitochondria to
repair its DNA. Utilizing real-time PCR, it was determined that in transgenic MCF-7
cells (HA7C) over-expressing an HA-tagged HMGA1 fusion protein, mitochondrial
DNA (mtDNA) levels were reduced by approximately 2-fold relative to wild-type MCF-
7 cells while the mitochondrial NADH Dehydrogenase 2 gene transcript was up-
regulated approximately 4-fold . Corresponding to reduced mtDNA levels, flow
cytometric analysis revealed that overall mitochondrial mass was reduced in these cells as
96

well. Revealing a possible effect of the organelle changes, cell survival studies showed
an increased sensitivity of the HA7C cells to treatment with the inhibitor of glycolysis, 2-
deoxy-D-glucose, indicating an overall deficiency in cellular oxidative phosphorylation.
Finally, preliminary studies utilizing a unique quantitative PCR method revealed that
HMGA1 in the mitochondria may negatively effect the ability of the organelle to repair
reactive oxygen species induced DNA damage. Results and potential future work are
presented and discussed in the remainder of this chapter.
Materials and Methods
Cell Culture and Synchronization
The tetracycline-regulated M/tet (referred to as parental or MCF-7) and
M/tet/HA-I (referred to as transgenic or HA7C) human breast epithelial MCF-7 cells
were developed as described previously (Reeves et al., 2001). Briefly, the parental M/tet
(MCF-7/tet-off) cell line was purchased from Clontech, Palo Alto, CA. This cell line was
stably transfected with a plasmid vector (Clontech) containing the tetracycline response
element (pTRE) driving the expression of a hemaglutinnin (HA)-tagged HMGA1a
transgene to generate the M/tet/HA-I (HA7C) line. MCF-7 cells were cultured in DMEM
supplemented with 10% fetal bovine serum, penicillin (100 ug/ml), streptomycin (100
ug/ml), and G418 (100 ug/ml) to maintain selection of the tetracycline transactivator
protein gene. HA7C cells were maintained and selected in the same media as for the
MCF-7, and supplemented with hygromycin (100 ug/ml) for selection of clones
containing the HA-HMGA1a expression vector.
97

Quantitative real-time RT-PCR analysis
Real-time PCR was performed using Custom TaqMan® Gene Expression Assays
for mitochondrial and beta-globin DNA sequences and Assays-on-Demand for human
target genes, NADH Dehydrodegenase subunit 2 (ND2) (assay ID: Hs00846374_s1
MTND2) and HPRT1 (assay ID: Hs99999909_ml HPRT1) (Applied Biosystems, Foster
City, CA, USA). TRIzol and phenol choloroform extracted total cellular DNA was
isolated from MCF-7 and HA7C cells and 100 ng was used as template for real-time PCR
for analysis of mitochondrial DNA levels using the beta globin gene as an endogenous
control. Assays were performed in triplicate and repeated utilizing DNA isolation with
Genomic Tip/20 Columns (QIAGEN). For the analysis of the mitochondrial ND2 gene
using HPRT as the endogenous control, TRIzol extracted total RNA was purified using
an RNeasy Kit (QIAGEN) and reverse transcribed using 2 µg in a 1st Strand cDNA
Synthesis Kit for RT-PCR (AMV) (Roche-cat.no. 1 483 188) following the
recommendations of the supplier. Following the reverse transcriptase reaction, 3 µl of
the resulting cDNA was used as template for the RT-PCR using TaqMan Universal PCR
Master Mix, No AmpErase (Applied Biosystems) as with the mitochondrial DNA assays.
Reactions were performed in triplicate. All RT-PCR applications were performed on an
ABI PRISM® 7000 Sequence Detection System. Amplification plots were generated
from delta Rn values exported from the system software. Fold change was determined by
the comparative Ct method as described in User Bulletin #2: Relative Quantitation of
Gene Expression (P/N 4303859) (Applied Biosystems). Briefly, threshold values were
determined automatically using ABI PRISM 7000 software and resulting Ct values (Ct =
fluorescence intensity at threshold where exponential amplification begins) were
98

generated for each of three sample replicates. As outlined in Tables 3.1 and 3.2 fold
change is determined by the following calculation. The ∆Ct value is determined by
subtracting the average Ct value for the endogenous control sample (e.g. beta globin)
from the average Ct for the experimental sample (eg. mtDNA). The standard deviation of
the difference is calculated from the standard deviations of the two samples as shown
below:
where s = standard deviation. The ∆∆Ct value is determined by subtraction of the ∆Ct of
an untreated sample from a treated sample. In this case, the ∆Ct for HA7C cells
(HMGA1 over-expression is considered treated) minus the ∆Ct for wild-type MCF-7
cells gives the ∆∆Ct. Because this subtraction is of an arbitrary constant, the standard
deviation of ∆∆CT is the same as the standard deviation of the ∆CT value. If the ∆∆Ct is
negative, there is a fold change increase that is calculated as follows:
2-∆∆Ct
If the ∆∆Ct is positive, there is fold change decrease that is calculated as follows:
-2∆∆Ct
FACS Analysis for Mitochondrial Mass
MCF-7 and HA7C cells were grown in DMEM without phenol red and
supplemented as described above. Removal of phenol red was done in order to prevent
detection interference during flow cytometry. Cells were stained with 100 nM nonyl
acridine orange (NAO) (Invitrogen: Molecular Probes), a metachromatic dye that
accumulates in mitochondria regardless of the mitochondrial membrane potential.
99

Specifically, the dye binds to cardiolipin in all mitochondria, regardless of their energetic
state. Cells were grown to 70-80% confluence and incubated at 37°C in 5% CO2 for 30
min. in the presence of 100 nM NAO. Cells were then washed with PBS, trypsinized,
spun at 1000 rpm on a clinical centrifuge for 10 min and resuspended in 1 ml of either
pre-warmed PBS or media. Fluorescence activated cell sorting (FACS) analysis was
performed on a FACScalibur (Becton Dickinson: Immunocytometry Systems) utilizing
an emission wavelength of 488 nm and a 525 nm excitation detector. Data acquisition
and analysis was performed using Cell Quest Pro Software.
2-Deoxy-D-Glucose Sensitivity Assay
MCF-7 and HA7C cells were seeded (200 µl) into a 96-well tissue culture plate
from a resuspension at a concentration of 1X10⁴ cells/ml. Following 24 hrs to allow
adherence, media was replaced with complete growth media containing 0 (untreated), 1,
1.5, 2, 2.5, 3, 3.5, 4, and 4.5 mM 2-deoxy-D-glucose (Sigma), a specific inhibitor of
glycolysis. Treatments were performed in triplicate within individual plates. The cells
were then incubated at 37°C in 5% CO2 for 96 hrs without changes to the media.
Following drug treatment, DNA content was determined by a Hoechst 33258 (Sigma)
staining method. Briefly, cells were washed in serum free media once and fixed by
adding 100 µl of 100% ethanol per well and letting sit at room temperature for 10 min.
Following a second wash with serum free media, 100 µl of TNE buffer (10 mM Tris, 1
mM EDTA, 2M NaCl, pH 7.4) was added to the cells. Hoechst 33258 stain was then
diluted to 20 ug/ml in TNE buffer and 100 ul was added to each well. Cells were
incubated at 37°C for 30 min before analysis. Relative DNA content was determined by
100

reading fluorescence intensities with a 360 nm excitation filter and a 460 nm emission
filter on a 96-well plate reader (Wallac Victor-2). Arbitrary fluorescence units were used
to plot relative DNA content which was considered as relative cell number using
Microsoft Excel.
Mitochondrial DNA Repair Analysis using Q-PCR
The following protocol was adapted from Santos et al., 2002. Cells were seeded
(1X10⁶ cells) in a 100 mm tissue culture plate and allowed to adhere for 16 hr. Following
a wash with PBS, cells were treated with 200 uM H2O2 in serum free media for 30 min at
37°C in 5% CO2. At 30 min, treatment media was replaced with complete growth media
(DMEM) and cells were harvested at 5, 15, 30, 45, 60, 90, and 180 min by trypsinization,
centrifugation, and immediate freezing of the cell pellet at -70°C. Total cellular DNA
(nuclear and mitochondrial) was extracted using Qiagen Blood and Cell Culture DNA
Mini Kit (cat. no. 13323) containing Genomic Tip/20 columns following the exact
recommendations of the supplier. Isolated DNA was pre-quantified using PicoGreen®
dsDNA Quantitation Kit (Invitrogen: Molecular Probes cat. no. P-7589) and a 96-well
plate reader (CytoFluor 4000-Applied Biosystems: Perseptive Biosystems) with a 485 nm
excitation filter and a 535 nm emission filter. Using these values, DNA was diluted to10
ng/ul in TE and re-quantified using PicoGreen in the same manner. A final dilution to 3
ng/ul was performed and used as the working stock for template in subsequent PCR
reactions. PCR was performed with the GeneAmp XL Kit (Applied Biosystems) which
includes rTth DNA polymerase XL and the remaining reagents required for successful
amplification of long targets up to 20 kb. PCR conditions were as follows, 1X
101

Polymerase Buffer, 1.3 mM Mg(OAc), 200 uM dNTPs, 100 ng/ul BSA, 100 pmol of
each primer, 15 ng of template DNA, and 1U of rTth XL polymerase. Polymerase was
added following temperature ramping to 75°C to accomplish a hot start. Cycle parameter
were 94°C for 1 min, 19-32 cycles of (94°C – 15 sec, 64°C – 12 min), and a final 10 min
at 72°C. Primer sets used for amplification of 8.9 kb of the mitochondrial genome were
Mito 5999 S (5’- TCT AAG CCT CCT TAT TCG AGC CGA-3’) and Mito 14841 AS
(5’- TTT CAT CAT GCG GAG ATG TTG GAT GG-3’) where S and AS represent sense
and antisense, respectively. Following PCR amplification, products were quantified
again with the PicoGreen reagent and a 96-well plate reader. Each reaction was analyzed
in triplicate and concentration of DNA determined by a lambda DNA standard curve (2.5,
1.25, 0.625, 0.313, and 0.156 ng/ul).
Results
Mitochondrial DNA Levels are Reduced in HA7C Cells
In order to determine the effect of HMGA1 over-expression on the levels of
mitochondrial DNA within MCF-7 breast cancer epithelial cells, a transgenic cell line
(HA7C), expressing an HA-tagged HMGA1 fusion protein was used in comparison to
wild-type MCF-7 cells. TRIzol isolated DNA and more highly purified isolates using a
Qiagen Genomic Tip/20 Kit were collected from both the over-expressing and non-over-
expressing cell lines and used as template to perform quantitative real-time (RT) PCR.
Initial non-RT-PCR results on genomic DNA isolated by TRIzol revealed differential
amplification on equal amounts of template, indicating polymerase inhibition by a sample
contaminant. Nevertheless, following phenol extraction, these samples amplified equally
102

during screening and were thus used in subsequent RT-PCR along side Qiagen isolated
DNA. Triplicate data from individually isolated sample sets revealed an overall down-
regulation (-1.7±0.5 fold) in HA7C mtDNA relative to MCF-7 cells, using beta globin as
an endogenous DNA control (Table 3.1, Fig. 3.1)
Mitchondrial Gene, NADH Dehydrogenase subunit 2, is Activated in HA7C Cells
RNA harvested from the same TRIzol samples used for the isolation of DNA
isolated for mtDNA quantification was reverse transcribed to yield total cellular cDNA.
This cDNA was subsequently used as template in an RT-PCR application as above, using
primers and probes specific to the NADH Dehydrogenase subunit 2 (ND2) and the
nuclear gene HPRT1 promoter as an endogenous control. Again, in triplicate, results
indicated an overall up-regulation (1.7±0.3 fold) of ND2 gene transcript levels in HA7C
cells relative to the wild-type MCF-7 cells (Table 3.2, Fig. 3.2). Because the
mitochondrial DNA levels in these same cells was shown to be reduced by approximately
two-fold, this was factored in into the final calculations of the total fold change for the
ND2 gene. Normalizing for decreased mtDNA levels as described above, the total up-
regulation of the ND2 gene is approximately 3-fold.
Mitochondrial Mass is Reduced in HA7C Cells
Because mitochondrial DNA levels were shown to be reduced in HMGA1 over-
expressing cells, it was assumed that other mitochondrial functions or characteristics
would be altered. Though the link between mitochondrial genome levels and organelle
mass within cells is poorly understood, it was hypothesized that reduction in mtDNA
103

levels would translate into a reduced level of total mitochondria in the cell. Using
fluorescence activated cell sorting (FACS) analysis, transgenic HA7C and wild-type
MCF-7 cells were comparatively studied by staining with the metachromatic dye, nonyl
acridine orange (NAO), which stains mitochondria independently of mitochondrial
membrane potential. Data analysis showed that a majority of the HMGA1 over-
expressing cells had lower mitochondrial mass than the wild-type MCF-7 cells (Fig. 3.3)
Increased Sensitivity of HA7C to Treatment with 2-deoxy-D-glucose
Upon establishing that both mitochondrial DNA expression and replication is
altered and that overall mitochondrial mass in HMGA1 over-expressing cells is reduced,
studies to determine the functional ramifications of such changes were performed. Due
to observations that tumor cells have a substantially greater capacity for aerobic
glycolysis consistent with a reduction in oxidative phosphorylation (Nakashima et al.,
1984), it was hypothesized that HMGA1 may contribute to deficient mitochondrial
oxidative metabolism. Thus, treatment with a specific inhibitor of glycolysis, 2-deoxy-D-
glucose (2-DG), was hypothesized to preferentially kill HA7C cells over-expressing
HMGA1 in comparison to wild-type non-over-expressing MCF-7 cells. Following
treatment of both cell types with varying concentrations of 2-DG and an incubation of 96
hrs, cells were fixed and stained with Hoechst 33258 and the DNA content values were
used as an indicator of cell number or survival. Results (Fig. 3.4) showed that the
phenotypically normal cell line, MCF-7 was largely unaffected by the drug treatment up
to between 4-5 mM concentrations. In contrast, the highly metastatic transgenic HA7C
cells began reducing in number at 1.5 mM 2-DG. At 3 mM 2-DG, HA7C were
104
maximally sensitive in comparison to MCF-7 cells. Utilizing arbitrary fluorescence
units, HA7C cells were calculated to be approximately 200-fold more sensitive to
treatment with 3 mM 2-DG than the MCF-7 cells.
Reduced Capacity of HA7C Cells to Repair ROS Generated DNA Damage
As outlined in the introduction, the role of HMGA1 within the mitochondria may
relate to their newly discovered role in the inhibition of DNA repair in the nucleus. This
is possible primarily because of the fact that increased rates of mutations are found in the
mitochondria of cancer cells expressing high levels of HMGA1 proteins. In order to
study the rate of DNA repair in mitochondria a quantitative PCR method was used as
described by Santos et al. (2002). Following treatment of both wild-type MCF-7 and
transgenic HA7C cells with hydrogen peroxide, total genomic DNA was isolated and
quantified as described in Methods and Materials. Mitochondrial primers designed to
amplify an 8.9 kb amplicon were employed in optimization PCR reactions to ensure that
cycle number was resulting in amplification within the linear range. Upon cycle
optimization, damaged DNA substrates harvested at different timepoints following
removal of hydrogen peroxide were used in the optimized reaction to determine
differential rates of repair within the mitochondria. It is noteworthy that during
preliminary experiments DNA isolates lost their integrity over time (~2 weeks), thus it
was important to perform all experiments on freshly isolated DNA samples. Fresh DNA
isolates required cycle number optimization prior to analysis of DNA damaged sample.
Upon amplification of the various samples, it was determined in this preliminary
assay (Fig. 3.5), that there was an apparent inhibition in the ability of HA7C cells to
105
repair ROS damaged DNA when compared to MCF-7 cells. Results indicate, as was seen
previously (Santos et al., 2002) , that hydrogen peroxide is cleared from the cell over the
course of 60 min. followed by repair of the DNA between 90 and 180 min in the MCF-7
but not in the HA7C cells. PCR products were quantified in triplicate and show
statistically significant differences between the two cell types.
Discussion
Localization of the HMGA1 proteins within mitochondria is a phenomenon that
holds multiple new and exciting potential areas of research in the field. Based on the data
presented here, it is clear that HMGA1 is playing a role in the mitochondria that is
capable of producing phenotypic changes to the characteristics of the entire cell.
Regarding non-disease related mitochondrial function, there is clearly a normal function
for the HMGA1 proteins within the organelle, as the proteins can be found associated
with the regulatory D-loop region in both normal and highly-metastatic cells (Dement et
al., 2005, Chapter 2). Furthermore, the movement appears to be cell cycle dependent,
indicating a potential role for HMGA1 in regulating mitochondrial biogenesis during the
process of mitotic cell division. Though the focus of the research presented in this
manuscript has been on the exploration of a potential joint role for HMGA1 and
mitochondria during carcinogenesis, the data may shed light on normal processes
mediated by HMGA1 as well as processes related to other mitochondrial diseases.
Because mtDNA levels were shown to be down-regulated by approximately 2-
fold in cells over-expressing HMGA1 (Table 3.1, Fig. 3.1), and because the proteins
were previously shown to associate with the control D-loop region, it is very likely that
106
they are playing a role in regulating the replication process. This regulation is most likely
at the level of transcriptional termination during the formation of RNA primers from the
light strand promoter (LSP). During this process, transcripts from LSP are terminated at
conserved sequence blocks (CSBs) the first of which (CSB I) is quite high in AT content
(Chang and Clayton, 1985). These blocks are essential for the proper termination and
primer formation that allows for a transition from RNA to DNA synthesis for the
initiation of replication at the heavy strand origin (OH) by mitochondrial DNA
polymerase (pol γ) (Lee and Clayton, 1998). Any alterations to the regions due to
binding and induced conformational changes mediated by HMGA1 could serve to inhibit
the transition process and disallow initiation of replication. It is noteworthy that recent
ChIP analyses performed in our lab showed the specific association of HMGA1 at a
region downstream of the LSP start site (Dement et al., 2005, Chapter 2) and in close
proximity to the CSB sequences.
Activation of the ND2 mitochondrial gene by approximately 3-fold (Table 3.2,
Fig. 3.2) within the HA7C cells over-expressing HMGA1 is consistent with multiple
mitochondrial gene expression studies. While there are many examples of up-regulated
mitochondrially transcribed genes in different cancer types, ND2 specifically, was shown
to be activated in malignant tissue as compared to normal tissue taken from the same
colorectal cancer patients (Chester et al., 1990). As the majority of the protein coding
genes on the mitochondrial genome are expressed as a single polycistronic mRNA under
the control of the heavy strand promoter (HSP), it is interesting that the HMGA1 protein
binds to a region of AT-rich DNA upstream of this promoter (Dement et al., 2005,
Chapter 2). This is, in fact, the same sequence bound by HMGA1 that may play a role in
107
inhibition of replication by interference with the LSP primer formation process. This
presents the possibility that the HMGA1 proteins have a dual function within the
processes of mtDNA expression and replication by binding to a single site. However, a
more extensive study of HMGA1 binding sites around the mtDNA is necessary to begin
further speculation about the mechanism by which HMGA1 is acting. Furthermore,
additional genes need to be analyzed in the context of HMGA1 over-expression to verify
that the protein is indeed able to promote transcriptional initiation from the HSP.
Regardless of the future work that needs to be done, the present quantitative PCR data
combined with previous binding site ChIP studies strongly suggest that HMGA1 proteins
maintain their function as transcriptional regulators within the mitochondria.
The consequence of this regulation and subsequent changes in mtDNA expression
and replication levels may be the alteration of overall mitochondrial number,
morphology, and ultimately function as suggested by the observed reduction in organelle
mass within the HMGA1 over-expressing cells (Fig. 3.3). Because the exact relationship
between mitochondrial mass, mRNA, and mtDNA copy number have yet to be examined,
it is difficult to suggest that this observation is a direct result of low mtDNA levels
(reviewed in Penta et al., 2001). In fact while multiple cancer types show an increase in
mtDNA levels, many also display an approximately 50% reduction in mitochondrial mass
(Pedersen et al., 1978), a number consistent with our current findings. Downstream of
the reduction in mitochondrial mass is the potential for obvious alterations in the
metabolic activity of the cell.
As demonstrated by Warburg in 1956, and confirmed here by results showing the
reduced capacity of the highly metastatic HA7C cell line to survive in the presence of a
108

glycolytic inhibitor, 2-DG (Fig. 3.4), cancer cells have abnormal metabolism. That is,
the cells display a substantially greater capacity for aerobic glycolysis and an apparent
decreased level of oxidative phosphorylation (Warburg, 1956). Although the role of the
HMGA1 proteins in this phenotype is currently difficult to interpret, the present data
suggest that the alterations to metabolic activity may be a consequence of HMGA1
binding to mtDNA elements that regulate HSP and LSP activity. However, it has been
suggested that increased expression of mtDNA-encoded respiratory chain complexes
observed in solid tumors may reflect mitochondrial gene adaptations to perturbations in
cellular energy requirements (Penta et al., 2001). In order to sort these possibilities out,
depletion studies are currently being performed in the lab utilizing tetracycline treatment
to inhibit the expression of the HMGA1 transgene that is under the control of a
tetracycline responsive promoter. Initial data suggests that the sensitivity to 2-DG
treatment may be reversed following down-regulation of HMGA1 transgene (data not
shown), indicating that HMGA1 may play a causative role.
Finally, we showed with preliminary Q-PCR results that HMGA1 over-expressing
cells display a reduction in their capacity to repair ROS generated DNA damage within
the mitochondria (Fig. 3.5). We present data showing that the Q-PCR technique can be
successfully optimized and DNA damage and repair assessed. Due to promising results,
these studies will move forward to verify results and begin looking into a mechanism of
DNA repair inhibition within the mitochondria. The current results are consistent with
literature demonstrating cancer related increases in mutations within the mitochondria.
Mitochondrial localization of the over-expressed oncogenic HMGA1 proteins may be a
major contributor to the occurrence of increased mutations observed within tumor tissue.
109

In order to study these questions further, and confirm a direct role for the
HMGA1 proteins within the above studied mitochondrial processes, further studies are
necessary and underway. These include repeating the above assays in the context of tet,
antisense, or RNAi mediated depletion of HMGA1 within the transgenic cell line to
observe reversals of the apparent HMGA1 affects to mitochondrial and cellular function.
Also, increasing affects may be observed by directing the protein to the mitochondria by
the construction of an HMGA1 fusion vector coding for an HMGA1-mitochondrial
targeting sequence (MTS) protein. Recently, we have developed an HMGA1 fusion
construct containing the MTS of manganese super oxide dismutase, within a vector
designed for stable transfection. Following transfection and proper localization of the
HMGA1 fusion protein to the mitochondria, HMGA1 specific affects should be greatly
amplified.
110
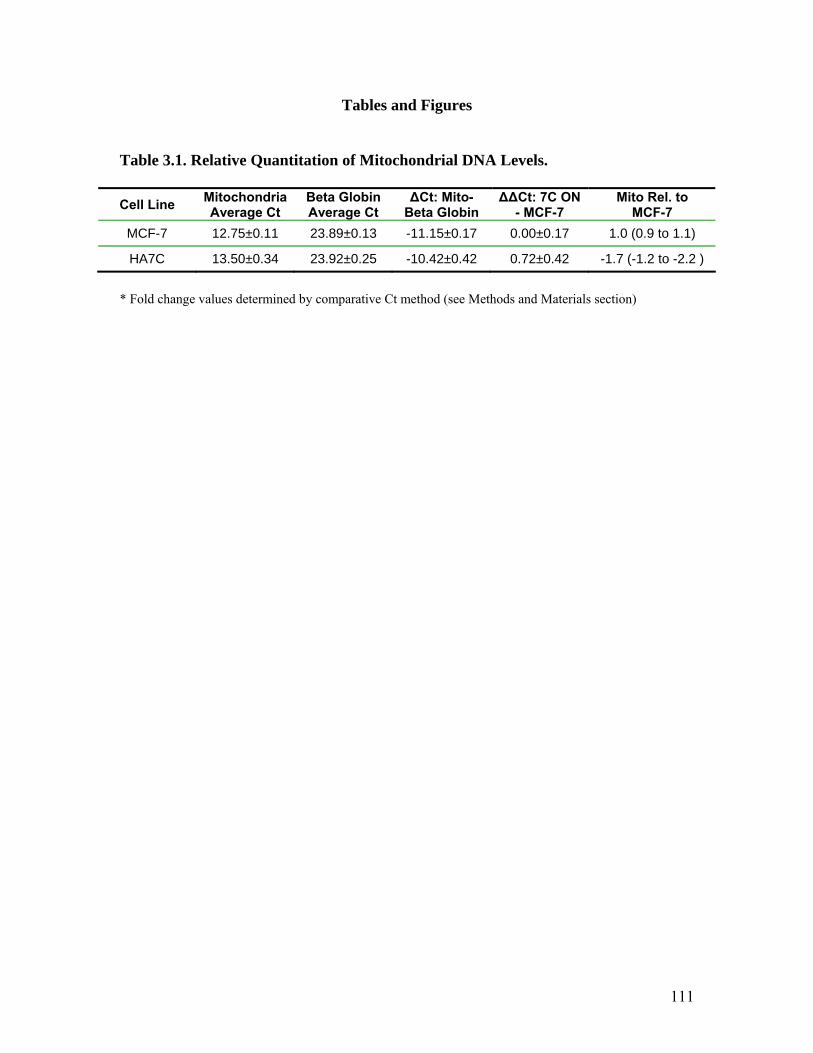
Tables and Figures
Table 3.1. Relative Quantitation of Mitochondrial DNA Levels. Cell Line Mitochondria
Average Ct Beta Globin Average Ct
∆Ct: Mito-Beta Globin
∆∆Ct: 7C ON - MCF-7
Mito Rel. to MCF-7
MCF-7 12.75±0.11 23.89±0.13 -11.15±0.17 0.00±0.17 1.0 (0.9 to 1.1)
HA7C 13.50±0.34 23.92±0.25 -10.42±0.42 0.72±0.42 -1.7 (-1.2 to -2.2 )
* Fold change values determined by comparative Ct method (see Methods and Materials section)
111
Figure 3.1. Amplification plots and fold change data demonstrating an approximately 2-
fold down regulation in the levels of mitochondrial DNA in HA7C cells relative to MCF-
7 cells. Panel A: Plot showing increasing levels of amplification during PCR cycles as
represented by fluorescence intensity from the FAM reporter on a probe specific for a
region of the mitocohondrial D-loop. Panel B: Plot showing the same amplification
progression by fluorescence readings from a FAM reporter probe specific to the beta
globin gene. Cycle numbers included in both plots correspond to those in which
exponential amplification is beginning. Using the comparative Ct method, fold change
relative to an endogenous control can be determined as demonstrated in Table 3.1.
112
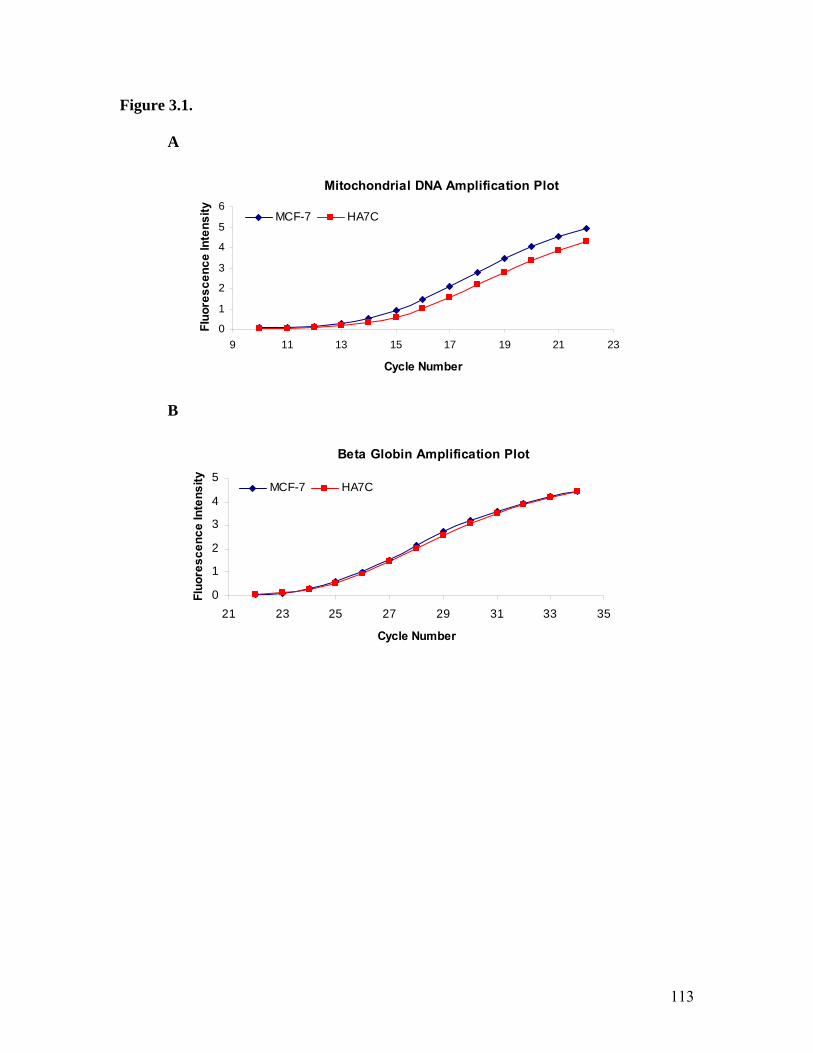
Figure 3.1.
A
Mitochondrial DNA Amplification Plot
0
1
2
3
4
5
6
9 11 13 15 17 19 21
Cycle Number
Fluo
resc
ence
Inte
nsity
23
MCF-7 HA7C
B
Beta Globin Amplification Plot
0
1
2
3
4
5
21 23 25 27 29 31 33 35
Cycle Number
Fluo
resc
ence
Inte
nsity MCF-7 HA7C
113

Table 3.2. Relative Quantitation of Mitochondrial NADH Dehydrogenase Subunit 2 Gene Transcript Levels. Cell Line ND2
Average Ct HPRT
Average Ct ∆Ct: ND2-
HPRT ∆∆Ct: HA7C
- MCF-7 ND2 Rel. to
MCF-7 MCF-7 16.02±0.68 20.42±0.10 -4.4±0.69 0.00±0.69 1(0.6 to 1.6)
HA7C 15.58±0.15 20.70±0.11 -10.42±0.19 -0.72±0.19 1.7 (1.4 to 1.9 )
* Fold change values determined by comparative Ct method (see Methods and Materials section)
114
Figure 3.2. Amplification plots and fold change data demonstrating an approximately 2-
fold up-regulation in the levels of NADH dehydrogenase subunit 2 transcript in HA7C
cells relative to MCF-7 cells. Taking the reduced mitochondrial DNA levels in these
cells as demonstrated in Fig. 3.1, the total positive fold change for ND2 is approximately
4-fold. Panel A: Plot showing increasing levels of amplification during PCR cycles as
represented by fluorescence intensity from the FAM reporter on a probe specific for a
region of ND2 cDNA. Panel B: Plot showing the same amplification progression by
fluorescence readings from a FAM reporter probe specific to HPRT cDNA. Cycle
numbers included in both plots correspond to those in which exponential amplification is
beginning. Using the comparative Ct method, fold change relative to an endogenous
control can be determined as demonstrated in Table 3.2.
115
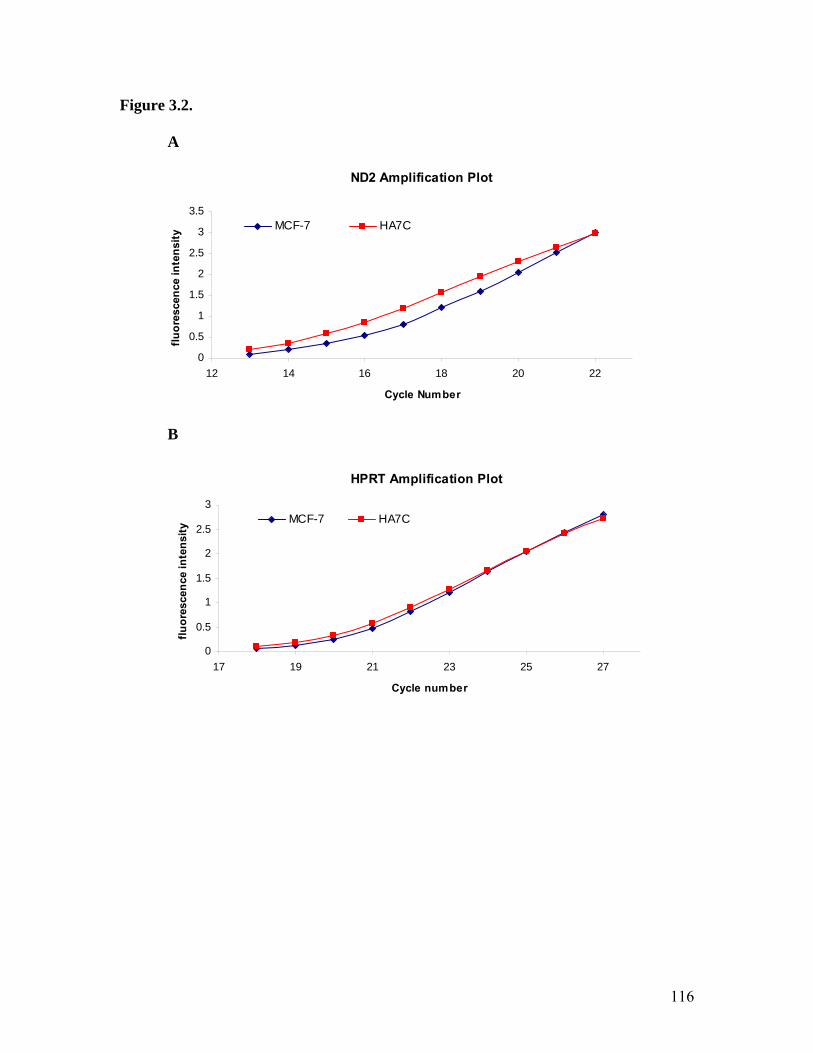
Figure 3.2.
A
ND2 Amplification Plot
0
0.5
1
1.5
2
2.5
3
3.5
12 14 16 18 20 22
Cycle Number
fluor
esce
nce
inte
nsity
MCF-7 HA7C
B
HPRT Amplification Plot
0
0.5
1
1.5
2
2.5
3
17 19 21 23 25 27
Cycle number
fluor
esce
nce
inte
nsity
MCF-7 HA7C
116

Figure 3.3. Mitochondrial mass within HA7C cells is reduced relative to MCF-7 cells.
Histogram shows nonyl acridine orange (NAO) staining intensity on the logarithmic X
axis and cell counts on the Y axis. A total of 10,000 events were analyzed by FACS
analysis. The shift in the HA7C peak to a lower staining intensity represents an
approximately 20% reduction of mitochondria in the majority of these HMGA1 over-
expressing cells as determined by Cell Quest Software.
117

Figure 3.3.
118
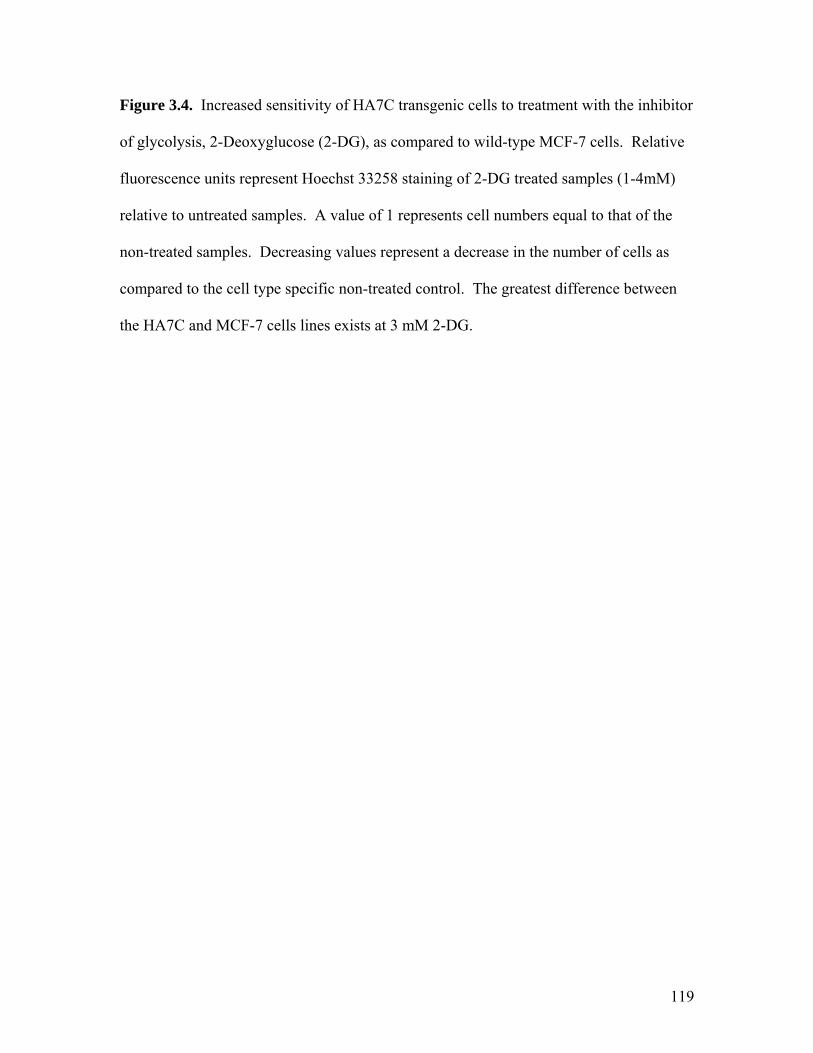
Figure 3.4. Increased sensitivity of HA7C transgenic cells to treatment with the inhibitor
of glycolysis, 2-Deoxyglucose (2-DG), as compared to wild-type MCF-7 cells. Relative
fluorescence units represent Hoechst 33258 staining of 2-DG treated samples (1-4mM)
relative to untreated samples. A value of 1 represents cell numbers equal to that of the
non-treated samples. Decreasing values represent a decrease in the number of cells as
compared to the cell type specific non-treated control. The greatest difference between
the HA7C and MCF-7 cells lines exists at 3 mM 2-DG.
119

Figure 3.4. 2-DG Sensitivity: MCF-7 vs. 7C ON
0.40.50.60.70.80.9
11.1
0 0.5 1 1.5 2 2.5 3 3.5 4 4.5 5
2-DG Concentration (mM)
rela
tive
fluor
esce
nce MCF-7 HA7C
120
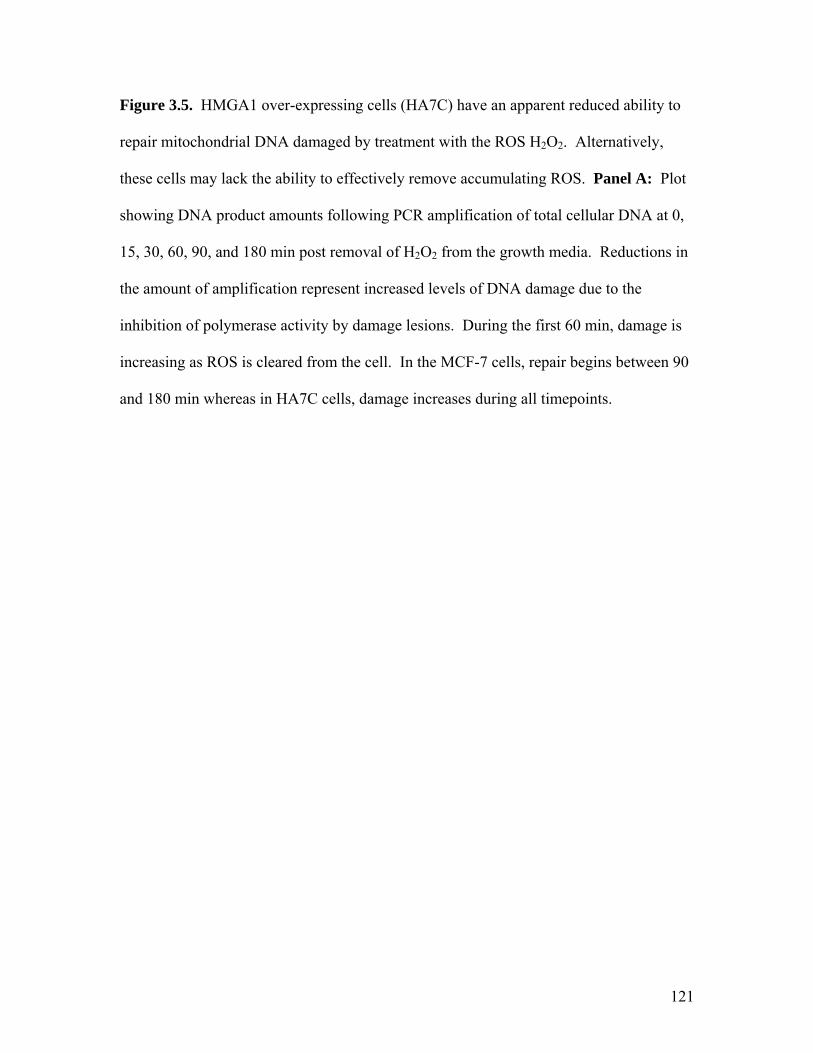
Figure 3.5. HMGA1 over-expressing cells (HA7C) have an apparent reduced ability to
repair mitochondrial DNA damaged by treatment with the ROS H2O2. Alternatively,
these cells may lack the ability to effectively remove accumulating ROS. Panel A: Plot
showing DNA product amounts following PCR amplification of total cellular DNA at 0,
15, 30, 60, 90, and 180 min post removal of H2O2 from the growth media. Reductions in
the amount of amplification represent increased levels of DNA damage due to the
inhibition of polymerase activity by damage lesions. During the first 60 min, damage is
increasing as ROS is cleared from the cell. In the MCF-7 cells, repair begins between 90
and 180 min whereas in HA7C cells, damage increases during all timepoints.
121

Figure 3.5.
Amplified DNA Levels Post Oxidative Damage
16.00
17.00
18.00
19.00
20.00
21.00
22.00
0 15 30 60 90 180
Time post H2O2 Removal (min)
Am
t. D
NA
(ng/
uL)
MCF-7 HA7C
122

References
Adair, J.E, Y.H. Kwon, G.A. Dement, M.J. Smerdon, and R. Reeves. 2005. Inhibition of Nucleotide Excision Repair by High Mobility Group Protein HMGA1. J. Biol.Chem 280:32184-32192. Alonso, A., P. Martin, C. Albarran, et al. 1997. Detection of somatic mutations in the mitochondrial DNA control region of colorectal and gastric tumors by heteroduplex and single-strand conformation analysis. Electrophoresis. 18:682-685. Anderson, C.T., and E.C. Friedberg. 1980. Nucleic Acids Res. 8:875-888. Banks, G.C, Y. Li and R. Reeves. 2000. Differential in vivo modifications of the HMGI(Y) nonhistone chromatin proteins modulate nucleosome and DNA interactions. Biochem. 39:8333-8346. Bianchi, M.S., N.O. Bianchi, and Bailliet. 1995. Mitochondrial DNA mutations in normal and tumor tissues from breast cancer patients. Cytogenet. Cell Genet. 71:99-103. Bibb, M.J., R.A. Van Etten, C.T. Wright, M.W. Walberg, D.A. Clayton. 1981. Sequence and gene organization of mouse mitochondrial DNA. Cell 2:167-80. Chang, D.D., and D.A. Clayton. 1985. Priming of human mitochondrial DNA replication occurs at the light-strand promoter. Proc. Natl. Acad. Sci. USA 82:351-355. Chester, K.A., L. Robson, R.H. Begent, H. Pringle, L. Primrose, I.C. Talbot, A.J. Macpherson, S.L. Owen, G. Boxer, and A.D. Malcolm. 1990. In situ and slot hybridization analysis of RNA in colorectal tumours and normal colon shows distinct distributions of mitochondrial sequences. J. Pathol. 162:309-315. Clayton, D.A., J.N. Doda, and E.C. Friedberg. 1974. The absence of pyrimidine dimmer repair mechanism in mammalian mitochondria. Proc. Nat. Acad. Sci. USA 71:2777-2781. Croteau, D.L., and V.A. Bohr. 1997. J.Biol. Chem. 272:25409-25412. Dement, G.A., N.R. Treff, N.S. Magnuson, V. Franceschi, and R. Reeves. 2005. Dynamic mitochondrial localization of nuclear transcription factor HMGA1. Exp. Cell Res. 307:388-401. Dmitrenko, V., K. Shostak, O. Boyko, O. Khomenko, V. Rozumenko, T. Malisheva, M. Shamayev, Y. Zozulya, and V. Kavsan. 2005. Reduction of the transcription level of the mitochondrial genome in human glioblastoma. Cancer Letters. 218:99-107. Edberg, D.D, J.E. Bruce, W.F. Siems, and R. Reeves. 2004. In vivo post-translational modifications of the High Mobility Group A1a proteins in breast cancer cells of differing metastatic potential. Biochem. 43:11500-11515.
123
Fliss, M.K. H. Usadel, O.L. Cabellero, et al. 2000. Facile detection of mitochondrial DNA mutations in tumors and bodily fluids. Science. 287:2017-2019. Glaichennhaus, N., P. Leopold, and F. Cuzin. 1986. Increased levels of mitochondrial gene expression in rat fibroblasts cells immortalized or transformed by viral and cellular oncogenes. Eur. Mol. Biol. Org. J. 25:1261-1265. Haugen, D.R., O. Fluge, L.J. Reigstad, J.E. Varhaug, and, J.R. Lillehaug. 2003. Increased expression of genes encoding mitochondrial proteins in papillary thyroid carcinomas. Thyroid 13:613-620. Horton, T.H., J.A. Petros, A. Heddi, et al. 1996. Novel mitochondrial DNA deletion found in a renal cell carcinoma. Genes, Chromosomes Cancer 15:95-101. Huth, J.R., C.A. Bewley, M.S. Nissen, J.N. Evans, R. Reeves, A.M. Gronenborn, and G.M. Clore. 1997. The solution structure of an HMG-I(Y)-DNA complex defines a new architectural minor groove binding motif. Nat.Struct.Biol. 8:657-665. Johnson, K.R., D.A. Lehn, and R. Reeves. 1989. Alternative processing of mRNA’s encoding mammalian chromosomal high-mobility-group proteins HMG-I and HMG-Y. Mol. Cell. Biol. 9:2114-2123. Khrapko, K., H.A. Coller, P.C. Andre, et al. 1997. Mitochondrial mutational spectra in human cells and tissues. Proc. Natl. Acad. Sci. USA 94:13798-13803. Lee, D.Y. and D.A. Clayton. 1998. Initiation of mitochondrial DNA replication by transcription and R-loop processing. J. Biol. Chem.273:30614-30621. Lund, T., M. Holtlund, M. Fredrickson, and S.G. Laland. 1983. On the presence of two new high mobility group-like proteins in HeLa S3 Cells. FEBS (Fed. Eur. Biochem. Soc.) Lett. 152:163-167. Marcelino, L.A., and W.G. Thilly. 1999. Mitochondrial mutagenesis in human cells and tissues. Mutat. Res. 434:177-203. Nakashima, R.A., M.G. Paggi, and P.L. Pedersen. 1984. Contributions of glycolysis and oxidative phosphorylation to adenosine 5’-triphosphate production in AS-30D hepatoma cells. Cancer Res. 44:5702-5706. Pedersen, P.L. 1978. Tumor mitochondria and the bioenergetics of cancer cells. Prog. Exp. Tumor Res. 22:190-274. Penta, J.S., F.M. Johnson, J.T. Wachsman, and W.C. Copeland. 2001. Mitochondrial DNA in human malignancy. Mutat. Res. 488:119-133.
124

Pirsel, M. and V.A. Bohr. 1993. Carcinogenesis 14:2105-2108. Polyak, K., Y. Li, H. Zhu, et al. 1998. Somatic mutations of the mitochondrial genome in human colorectal tumours. Nature Genet. 20:291-293. Reeves, R. 2001. Molecular biology of HMGA proteins: hubs of nuclear function. Gene 277:63-81. Reeves, R., and L. Beckerbauer. 2001. HMGI/Y proteins: flexible regulators of transcription and chromatin structure. Biochem. Biophys. Acta 1519:13-29. Reeves, R., T.A. Langan, and M.S. Nissen. 1991. Phosphorylation of the DNA-binding domain of nonhistone high-mobility-group I protein by cdc2 kinase: reduction of binding affinity. Proc. Natl. Acad. Sci. USA 88:1671-1675. Reeves, R., and M. S. Nissen. 1990. The A.T-DNA-binding domain of mammalian high mobility group I chromosomal proteins: a novel peptide motif for recognizing DNA structure. J. Biol. Chem. 265:8573-8582. Reeves, R., and M.S. Nissen. 1995. Cell cycle regulation and functions of HMG-I(Y). Prog. Cell Cycle Res. 1:337-347. Santos, J.H., B.S. Mandavilli, and B. Van Houten. 2002. Measuring Oxidative mtDNA Damage and Repair Using Quantitative PCR. Methods Mol. Biol. 197:159-176. Siedel-Rogol, B.L. and G.S. Shadel. 2002. Modulation of mitochondrial transcription in response to mtDNA depletion and repletion in HeLa cells. Nucleic Acids Res. 30:1929-1934. Takao, M., H. Aburatani, K. Kobayashi, and A. Yasui. 1998. Nucleic Acids Res. 26:2917-2922. Tamura, G., S. Nishizuka, C. Maesawa, et al. Mutations in mitochondrial control region DNA in gastric tumours of Japanese patients. Eur. J. Cancer. 35:316-319. Toyokuni, S., K. Okamoto, J. Yodoi, et al. 1995. Persistent oxidative stress in cancer. FEBS Lett. 358:1-3. Wang, E., A. Wong, and G. Cortopassi. 1997. The rate of mitochondrial mutagenesis is faster in mice than in humans. Mutat. Res. 377:157-166.
125

CHAPTER 4
CONCLUSIONS AND FUTURE WORK
HMGA1 Proteins and Mitochondrial Biology: New Directions for Cancer Research
126

Historically, aberrant mitochondrial activity has been recognized as a consistent
occurrence associated with the process of carcinogenesis and metastatic progression
(Bandy and Davison, 1990; Baggetto, 1993; Hoberman, 1975; Caveli and Liang, 1998;
Neubert et al., 1981; Richter, 1988; Schumacher et al., 1973; Wilkie et al., 1975; and
Shay and Werbin, 1987). Additionally, mitochondria display abnormal genotypic and
phenotypic characteristics within the context of multiple non-cancer diseases and aging
(MITOMAP.org; Chomyn and Attardi, 2003). Increased mutations, abnormal organelle
morphology and membrane potential, changes in mtDNA expression and replication, and
altered cellular metabolism are distinct changes to mitochondria and mitochondrial
related processes observed in association with multiple cancer types and diseases
(Amuthan et al., 2002; Warburg, 1956; Zafar et al., 1982). Findings suggest that
correlations between cancer/disease phenotypes and mitochondria result from, or are
associated with, the oxidative environment of the organelle. As covered in detail
previously, reactive oxygen species (ROS) generated mtDNA mutations have the
potential to produce disease and, within the context of cancer, promote persistent
oxidative stress and the accumulation of more mutations (reviewed in Penta et al., 2001).
However, the work contained in this dissertation provides evidence that altered
mitochondrial function within the context of a cancer phenotype may, in part, be a
product of aberrant HMGA1 expression. Data suggests that such effects represent
abnormalities in the normal mitochondrial role for HMGA1, which may be to regulate
mitochondrial activity or biogenesis during the process of cell division. These findings
regarding the relationship between HMGA1 proteins and mitochondrial function are
compelling and require further experimentation.
127

In order to follow up on the findings presented here, particularly the novel
discovery that HMGA1 is present in the mitochondria, many areas of research need to be
pursued. These include but are not limited to the mechanism(s) of HMGA1
nucleocytoplasmic translocation, the transcriptional role of HMGA1 within the
mitochondria, HMGA1 mediated changes to mitochondrial function, and finally the
possible role of HMGA1 in the inhibition of mtDNA repair and the accumulation of
disease and cancer related mutations.
Mechanisms of HMGA1 Translocation
As presented in Chapter 2, HMGA1 was clearly shown to be within the
mitochondria of both murine fibroblasts NIH3T3 (Fig 2.1, 2.3, 2.5, and 2.6) and human
breast epithelial MCF-7 (Fig. 2.7 and 2.8) cells. In NIH3T3 cells, synchronization and
live cell imaging studies suggested that the proteins move from the nucleus to the
cytoplasm in a cell cycle dependent manner (Fig. 2.2). As detailed in the Chapter 2
Discussion, HMGA1 proteins lack typical sequences associated with nuclear export or
mitochondrial internalization, but display specific characteristics that may allow for these
translocation events to occur. Because of the lack of specific export and internalization
signals, the mechanism of translocation is likely mediated by chaperone proteins and
regulated by post-translational modifications. In fact, it has been shown that HMGA1
DNA binding affinity is reduced 20-fold in response to specific phosphorylation of the
protein at two threonine residues by cdc2 kinase during the G2/M phase of the cell cycle
(Nissen et al., 1991; Reeves et al., 1991). This event would allow for mobilization of the
proteins for interactions with nuclear export machinery and/or export chaperone proteins.
128
Based on the findings presented above, several lines of experimentation are necessary in
order to study the possible mechanisms of HMGA1 translocation.
Involvement of nuclear export machinery in the process of HMGA1
nucleocytoplasmic translocation can be initially evaluated by immunolocalization and
GFP live cell imaging studies following treatment of cells with leptomycin B (LMB).
Via direct associations, LMB is a specific inhibitor of the CRM1 complex responsible for
the active transport of leucine-rich nuclear export signal (NES) containing proteins across
the nuclear membrane (Kudo et al., 1998). While HMGA1 does not appear to possess a
classical NES based on computer based analysis (data not shown), it does contain nuclear
localization signals (NLS) that may act bidirectionally to promote nuclear export
(Guiochon-Mantel et al., 1994). Furthermore, the leucine-rich NES has not been well
defined as rapid export of proteins carrying NES sequences with only one leucine
(Bogerd et al., 1996) or completely atypical sequences (Mancuso et al., 1994; Fridell et
al., 1993) has been observed. This indicates that the lack of a canonical NES on the
HMGA1 protein does not rule out the possibility of CRM1 mediated export. In order to
determine the involvement of the nuclear export machinery in HMGA1
nucleocytoplasmic translocation, partially synchronized NIH3T3 cells can be treated with
low concentrations of LMB (20 uM to 200 nM) and analyzed by fixed cell
immunofluorescence at 16-18 hrs, post-synchronization, or by live cell GFP-HMGA1
imaging. Because we have recently developed a transgenic line of NIH3T3 cells
expressing the GFP-HMGA1 fusion protein, live cell imaging can be performed in the
context of cell synchronization and time sensitive LMB treatments without the need for
the coordination of transient transfections.
129

Beyond the specific involvement of the CRM1 complex in the export process,
energy dependence can by evaluated and used to determine the general manner in which
translocation occurs. That is, due to the small size of the HMGA1 proteins, passive
diffusion following some cellular stimuli that alters the binding of DNA and chromatin
binding characteristics of the proteins may be partially responsible for export.
Determining the need for ATP during nuclear export will either confirm results showing
LMB inhibition, or the lack there of, and determine if passive diffusion is involved.
While phosphorylation of HMGA1 during the G2/M phase of the cell cycle has been
shown to mobilize the proteins, subsequent passive diffusion is not likely due to evidence
that the process is quite slow compared to active transport (Laskey and Dingwall, 1993).
This conclusion is based on our live cell imaging data showing the rapid movement of the
HMGA1 proteins from the nucleus to the cytoplasm and back again (data not shown).
ATP dependency can be determined in a manner similar to the LMB assay above by
replacing LMB treatment with specific reagents capable of depleting intracellular ATP
such as carbonyl cyanide m-chloro phenyl hydrazone (CCCP) and azide. These reagents
deplete the ATP level to ~ 10% within 30 min. of treatment and thus their addition can be
performed just prior to known timepoints of HMGA1 translocation to prevent adverse
cellular side effects (Engel et al., 1998).
While the above mentioned phosphorylation of the HMGA1 proteins could
simply serve to mobilize the proteins for translocation, the modification or others may
also be involved in promoting chaperone protein interactions. This is a logical
conclusion based on the fact that HMGA1 proteins have been shown to be highly
modified between the second and third AT-hook DNA binding motifs where protein
130

partners typically interact (reviewed in Reeves, 2001). Because protein-protein
interactions involved in HMGA1 translocation are potentially complex and have not been
studied, anti-HMGA1 pull-down followed by the identification of unknown binding
partners by mass spectrometry (MS) would be an efficient method of determining
chaperone protein involvement. Interestingly, a recent study utilized a unique affinity
chromatographic strategy coupled with 2-D gel electrophoresis and MALDI-TOF or ESI
IT MS to identify HMGA1 interacting partners (Sgarra et al., 2005). This method
involved the production of recombinant HMGA1 proteins used for derivatization of
affinity columns and subsequent exposure of the columns to nuclear extracts of various
cell types. Following elution of bound proteins, 2-D gel electrophoresis and MS were
used for protein identification. The in vitro method resulted in the discovery or
confirmation of multiple protein binding partners, including heat shock cognate protein
71, a known chaperone. Modifications of these methods to analyze protein-protein
interactions following in vivo formaldehyde cross linking at the specific cell cycle stage
of HMGA1 nucleocytoplasmic translocation may serve to identify specific translocation
associated protein binding partners. Following these studies, confirmatory antibody
assays specific for the identified protein partners could be used in reciprocal co-
immunoprecipitation and western blot analysis.
Regardless of the precise mechanism of actual translocation, post-translational
modifications of the HMGA1 protein are very likely to be involved in the initiation and
regulation of the process as is true for other proteins that display similar cell cycle
dependent localization patterns. Of particular interest is the controlled localization of
cyclins B1 and D1 during specific stages of the cell cycle. In the case of cyclin B1,
131

during the majority of the cell cycle, accumulation occurs in the cytoplasm and at the
nuclear envelope. Immediately prior to mitosis, a dramatic translocation of the protein
into the nucleus takes place (Pines and Hunter, 1991). Similarities between the
cytoplasmic localization morphologies observed for cyclin B1 and those observed for
HMGA1 within NIH3T3 cells (Fig. 2.1) are conspicuous, and suggest association of both
proteins with mitochondria. In fact, cyclin B1 has been shown to co-localize with
insoluble ‘cytoplasmic structures’ that have yet to be identified, but are most likely not
the Golgi apparatus or the endoplasmic reticulum, as determined by double
immunofluorescence experiments (Pines and Hunter, 1991). In contrast to cyclin B1
redistribution, cyclin D1 resides in the nucleus throughout the G1 phase, and relocalizes
to the cytoplasm for the remainder of interphase (Alt et al., 2000). We show a similar
pattern of redistribution, with HMGA1 translocating from the nucleus to the cytoplasm
during the late S/G2 phase (Fig. 2.2). Such correlations between cell cycle controlled
redistribution of HMGA1 and cyclins B1 and D1 raise the possibility of a common
mechanism of localization control for these proteins.
Regulation of cyclin D1 redistribution at specific stages of the cell cycle is
dependent on the phosphorylation of a single threonine residue. While this has been
firmly established, the exact manner in which this modification results in nuclear export
has not been resolved (Alt et al., 2000). However, post-translational modifications are
thought to be one of the primary factors involved in the induction of protein
nucleocytoplasmic translocations (Topham et al., 1998; Alt et al., 2000; Fabbro and
Henderson, 2003; Haendeler et al., 2003). Not surprisingly, phosphorylation of cyclin B1
at a specific ‘cytoplasmic retention region’ has been regarded as a potential mechanism
132
for release of the protein into the nucleus (Pines and Hunter, 1994). This, coupled with
the high level of modifications that occur on the HMGA1 proteins, makes this
increasingly common theme of localization control a very possible mechanism for cell
cycle dependent HMGA1 redistribution. In order to determine the role of post-
translational modifications in this process, mutagenesis of HMGA1-GFP fusion proteins
at residues known to be modified can be done in conjunction with live cell imaging
and/or fixed cell immunofluorescence with anti-GFP antibodies. Similar studies were
recently performed in the context of subnuclear HMGA1 localization and chromatin
dynamics (Harrer et al., 2004). Briefly, it was determined, using mutagenic HMGA1-
GFP fusion proteins and fluorescence recovery after photobleaching (FRAP) assays, that
HMGA1 is a highly mobile component of chromatin and mitotic chromosomes.
Furthermore, it was shown that the kinetic properties of HMGA1a proteins are controlled
by the number of functional AT-hooks present and are regulated by differential patterns
of phosphorylation. That is, increasing phosphorylation levels were correlated to
increased residence times on heterochromatin and chromosomes, as compared to
euchromatic regions. Because these studies were not concerned with subcellular
localization patterns, differential post-translational modifications observed in these
studies are potential regulators of cell cycle stage specific HMGA1 mobilization and
mitochondrial localization.
Once nuclear export is achieved, HMGA1 proteins are capable of gaining access
to the interior matrix of the mitochondria (Fig 2.6, 2.9). In order to further confirm
internalization, submitochondrial fractionation by ultracentrifugation and subsequent
western blot analysis of the various fractions should be performed. Internalization of
133

HMGA1 into mitochondria is, again, likely a process involving chaperone proteins
coupled with transport machinery on the outer and inner mitochondrial membranes as
discussed in Chapter 2. While the mitochondrial import system has not been completely
characterized, and many internal mitochondrial proteins that are encoded in the nucleus
enter by an unknown mechanism, some experiments can be done to begin determining
how HMGA1 gains entry. This would primarily be accomplished by isolation of
cytoplasmic and mitochondrial fractions from synchronized or mixed populations of cells
following formaldehyde crosslinking. As described above, immunoprecipitation of
HMGA1 proteins can be followed by MS analysis to identify unknown protein partners.
Potential proteins involved in the process of HMGA1 internalization include soluble
chaperone proteins and membrane bound transport subunits of the TOM and TIM
mitochondrial transport machinery.
Transcriptional Activity of HMGA1 in Mitochondria
Because HMGA1 proteins were shown to be bound to, or indirectly associated
with, the regulatory D-loop of the mitochondrial genome (Fig 2.9), it was hypothesized
that transcription and/or replication of the genome may be affected by differential levels
of the protein. Indeed, as determined by real-time PCR analysis, both the levels of
mtDNA (Table 3.1, Fig. 3.1) and mitochondrial gene expression (Table 3.2, Fig. 3.2)
were altered in the presence of HMGA1 over-expression. Paradoxically, while mtDNA
levels were decreased by approximately 2-fold when compared to MCF-7 cells
expressing normal levels of HMGA1, the gene transcript levels were up-regulated by
approximately 3-fold. As discussed in chapter 3, this in not inconsistent with multiple
134

studies of mitochondrial DNA abnormalities in the context of a cancer phenotype and
may be indicative of a dual role for the HMGA1 protein. In order to further study the
roles of HMGA1 in the process of transcription and replication of mtDNA, multiple
techniques can be utilized to identify mitochondrial HMGA1 protein partners and
mtDNA nucleoid complexes, sites of HMGA1 binding around the entire genome, and
affects of differential HMGA1 expression on both LSP and HSP controlled gene
expression.
A short list of protein factors involved in transcription within the mitochondria
have been described and are often found in the context of mtDNA nucleoids. These
nucleoid complexes are recognized as an organization of mtDNA and protein factors
located at discrete foci within mitochondria. Originally, these complexes were described
in yeast (Miyakawa et al., 1984), but more recently, both genetic and cell biological
evidence suggest that mtDNA is organized in nucleoid-like structures in mammalian cells
as well (Jacobs et al., 2000; Lehtinen et al., 2000). Confirmation for this came with
cytological and biochemical assays to determine nucleoid location and protein
composition within various mammalian cell types (Garrido et al., 2003). Such studies
can be modified to determine if HMGA1 proteins are present within the nucleoid
complexes and in association with known mitochondrial transcription factors. Briefly,
immunocytochemical analysis can be performed to determine co-localization of HMGA1
and various known mitochondrial protein factors (TFAM, mtSSB, POLG2 etc.) with a
Twinkle-GFP fusion protein. Twinkle is a protein that is similar to the phage T7 gene 4
protein and was the first factor found to co-localize with mtDNA in mammalian cells
(Spelbrink et al., 2001). Nucleoids can also be identified by bromo deoxy uridine (BrdU)
135

incorporation into mtDNA of cells lacking cytoplasmic thymidine kinase (TK-). BrdU is
a thymidine analog that is incorporated into DNA only after being phosphorylated by a
thymidine kinase. In cells lacking cytoplasmic thymidine kinase , but retaining the
mitochondrial isozyme, mtDNA incorporation can be easily detected by performing
immunocytochemistry with a BrdU specific mAb. This, coupled with co-localization
assays using anti-HMGA1 antibodies is an independent method to determine the
involvement of HMGA1 in mtDNA transcription that is indicative of mtDNA nucleoid
association. Beyond these cytological methods, biochemical means of isolating mtDNA
nucleoids and associated proteins exists and is important for confirming
immunocytochemical results. Briefly, isopycnic gradient centrifugation isolated
mitochondria are lysed and separated into supernatant and pellet fractions that are
centrifuged in a sucrose gradient. Gradient fractions can then be analyzed by PCR to
confirm the presence of mtDNA or by western blot to identify specific proteins present.
The next logical step in determining the possible roles that HMGA1 plays within
mitochondria is to identify the sites of association around the entire mitochondrial
genome. By mapping the sites of HMGA1 binding around the genome, specific
functions can be extrapolated based on the number and types of DNA elements that
HMGA1 interacts with. As has been shown, HMGA1 associates with a specific region of
the D-loop that is upstream of HSP and downstream of LSP, close to CSBI (Fig. 2.9, Ch.
3 Discussion). As discussed in Chapter 3, this single observed binding site suggests a
dual and differential role for the HMGA1 proteins with regard to their affect on HSP or
LSP activity. Complete mapping of the HMGA1 binding sites will serve to confirm this
possibility and reveal more detailed mechanisms by which HMGA1 is able to directly
136

alter overall cellular mtDNA levels and/or mitochondrial gene expression. This can be
directly accomplished by ChIP analysis with multiple primer sets designed to specific
regions around the mitochondrial genome. Because this method would require the
optimization of numerous PCR reactions corresponding to the different primer sets, it
would be particularly time consuming. However, alternative microarray ChIP methods
developed and carried out by NimbleGen Systems Inc. (www.nimblegen.com) exist that
would remove the in house optimization and greatly increase accuracy and efficiency.
These methods are designed to rapidly identify protein binding sites along long stretches
of DNA and would serve to characterize the entire mitochondrial genome in a single
assay.
Currently, we have generated limited data regarding analysis of actual
mitochondrial gene transcript levels in the context of HMGA1 over-expression. The
NADH dehydrogenase subunit 2 (ND2) gene transcript was shown to be increased by
approximately 3-fold in cells over-expressing HMGA1 relative to non-over-expressing
cells (Table 3.2, Fig. 3.2). This observation likely translates into increases in the
majority of mitochondrially expressed proteins as the ND2 message is transcribed as part
of a large polycistronic message under the control of the mitochondrial HSP. If HMGA1
acts to enhance transcriptional initiation at DNA elements associated with the HSP, other
proteins resulting from the translation of the HSP generated mRNA, which are the
majority of mitochondrially encoded proteins (Fig. 1.4), would likely be increased. In
order to look more closely at this, real-time PCR or Northern Blot analysis should be
done for the remainder of the HSP and LSP genes. Based on what we know, it is likely
that transcripts from both promoters are elevated in the presence of increased HMGA1
137
levels. This would be consistent with data showing the HMGA1 mediated decrease in
mtDNA levels overall (Table 3.1, Fig. 3.1), as non-terminated transcription at LSP,
resulting in increased expression of L-strand genes, would preclude replication of the
genome.
In regard to the observed reduction in mtDNA, it is possible to look for a more
dramatic affect of HMGA1 on the replication of the genome. That is, it is possible to
reversibly deplete mtDNA within mammalian cells in culture and monitor the rate of
mtDNA return. This is accomplished by the addition of low concentration of ethidium
bromide (EtBr) to the tissue culture media for an extended number of passages (up to 30).
Upon removal of the EtBr, cells recover the mtDNA. Because HMGA1 potentially
inhibits mtDNA replication via prevention of LSP transcript termination, we hypothesize
that the rate of mtDNA return in the context of EtBr depletion would be severely
inhibited within cells over-expressing the protein. This would strongly confirm the role
of HMGA1 as a transcriptional regulator within the mitochondria and as a major factor
contributing to reductions in the levels of mtDNA within cancer cells. In addition to
EtBr, an alternative reagent (ditercalinium chloride) has been identified that acts in a
similar manner but appears to function more effectively over a wider range of cell types
(Okamaoto et al., 2003) and thus may be useful in these experimental approaches.
HMGA1 Mediated Alteration to Mitochondrial Function
Changes in mtDNA maintenance and expression in HMGA1 over-expressing
cells likely translate into alterations in the overall function of mitochondria. This has the
potential to affect multiple cellular processes including ROS production, ATP production,
138

apoptosis, overall metabolic phenotype, and even stimulation of signaling pathways that
affect nuclear function. Our results show that overall cellular mitochondrial mass is
reduced in the presence of high levels of HMGA1 (Fig. 3.3). Furthermore, cells over-
expressing HMGA1 are much more sensitive to treatment with 2-DG relative to non-
over-expressing cells (Fig. 3.4), indicating that HMGA1 is involved in the glycolytic
phenotype of cancer cells. This may or may not relate directly to overall reductions in
mtDNA and mitochondrial mass. In order to confirm the direct role of HMGA1 in
producing these differential effects, it is important to deplete HMGA1 levels in over-
expressing cell lines and assay for a return to normal mitochondrial mass and 2-DG
sensitivity. As discussed in Chapter 3, initial studies utilizing tetracycline (tet) depletion
of the HA-HMGA1 transgene in MCF-7 cells showed reversal of 2-DG sensitivity
compared to tet treated wild-type MCF-7 cells. Because pleiotropic effects of tet
treatment may be responsible for the observed reversals, it is important to perform similar
HMGA1 depletion studies using different techniques such as antisense or RNAi
technology.
In addition to characterizing the above observed effects, other mitochondrial
specific functions can be studied in the context of HMGA1 over-expression. Changes in
mitochondrial membrane potential (∆ψm) are detectable and have been observed
following EtBr mediated depletion of cellular mtDNA in C2C12 rhabdomyoblasts
(Biswas et al., 1999). Interestingly, the change in ∆ψm observed in this study was
accompanied by elevated cytosolic free [Ca2+]c and activation of calcium responsive
transcription factors indicating mitochondria-to-nucleus crosstalk. Because HMGA1
was shown to reduce mtDNA levels, it is possible that the proteins also indirectly affect
139
∆ψm. Furthermore, such changes may be accompanied by alterations to [Ca2+]c and
subsequent changes in nuclear gene expression profiles consistent with the cancerous
phenotype of HMGA1 over-expressing cells. In fact, subsequent mtDNA depletion
studies revealed that stress induced changes to [Ca2+]c originating with altered
mitochondrial ∆ψm resulted in the induction of an invasive phenotype in the otherwise
non-invasive C2C12 rhabdomyoblasts (Amuthan et al., 2001). The invasive behavior
was later attributed to mtDNA depletion induced elevation of steady state [Ca2+]c and
resulting over-expression of tumor invasion markers such as cathepsin L and TGFβ1, and
activation of calcium-dependent MAP kinases (ERK1 and ERK2) and calcineurin. Also,
the levels of anti-apoptotic proteins Bcl2 and Bcl-XL were increased, while pro-apoptotic
proteins Bid and Bax were reduced (Amuthan et al., 2002). Considering these findings, it
is intriguing that HMGA1 over-expressing cells were recently shown to display an
increased sensitivity to the activation of the Ras/ERK signaling pathway (Treff et al.,
2004). A contributing factor to this finding may very well be HMGA1 mediated
reductions in mtDNA levels and subsequent or direct alterations to mitochondrial ∆ψm.
To study this, cells with and without HMGA1 over-expression can by analyzed for
differential ∆ψm using the cationic lipid JC-1 (Invitrogen – Molecular Probes). JC-1 is a
dye that exists as a green-fluorescent monomer at low membrane potential. Upon
interactions with higher membrane potentials, the dye forms red-fluorescent “J-
aggregates” that exhibit a broad excitation and emission maximum at ~590 nm. The ratio
of red-to-green fluorescence is independent of morphological factors such as
mitochondrial size, shape, and density that may influence single-component fluorescence
signals (Smiley et al., 1991; Invitrogen-Molecular Probes – Product Literature). .
140

Other cancer related alterations to mitochondrial function are changes to the
efficiency of ATP production by oxidative phosphorylation and resulting ROS
production. Total cellular ATP levels can be determined by bioluminescence using a
ATP-bioluminescent somatic cell assay kit (Sigma-Aldrich). Mitochondrially generated
ATP can be determined by subtracting the amount of ATP synthesized in cells pretreated
with CCCP or oligomycin from the total cellular ATP in untreated cells. Because
HMGA1 produces sensitivity to treatment of cells with 2-deoxyglucose, ATP produces
via oxidative phosphorylation in the mitochondria is likely reduced in HMGA1 over-
expressing cells. If results from ATP analysis support this hypothesis, it is likely that
HMGA1 proteins play a causative role in the generation of a Warburg glycolytic
phenotype observed in cancer cells. This effect would logically be an indirect result of
HMGA1 mediated reductions in mtDNA as a loss of mitochondrially generated ATP has
been shown within EtBr treated cells displaying a large percent reduction in mtDNA
(Amuthan et al., 2002).
In addition to ATP, oxidative phosphorylation in the mitochondria produces ROS
that can damage matrix localized mtDNA. Elevated levels of mitochondrial ROS in
cancer cells may be partly responsible for an increased occurrence of mtDNA mutations.
Although probably indirect, HMGA1 over-expression may lead to increases in total
cellular ROS. This would be consistent with findings showing that increased H2O2, a
common ROS generated in the mitochondria, is capable of inducing MAP kinases in
HeLa cells (Nemoto et al., 2000). Again, similar to possible HMGA1 mediated
reductions in mtDNA, effects of HMGA1 over-expression on ROS levels may be a
partial mechanism by which the proteins activate Ras/ERK signaling pathways (Treff et
141

al, 2004). Multiple assays exist to monitor differential ROS levels in HMGA1 over-
expressing and non-over-expressing cells. Cells can be analyzed by flow cytometry
following treatment with the cell permeant nonfluorescent 2’7’-
dicholorodihydrofluorescein diacetate (H2DCFDA). Upon exposure to intracellular ROS,
the dye becomes oxidized, resulting in the highly fluorescent 2’,7’-dichlorofluorescein
(DCF). Increased levels of ROS in cells over-expressing HMGA1 may directly
contribute to increased mtDNA mutations in cancer cells.
HMGA1 Mediated Inhibition of Mitochondrial DNA Repair
Initial data suggests that HMGA1 may be involved in reducing the capacity of
mitochondria to repair DNA damage resulting from matrix generated ROS (Fig. 3.5).
This is consistent with the ability of HMGA1 to inhibit nuclear NER (Adair et al., 2005)
and possibly base excision repair (BER) (unpublished observations) pathways.
Confirmation of the mtDNA repair data by increased timepoints following exposure to
different DNA damaging agents is necessary. In addition to repetition of gene-specific
repair assays as described in Chapter 3, alternative approaches exist. These include
treatment of cells with damaging agents such as menadione which after isolation of DNA
and treatment with NaOH results in strand breaks at sites of damage. Using this
platform, blot analysis. Importantly, it turns out that the method of mtDNA isolation is
critical when evaluating the levels of DNA base lesions present, as oxidation during the
process results in artificial increases in detectable damage. For this reason, assays, such
as the gene specific repair assay described in Chapter 3, which do not require mtDNA
isolation, are preferable. These assays involved isolation of total cellular DNA and
142
subsequent analysis of DNA lesions. Using this method, isolated genomic DNA can also
be treated with specific DNA glycosylases that cut the damaged DNA at specific
oxidative base lesions. Strand breaks can then be quantified by Southern blot analysis.
Beyond studying the effect of HMGA1 over-expression on rates of DNA damage
repair in the mitochondria, interacting protein partners can be identified to further
confirm the role of HMGA1 in the process. In mitochondria, oxidative DNA damage is
largely in the form of 8-oxo-guanine (8-oxoG) and thymine glycol (TG) lesions (Ames,
1989; Dizdaroglu, 1993). To date, it appears that these lesions are primarily repaired by
short patch BER (reviewed in Bohr, 2002). While little is known regarding the
mitochondrial BER pathway compared to the nuclear equivalent, several key protein
factors have been determined to be involved. These include a mammalian mitochondrial
endonuclease that recognizes AP sites (Tomkinson et al., 1988), a DNA ligase related to
DNA ligase III (Lakshmipathy and Campbell, 1999), and a mitochondrial oxidative
damage endonuclease (mtODE) (Croteau et al., 1997). Co-immunoprecipitation studies
to determine if HMGA1 interacts with any of these proteins would confirm the role of
HMGA1 in the mtDNA repair process. These studies would utilize MS analysis to
identify unknown protein partners within mitochondrial extracts and would be verified by
western blot analysis.
In addition to directly studying DNA repair in mitochondria, it would be
interesting to determine the affect of HMGA over-expression on the actual occurrence of
mtDNA mutations. Assuming HMGA1 is capable of inhibiting DNA repair in
mitochondria, it is likely that subsequent increases in DNA mutations would also be
detectable. This would be consistent with studies that have detected an increased
143
frequency of mutations in mtDNA within cancers of the bladder, head and neck, lung,
liver and pancreas when compared to normal tissue (Fliss et al., 2000; Jones et al., 2001;
Nishikawa et al., 2001). Of particular interest is the high level of mutations found within
the non-coding D-loop region (Fliss et al, 2000). Mutations in mtDNA within cells over-
expressing HMGA1 can be determined by over lapping primer PCR amplification and
cycle sequencing (Nomoto et al., 2002).
Closing Remarks
Possible future work concerning mitochondrial localization of the HMGA1
proteins presented above represents initial steps toward a greater understanding of both
carcinogenesis and mitochondrial biology. New links between aberrant mitochondrial
function and the process of transformation and metastatic progression demonstrate the
vital importance of filling in gaps in our current understanding of the mitochondria. To
date, transcription and replication of mtDNA is not well understood, emphasizing the
importance of the addition of HMGA1 to the list of factors involved these processes.
Considering the nuclear role of HMGA1, research regarding its function within the
mitochondria should be focused on direct transcriptional activity and repair of mtDNA.
Alterations to both of these processes are potentially at the center of overall changes to
mitochondrial function observed in HMGA1 over-expressing cancer cells. A major step
forward in our ability to study these and other processes will come with the creation of
new experimental models specific to mitochondrial HMGA1 function. For example, the
experiments outlined in this chapter will be greatly strengthened and confirmed by their
repetition within a transgenic cell line expressing an HMGA1 protein fused to a
144

mitochondrial localization signal (MTS) as briefly mentioned in Chapter 3. By directing
HMGA1 directly to the mitochondria, alterations to organelle function on all fronts will
be much more easily studied. Using this model, the effects of actual HMGA1 directed
changes to mitochondrial function should be amplified, while those changes which can be
attributed to an overall cancer related phenotype should remain unchanged. Currently,
this model is under development in the lab and should yield important data regarding
HMGA1 function within the mitochondria and how this is related to cancer.
145
References
Adair, J.E, Y.H. Kwon, G.A. Dement, M.J. Smerdon, and R. Reeves. 2005. Inhibition of Nucleotide Excision Repair by High Mobility Group Protein HMGA1. J. Biol.Chem 280:32184-32192. Alt, J.R., J.L. Cleveland, M. Hannink, and J.A. Diehl. 2000. Phosphorylation-dependent regulation of cyclin D1 nuclear export and cyclin D1-dependent cellular transformation. Genes Dev. 14:3102-3114. Ames, B.N. 1989. Endogenous oxidative DNA damage aging and cancer. Free Radic. Res. Commun. 7:121-128. Amuthan, G., G. Biswas, H.K. Ananadatheerthavarada, C. Vijayasarathy, H.M. Shepard, and N.G. Avadhani. 2002. Mitochondrial stress-induced calcium signaling, phenotypic changes and invasive behavior in human lung carcinoma A549 cells. Oncogene. 21:7839-7849. Amuthan, G., G. Biswas, S.Y. Zhang, A. Klein-Szanto, C. Vijayasarathy, and N.G. Avadhani. 2001. Mitochondria-to-nucleus stress signaling induces phenotypic changes, tumor progression and cell invasion. EMBO J. 20:1910-1920. Baggetto, L.G. 1993. Role of mitochondria in carcinogenesis. Eur. J. Cancer 29A:156-159. Bandy, B., and A.J. Davison. 1990. Mitochondrial mutations may increase oxidative stress: implications for carcinogenesis and aging? Free Rad. Biol. Med. 8:523-539. Biswas, G., O.A. Adebanjo, B.D. Freedman, H.K. Anandatheerthavarada, C. Vijayasarathy, M. Zaidi, M. Kotlikoff, and N.G. Avadhani. 1999. Retrograde Ca2+ signaling in C2C12 skeletal myocytes in response to mitochondrial genetic and metabolic stress: a novel mode of inter-organelle crosstalk. EMBO J. 18:522-533. Bogerd, H.P., R.A. Fridell, R.E. Benson, J. Hua, and B.R. Cullen. 1996. Protein sequence requirements for function of the human T-cell leukemia virus type 1 Rex nuclear export signal delineated by a novel in vivo randomization-selection assay. Mol. Cell. Biol. 16:4207-4214. Cavelli, L.R. and B.C. Liang. 1998. Mutagenesis, tumorigenicity, and apoptosis: are the mitochondria involved: Mutat. Res. 398:19-26. Chomyn A., and G. Attardi. 2003. MtDNA mutations in aging and apoptosis. Biochem. Biophys. Res. Comm. 304: 519-529.
146

Croteau, D.L., R.C. ap Rhys, E.K. Hudson, G.L. Dianov, R.G. Hansford, and V.A. Bohr. 1997. An oxidative damage-specific endonuclease from rat liver mitochondria. J. Biol. Chem. 272:27338-27344. Dizdaroglu, M. 1993. Chemistry of free radical damage to DNA and nucleoproteins. London, England: Ellis Horwood, Ltd. 18-39. Engel, K., A. Kotlyarov, and M. Gaestel. 1998. Leptomycin B-sensitive nuclear export of MAPKAP kinase 2 is regulated by phosphorylation. EMBO J. 17:3363-3371. Fabbro, M., and B.R. Henderson. 2003. Regulation of tumor suppressors by nuclear-cytoplasmic shuttling. Exp. Cell. Res. 282:59-69. Fliss, M.S., H. Usadel, O.L. Caballero, L. Wu, M.R. Buta, S.M. Eleff, J. Jen, and D. Sidransky. 2000. Facile detection of mitochondrial DNA mutations in tumors and bodily fluid. Science 287:2017-2019. Fridell, R.A., K.M. Partin, S. Carpenter, and B.R. Cullen. 1993. Identification of the activation domain of equine infectious anemia virus rev. J. Virol 67:7317-7323. Garrido, N., G. Lorena, E. Jokitalo, J. Wartiovaara, A.M. van der Bliek, and J.N. Spelbrink. 2003. Composition and Dynamics of Human Mitochondrial Nucleoids. Mol. Biol. Cell 14:1583-1596. Guiochon-Mantel, A., K. DeLabre, P. Lescop, and E. Milgrom. 1994. Nuclear localization signals also mediate the outward movement of proteins from the nucleus. Proc. Natl. Acad. Sci. USA 91:7179-7183. Haendeler, J., J. Hoffman, R.P. Brandes, A.M. Zeiher, and S. Dimmeler. 2003. Hydrogen peroxide triggers nuclear export of telomerase reverse transcriptase via Src kinase family-dependent phosphorylation of tyrosine 707. Mol. Cell Biol. 23:4598-4610. Harrer, M., H. Luhrs, M. Bustin, U. Scheer, and R. Hock. 2004. Dynamic interaction of HMGA1a proteins with chromatin. J. Cell. Sci. 117:3459-3471. Hoberman, H.D. 1975. Is there a role for mitochondrial genes in carcinogenesis? Cancer Res. 35:3332-3335. Jacobs, H.T., S.K. Lehtinen, and J.N. Spelbrink. 2000. No sex please, we’re mitochondria: a hypothesis on the somatic unit of inheritance of mammalian mtDNA. Bioessays 22:564-572. Jones, J.B. J.J. Song, P.M. Hempen, et al. 2001. Detection of mitochondrial DNA mutation in pancreatic cancer offer a “Mass”-ive advantage over detection of nuclear DNA mutation. Cancer Res. 61:1299-1304.
147

Kudo, N., B. Wolff, T. Sekimoto, E.P. Schreiner, Y. Yoneda, M. Yanagida, S. Horinouchi, and M. Yoshida. 1998. Leptomycin B Inhibition of Signal-Mediated Nuclear Export by Direct Binding to CRM1. Exp. Cell. Res. 242:540-547. Lakshmipathy, U., and C. Campbell. 1999. The human DNA ligase III gene encodes nuclear and mitochondrial proteins. Mol. Cell. Biol. 19:3869-3876. Laskey, R.A. and C. Dingwall. 1993. Nuclear shuttling: the default pathway for nuclear proteins? Cell 74:385-386. Lehtinen, S.K. N. Hance, A. El Meziane, M.K. Juhola, K.M. Juhola, R. Karhu, J.N. Spelbrink, I.J. Holt, and H.T. Jacobs. 2000. Genotypic stability, segregation and selection in heteroplasmic human cell lines containing np 3234 mutant mtDNA. Genetics 154: 363-380. Mancuso, V.A., T.J. Hope, L. Zhu, D. Derse, T. Phillips, and T.G. Parslow. 1994. Posttranscriptional effector domains in the Rev proteins of feline immunodeficiency virus and equine infectious anemia virus. J. Virol. 68:1998-2001. Miyakawa, I., H. Aoi, N. Sando, and T. Kuroiwa. 1984. Fluorescence microscopic studies of mitochondrial nucleoids during meiosis and sporulation in the yeast, Saccharomyces cerevisiae. J. Cell Sci. 66:21-38. Nemoto, S., K. Takeda, Z.X. Yu, V.J. Ferrans, and T. Finkel. 2000. Title. Mol. Cell. Biol. 20:7311-7318. Neubert, D., W. Hopfenmuller, and G. Fuchs.1981. Manifestation of carcinogenesis as a stochastic process on the basis of an altered mitochondrial genome. Arch. Toxicol. 48:89-125. Nissen, M.S., T.A. Langan, and R. Reeves. 1991. Phosphorylation by cdc2 kinase modulates DNA binding activity of high mobility group protein I nonhistone chromatin protein. J. Biol. Chem. 266:19945-19952. Nomota, S., M. Sanchez-Cespedes, and D. Sidransky. 2002. Identification of mtDNA Mutations in Human Cancer. Methods Mol. Biol. 197:107-117. Okamaoto, M., T. Ohsato, K. Nakada, K. Isobe, J.N. Spelbrink, J. Hayashi, N. Hamasaki, and D. Kang. 2003. Ditercalinium chloride, a pro-anticancer drug, intimately associates with mammalian mitochondrial DNA and inhibits its replication. Curr. Genet. 43:364-370. Penta, J.S., F.M. Johnson, J.T. Wachsman, and W.C. Copeland. 2001. Mitochondrial DNA in human malignancy. Mutat. Res. 488:119-133.
148

Pines, J. and T. Hunter. 1991. Human cyclins A and B1 are differentially located in the cell and undergo cell cycle-dependent nuclear transport. J. Cell. Biol. 115:1-17. Pines, J. and T. Hunter. 1994. The differential localization of human cyclins A and B is due to a cytoplasmic retention signal in cyclin B. EMBO J. 13:3772-3781. Reeves, R. 2001. Molecular biology of HMGA proteins: hubs of nuclear function. Gene 277:63-81. Reeves, R., T.A. Langan, and M.S. Nissen. 1991. Phosphorylation of the DNA-binding domain of nonhistone high-mobility-group I protein by cdc2 kinase: reduction of binding affinity. Proc. Natl. Acad. Sci. USA 88:1671-1675. Richter, C. 1988. Do mitochondrial DNA fragments promote cancer and aging? FEBS Lett. 241:1-5. Schumacher, H.R. I.E. Szelkely, S.B. Patel, and D.R. Fisher. 1973. Mitochondria: a clue to oncogenesis: Lancet 2:327. Sgarra, R., M.S. Tessari, J. Di Bernardo, A. Rustighi, P. Zago, S. Liberatori, A. Armini, L. Bini, V. Giancotti, and G. Manfioletti. 2005. Discovering high mobility group A molecular partners in tumour cells. Proteomics 5:1494-1506. Shay, J.W. and H. Werbin. 1987. Are mitochondrial DNA mutations involved in the carcinogenic process: Mutat. Res. 186:149-160. Smiley, S.T., M. Reers, C. Mottola-Hartshorn, M. Lin, A. Chen, T.W. Smith, G.D. Steele, and L.B. Chen. 1991. Intracellular heterogeneity in mitochondrial membrane potentials revealed by a J-aggregate-forming lipophilic cation JC-1. Proc. Natl. Acad. Sci. USA. 88:3671-3675. Spelbrink, J.N., F.Y. Li, V. Tiranti, K. Nikali, Q.P. Yuan, M. Tariq, S. Wanrooij, N. Garrido, G. Comi, L. Morandi, L. Santoro, A. Toscano, G.M. Fabirzi, H. Somer, R. Croxen, D. Beeson, J. Poulton, A. Suomalainen, H.T. Jacobs, M. Zeviani, and C. Larsson. 2001. Human mitochondrial DNA deletions associated with mutations in the gene encoding Twinkle, a phage T7 gene 4-like protein localized in mitochondria. Nat. Genet. 28:223-231. Tomkinson, A.E., R.T. Bonk, and S. Linn. 1988. Mitochondrial endonuclease activities specific for apurinic/apyrimidinic sites in DNA from mouse cells. J. Biol. Chem. 263:12532-12537. Topham, M.K., M. Bunting, G.A. Zimmerman, T.M. McIntyre, P.J. Blackshear, and S.M. Prescott. 1998. Protein kinase C regulates the nuclear localization of diacylglycerol kinase-ζ. Nature 394:697-700.
149
Treff, N.R., D. Pouchnik, G.A. Dement, R.L. Britt, and R. Reeves. 2004. High-mobility group A1a protein regulates Ras/ERK signaling in MCF-7 human breast cancer cells. Oncogene 23:777-785. Warburg, O. 1956. On the origin of cancer cells. Science. 123:309-314. Wilkie, D., V. Egilsson, and I.H. Evans. 1975. Mitochondria in oncogenesis. Lancet 3 (22) 697-698. Zafar, M.N., M. O’Brien, and D. Catovsky. 1982. Similarities in mitochondrial ultrastructure of leukemic cells and ethidium-bromide-treated normal cells. J. Ultrastruct. Res. 81:133-138.
150