mission to planet ea ,rth role of clouds and radiation in ... to planet ea role of clouds and...
TRANSCRIPT

Mission to Planet Ea Role of Clouds and Radiation in Climate
,rth
and
Bruce A. Wielicki,* Robert D. Cess,+ Michael D. King,#
David A. Randall,@ Edwin F. Harrison*
Abstract
The role of clouds in modifying the earth’s radiation balance is
well recognized as a key uncertainty in predicting any potential future climate change. This statement is true whether the climate
change of interest is caused by changing emissions of greenhouse gases and sulfates, deforestation, ozone depletion, volcanic erup-
tions, or changes in the solar constant. This paper presents an overview of the role of the National Aeronautics and Space
Administration’s Earth Observing System (EOS) satellite data in understanding the role of clouds in the global climate system. The
paper gives a brief summary of the cloud/radiation problem, and
discusses the critical observations needed to support further
investigations. The planned EOS data products are summarized,
including the critical advances over current satellite cloud and radiation budget data. Key advances include simultaneous obser-
vation of radiation budget and cloud properties, additional informa- tion on cloud particle size and phase, improved detection of thin
clouds and multilayer cloud systems, greatly reduced ambiguity in partially cloud-filled satellite fields of view, improved calibration
and stability of satellite-observed radiances, and improved esti- mates of radiative fluxes at the top of the atmosphere, at the
surface, and at levels within the atmosphere. Outstanding sam-
pling and remote sensing issues that affect data quality are also discussed. Finally, the EOS data are placed in the context of other
satellite observations as well as the critical surface, field experi-
ment, and laboratory data needed to address the role of clouds in
the climate system. It is concluded that the EOS data are a necessary but insufficient condition for solution of the scientific
cloud/radiation issues. A balanced approach of satellite, field, and laboratory data will be required. These combined data can span
the necessary spatial scales of global, regional, cloud cell, and cloud particle physics (i.e., from 1 O* to 1 O-’ m).
*Atmospheric Sciences Division, NASA Langley Research Center,
Hampton, Virginia. ‘InstituteforTerrestrial and Planetary Atmospheres, State University
of New York, Stony Brook, New York. #Earth Sciences Directorate, NASA Goddard Space Flight Center,
Greenbelt, Maryland. “Department of Atmospheric Science, Colorado State University,
Fort Collins, Colorado. Corresponding author address: Dr. Bruce A. Wielicki, Radiation
Sciences Branch, Atmospheric Sciences Division, NASA Langley Research Center, Mail Stop 420, Hampton, VA 23681-0001.
In final form 31 March 1995. 0 1995 American Meteorological Society
Bulletin of the American Meteorological Society
1. Introduction
In the next century, the earth faces the potential of rapid environmental change. The magnitude, regional distribution, and timing of global environmental change could have a profound societal impact, but it is not yet possible to provide policy makers with unequivocal answers to vexing questions about these effects, due in large part to a lack of knowledge of the interdepen- dent processes that affect regional and global climate. Among those problems that have received increased attention in recent years are global warming; polar ice and sea level changes; deforestation, desertification, and reduction in biodiversity; ozone depletion; changes in ocean circulation; volcanic eruptions; and changes in cloud radiative effects resulting from greenhouse warming and increases in anthropogenic aerosols. Such environmental changes could have a profound impact on many nations, and yet many scientific questions concerning these impacts remain unan- swered.
The National Aeronautics and Space Administra- tion (NASA) is working with the national and interna- tional scientific communities to establish a sound basis for addressing these scientific issues through research efforts coordinated under the U.S. Global Change Research Program (USGCRP). NASA’s con- tribution to the USGCRP is the Mission to Planet Earth, which consists of a series of space-based remote sensing platforms, the largest of which is the Earth Observing System (EOS), EOS computing fa- cilities, and scientific research investigations. EOS will aid in developing a more complete understanding of the consequences of human activities for the global environment. EOS involves a series of earth-orbiting satellites that will carry an array of advanced well- calibrated instruments designed to provide critical global observations of the earth’s oceans, land, and atmosphere. The satellite orbits and instrument comple- ments are varied, depending on both the scientific sampling requirements and the financial savings that can be derived by combining U.S. and international efforts such as those of Europe, Japan, Canada, and others.
2125

For studies of clouds and radiation, the primary processes. Section 8 provides some brief concluding instruments are planned for launch on statements.
Satellite Sponsor Launch Measurements
The presentation of material is focused primarily on NASA’s EOS program. We have, however, endeav- ored to include the key links to other national and international observing programs, both satellite and surface based. International and interagency coop- eration will be a key element of the success or failure of our studies of the role of clouds and radiation in the
earth’s climate system.
TRMM Japan1lJ.S.
EOS-AM U.S./Japan
EOS-PM U.S./ESA
METOP EUMETSAT
EOS-ALT U.S.
1997
1998
2000
2000
2002
radiative fluxes and cloud properties
radiaCvefluxes and cloud properties
radiativefluxesand cloud properties
cloud properties: complements EOS-AM
active lidar
cloud height
TRMM (Simpson et al. 1988) is the Tropical Rainfall
Measuring Mission, EOS-AM is the EOS morning Platform (1030 LT sun-synchronous orbit), EOS-PM is the EOS afternoon Platform (1330 LT sun-synchro- nous orbit), METOP is a European operational meteo- rological satellite in the same sun-synchronous orbit as EOS-AM, and EOS-ALT is the EOS Altimetry mission. The reason for measuring both radiative fluxes and cloud properties in multiple satellite orbits is to properly sample the large diurnal variations in the radiative fluxes as well as cloud properties.
In this paper, we describe the key scientific issues related to climate and global change, focusing on specific examples of how EOS will contribute to improving our understanding of the critical role of clouds and radiation in climate. Section 2 explains why clouds, radiation, water vapor, and precipitation have been identified by the USGCRP and the Inter- governmental Panel on Climate Change as one of the seven keys to understanding global climate change. Section 3 gives some of the key scientific questions and outlines the critical observations needed to ad- dress these questions. Section 4 summarizes the existing global satellite datasets and summarizes the planned EOS data products. Section 5 discusses the remote sensing challenges for the global remote sensing of cloud properties and radiative fluxes. Both the improvements expected using the EOS data and the remaining challenges are summarized. Section 6 gives examples of some of the critical surface obser- vations and field experiment data needed to validate and complement the EOS global datasets. Section 7 briefly discusses the ties of cloud properties and radiative fluxes to oceanic processes and to land
2126 Vol. 76, No. 7 1, November 1995
2. Why clouds and radiation?
a. Overview of climate and radiation One of the most challenging problems confronting
atmospheric scientists is the prediction of future cli- matic change caused by anthropogenic alterations of atmospheric composition. Arrhenius (1896) long ago predicted that the burning of fossil fuels would increase the concentration of CO, within the earth’satmosphere, increasing the atmospheric greenhouse effect, and thus leading to global warming. More recently, we have learned that realities arefarmore complex.Green- house gases, other than CO,, are also increasing, and it is estimated that collectively they are as important as CO, (Houghton et al. 1990). To further complicate matters, fossil fuel burning introduces sulfate aerosols into the atmosphere, which, by themselves, would produce global cooling (Charlson et al. 1992).
The earth’s global radiation budget is illustrated in Fig. 1. Averaged over the globe and over a year, there is roughly 340 W mm2 of incident shortwave (SW) radiation coming from the sun. Of this, 30%, or about 100 W m-‘, is reflected back to space so that the climate system absorbs 240 W mm2, which, under equilibrium conditions, is equal to the longwave (LW) emission by the climate system. A convenient means of illustrating the climatic effect of increasing a green- house gas is to compute the change in equilibrium climate caused by a doubling of atmospheric CO,.
If the CO,concentration is instantaneously doubled, emission by the climate system (actually the sutface- troposphere system) is reduced by roughly 4 W m-‘, or about 1.7% (Houghton et al. 1990), because of the increased greenhouse effect. This 4 W mm2 radiative imbalance would induce a time-dependent climate change, ultimately resulting in a new equilibrium cli- mate. If we simplistically assume that climate change involves solely temperature changes, then the earth would warm until radiative balance was achieved. That is, the LW emission must increase from 236 to 240 W m-2, which requires an increase in global-mean surface temperature of 1.2 K, or about 0.4% of its globally averaged value of 288 K.

Incident SW =340Wm-2
Reflected SW = 100 W m-*
A “7 f / I Emitted LW i \ =240Wm-*
Instantaneous CO2 Doubling: Emitted LW=236 W m-*
FIG. 1. Schematic illustration of the earth’s radiative energy
balance and how a doubling of atmospheric carbon dioxide would
perturb that balance.
Current GCMs, however, produce both greater warming and substantial disagreement, ranging from 1.7 to 5.4 K (Houghton et al. 1990). The disagreement stems from the different depictions of climate feed- back mechanisms in GCMs that can either amplify or moderate the warming. For example, a warmer cli- mate means a warmer troposphere that will contain more water vapor, which itself is a greenhouse gas. Thus, water vapor provides a positive (amplifying) feedback mechanism. An intercomparison of 19 GCMs (Cess et al. 1990) showed the models to be in remark- able agreement regarding this particular feedback. The feedback associated with cloudiness changes, however, is quite a different matter, as will be demon- strated in the following section.
b. Clouds and general circulation mode/s Before describing how cloud feedback can influ-
ence global warming, it is first necessary to under- stand how clouds affect the earth’s current radiation balance as revealed by the Earth Radiation Budget Experiment (ERBE) (Ramanathan et al. 1989; Harrison et al. 1990). Figure 2 shows the earth’s radiation budget for a hypothetical situation in which there are no clouds but all other things remain unchanged. Note the 20 W m-* imbalance (surplus) in the absence of clouds. Introduction of clouds into this situation results in enhanced SW reflection, which cools the earth- atmosphere system [SW cloud radiative forcing (CRF)] by 50 W m-2. Also, the greenhouse effect of clouds in the LW produces a 30 W m-* warming (LW CRF). Thus, the net effect of clouds on the present climate (net CRF) is a cooling of 20 W m-2, and this is what
closes the 20 W m-* imbalance of the hypothetical situation shown in Fig. 2.
A common misconception is that because clouds cool the present climate, they will likewise act to moderate global warming. It is, however, the change in net CRF, associated with a change in climate, that governs cloud feedback. Illustrated in Fig. 3 are changes in net CRF (ACRF) normalized to the pertur- bation radiative forcing G, produced by 19 GCMs for a specific climate change simulation (Cess et al. 1990). The direct radiative forcing G induces the change in climate; thus, if ACRF/G = 0 there is no cloud feedback, whereas if ACRF/G = 1, for example, the ACRF has the same magnitude as the direct forcing, so that cloud feedback is positive, amplifying the warming by a factor of 2. Cloud feedback differs considerably among the 19 models, ranging from modest negative feedback in some models to strong positive feedback in others.
c. Global radiation measurements The prior section clearly demonstrates the need to
improvecloud-climate interactions in GCMs. Although there is no surrogate available for long-term climate change, a “perfect” GCM, if available, would produce proper cloud feedback as well as correct seasonal changes in CRF. The latter thus constitutes one test of cloud-climate interactions in GCMs. Specifically, we employ seasonal ACRF results, evaluated from ERBE
Incident SW = 340 W m’*
Reflected SW = 50,W m -*
/ \ L) $ I I j I i I i
Emitted LW ! i = 270 W m-*
FIG. 2. Schematic illustration of how clouds impact the earth’s
radiative energy balance.
Bulletin of the American Meteorological Society 2127

, , , ,,,I I I, I I I I I I I I
G = Forcing
FIG. 3. The cloud feedback parameter CRF/G, as produced by 19 atmospheric GCMs (Cess et al. 1990).
data as described by Cess et al. (1992), for such a comparison. To amplify theACRF signal, as well as to suppress interannual variability, this quantity is differenced between the extreme months (January minus July) and the Southern and Northern Hemi- spheres (SH minus NH). It is emphasized that this is not a test of cloud feedback. Rather, the latitudinal variation of ACRF, as defined above, is governed by seasonal shifts in cloudiness with latitude. The most notable is the movement of the intertropical conver- gence zone out of the winter hemisphere and into the summer hemisphere, which results in a maximum in LWACRF and a minimum in SWACRF at a latitude of 10” as demonstrated in Fig. 4.
Also included in Fig. 4 are seasonal LW and SW ACRF results from 17 contemporary GCMs. All ACRF values have been weighed by latitudinal area through multiplication by the cosine of latitude. Only a few models are in reasonable agreement with the ERBE results, and for all models the agreement is poorer for the SW than for the LW. While seasonal ACRF pro- vides no information regarding cloud feedback, it does provide a test to determine which models agree best with the ERBE ACRF results, and thus might also be expected to produce the most realistic cloud feed- back. This example clearly demonstrates the use of satellite radiometric data for developing, improving, and validating GCMs.
Satellite data can also be used directly to study long-term climate perturbations. The June 1991 erup- tion of Mount Pinatubo in the Philippines (15”N, 120”E) provides a dramatic illustration. The mass of sulfur dioxide, which produces highly reflective stratospheric sulfate aerosols, injected by Mount Pinatubo was
almost three times that of the 1982 El Chichon erup- tion in Mexico (McCormick and Viega 1992). The ERBE results (Minnis et al. 1993) represent the first unambiguous, direct measurements of volcanic radia- tive forcing on a large scale with simultaneous obser- vations of aerosol optical depth. Results show a strong cooling effect due to the Pinatubo aerosols during a 4-month period following the eruption. They show that the eruption of Mount Pinatubo produced the largest earth radiation budget perturbation yet observed. The primary effects of the aerosols were a direct increase in albedo over mostly clear areas as well as increases in the albedo of clouds. These data provide a direct link between aerosol measurements and the models that predict climate response.
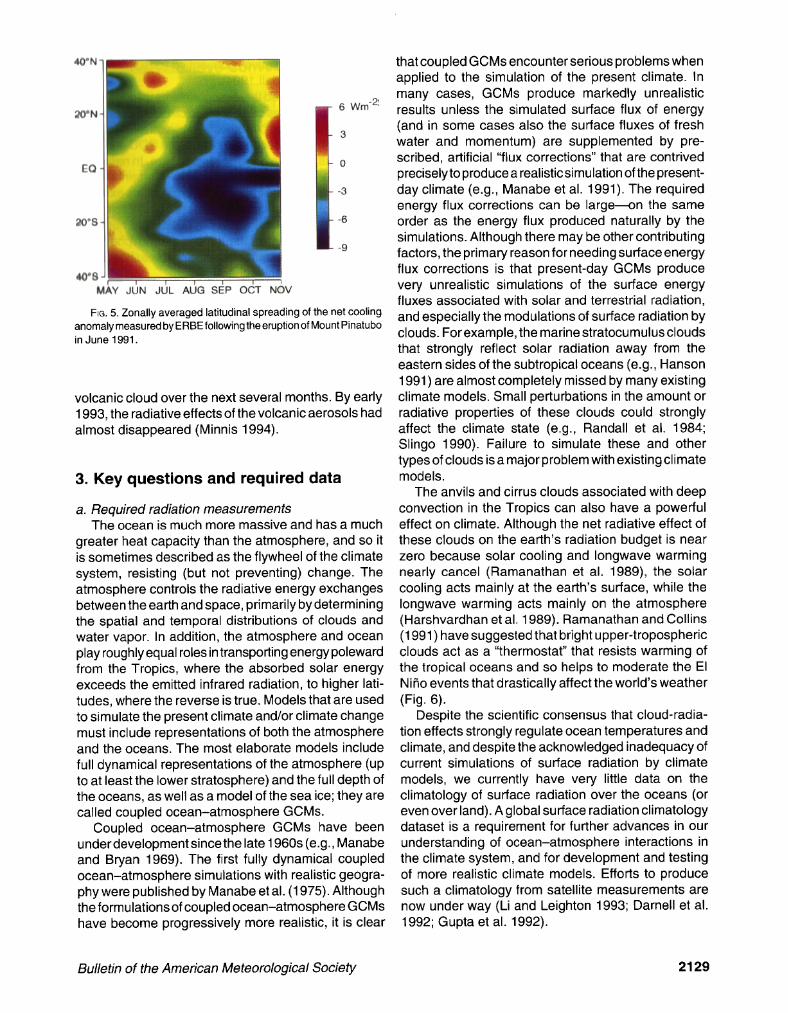
Analyses of Advanced Very High Resolution Radi- ometer (AVHRR) data showed that the volcanic cloud spread inhomogeneously, increasing the averagevalue of optical depth over the tropical Pacific to approxi- mately 0.35 by mid-August (Stowe et al. 1992). Figure 5 shows the zonally averaged spreading of the de- crease in net radiation measured by ERBE after the eruption of Mount Pinatubo (Minnis et al. 1993). The anomaly is the value for a given month relative to the 5-yr monthly mean from 1985 to 1989. Volcanic aero- sols reflect some of the earth’s energy back to space, thus cooling the climate. The zonal spreading of the flux anomalies closely followed the spread of the
1001 * , . I . I . I . I . ,
Longwave
50
25 cu- ‘E O
E -25
B -50
a -75
$ 100 I * I * I. ,---. I - , - I Shortwave . .-
75 -
_’ .,’ -. *.
.9 _ -. .
I”
0 10 20 30 40 50 60
Latitude (Degrees North 81 South)
FIG. 4. Comparison of zonal-mean DCRF for 17 GCMs to the
ERBE data. These represent 4-yr means.
2128 Vol. 76, No. 11, November 1995
6 Wm-*’
3
0
-6
-9
MAY JliN JtiL AtiG SiP OdT NOV
FIG. 5. Zonally averaged latitudinal spreading of the net cooling
anomaly measured by ERBE following the eruption of Mount Pinatubo
In June 1991.
volcanic cloud over the next several months. By early 1993, the radiative effects of the volcanic aerosols had almost disappeared (Minnis 1994).
3. Key questions and required data
a. Required radiation measurements The ocean is much more massive and has a much
greater heat capacity than the atmosphere, and so it is sometimes described as the flywheel of the climate system, resisting (but not preventing) change. The atmosphere controls the radiative energy exchanges between the earth and space, primarily by determining the spatial and temporal distributions of clouds and water vapor. In addition, the atmosphere and ocean play roughly equal roles in transporting energypoleward from the Tropics, where the absorbed solar energy exceeds the emitted infrared radiation, to higher lati- tudes, where the reverse is true. Models that are used to simulate the present climate and/or climate change must include representations of both the atmosphere and the oceans. The most elaborate models include full dynamical representations of the atmosphere (up to at least the lower stratosphere) and the full depth of the oceans, as well as a model of the sea ice; they are called coupled ocean-atmosphere GCMs.
Coupled ocean-atmosphere GCMs have been underdevelopment since the late 1960s (e.g., Manabe and Bryan 1969). The first fully dynamical coupled ocean-atmosphere simulations with realistic geogra- phy were published by Manabe et al. (1975). Although the formulationsof coupled ocean-atmosphere GCMs have become progressively more realistic, it is clear
that coupled GCMs encounter serious problems when applied to the simulation of the present climate. In many cases, GCMs produce markedly unrealistic results unless the simulated surface flux of energy (and in some cases also the surface fluxes of fresh water and momentum) are supplemented by pre- scribed, artificial “flux corrections” that are contrived preciselyto producea realisticsimulation of the present- day climate (e.g., Manabe et al. 1991). The required energy flux corrections can be large-n the same order as the energy flux produced naturally by the simulations. Although there may be other contributing factors, the primary reason for needing surface energy flux corrections is that present-day GCMs produce very unrealistic simulations of the surface energy fluxes associated with solar and terrestrial radiation, and especially the modulations of surface radiation by clouds. Forexample, themarinestratocumulusclouds that strongly reflect solar radiation away from the eastern sides of the subtropical oceans (e.g., Hanson 1991) are almost completely missed by many existing climate models. Small perturbations in the amount or radiative properties of these clouds could strongly affect the climate state (e.g., Randall et al. 1984; Sling0 1990). Failure to simulate these and other types of clouds is a major problem with existing climate models.
The anvils and cirrus clouds associated with deep convection in the Tropics can also have a powerful effect on climate. Although the net radiative effect of these clouds on the earth’s radiation budget is near zero because solar cooling and longwave warming nearly cancel (Ramanathan et al. 1989) the solar cooling acts mainly at the earth’s surface, while the longwave warming acts mainly on the atmosphere (Harshvardhan et al. 1989). Ramanathan and Collins (1991) havesuggested that bright upper-tropospheric clouds act as a “thermostat” that resists warming of the tropical oceans and so helps to moderate the El NiRo events that drastically affect the world’s weather (Fig. 6).
Despite the scientific consensus that cloud-radia- tion effects strongly regulate ocean temperatures and climate, and despite the acknowledged inadequacy of current simulations of surface radiation by climate models, we currently have very little data on the climatology of surface radiation over the oceans (or even over land). A global surface radiation climatology dataset is a requirement for further advances in our understanding of ocean-atmosphere interactions in the climate system, and for development and testing of more realistic climate models. Efforts to produce such a climatology from satellite measurements are now under way (Li and Leighton 1993; Darnell et al. 1992; Gupta et al. 1992).
Bulletin of the American Meteorological Society 2129

The Thermostat
s-----l Convection
FIG. 6. Schematic figure illustrating the thermostat effect
hypothesized by Ramanathan and Collins (1991).
If we combine the net radiative energy flux at the top-of-the-atmosphere (TOA) with the net radiative energy flux at the earth’s surface, we obtain the net atmospheric radiative cooling (ARC). The ARC is the net effect of infrared emission by the atmosphere, the absorption by the atmosphere of infrared radiation emitted by the earth’s surface, and the absorption by the atmosphere of solar radiation. To first approxima- tion, the ARC is balanced by latent heat release (e.g., Peixoto and Oott 1992). This suggests that the glo- bally averaged precipitation rate is determined by radiative processes!
Although there is some truth to this proposition, a major complication is that the hydrological and dy- namical processes that directly control the precipita- tion rate can very strongly influence the ARC. For example, the distribution of water vapor in the atmo- sphere strongly affects the ARC, as does high cloud amount. There are two straightforward feedback loops that link the hydrologic cycle and the ARC. The first, discussed by Sling0 and Sling0 (1988) and Randall et al. (1989), is a positive feedback between the radiative warm- ing/cooling gradients associated with the high clouds produced by deep convec- tion and the large-scale rising motion associated with convection (Fig. 7). Since horizontal heating gradients and large- scale dynamics are important here, we call this a radiative-dynamical-convec- tive (RDC) feedback. A second is a negative feedback loop that works on a very simple principle: stronger convec- tion leads to more high clouds, which reduce the ARC, further reducing the precipitation rate and the level of con- vective activity (Fig. 8). Since this con- trol loop involves the global ARC and the global intensity of convective activity, we
call it a global radiative-convective (GRC) feedback (Fowler and Randall 1994).
We have outlined three mechanisms through which radiative processes can affect the climate system. The first, the thermostat hypothesis, involvesair-sea inter- actions while the second and third, the RDC and GRC feedbacks, involve only the atmosphere. In nature, all three are at work simultaneously. Certainly many more cloud-climate interaction mechanisms exist, but these three are sufficient to make our point: To under- stand climate dynamics, we need measurements not only of the radiation at the top of the atmosphere, but also of the radiation at the earth’s surface; from these two we can determine the ARC.
The vertical distribution of radiative cooling/heat- ing inside the atmosphere is also very important. For example, simulations of the climatic effects of in- creasing carbon dioxide concentrations predict warm- ing of the troposphere and cooling of the stratosphere (e.g., Cess et al. 1993), and there is some empirical evidence for such changes (Houghton et al. 1990). For this reason, measurements of the radiative en- ergy flux at the tropopause are particularly important; at present, unfortunately, they are almost completely nonexistent.
Recently, new studies (Ramanathan et al. 1995; Cess et al. 1995) have indicated that clouds may in fact substantially increase the absorption of solar radiation within the atmosphere. If this additional cloud absorption is verified, it would strongly impact the modeling of the ARC.
Additional resolution of the vertical structure of the ARC would also be useful, particularly for the tropo- sphere in which cloud layers can produce very sharp local features. It would be particularly valuable to begin by dividing the troposphere into the layer above
A Radiative-Dynamical-Convective Feedback
Cooling of the
the Convective
\ Region I
FIG. 7. Schematic diagram illustrating the RDC feedback loop.
2130 Vol. 76, No. 7 7, November 7995
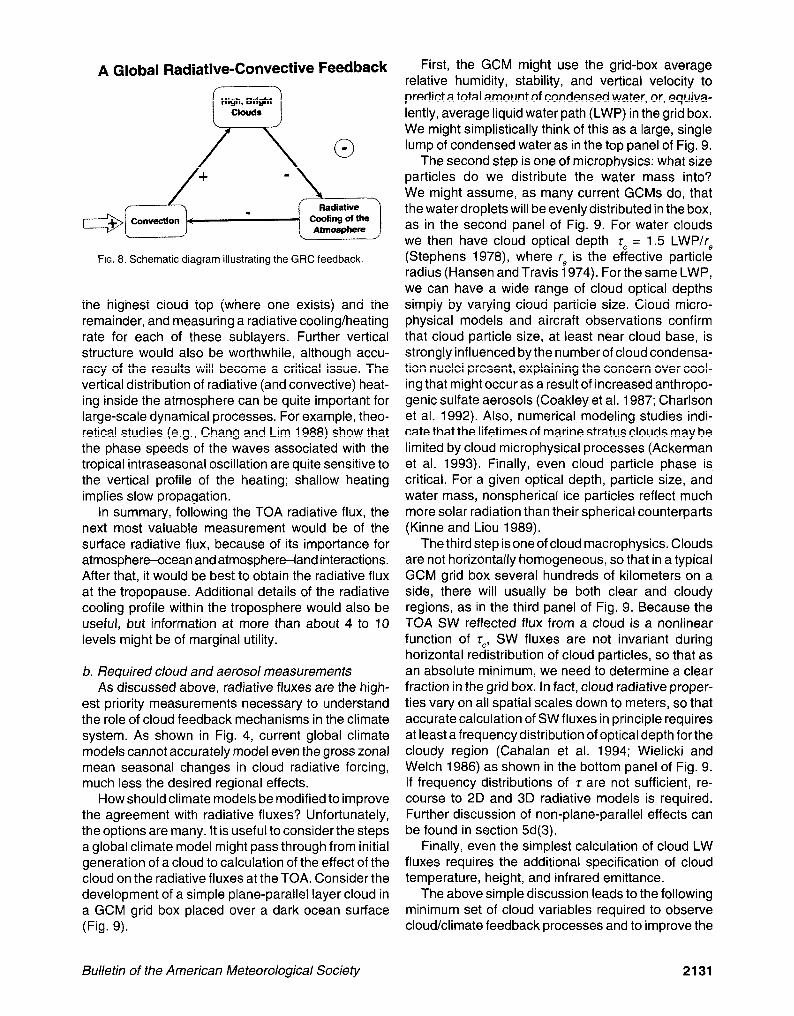
A Global Radiative-Convective Feedback
Ftadiative cooling of tha Abnoapkfe
FIG. 8. Schematic diagram illustrating the GRC feedback.
the highest cloud top (where one exists) and the remainder, and measuring a radiative cooling/heating rate for each of these sublayers. Further vertical structure would also be worthwhile, although accu- racy of the results will become a critical issue. The vertical distribution of radiative (and convective) heat- ing inside the atmosphere can be quite important for large-scale dynamical processes. For example, theo- retical studies (e.g., Chang and Lim 1988) show that the phase speeds of the waves associated with the tropical intraseasonal oscillation are quite sensitive to the vertical profile of the heating; shallow heating implies slow propagation.
In summary, following the TOA radiative flux, the next most valuable measurement would be of the surface radiative flux, because of its importance for atmospherwcean and atmosphere-land interactions. After that, it would be best to obtain the radiative flux at the tropopause. Additional details of the radiative cooling profile within the troposphere would also be useful, but information at more than about 4 to 10 levels might be of marginal utility.
b. Required cloud and aerosol measurements As discussed above, radiative fluxes are the high-
est priority measurements necessary to understand the role of cloud feedback mechanisms in the climate system. As shown in Fig. 4, current global climate models cannot accurately model even the gross zonal mean seasonal changes in cloud radiative forcing, much less the desired regional effects.
How should climate models be modified to improve the agreement with radiative fluxes? Unfortunately, the options are many. It is useful to consider the steps a global climate model might pass through from initial generation of a cloud to calculation of the effect of the cloud on the radiative fluxes at the TOA. Consider the development of a simple plane-parallel layer cloud in a GCM grid box placed over a dark ocean surface (Fig. 9).
First, the GCM might use the grid-box average relative humidity, stability, and vertical velocity to predict a total amount of condensed water, or, equiva- lently, average liquid water path (LWP) in the grid box. We might simplistically think of this as a large, single lump of condensed water as in the top panel of Fig. 9.
The second step is one of microphysics: what size particles do we distribute the water mass into? We might assume, as many current GCMs do, that the waterdropletswill be evenly distributed in the box, as in the second panel of Fig. 9. For water clouds we then have cloud optical depth z, = 1.5 LWP/re (Stephens 1978), where r, is the effective particle radius (Hansen and Travis 1974). For the same LWP, we can have a wide range of cloud optical depths simply by varying cloud particle size. Cloud micro- physical models and aircraft observations confirm that cloud particle size, at least near cloud base, is strongly influenced by the number of cloud condensa- tion nuclei present, explaining the concern over cool- ing that might occur as a result of increased anthropo- genic sulfate aerosols (Coakley et al. 1987; Charlson et al. 1992). Also, numerical modeling studies indi- cate that the lifetimes of marine stratus clouds may be limited by cloud microphysical processes (Ackerman et al. 1993). Finally, even cloud particle phase is critical. For a given optical depth, particle size, and water mass, nonspherical ice particles reflect much more solar radiation than their spherical counterparts (Kinne and Liou 1989).
The third step is one of cloud macrophysics. Clouds are not horizontally homogeneous, so that in a typical GCM grid box several hundreds of kilometers on a side, there will usually be both clear and cloudy regions, as in the third panel of Fig. 9. Because the TOA SW reflected flux from a cloud is a nonlinear function of rc, SW fluxes are not invariant during horizontal redistribution of cloud particles, so that as an absolute minimum, we need to determine a clear fraction in the grid box. In fact, cloud radiative proper- ties vary on all spatial scales down to meters, so that accurate calculation of SW fluxes in principle requires at least a frequency distribution of optical depth forthe cloudy region (Cahalan et al. 1994; Wielicki and Welch 1986) as shown in the bottom panel of Fig. 9. If frequency distributions of z are not sufficient, re- course to 2D and 3D radiative models is required. Further discussion of non-plane-parallel effects can be found in section 5d(3).
Finally, even the simplest calculation of cloud LW fluxes requires the additional specification of cloud temperature, height, and infrared emittance.
The above simple discussion leads to the following minimum set of cloud variables required to observe cloud/climate feedback processes and to improve the
Bulletin of the American Meteorological Society 2131

Dependence of Shortwave Radiation on Liquid Water Distribution
100 km grid box, 528,000 cubic meters of liquid wafer
Single Palllcle
ClOUd
radius = 50 m cloud fraction = IE-06
Dlffuse Cloud
radius = 10 urn 362 0.53
opfical depth = 8
cloud hac,ion = 7.0 :, ,, ,,
optical depth = 16
cloud fraction = 0.50
199 0.29
cloud fraction = 0.50 tau= 4 8 1656 16 8 4
FIG. 9. Schematic diagram of varying distributions of cloud liquid water in a global
climate model, and their impact on calculations of TOA SW reflected fluxes. All cases
have equal total liquid water.
GCM parameterization of cloud generation/dissipa- tion and cloud radiative effects:
l cloud LWP (or ice water path) l cloud visible optical depth l cloud particle size l cloud particle phase/shape l cloud fractional coverage l cloud temperature/height l cloud infrared emittance
At least five of these cloud properties can vary independently (optical depth, size, phase, coverage, height). Since TOA SW and LW fluxes represent only two constraints, we must conclude that GCM agree- ment with TOA SW and LW fluxes is a necessary, but not sufficient, condition to guarantee correct cloud physics and thereby correct cloud/climate feedback mechanisms.
c. Overall observational strategy In summary, we have shown the need to globally
measure SW and LW radiative fluxes at the TOA, at the surface, and within the atmosphere. In addition, validating cloud parameterizations used in GCMs requires further information on cloud physical and radiative properties. Unfortunately, as discussed in section 5, not all of these cloud and radiation param- eters can be measured globally, to the accuracydesired from first principles, to answer all imagined questions. Therefore, the full observational strategy must include not only EOS satellite observations, but a wide range
l detailed dynamical and radiative cloud models veri- fied against field and laboratory experiments for a wide range of cloud types and conditions;
l successful construction of simplified climate model parameterizations using detailed cloud physics mod- els;
l availability and verification of the accuracy of global satellite observations of radiative fluxes and cloud properties;
l agreement of climate models with satellite observa- tions on a range of space and time scales (global, regional, yearly, seasonal, monthly, diurnal).
In fact, this process is iterative, and all four tasks should be pursued simultaneously.
4. Pre-EOS and EOS cloud and radiation data products
No single observing system can span the range of space and time scales important for cloud dynamical
of surface and field experiment data to supporttheglobalsatellitemeasurements.
Figure 10 illustrates a strategy for combining EOS global satellite observa- tions with critical modeling and correla- tive observational eff 0%. No one of these efforts alone can provide a high degree of confidence in climate predictions, such as those used to study global warming scenarios. At the largest time and space scales, climate models must be tested against global satellite observations of clouds and radiation. Current global models do not perform adequately on this test, diminishing our confidence in their predictions. Direct tuning of climate models to satellite observations must be avoided, however, as it invalidates the independence of the data and provides no new physics to the model. Instead, cloud-scale and regional-scale models with more advanced cloud physics and radiation physics must be tested against
both field experiment data and satellite data. Once the models pass these tests, they can be reduced to simpler forms for inclusion in global climate models. In addition, field experiment and surface data must be used to verify the accuracy of the global satellite remote sensing observations of both clouds and radiation.
In summary, confidence in climate predictions will require, as a minimum, the achievement of four basic elements:
2132 Vol. 76, No. 17, November 1995

and radiative processes. As a result, there are four primary types of cloud measurements outlined in Table 1. The list demonstrates that while no single system suffices, there is often sufficient overlap in time and space to intercalibrate results across measurement systems. This capability is critical to bootstrapping both theory and observational results from the smallest cloud particles of na- ture to the most elaborate models of the global climate.
Models
Analysis
Data
Satellite remote sensing
“Short” “Long” Time/Space Scales Time/Space Scales
FIG. 10. Observational strategy for the determination of the role of clouds and
radiation in climate. Confidence in climate model predictions of global warming requires iterative improvements in global climate modeling, global satellite
observations, field experiment and surface observations, and cloud/regional scale
modeling of cloud dynamical and radiative processes.
An excellent recent example of the synergism of different measurement sys- tems is provided by the First ISCCP Regional Experiment (FIRE), itself an element of the International Satellite Cloud Climatology Project (ISCCP). FIRE (Cox et al. 1987) is a multiagency experiment [NASA, National Science Foundation, National Oceanic and At- mospheric Administration (NOAA), and the Depart- ment of Defense (DOD)] that endeavors both to vali- date the ability to remotely sense clouds from satellite instruments (ISCCP) and to use combined ground/ aircraft/satellite data to test cloud models on scales from 100 m to 500 km. FIRE is interdisciplinary both in the sense of science disciplines as well as in the sense of the measurement disciplines discussed above. The resulting synergism of FIRE has led not only to the expected new insights into cloud physical processes, but also to a reexamination of the accu- racy and utility of a wide range of cloud sensors and cloud data. Measurements undergoing critical im- provements include laboratory measurements of ice- particle scattering and absorption properties; aircraft measurements of ice-particle size, shape, and vol-
improve GCM parameterization
TABLE 1. Cloud and radiation measurement systems.
Measurement system
Space scale Timescale
Laboratory cloud microphysics
micrometers to meters
seconds to minutes
Aircraft in situ and meters to 100 km seconds to hours remote sensing
Ground-based in situ and remote
sensing
meters to 10 km minutes to years
Satellite global remote sensing
100 m to global hours to years
Bulletin of the American Meteorological Society 2133
ume; surface radar and lidar observations of clouds; and ISCCP satellite estimates of ice-cloud altitudes and optical depths.
The European and Japanese atmospheric science communities are also conducting key cloud experi- ments such as the European Cloud and Radiation Experiment in support of the above objectives. Be- cause of the wide range of cloud types, climatic regions, and atmospheric conditions, these field ex- periments will continue to provide an essential comple- ment to U.S. cloud experiments like FIRE.
While all of these measurement systems are re- quired for success in understanding the role of clouds and radiation in the climate system, NASA’s primary role is the collection of global satellite observations. This section will summarize the availability of both current and planned global satellite observations of clouds and the earth’s radiation budget. Satellite data characteristics, data collection periods, and data sources will be given. As for the field experiments, international satellite instruments will play a critical role and their observations are included in the sum- mary tables.
Surface and field experiment data sources are discussed in sections 5 and 6.
a. Satellite data-collection strategies Satellite data useful for climate studies have his-
torically been collected by both operational satellite systems (NOAA, DOD) as well as NASA research satellites. Some operational systems such as the Geostationary Operational Environmental Satellite and the AVHRR are designed for day-to-day opera- tions and therefore lack the high quality calibration

used by research instruments such as ERBE and SAGE II (Stratospheric Aerosol and Gas Experiment) (McCormick et al. 1992). This accurate and stable calibration is critical to providing climate data that will improve GCMs as well as monitor climate change. An advantage of the operational systems, however, is a well-developed and stable data processing and distri- bution system, as well as the commitment to long- term data collection that results in climate records with long time coverage and minimal data gaps.
The EOS data-collection strategy is a blend of traditional operational and research approaches. For the first time, a research satellite program has com- mitted to data collection over at least a 15-yr time period. In addition, EOS has initiated both instrument and interdisciplinary science teams to guide the data product design and data system design well before launch. This strategy includes the development of both an operational data processing system and a data distribution system prior to launch of the first satellite. This system is called the EOS Data and Information System, or EOSDIS (Price et al. 1994). This stress on prelaunch data processing follows the successful examples of ERBE, SAGE II, and the Upper Atmosphere Research Satellite. Because of the rapid rate of development of computational capa- bilities, both for processing and data storage, EOSDIS has been extensively modularized and designed to be evolutionary. EOSDIS is divided into eight Distributed Active Archive Centers (DAACs) selected to keep the data processing activity close to scientific expertise for each data product as well as to divide the system into smaller more flexible components. Negotiations are under way for data-sharing agreements with EOS and international satellite observations for use in global change research.
As discussed in section 3c, the observational strat- egy for studying clouds and radiation will necessarily include both regional-scale studies of cloud processes as well as regional- and global-scale climate studies. This causes a need for two distinct types of data products: process and climate data products. Be- cause climate studies require processing of long time series using unchanging data analysis algorithms, changes in the climate processing algorithms are made infrequently and require reprocessing of the entire climate record. At the same time, there is a need to incorporate the latest developments in remote sens- ing algorithms to advance as rapidly as possible the process studies of clouds and radiation during inten- sive field experiments. These process study algo- rithms will require change on much shorter time peri- ods, typically 6 months to a year. Therefore, cloud and radiation data for process studies and climate studies will usually differ, agreeing only at times when an
accumulation of remote sensing improvements is in- corporated in a reprocessing of the climate data record. A current example of this distinction can be found in the ISCCP 8-yr global cloud dataset for climate analy- ses versus the FIRE process study cloud data. An example for EOS data will be cloud properties pro- vided by the cloud and earth’s radiant energy system (CERES) radiation budget dataset, as compared to similar cloud properties provided by the moderate- resolution imaging spectrometer (MODIS) data prod- ucts. In fact, MODIS cloud products are likely to exist in several versions: optimized for radiation budget studies; for cloud physical process studies; and for continuation of pre-EOS datasets.
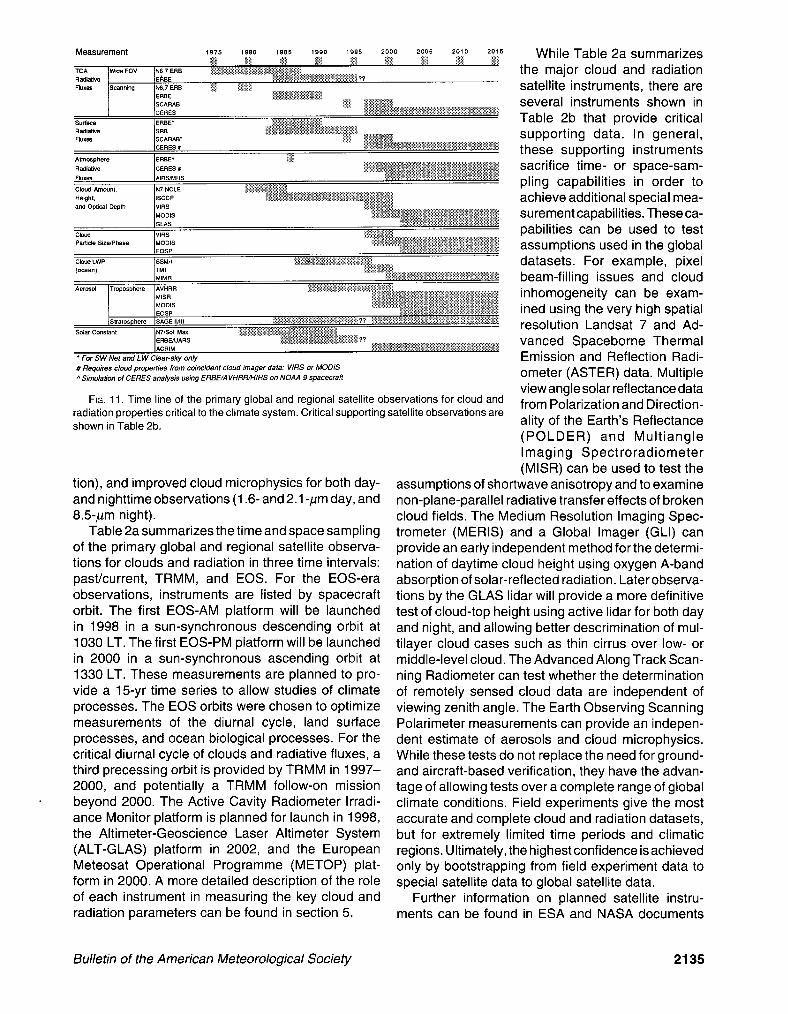
b. Satellite observations Figure 11 shows a timeline of satellite-based glo-
bal radiation budget and cloud observations from 1975 to 2015. A major improvement in remote sens- ing capabilities begins with the U.S./JapaneseTRMM satellite in 1997 and continues with the NASA EOS as well as the European Space Agency (ESA) ENVISAT satellite starting in 1998. An observational gap is already apparent for scanner-based radiation budget data (ERBE), and is likely for stratospheric aerosol (SAGE) and solar constant measurements [ERBE, Active Cavity Radiometer Irradiance Monitor (ACRIM)]. Fortunately for top-of-atmosphere radia- tion budget studies, the French/German/Russian Scanner for Radiation Budget (SCARAB) instrument was launched in December 1993 and should provide overlapping intercalibration with the ERBE non- scanners, which continue to operate. The first SCARAB instrument provided data for 1 yr, and a second instrument will launch in 1997, with the potential for follow-on single-satellite missions through 2003. SCARAB should provide overlapping continuity of earth radiation budget data with the EOS CERES (Wielicki and Barkstrom 1991) radiation budget in- strument beginning with TRMM and continuing with the EOS AM and PM sun-synchronous orbits. The CERES (Wielicki and Barkstrom 1991) measure- ments will improve the calibration, time sampling, and angular sampling over the earlier ERBE and SCARAB datasets (see section !?a). Cloud observations will be successively improved by Visible and Infrared Scan- ner (VIRS) in 1997, and later by MODIS, to be launched on the EOS AM (1998) and PM (2000) satellites. VIRS adds improved calibration, spatial resolution (2 km), and cloud-particle size information (1.6~pm channel) over the current AVHRR and geo- stationary cloud datasets. MODIS adds improved detection of cirrus clouds (CO,-slicing channels and 1.38~pm channel), improved resolution of boundary layer cellular cloud fields (250-m-1 -km spatial resolu-
2134 Vol. 76, No. 11, November 1995
C Requires cloud properties from coincident cloud imager data: VIRS or MODfS
d Simulation of CERES analysis using ERSE/AVHRRMIRS on NOAA g spacecrafl
FIG. 11. Time line of the primary global and regional satellite observations for cloud and
radiation properties critical to the climate system. Critical supporting satellite observations are shown in Table 2b.
tion), and improved cloud microphysics for both day- and nighttime observations (1.6- and 2.1 -pm day, and 8.5pm night).
Table 2a summarizes the time and space sampling of the primary global and regional satellite observa- tions for clouds and radiation in three time intervals: past/current, TRMM, and EOS. For the EOS-era observations, instruments are listed by spacecraft orbit. The first EOS-AM platform will be launched in 1998 in a sun-synchronous descending orbit at 1030 LT. The first EOS-PM platform will be launched in 2000 in a sun-synchronous ascending orbit at 1330 LT. These measurements are planned to pro- vide a 15-yr time series to allow studies of climate processes. The EOS orbits were chosen to optimize measurements of the diurnal cycle, land surface processes, and ocean biological processes. For the critical diurnal cycle of clouds and radiative fluxes, a third precessing orbit is provided by TRMM in 1997- 2000, and potentially a TRMM follow-on mission beyond 2000. The Active Cavity Radiometer Irradi- ance Monitor platform is planned for launch in 1998, the Altimeter-Geoscience Laser Altimeter System (ALT-GLAS) platform in 2002, and the European Meteosat Operational Programme (METOP) plat- form in 2000. A more detailed description of the role of each instrument in measuring the key cloud and radiation parameters can be found in section 5.
While Table 2a summarizes the major cloud and radiation satellite instruments, there are several instruments shown in Table 2b that provide critical supporting data. In general, these supporting instruments sacrifice time- or space-sam- pling capabilities in order to achieve additional special mea- surementcapabilities. Theseca- pabilities can be used to test assumptions used in the global datasets. For example, pixel beam-filling issues and cloud inhomogeneity can be exam- ined using the very high spatial resolution Landsat 7 and Ad- vanced Spaceborne Thermal Emission and Reflection Radi- ometer (ASTER) data. Multiple view angle solar reflectance data from Polarization and Direction- ality of the Earth’s Reflectance (POLDER) and Multiangle Imaging Spectroradiometer (MISR) can be used to test the
assumptions of shortwave anisotropy and to examine non-plane-parallel radiative transfer effects of broken cloud fields. The Medium Resolution Imaging Spec- trometer (MERIS) and a Global lmager (GLI) can provide an early independent method for the determi- nation of daytime cloud height using oxygen A-band absorption of solar-reflected radiation. Laterobserva- tions by the GLAS lidar will provide a more definitive test of cloud-top height using active lidar for both day and night, and allowing better descrimination of mul- tilayer cloud cases such as thin cirrus over low- or middle-level cloud. The Advanced Along Track Scan- ning Radiometer can test whether the determination of remotely sensed cloud data are independent of viewing zenith angle. The Earth Observing Scanning Polarimeter measurements can provide an indepen- dent estimate of aerosols and cloud microphysics. While these tests do not replace the need for ground- and aircraft-based verification, they have the advan- tage of allowing tests over a complete range of global climate conditions. Field experiments give the most accurate and complete cloud and radiation datasets, but for extremely limited time periods and climatic regions. Ultimately, the highest confidence is achieved only by bootstrapping from field experiment data to special satellite data to global satellite data.
Further information on planned satellite instru- ments can be found in ESA and NASA documents
Bulletin of the American Meteorological Society 2135

TAELE 2a. Primary global and regional satellite observations of clouds and radiation in the pre-EOS and EOS era. Satellite data with
l/8- to 2-day global coverage, and both day and night observations.
Past and current Time span
Cloud and radiation
Time sampling Nadir field (eq. crossing,LT) Monthly of view
observations average grid (in km) Data source
N7 ERB 1979-l 990 SW, LW fluxes: top of atmosphere
1200 500 km 90; 1000 NSSDC
l-37 NCLE 1§7B-B3!$z Cbud amount, height 1200 500 km 8; 30 NSSOC
HIRS 1989-l 993 Cirrus height, emmitance 0700,1400 2.5 deg 20 km NOAA
EREE WM-1@95+ SW, LW fluxes: 0700,1400, 2.5 i&g so; looa L&G VO D&‘GZ
top of atmosphere, Precessing
GlQud fming
ISCCP 1983-1995+ Cloud amount, Every 3 h 280 km 4-8 LaRC VO DAAC
height, optical depth
1@83-19@5* SW, LW fbxcts: Evixydh 28okm 4a : -wmomAc SUrfaCe 3,
SSM/I 1987-l 995+ Cloud liquid water 0630, path (ocean only) 1630
1 .O deg 32-55 Wetnet
SW, LW fluxes: tap of atmosphere
TRMM (4FN-45”S)
VIRS 1997-2000 Cloud amount, Precessing 140 km 2 km LaRC Vl DAAC
height, optical depth, particle size/phase
TMI 1-@@T-2000 Cloud liquid Precassing TEm mkm GSFC TSDIS water p&b (ocean only)
(Emiliani 1993; Asrar and Dokken 1993), as well as on the Internet via the World Wide Web [NASA satellite information can be found at Uniform Re- source Locator (URL) http://spso2.gsfc.nasa.gov/ spso-homepage.html, and international satel- lite information at URL http://gds.esrin.esa.it/ CDossiers.CEOS].
Tables 2a and 2b also include the expected data source for each satellite instrument. As part of the process of designing the EOSDIS, prototype DAACs have begun providing access to existing datasets. For current cloud and radiation data, the ISCCP, ERBE, surface radiation budget, and SAGE II data can be obtained on the Version 0 (VO) EOSDIS DAAC at NASA Langley Research Center (Baum and
Barkstrom 1993). This VO DAAC provides easy Internet access to much of the current cloud and radiation data. The DAAC will also provide access to some of the recent field experiment data such as from FIRE and Atlantic Stratocumulus Transition Experiment (ASTEX).
.
To maximize data utility, the EOS data policy is
l to eliminate the proprietary data period used with previous missions;
l to provide satellite data products within 72 h of receipt of all input data sources required to produce the product;
l to provide data for research use at the cost of media reproduction.
2136 Vol. 76, No. 11, November 1995

TABLE 2a. (Continued)
EOS (platform-
instrument) Time span
Cloud and Nadir field radiation Time sampling Monthly of view
observations (eq. crossing,LT) average grid (in km) Data source
AM-CERES 1998-2013 SW, LW fluxes: 1030 140 km 20 LaRC Vl DAAC
top of atmosphere, surface,* in atmosphere*
PM-CERES 2000-2015 SW, LW fluxes: 1330 140 km 20 LaRC Vl DAAC
top of atmosphere,
surface,* in atmosphere*
PM-MIMR# Cloud liquid water path (ocean only)
1330,103o TBD lo-20 MSFC Vl DAAC
ACRIM Solar constant TBD N/A N/A LaRC Vl DAAC
* Requires both CERES broadband scanner data and cloud imager data for within atmosphere fluxes, and surface LW fluxes
(cloudy). # Also planned for EUMETSAT METOP beginning in 2000 in a 1030 LT sun-synchronous orbit.
International negotiations are under way to allow easier access to all international satellite data useful for global change research. For studies of clouds and radiation, the European and Japanese satellite data should play an increasingly important role.
5. Remote sensing development and validation
Improvements in global satellite observations of key climate parameters depend critically on two ef- forts. First, the derivation of advanced remote sens- ing algorithms (often called inversion methods) is required to use the new measurements provided by EOS. Second, the new data must be rigorously vali- dated against independent surface and aircraft in situ or remote sensing observations. This section will summarize the state of the art in remote sensing of the key climate parameters discussed in sections 2 and 3. This section will also identify problem areas critical to future advances in remote sensing, data analysis, and validation. Section 6 will discuss the essential
interdependence of global satellite observations and surface/field experiment data.
a. Top-of-atmosphere radiative fluxes The measurement of TOA fluxes will enter its
fourth generation with the CERES instruments on the TRMM (Simpson et al. 1988) and EOS AM and PM spacecraft. The most recent ERBE measurements provide the standard of comparison for global radia- tion datasets. This success was gained though exten- sive prelaunch work with a science team to a) over- see instrument design, development, and testing; b) design data products; and c) design analysis algo- rithms. A final key element was an integrated data management team to execute two versions of the data system before launch. This is the same overall strategy being used by the EOS project for the EOS data products.
Because there is no “ground truth” to test the accuracy of satellite TOA flux estimates, a compre- hensive set of internal consistency checks is required to achieve high quality data (Barkstrom et al. 1989). As a result of the extensive ERBE, Nimbus-7, and
Bulletin of the American Meteorological Society 2137
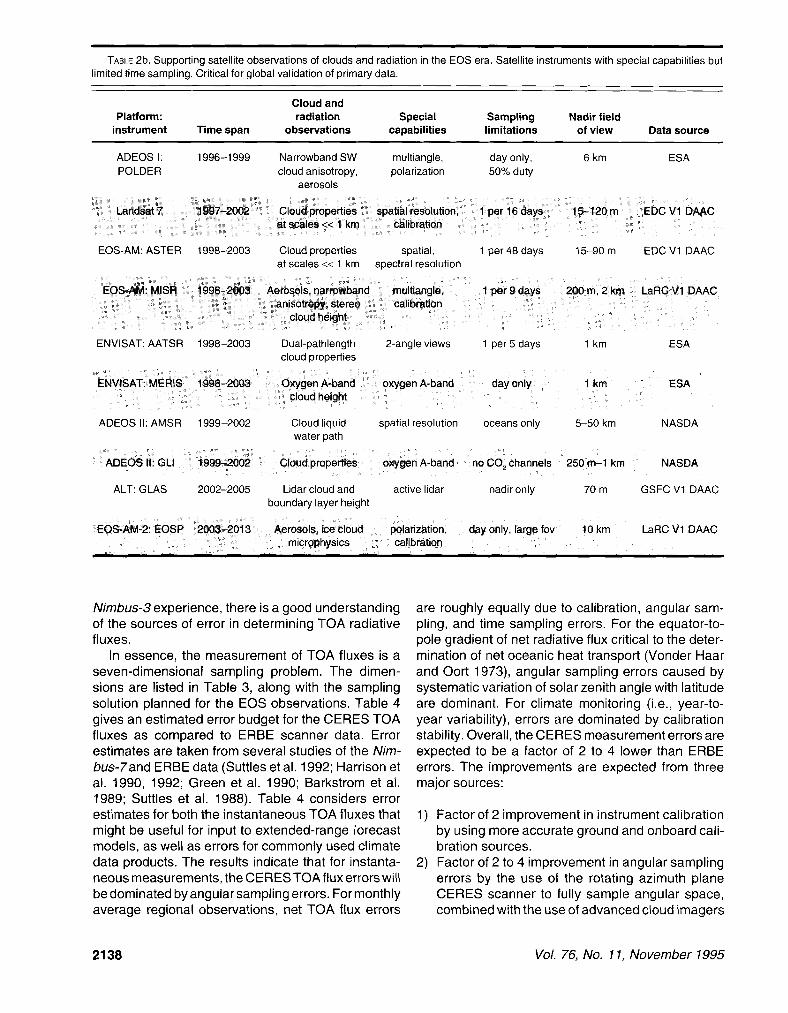
TABLE 2b. Supporting satellite observations of clouds and radiation in the EOS era. Satellite instruments with special capabilities but
limited time sampling. Critical for global validation of primary data.
Platform: instrument Time span
Cloud and radiation
observations Special Sampling
capabilities limitations Nadir field
of view Data source
ADEOS I:
POLDER
1996-l 999 Narrowband SW
cloud anisotropy. aerosols
multiangle,
polarization
day only,
50% duty
6 km ESA
LAndsat ? 1997~2002 Cloud properties spatial resolution, 1 per 16 days 15-120 m EDC Vl DAAC
at scales <c 1 km calibration
EOS-AM: ASTER 1998-2003 Cloud properties spatial, 1 per 48 days 15-90 m EDC Vl DAAC
at scales << 1 km spectral resolution
EOS-AM: MISR 1998-2@03 Aerosols, narrowband /
multiangle, 1 par 9 days 200 m, 2 km LaRC Vl DAAC
anisotropy, stereo ctiibration
cloud height
ENVISAT: AATSR 1998-2003 Dual-pathlength
cloud properties
2-angle views 1 per 5 days 1 km ESA
ENVISAT: MERIS 1998-2003 Oxygen A-band cloud height
oxygen A-band day only 1 km ESA
ADEOS II: AMSR 1999-2002 Cloud liquid spatial resolution oceans only 5-50 km NASDA
water path
ADEQS II: G&t 1999-2002 Cloud properties oxygen A-band no CO, channels 250 m-l km NASDA
ALT: GLAS 2002-2005 Lidar cloud and active lidar nadir only 70 m GSFC Vl DAAC
boundary layer height
EOS-AM-Z: EOSP 2003-2013 Aerosols, ice cloud polarization, day only, large fov 1Okm LaRC Vl DAAC
microphysics calibration
Nimbus-3 experience, there is a good understanding of the sources of error in determining TOA radiative fluxes.
In essence, the measurement of TOA fluxes is a seven-dimensional sampling problem. The dimen- sions are listed in Table 3, along with the sampling solution planned for the EOS observations. Table 4 gives an estimated error budget for the CERES TOA fluxes as compared to ERBE scanner data. Error estimates are taken from several studies of the Nim- bus-7and ERBE data (Suttles et al. 1992; Harrison et al. 1990, 1992; Green et al. 1990; Barkstrom et al. 1989; Suttles et al. 1988). Table 4 considers error estimates for both the instantaneous TOA fluxes that might be useful for input to extended-range iorecast models, as well as errors for commonly used climate data products. The results indicate that for instanta- neous measurements, the CERES TOAflux errors will be dominated by angular sampling errors. For monthly average regional observations, net TOA flux errors
are roughly equally due to calibration, angular sam- pling, and time sampling errors. For the equator-to- pole gradient of net radiative flux critical to the deter- mination of net oceanic heat transport (Vonder Haar and Oort 1973), angular sampling errors caused by systematic variation of solar zenith angle with latitude are dominant. For climate monitoring (i.e., year-to- year variability), errors are dominated by calibration stability. Overall, the CERES measurement errors are expected to be a factor of 2 to 4 lower than ERBE errors. The improvements are expected from three major sources:
1) Factor of 2 improvement in instrument calibration by using more accurate ground and onboard cali- bration sources.
2) Factor of 2 to 4 improvement in angular sampling errors by the use of the rotating azimuth plane CERES scanner to fully sample angular space, combined with the use of advanced cloud imagers
2138 Vol. 76, No. 11, November 1995

3) Factor of 2 to 3 improvement in time- sampling errors bythe use of a three- satellite sampling system and the use of improved shortwave models of the dependence of scene albedo on varying solarzenith angle through- out the day.
2,3
b. Surface radiative fluxes Global satellite estimates of radiative
fluxes at the surface (up, down, and net) are now becoming available (Darnell et al. 1992; Li and Leighton 1993). In gen-
(VIRS, MODIS) to identify anisotro- pit targets as a function of cloud and surface properties.
TABLE 3. Seven-dimensional sampling strategy for TOA flux observations during
EOS.
Number
1
Dimension
Spectral
Sampling solution
Broadband CERES spectral channels
s&al&y) Crass-track wx@ning CERES radiometer
4, 5, 6 Angular: (viewing Conversion of measured radiance
zenith,viewing azimuth, solar zenith)
to flux uses empirical angular models measured by a second
CERES scanner, which rotates in azimuth as it scans in elevation. Models require coincident cloud
imager data.
7
i
eral, the intervening atmosphere com- plicates the measurement when com- pared to the more straightforward deri- vation of TOA fluxes. A major advan- tage, however, is the ability to test satel- lit&basedsut-facefluxestimatesdirectly against surface-based measurements such as those currently provided by the Global En- ergy Balance Archive (GEBA) (Ohmura and Gilgen 1991; Li et al. 1995) and in the future by the Baseline Surface Radiation Network (BSRN) (WCRP 1991) now being established around the globe. As a result of this ability, two independent approaches are desir- able for determining surface radiative fluxes:
-hxnporal 6 samples per day provided by a 3satdlite syste@: 2 sun-synchro- rmus orbits (EOS-AM, EOS-PM) and 1 precasting orbit ~RMM).
surface (30 km) observations, so that actual rms errors may be closer to 5-l 0 W mm2 (Li et al. 1995). In the time frame of the EOS observations, calculated SW surface flux accuracies should increase greatly as more accurate cloud properties (VIRS, MODIS), at- mospheric [Atmospheric Infrared Sounder (AIRS)], and surface properties (MISR, MODIS) become avail- able, and as simultaneous broadband measurements of TOA fluxes are available to constrain the model calculations, including implicit corrections for 3D ra- diative transfer effects. The MISR measurements of bidirectional reflectance of vegetation canopies will provide improved separation of net surface SW flux into upwelling and downwelling components.
1) Calculation of surface fluxes using observed cloud and atmosphere parameters with measured TOA broadband fluxes acting as a constraint on the radiative calculation.
2) Parameterized relationships between simulta- neously observed TOA fluxes (or radiances) and surface fluxes. Typically, the form of the param- eterization is based on a radiative transfer model, but the final coefficients used are determined by comparisons against actual surface flux observa- tions.
Work is progressing on both of these approaches. Initial global surface radiation budget estimates of
SW up, down, and net fluxes use ISCCP narrowband radiances, along with a narrowband to broadband transformation (Darnell et al. 1992; Pinker and Laszlo 1992). Verification against GEBA data and FIRE field experiment data indicates monthly average 2.5” re- gional mean insolation accuracies of about 20 W m-* (lo). While this is not as accurate as estimates of TOA fluxes using ERBE data, most of this discrepancy appears to be caused by spatial mismatching of the scales of observations of the satellite (250 km) and
The second approach to SW flux estimation is to make use of a direct linear relationship between net SW flux at the top of the atmosphere and net SW flux at the surface (Cess et al. 1991; Li et al. 1993). This relationship is derived theoretically and verified against surface observations as a function of solar zenith angle. The rationale for this method (Davies et al. 1984) is that water vapor absorption and absorption by liquid water and ice occur in the same portion of the spectrum. To first order, then, placing a cloud in the atmosphere simply changes the vertical distribution of solar absorption, but not the total amount. The dependence of absorption on solar zenith angle can be understood as a change in pathlength. Be- cause cloud particles reflect a significant amount of radiation even at absorbing wavelengths, however, and because reflection depends on particle size and shape, there are still questions about accuracy as a
Bulletin of the American Meteorological Society 2139

TABLE 4. Comparison of errors in top-of-atmosphere radiative fluxes forthe ERBE sampling and forthe planned CERES sampling. Errors
given in units of W m-2
Monthly average regional Monthly zonal avg Monthly average regional, Instantaneous pixel 5-yr trend equator-pole radiation 1 std dev 1 std dev
So = 348 W m-2 difference So = 348 W m-2 So=lOOOWm-2
ERBE CERES ERBE CERES ERBE CERES ERBE CERES
SW radiation
LW radiation
Calibration 2.4 1.2 2.6 1.3 2.4 1.2 2.4 1.2
Angle SampfirwJ 0.0 0.0 2.0 0.7 1.6 0.5 72.5 4.3
Time sampling 0.0 0.0 0.6 0.6 1.3 1.3 0.0 0.0
Space sampfirtg 0.2 a.2 a.0 a.0 a.2 02 0.0 0.0
Total LW error 2.4 1.2 3.3 1.6 3.2 1.9 12.7 4.3
Net radiation
ERBE: Crosstrack scanner only, 2 satellites, 2.5” latitude/longitude regions.
CERES: Crosstrack and rotating azimuth scanners, MODIS, 3 satellites, 1.25” regions.
function of cloud type and height. The key to improve- ments in the empirical algorithm is to obtain more extensive surface-observed net SW fluxes for valida- tion as a function of varying cloud conditions and climate regimes. The FIRE, Atmospheric Radiation Measurement (ARM) Program, and BSRN observa- tions will be key to increasing the accuracy and confidence in this empirical approach. Recent studies (Ramanathan et al. 1995; Cess et al. 1995) have indicated the existence of much stronger cloud ab-
sorption than can be explained by current radiative models. ARM is planning a field experiment in the fall of 1995 to verify the additional cloud absorption.
The situation for LW surface fluxes is more com- plex, at least for downward LW flux at the surface. Calibration of surface LW flux pyrgeometer measure- ments is still undergoing study, and downward flux radiative computations are dominated by low-level water vapor and cloud-base altitude (Gupta 1989; Gupta et al. 1992), two of the more difficult measure-
2140 Vol. 76, No. 11, November 7995

ments to obtain from space. For clear-sky conditions, encouraging progress has been made developing direct relationships between surface and TOA LW fluxes (Inamdar and Ramanathan, personal commu- nication; Stephens et al. 1994). In the EOS time frame, improved lower-troposphericwatervaporwill beavail- able globally from the AIRSIMHS (Microwave Humid- ity Sounder) instruments and over land from MODIS (Kaufman and Gao 1992). Tests are under way using FIRE observations to examine methods to relate sat- ellite measurements of cloud temperature and optical depth to estimate cloud geometrical thickness (Minnis et al. 1990, 1992). Recent sensitivity studies using ISCCP cloud data, however, indicate that cloud over- lap may in fact be the largest uncertainty for calcula- tions of downward longwave flux at the surface (Char- lock et al. 1994). Methods to identify multiple cloud layers using satellite data have only recently begun, however, and a great deal of additional work is needed in this area. Two approaches appear promising. For optically thin high clouds, infrared sounding channels can isolate the high cloud, while visible and infrared window channels are used for the low-level cloud (Baum et al. 1992). For optically thick high clouds, a combination of optical measurements for the upper (ice) cloud and microwave measurements for the low (water) cloud may help define cloud overlap. In the long term, active systems such as the GLAS lidar for optically thin cloud and a 94-GHz cloud radar for opti- cally thick cloud offer the best solution (WCRP 1994).
For surface LW emission, additional work is still required to improve models of land emissivity and directional thermal emission from vegetation cano- pies (Li and Becker 1993; Sellers and Hall 1992; Sling0 and Webb 1992).
c. Radiative fluxes within the atmosphere Determination of profiles of atmospheric radiative
fluxes is necessary to estimate radiative heating rates within the atmosphere. Clearly the most accurate measurement of radiative heating rate will be for the total atmospheric column. The total column heating rate can simply be determined from the difference between the TOA and surface radiative fluxes dis- cussed in sections 5a and 5b.
A second possible constraint on radiative fluxes within the atmosphere is the use of satellite-estimated surface radiative fluxes. If direct relationships be- tween TOA and surface-observed radiative fluxes (method 2 in section 5b) prove to be a more accurate estimate of surface fluxes than radiative calculations using satellite-observed atmosphere and cloud prop- erties, then the satellite-estimated surface flux esti- mates can be used as an additional constraint on the calculated radiative fluxes within the atmosphere. The use of the TOA and surface flux constraints would be weighted by the estimated accuracy of each radiative flux component. In this case, TOA fluxes would prob- ably provide a more strict constraint than surface fluxes. Note that if method 1 (section 5b) using radia- tive modeling proves more accurate in estimating surface radiative fluxes, then the only observational constraint is the TOA flux.
A second level of complexity is the determination of radiative heating rates within the atmosphere. Even for aircraft observations, this is an exceedingly diffi- cult measurement, primarily because of the large spatial and temporal variability of cloud fields. Esti- mates from space will necessarily be acombination of observed atmospheric properties (temperature, wa- ter vapor, aerosols, clouds) used as input to radiative transfer calculations. One of the primary concerns is the accuracy of these radiative models, but an advan-
Even with TOAfluxconstraints, however, theability to remotely sense cloud thickness, or cloud overlap, is subject to serious question. As a result, the initial strategy for EOS is to phase in progressively more advancedestimatesof in-atmosphereradiativefluxes, as indicated below:
l At launch + 6 months: TOA, surface, topopause, 2- 5 stratospheric levels;
l At launch + 24 months: Add 500-hPa level; and l At launch + 36 months: Add 4-12 tropospheric
levels as validation warrants.
One of the elements for testing within-atmosphere flux calculations is likely to be the use of remotely
tage available during the EOS period will be the use of broadband TOA flux observations to constrain the model solution. For example, if SW TOA fluxes calcu- lated for a cloud field disagree with TOA measure- ments, then the satellite-derived cloud optical depth could be adjusted to get agreement. In this case, the error in both the satellite optical depth estimate and the radiative calculations could be caused by the use of a 1D radiative transfer model for a 3D cumulus cloud field. Since the TOAflux measurement can use CERES-measured anisotropic models appropriate for a 3D cumulus cloud field, the TOA conversion of SW radiance to flux can in fact include the typical 3D radiative properties of the cloud field, and thereby remove most of the bias in the radiative flux calcula- tions of the effect of the cloud within the atmosphere. The bias is removed by adjusting the cloud optical depth to one which would give a 1D equivalent al- bedo. In this way, the radiative flux profile within the atmosphere will be consistent with TOA observa- tions, and the cloud optical depth estimation can be corrected for first-order 3D effects as well.
Bulletin of the American Meteorological Society 2141

piloted aircraft currently under development, which are capable of gathering statistics oververy long flight legs with accurately stacked flight tracks; ARM began test flights in spring 1994. The remote sensing chal- lenges for within-atmosphere fluxes are similar to those for downward LW flux at the surface: profiles of water vapor, cloud thickness, and cloud overlap.
d. Cloud properties The remote sensing of cloud properties from space
is complicated greatly by the rapid changes of clouds in both space and time. To further complicate matters, their radiative properties are a strong function of viewing angle and solar geometry. Where the remote sensing of TOA fluxes was a seven-dimensional sampling problem, cloud properties add a vertical dimension for a total of 8.
Nevertheless, a great deal of progress has been made in recent years, especially through the work of ISCCP and FIRE. Overall lessons learned include
l Cloud analysis can often be separated into cloud detection, followed by cloud property determina- tion.
l Lack of accurate calibration of narrowband imaging radiometers remains a major stumbling block in climate work.
l No single cloud algorithm or portion of the spectrum (i.e., solar, infrared, microwave) can handle the diversity of cloud physical properties needed for the cloud/radiation problem.
l Significant improvements in cloud retrievals are still possible with current satellite data, including new estimates of cloud particle size.
l The next jump in quality should be provided by MODIS: the first instrument specifically designed for cloud-property determination.
l Validation of cloud physical properties requires not only tests against field observations, but also con- sistency between independent satellite methods. For example, very high spatial resolution ASTER data are needed to answer questions about inad- equate beam filling within the larger MODIS or VIRS pixels, multiangle MISR data are needed to provide stereo cloud-height confirmation, and con- firmation of 3D cloud radiative effects on retrieved cloud radiative properties, and Earth Observing Scanning Polarimeter (EOSP) is needed to provide independent estimates using polarization of cloud particle microphysics, especially for the highly un- certain ice particle clouds.
l The final step +n cloud remote sensing will be the combination of passive and active remote sensors. EOS will begin this step with MODIS, Multifre- quency Imaging Microwave Radiometer (MIMR),
and the GLAS (active lidar). Ultimately a 94-GHz radar will also be required. It is clear that active remote sensors will require multiple spectral bands, just like the passive radiometers.
A brief summary of the status of remote sensing is given below for the cloud properties outlined in sec- tions 2 and 3.
1) CLOUD FRACTION
The problem of determining cloud fraction has typically been treated as either one of cloud detection (Rossow et al. 1985) or energy balance (Coakley and Bretherton 1982; Minnis and Harrison 1984; Stowe et al. 1988). Other methods include the use of spectral signatures or spatial textures (Stowe et al. 1991; Saunders and Kriebel 1988).
Acloud-detection method typicallydefinesathresh- old reflectance (solarwavelengths) or brightness tem- perature (thermal infrared) to distinguish between satellite measurement pixels containing clear-sky or cloudy-sky conditions. The major problem with this approach is how to handle partially cloud-filled pixels (i.e., the “beam-filling” problem).
An energy-balance cloud fraction measurement is based on the assumption that many, if not most, of the pixels may be partially cloud filled. These methods use an estimate of a typical cloud reflectance (Minnis and Harrison 1984; Stowe et al. 1988) or a typical cloud brightnesstemperature(Coakleyand Bretherton 1982) to allow cloud fraction in each pixel to be linearly related to the reflectance or brightness temperature in each pixel.
Figure 12 shows results of using 30-m spatial resolution Landsat (land remote sensing satellite) data to test the performance of the ISCCP-determined cloud fraction on the spatial resolution of the data (Wielicki and Parker 1992). Two things are found to occur. As expected, when the spatial resolution de- grades, the beam-filling problem increases cloud frac- tion, especially for boundary layer clouds. But, unex- pectedly, at full resolution the ISCCP bispectral thresh- olds underestimate cloud fraction because they miss a significant amount of optically thin cloud below the threshold. The net effect is a combination of a ten- dency to underestimate the optically thin cloud and to overestimate the broken optically thickercloud. These results indicate that for EOS, the 250-m channels on MODIS will greatly reduce the problem of beam filling, but that further work will be required for the detection of optically thin cloud. Figure 12 includes only 24 cloud fields, so that additional cloud cases are needed to obtain statistical significance for global results.
Several advances in the EOS era that will be key improvements in cloud fraction measurements are
2142 Vol. 76, No. 11, November 1995

ISCCP Cloud Fraction vs. Pixel Size
0.1 I I I I I I I
.- Cumulus
E ~.--.a Cirrus
z .b--* Stratocumulus
:: X.-.-X Altocumulus
It .s+ Multi-layered
-a - t 4
,/
,/ , x /
,/ju-’ . -2. .‘.b- * *
2 0.0 /P ./
,
-0.2 I l/321/16 l/6 l/4 l/2 1 2 4 6
Spatial Resolution (KM)
FIG. 12. Effect of sensor resolution on the derived cloud fractional
coverage for a variety of cloud types using the ISCCP cloud retrieval
algorithm. Errors at small pixel sizes are caused by the failure to detect optically thin clouds, while errors at large pixel sizes are
caused by partially cloud-filled fields of view treated as if they were cloud filled.
l higher spatial resolution; l additional near-infrared channels for thin cloud
detection, especially the 1.38~pm channel added for detection of optically thin cirrus (Gao et al. 1992);
l additional thermal infrared channels (3.7,8.5,13.3, 13.6, 13.9 pm) to allow improved detection of optically thin cloud at night.
A second major concern is the variation of derived cloud fraction as obtained by ISCCP and other studies as a function of viewing zenith angle (Minnis 1989). This needs further study using multiangle MISR and POLDER data for solar channel cloud detection and Along Track Scanning Radiometer-l for the thermal infrared detection.
The third major concern is cloud detection in polar regions. In these regions, recourse is often made to a combination of spectral and textural measures to improve cloud detection (Ebert 1987; Welch et al. 1992; Yamanouchi et al. 1987).
2) CLOUD HEIGHT
The measurement of cloud height has typically been accomplished by one of three different methods:
set measured brightness temperature equal to cloud-top temperature assuming a black cloud (Stowe et al. 1988); use 15-pm infrared sounding channels to estimate the pressure level in the atmosphere at which the cloud is radiating (Smith and Woolf 1976; Chahine 1974); use the solar reflectance measurement to estimate visible cloud optical depth (and thereby infer an infrared emittance) and then correct the estimate of cloud temperature if the cloud has emittance less than unity (Rossow et al. 1985).
Additionally, the spatial coherence method (Coakley and Brethet-ton 1982) has the ability to uniquely distinguish cloud fields with well-defined layers, as exhibited by small spatial variability in the cloud thermal infrared window emission. Several problems with these methods have recently been documented by FIRE:
l Even boundary layer clouds are often nonblack (Wielicki and Parker 1992; Luo et al. 1994).
l Infrared sounder methods work well for upper-level clouds, but poorly for low-level clouds (Wielicki and Coakley 1981; Wylie and Menzel 1989).
l The ISCCP visible optical depth calculations have traditionally assumed water clouds, a poor as- sumption for cirrus (Minnis et al. 1990; Wielicki et al. 1990).
l In the presence of boundary layer inversions over ocean, conversion of cloud temperature to cloud height can cause large errors (Minnis et al. 1992).
These problems suggest that algorithms must be varied with varying cloud types. For boundary layer stratus, spatial coherence will work best. Foi cirrus without lower-level cloud, the ISCCP method using hexagonal ice crystals (Minnis et al. 1990) is suffi- cient; for cirrus over low-level stratus, the infrared sounder methods work best. For large-scale storm systems, any of the methods should give accurate results.
The largest remaining problems are multilevel cloud situations (almost half of all cloud cases according to surface observations) (Hahn et al. 1982; Tian and Curry 1989) and cumulus or altocumulus fields. Key improvements for these cases will come from the increased spectral information on MODIS as well as the increased spatial resolution to minimize beam- filling problems in interpreting thermal infrared chan- nel observations. Recent studies have shown progress in cases of cirrus over stratus by using infrared sounder data to determine the upper cloud level, and multispectral thermal infrared window channel data
Bulletin of the American Meteorological Society 2143

using spatial coherence methods to determine the low cloud (Baum et al. 1994). Key validation data will come from surface lidar and radar, field experiments, and the spaceborne GLAS lidar and MISR stereo cloud-height capabilities. The most difficult area to validate will remain multilevel cloud, especially if both layers are optically thick in the visible and thermal infrared. In thiscase, theonlyvalidation tool will bethe use of millimeter wavelength radar (WCRP 1994).
3) CLOUD VISIBLE OPTICAL DEPTH/THERMAL INFRARED
EMIll-ANCE
The first global satellite estimates of visible cloud optical depth were provided recently by ISCCP. The methodology used was to calculate the expected visible reflectance for a water cloud of 1 O-pm spheres as a function of surface reflectance, solar zenith angle, and satellite viewing angle using a 1 D multiple scattering radiative transfer model (Rossow et al. 1991). A look-up table then converted reflectance into visible optical depth. The range of optical depths that can be measured is typically between about 0.5 and 100, limited by cloud detection limits on the lower end and lack of further sensitivity on the upper end. FIRE and other validation studies showed that there are three major difficulties with the present data:
l Most of the year-to-year variability in the ISCCP global cloud optical depth is caused by varying calibration of the visible radiometers (Klein and Hartmann 1993). Improved calibration is critical.
l Nonspherical ice-particle scattering differs greatly from the assumed lo-pm spheres, causing an overestimate of ice cloud optical depths (Minnis et al. 1990). The ISCCP data will soon be reprocessed using improved hexagonal crystal scattering for cold clouds (Takano and Liou 1989).
l The cloud-filled pixel assumption causes substan- tial underestimates of cloud optical depth for cumu- lus fields, even when cloud amounts are correct or too small (Harshvardhan et al. 1994).
All of the above concerns should be greatly allevi- ated by the improved calibration and spatial resolu- tion offered by the VIRS and MODIS instruments in the EOS era. An unresolved problem, however, is whether a 1 D radiative transfer model can be applied to inherently 3D cloud structures such as cumulus. For boundary layer clouds over ocean, new evidence implies that the relatively small aspect ratio (v/h) and optical depths of broken cloudiness cause errors due to the 1D assumption to be relatively small for do- main-averaged values (Cahalan et al. 1994; Wielicki and Parker 1992; Duda and Stephens 1994). For cumuli over land, however, the larger aspect ratios
and larger optical depths require reexamination of this result. In addition, initial observations of non- plane-parallelcirruscloudsduring FIREshowed mixed results (P. Stackhouse and G. Stephens 1995, per- sonal communication). One of the key verifications of the importance of 3D effects is the test for consistency in derived optical depth as a function of satellite viewing angle. POLDER and MISR data will provide key tests of this assumption on a global basis. Re- gional field experiment data will allow tests using in- cloud measurements combined with fully 3D radiative transfer models. If 3D effects are found to be critical, further studies of the remote sensing of cloud field horizontal structure will be required (e.g., Zhu et al. 1992). Continuing work will also be required to under- stand the effects of ice cloud particle shape and size on satellite-inferred optical depths.
Thermal infrared emittance is related to visible optical depth through cloud particle size and phase. For nighttime observations, estimates are typically made using either infrared sounder data (Smith and Woolf 1976; Chahine 1974) for upper-level clouds, or multiple thermal infrared window channels with vary- ing response to cloud particle size (Luo et al. 1994) for lower-level clouds. Classically, the infrared sounder measurement is actually considered to be &AC, or emittance times cloud fraction. Recent studies indi- cate, however, that for cirrus clouds, partially cloud- covered fields of view are not a problem for pixel sizes less than about 8 km (Wielicki and Parker 1992). In thiscase, the MODIS 1 -km-resolution infraredsounder channels should be able to unambiguously measure infrared cirrus emittance. Multispectral methods for low-cloud emittance need further validation by field experiments, although they appear promising.
4) CLOUD PARTICLE SIZE
A great deal of progress has been made recently in the remote sensing of cloud particle size. Two ap- proaches have been examined initially: one using solar reflectance channels and the other using ther- mal infrared channels. Both approaches make use of the large variation in the imaginary part of the refrac- tive index for water and ice as a function of wave- length. For example, the imaginary part of the refrac- tive index of water varies from about 1 O-8 at 0.6pm to 10-4at1.6~m,10-3at3.7~m,and10-1at11~m.The origins of these approaches date back to Blau et al. (1966), Hansen and Pollack (1970), and Arking and Childs (1985).
Daytime methods use the visible channel to deter- mine cloud optical depth, plus absorbing channels to estimate cloud particle size. In essence, the visible channel estimates the average number of scattering events per reflected photon, while theabsorbingchan-
2144 Vol. 76, No. 11, November 1995

nel determines the absorption per scattering event, which is a function of particle size. The first global estimate of low-cloud water droplet size has recently been produced using the AVHRR 0.6-, 3.7-, and 11 -pm channels (Han et al. 1994). In addition, aircraft radiometers and Landsat observations have been used in FIRE field experiments to show that for water clouds over ocean, the determination of effective droplet radius using visible, 1.6-, and 2.1 -pm channels track changes measured by aircraft in situ data with possible offsets of about 30%. The discrepancy has recently been ascribed to either water vapor con- tinuum absorption in the 1.6- and 2.1 -,um region bands (Stephens and Tsay 1990; Nakajima et al. 1991) or to problems with the forward scattering spectrometer probe (FSSP) typically used to measure cloud droplet size distribution from aircraft. Further validation of the 3.7~pm methodology is required using aircraft obser- vations. For both daytime methods, solutions become multivalued for very small particles (less than 5 pm) and small optical depths (Nakajima and King 1990; Han et al. 1994). The primary uncertainties in these methodologies would appear to be inaccuracies in handling water vapor absorption in the window chan- nels and in handling the horizontal and vertical inhomogeneitiesof clouds (Coakleyand Davies 1986). The majority of work has been done for water clouds, but initial work on ice clouds has also begun (Wielicki et al. 1990; Stone et al. 1990). The major problem for ice clouds is the uncertain scattering and absorption properties of nonspherical particles. Extensive further theoretical and observational work is needed for ice clouds. In particular, advances in aircraft probes to routinely measure the number of small ice crystals, and to measure the scattering phase functions of ice crystals,
Purely infrared methods to infer particle size have evolved more recently (Prabhakara et al. 1988; Ackerman et al. 1990; Luo et al. 1994). These meth- ods rely on the variation in cloud emittance caused by varying particle size. Their primary advantage is the ability to provide nighttime observations. Whereas the reflectance methods have the greatest sensitivity to particle size at relatively large optical depths, the thermal infrared methods are most sensitive for opti- cally thin clouds with optical depths of l-2. Using the currently available 3.7-, 1 l-, and 12-pm data, the thermal infrared retrievals are limited, due to the strong ice and water absorption at these wavelengths, to an effective radius of about 30 pm. Validation against field experiment data is just beginning for these new methodologies.
The increased spectral channels available on the EOS VIRS and MODIS instruments will allow sub- stantial improvements in cloud particle remote sens-
ing. Key advances are the availability of global 1.6- and 2.1~pm channel data during the day and a new 8.5~pm infrared window channel at night. In the future over ocean regions, water cloud particle sizes should be verified independently by combining the micro- wave-measured LWP using TRMM Microwave Im- ager data on TRMM and MIMR data on EOS-PM and METOP, and the VIRS- or MODIS-derived cloud optical depth using r, = 1.5 LWP/zc (Stephens 1978). A second independent verification can be obtained by using the polarization measurements of POLDER and EOSP, especially for nonspherical particles.
5) CLOUD LIQUID/ICE WATER PATH
Passive microwave radiometers on the Nimbus-7 [Scanning Multichannel Microwave Radiometer (SMMR)] and Defense Meteorological Satellite Pro- gram (DMSP) (SSM/I) platforms have demonstrated the ability to observe cloud liquid water path over ocean backgrounds (Greenwald et al. 1993). Over land, however, these methods are not applicable because of the large variability of surface emission at microwave frequencies. The primary difficulty in this measurement is caused by beam filling for the 1 O-30-km footprints typical of these measurements. For EOS, the MIMR field of view is about a factor of 2 smaller than the current SSM/I data, thereby eliminat- ing some of the beam-filling concern. For applications where only a grid-box average LWP is required, beam filling is not a concern. Error analyses and verification against surface-based LWP measurements indicate instantaneous accuracies of about 25% forthe current SSM/I instrument, with much smaller bias errors for monthly average data (Greenwald et al. 1993).
Over land, LWP estimates will have to be provided using VIRS or MODIS estimates of cloud optical depth and effective droplet radius using the relation dis- cussed in the previous section. Uncertainties will be larger than for ocean cases, but the magnitudes will require further analysis of FIRE and ASTEX data.
Currently, there is no method to infer ice water path (IWP) using passive microwave observations. Initial estimates of IWPfor EOS will be obtained using VIRS- and MODIS-derived cloud optical depth and effective particle size. The key problem here will be lack of a good ground-truth source for IWP and the greater uncertaintiescaused by nonspherical geometry for ice crystals. The nonspherical particles will cause in- creased errors in both optical depth (uncertain scatter- ing phase function) and effective particle size (uncer- tain phase function and single scattering albedo), as discussed in previous sections. Much further work is needed in this area, both to provide improved new observational techniques and to gain improved infor- mation from current and planned observations. In this
Bulletin of the American Meteorological Society 2145
regard, the polarization information provided by POLDER or EOSP may provide key information for distinguishing ice-particle habits. The most promising technique for remote sensing IWP and particle size is the use of high-frequency passive microwave at 300- 650 GHz (Evans and Stephens 1995a,b).
6) AEROSOLS
Aerosols affect the earth’s energy budget and cli- mate in two ways. They scatter and absorb sunlight; this is known as the direct effect. They also alter cloud particle size and number concentration, thereby af- fecting the way clouds reflect sunlight; this is known as the indirect effect. In addition, aerosols provide sur- faces on which chemical reactions take place, such as those that contribute to ozone loss in polar regions (Gleason et al. 1993).
Charlson et al. (1992) and Kiehl and Briegleb (1993) estimated the direct effect of sulfate aerosols due to human activity on the earth’s radiation budget. These calculations, however, were based on concen- trations of sulfate derived from a chemical model for the sulfur cycle (Langner and Rodhe 1991). Aside from a few highly localized measurements of sulfate concentrations, there is little evidence to confirm that man-made sulfates have had the expected effect. Also, as pointed out by Hegg et al. (1993), the light- scattering efficiency of sulfate particles is not well known and is likely to vary geographically.
The enhancement of reflected sunlight due to the expected increase in sulfate aerosols could, in prin- ciple, be measured from space. The effect should be revealed as an enhancement in the reflectivity of cloud-free regions. NOAA currently estimates aero- sol burdens for the cloud-free oceans from AVHRR observations (Rao et al. 1989; Stowe et al. 1992). CalibrationproblemswithcurrentsensorslikeAVHRR make the measurement of long-term trends needed to detect the sulfate signal all but impossible. Future instruments, like MODIS, MISR, and CERES, should provide the required radiometric calibration. In addi- tion, MODIS, because of its relatively high spatial resolution and its spectrum of channels, should facili- tate the estimation of aerosol burden over continents, including an estimate of aerosol effective radius (King et al. 1992). MISR, with its multiple-angle view of a particular scene, and EOSP, using polarization measurements, will also give improved estimates of aerosol properties. For extensive cloud-free regions (-100 km), as identified by MODIS, CERES will provide highly accurate measurements of the broad- band reflectivity required to document the effect of aerosols on the energy budget. While EOS instru- ments should allow major advances over the capabili- ties offered by existing instruments, the problem of
deriving aerosol characteristicsfrom remotely sensed observations is decidedly ill posed. The EOS obser- vations must be checked with high quality, prudently selected in situ observations of aerosol characteris- tics and their effect on the radiation budget. Through comparison with in situ observations, reliable indices of aerosol properties could evolve.
The indirect effect of aerosols is highly uncertain (Kaufman et al. 1991; Hegg et al. 1993) and is difficult to detect observationally, even in instances where the pollution is clearly altering cloud properties, as in the pollution of maritime clouds by underlying ships (Coakley et al. 1987; Radke et al. 1989; King et al. 1993). Twomey (1977) predicted that additional par- ticulate pollution would provide greater numbers of cloud condensation nuclei that would compete for the existing cloud water. Consequently, clouds would have more droplets, but the droplets would be smaller in size. Effectsof pollution will probably be identified by changes in cloud particle size. From space, changes in particle sizes are seen as changes in cloud absorp- tion at near-infrared and thermal-infrared wavelengths (Nakajima and King 1990; Prabhakara et al. 1988). While shifts in particle size can be seen with the AVHRR (Han et al. 1994; Lin and Coakley 1993), they should be much more easily detected with MODIS, which has several channels (1.6, 2.1, 3.7, 8.6, 11, 12 ,um) specifically designed for retrieving cloud par- ticle size (King et al. 1992), as opposed to those forthe AVHRR that were designed to obtain sea surface temperatures. Some means are also needed to link the shift in particle size to cloud optical properties. Observations of cloud liquid/ice water path would be greatly enhanced if they were made through observa- tions of cloud properties at visible, infrared, and micro- wave wavelengths. As with the direct effect of aero- sols, however, the problem of inferring indirect aerosol effects remotely is decidedly ill posed. The EOS observations must be checked against in situ observa- tions of the effect of aerosols, which could be obtained through well-planned field experiments. As with the direct effect, it is hoped that these checks will lead to reliable indices of the indirect effects of aerosols on the radiative balance of the earth, such as cloud suscep- tibility, which is a quantitative measure of why some clouds are more likely to respond to enhanced aerosol injections that other clouds (Platnick and Twomey 1994; King et al. 1994).
6. Critical surface observations and .~ _ field experiments
A vital component of any earth observing system aimed at obtaining long-term global observations of
2146 Vol. 76, No. 11, November 1995
multiple components of the earth-atmosphere-ocean system is a well-coordinated ground-based monitor- ing network together with periodic field experiments. The importance of this part of any integrated global climate observing system cannot be underestimated. This component is vital for the purpose of (i) assessing the accuracy of satellite-derived geophysical param- eters, such as aerosol optical thickness, surface radia- tion budget components, cloud-top altitude, sea sur- face temperature, total ozone content, etc.; (ii) evalu- ating the precision and the accuracy of the satellite sensor calibration through the intercomparison of sat- ellite measurements with calculations based on radia- tive transfer computations using surface and aircraft measurements of atmospheric composition; and (iii) providing enhanced information on the character- istics of surface and atmospheric constituents as- sumed in the remote sensing retrievals using satellite observations. Space, surface, and aircraft approaches are all required to observe the range of critical physical processes that occur from the microscale (e.g., micro- physical properties of clouds) to the macroscale (e.g., basinwide sea surface temperature variations associ- ated with El Niiio). To this end, many surface observa- tional networks and airborne field experiments have been established. Below we highlight a selection of these extremely important programs, emphasizing their role in improving our understanding of the role of clouds and radiation in climate.
a. FIRE The First ISCCP Regional Experiment (FIRE) is an
ongoing multiagency and international program to support the development of improved cloud radiation parameterization schemes for use in climate models, to provide an assessment of the accuracy of ISCCP- derived cloud products, and to provide an opportunity to test and develop new remote sensing methods for future spaceborne missions and to assess their accu- racy through intercomparisons with in situ microphysi- cal measurements. FIRE has been conducted in two phases, the first from 1985 to 1990 and the second from 1991 to 1995, and has thus far concentrated on two cloud types: marine stratocumulus and cirrus.
In all of these intensive field campaigns, emphasis has been placed on coordination between aircraft-, spacecraft-, and ground-based observing systems, and has led to a number of important insights. For marine stratocumulus clouds, outstanding problems include the discrepancy between observations and theory of the absorption of solar radiation by clouds, the discrepancy between remote sensing and in situ estimates of the effective droplet radius derived from spectral reflectance measurements, and the variabil- ity and spatial structure of stratocumulus clouds derived both from reflection and transmission mea- surements. For cirrus clouds, the thermal emission characteristics of these clouds suggest that the effec- tive radius of ice crystals is much smaller than previ- ously believed and, in addition, the thermal emittance of cirrus clouds is generally less than theoretically predicted for a given value of the visible albedo. These important results, described in detail by King (1993), lead immediately to the conclusion that carefully planned airborne field campaigns, together with coin- cident ground-based observations, are essential for assessing the accuracy and validity of satellite-de- rived geophysical cloud properties. Plans are cur- rently being developed for FIRE phase III, which will likely include campaigns in complex environments such as Arctic stratus clouds overlying sea ice, a regime for which remote sensing of cloud properties from space is especially difficult.
b. GEWEX Marine stratocumulus clouds exert a large influ- The Global Energy and Water Cycle Experiment
ence on the radiation balance of the earth-atmo- (GEWEX) is an international program of the World sphere-ocean system through their large areal ex- Climate Research Program that focuses on observing tent, temporal persistence, and high reflectivity to and modeling the hydrologic cycle and energy fluxes solar radiation. Cirrus clouds, on the other hand, exert in the atmosphere, at the land surface, and in the their greatest radiative influence on the earth’s cli- upper layers of the oceans. This enormous program mate through their effects on longwave radiation plans to compare results from ongoing process stud- emitted to space. Both of these cloud types are ies aimed at improving the parameterization of clouds, spatially and temporally persistent in the earth’s at- radiation, and surface processes with coincident sat- mosphere, and both create difficulty in the remote ellite observations and modeling studies (Chahine sensing of cloud properties from spaceborne sen- 1992). As such, it has a considerable validation com-
sors. As a direct consequence of the need to deter- mine the optical and microphysical properties of clouds from present and future spaceborne systems, such as MODIS, a need arose to conduct intensive field observations of marine stratocumulus and cirrus clouds. These two field campaigns, conducted as major components of FIRE (Cox et al. 1987), have focused exclusively on these two cloud types. Largely as a result of these four field experiments (conducted in 1986 and 1987; repeated and enhanced in 1991 and 1992), the radiative and microphysical properties of these cloud systems have been more extensively studied than others.
Bulletin of the American Meteorological Society 2147
ponent that will prove a valuable source of data to assess the accuracy of satellite retrieval schemes such as the remote sensing of atmospheric tempera- ture and moisture profiles, vertically integrated water vapor (precipitable water), cloud-base altitude, sur- face longwave flux, and cloud optical and microphysi- cal properties. Since passive satellite observations are especially sensitive to cloud-top properties, a valuable role of GEWEX is in assessing the longwave radiation flux reaching theeatth’ssurface undercloudy conditions in both a dry and humid environment. Here again a combination of surface observations, tem- perature and moisture soundings, focused airborne observations, and modeling studies will provide an opportunity to assess the accuracy of satellite-derived geophysical properties and to translate the results of process studies to the global scale.
The GEWEX program will focus on five main com- ponents of the hydrologic cycle: clouds and radiation, atmospheric moisture, precipitation, ocean fluxes, and land surface processes. Since current satellite- derived moisture data are accurate to -IO%-20% over the oceans and 20%-30% over the land, since water vapor is the most important greenhouse gas, and since clouds and their radiative properties play a major role in cloud feedback processes, process studies such as GEWEX are vital to enhancing the value of the spaceborne observations to be provided as part of the Mission to Planet Earth Program (TRMM, EOS AM, EOS PM). Over the oceans, two current experiments are providing valuable data on ocean fluxes, including cloud radiative properties, the Tropi- cal Oceans-Global Atmosphere (TOGA), and World Ocean Circulation Experiment. In late 1992 and early 1993, a Coupled Ocean-Atmosphere Response Ex- periment was conducted in the western tropical Pa- cific as part of the TOGA program, and this large multinational and multiagency program obtained nu- merous datasets on cloud radiative and microphysi- cal properties as well as passive and active micro- wave measurements of precipitation patterns. This valuable dataset will provide much needed informa- tion that will enable algorithms to be tested and evaluated for both the EOS (MODIS, GLAS, MIMR) and TRMM programs.
c. Atmospheric Radiation Measurement Program The Atmospheric Radiation Measurement (ARM)
Program (Stokes and Schwartz 1994) is a research program of the U.S. Department of Energy (DOE) and is the largest component of DOE’s contribution to the USGCRP. This program is aimed at assessing the radiative properties of the atmosphere under both clear and cloudy conditions, and thus consists of a sophisticated measurement program from ground-
based facilities as well as from remotely piloted air- craft. ARM is therefore complementary to NASA’s Mission to Planet Earth in that it provides an intensive ground-based component that emphasizes process studies focused on two related scientific issues in the development of models to assess man’s impact on climate: (i) radiative energy transport and (ii) cloud formation, maintenance, and dissipation.
The measurement program is planned to focus on Cloud and Radiation Test Bed (CART) sites consisting of facilities at three key locales around the world: (i) southern Great Plains of the United States, (ii) western tropical Pacific, and (iii) north slope of Alaska. Each of these sites will characterize the broad- band and spectral components of both longwave and shortwave radiation reaching the earth’s surface, as well as measure the water vapor, temperature, and wind profiles throughout the lower atmosphere. These measurements will aid both in improving parameter- ization of the radiative properties of the atmosphere for use in GCMs and as ground and airborne calibra- tion/validation sites for EOS sensors such as CERES, MODIS, AIRS, MISR, and EOSP. All three of these distinct climatological regimes will be well character- ized by the time of the launch of the first EOS AM platform in 1998, and can thus be used as prime locations for intercomparisons of clear sky, aerosol, and cloud properties (including cloud-base altitude). Finally, in addition to the CART sites, the ARM pro- gram has an aggressive modeling component, includ- ing radiative transfer, cloud formation, and data as- similation.
d. Baseline Surface Radiation Network The Baseline Surface Radiation Network (BSRN)
(WCRP 1991) is an international program of the WCRP designed to improve the accuracy and sam- pling rate of surface-measured shortwave and espe- cially longwave radiative fluxes. Data collection has recently begun at a few sites and should increase to about 30 sites within the next few years. A key element of these data is the provision of downward longwave flux at the surface at all BSRN stations, since most observational records at the surface cover shortwave fluxes only. The recommended BSRN instrument complement includes shortwave total, di- rect and diffuse downward fluxes, longwave down- ward fluxes, and synoptic and upper-air observations. Expanded measurements at some sites will include lidar for cloud-base altitude, and direct solar spectral irradiance at specified wavelengths for aerosol opti- cal properties. These data will provide a critical data- baseforvalidation of satellite-inferred downward short- wave and longwave radiative fluxes and for monitor- ing long-term trends.
Vol. 76, No. 11, November 1995

e. ECLIPS Another key international experiment is the Experi-
mental Cloud Lidar Pilot Study (ECLIPS) (Platt et al. 1994). ECLIPS is designed to obtain observations of cloud backscattering profiles (including cloud-base and cloud-top altitudes for optically thin cloud) from about 10 participating ground-based lidar sites around the world. About half of these sites provide lidar depolarization measurements to distinguish water and ice clouds, and several use uplooking 1 l-pm radiometers to provide improved estimates of cloud optical depth. The ECLIPS lidar systems have de- rived nearly continuous cloud observations for two experiment months, and conducted a third experi- ment in conjunction with the Lidar In-space Technol- ogy Experiment, a lidar system successfully flown on space shuttle Discovery in September 1994. These lidar systems provide a unique and objective dataset for cloud-base altitude for all cloud types, including cirrus. For cloud-base altitudes below 4 km, the NOAA ceilometer database will also be a critical data source.
7. Ties to other research areas
a. Oceanic processes The storage and transport of heat by the ocean is
strongly affected by surface thermal forcing. The surface thermal forcing on the ocean is composed of radiative (shortwave and longwave) and turbu- lent (sensible and latent) heat fluxes. The most viable method of monitoring these fluxes over ad- equate temporal and spatial scales is by spaceborne sensors.
The relative accuracy of surface solar irradiance derived from satellite data has been found to be sufficient in monitoring the seasonal cycle over most of the ocean and the interannual anomalies over the tropical oceans. The surface flux derived from satel- lite data has been used to study the evolution of major climate signals, such as the El Nitio and Southern Oscillation (e.g., Liu and Gautier 1990; Chettock et al. 1991). It has also been used to examine the feed- back of cloud and atmospheric circulation on sea surface temperature changes over the global ocean (Liu et al. 1994).
The surface heat flux could be integrated to give the mean meridional heat transport by the ocean. In the past, only meteorological reports from volunteer ships were used (Tally 1984), but satellite data have the potential of providing better coverage. To adequately resolve the meridional heat transport, an absolute accuracy of better than 10 W m-* in the total heat flux is required (WCRP 1982). While surface shortwave
radiation estimated from satellite data approaches this accuracy (see section 5b), the estimation of other components needs improvement. Such improvement is expected in the next decade with the launching of advanced sensors for surface wind and atmospheric temperature and humidity soundings.
The radiation that penetrates the ocean surface, particularly within the photosynthetically active range (0.4-0.7pm), is important to ocean biological produc- tivity and the distribution of chemical species in the ocean (Platt et al. 1988). The monitoring of ocean surface solar irradiance, together with observations from future ocean color sensors, will also advance our understanding of the biogeochemical cycle in the ocean.
b. Land processes Information on all components of the surface radia-
tion budget is vital for land surface studies, covering the gamut from land surface climatology to ecology. The major issues can be summarized in order of increasing timescale as follows:
Land surface climatology: The net available en- ergy at the land surface is a key driver of continental and, to a lesser extent, global climatology. It is par- ticularly important to know the net shortwave flux, which is largely modulated by cloud coverand surface albedo. Additionally, we need estimates of the downwelling longwave flux (which will be done better in the EOS era than it is now, but probably still not satisfactorily) and the thermal emission from the surface that is controlled by atmospheric temperature and humidity profiles as well as the land surface “skin” temperature, respectively (land surface emissivity is near unity in the thermal infrared region for all practi- cal purposes).
It is clear that currently we do not model the surface radiation balance well in our climate or numerical weather prediction models (Nobre et al. 1991; Shuttleworth and Dickinson 1989). It is also clear that realistic changes in land surface albedo, brought about by land-use change, could have a large influ- ence on continental climatologies (Nobre et al. 1991; Lean and Warrilow 1989). Finally, we are seeing increasing evidence of the linkages between a region’s cloud climatology and its surface hydrometeorology. The role of vertical water recycling in Amazonia in maintaining the “protective” cloud layer over the re- gion is just beginning to be understood. A detailed, reliable global dataset on the surface radiation budget and surface albedo is urgently needed if we are to improve the models.
Global carbon cycle (fast component): Global pho- tosynthesis and fast cycle respiration are closely tied to the energy and water cycles, and so in large part depend on the terms discussed above. In addition, the
Bulletin of the American Meteorological Society 2149

incoming flux of photosynthetically active radiation (0.4-0.7 pm) is a critical forcing of photosynthesis (Sellers and Schimel 1993).
Ecology and global carbon cycle (slow compo- nent): The biogeography of the world’s vegetation is closely coupled to the physical climate system. Key drivers are water availability and temperature that determine the rate of soil respiration and litter turn- over. These factors are in turn tightly linked to the surface radiation climatology.
8. Summary
The EOS era satellite observations will represent a great advance in our ability to observe global and regional radiative fluxes at the top of the atmosphere, surface, and selected levels within the atmosphere. The new observations will also greatly advance our ability to observe cloud physical and radiative proper- ties. The radiative flux, and especially the cloud mea- surements, will be made using satellite radiometers with greatly improved absolute accuracy and stability for use in climate studies. The satellite data, however, cannot stand alone. Solutions of the difficult cloud- modeling problems require fundamental advances in our understanding of cloud microphysics, cloud-scale dynamics and radiation, and finally the role of clouds in regional and global climate systems. Important physical scales range from cloud condensation nuclei (lo-’ m) to global (lo* m), while important timescales range from 1 s to decades (1 Og s). Covering these time and space scales will require measurements in the laboratory, in the field (surface and atmosphere), and from space. All three perspectives will be required to achieve a successful understanding of the role of clouds in the climate system. Achieving this breadth of observations in a time of limited science budgets will be an extraordinary challenge for the entire interna- tional earth science community. One of the most difficult aspects of this challenge will be to keep the long-term perspective needed to obtain consistent climate records of cloud and radiation budget param- eters. Success will demand not only scientific but also political perseverance.
Acknowledgments. We are indebted to contributions from many reviewers of this document as well as sections contributed by
J. A. Coakley Jr. (aerosols), T. Liu (links to ocean processes), and P. Sellers (links to land processes).
References
Ackerman, A. S., 0.6. Toon, and P. V. Hobbs, 1993: Dissipation of marine stratiform clouds and collapse of the marine boundary
layer due to the depletion of cloud condensation nuclei by clouds.
Science, 262,226-229. Ackerman, S. A., W. L. Smith, J. D. Spinhirne, and H. E. Revercomb,
1990: The 27-28 October 1986 FIRE IF0 case study: Spectral properties of cirrus clouds in the 8-12 pm window. Mon. Wea.
Rev., 116,2377-2388. Arking, A., and J. D. Childs, 1985: The retrieval of cloud cover
parameters from multispectral satellite images. J. Climafe Appl. Meteor., 24,322-333.
Arrhenius, S., 1896: On the influence of carbonic acid in the air upon the temperature of the ground. Philos. Mag., 41,237.
Asrar, G., and D. J. Dokken, 1993: EOS Reference Handbook.
NASA NP-202,145 pp.
Barkstrom, B., E. F. Harrison, G. L. Smith, R. N. Green, J. Kibler, R.
Cess, and the ERBE Science Team, 1989: Earth Radiation
Budget Experiment (ERBE) archival and April 1985 results.&//. Amer. Meteor. Sot., ?9,1254-1262.
Baum, B. A., and B. R. Barkstrom, 1993: Design and implementa- tion of a prototype data system for earth radiation budget,
cloud, aerosol, and chemistry data. Bull. Amer. Meteor. Sot., 74,591-598.
-, B. A. Wielicki, P. Minnis, and L. Parker, 1992: Cloud property
retrieval using merged HIRS and AVHRR data.J. Appl. Meteor.,
31,351-369. -, R. F. Arduini, 8. A. Wielicki, P. Minnis, and S. C. Tsay, 1994:
Multilevel cloud retrieval using multispectral HIRS and AVHRR
data: Nighttime oceanic analysis. J. Geophys. Res., 99,5499-
5514. Blau, H. H., R. D. Espinosa, and E. C. Reifenstein, 1966: Near-
infrared scattering by sunlit terrestrial clouds. Appl. Opt.,
5,555. Cahalan, R. F., W. Ridgway, W. J. Wiscombe, Harshvardhan, and
S. Gollmer, 1994: Independent pixel and Monte Carlo esti-
mates of stratocumulus albedo. J. Atmos. Sci., 51, 3776- 3790.
Cess, R. D., and Coauthors, 1990: Intercomparison and interpre- tation of climate feedback processes in 19atmospheric general circulation models. J. Geophys. Res., 95, 16 601-16 615.
-, E. G. Dalton, J. J. DeLuisi, and F. Jiang, 1991: Determining surface solar absorption from broadband satellite measure-
ments for clear skies: Comparison with surface measurements.
J. Climafe, 4,236-247. -, E. F. Harrison, P. Minnis, B. R. Barkstrom, V. Ramanathan,
and T. Y. Kwon, 1992: Interpretation of seasonal cloud-climate
interactions using Earth Radiation Budget Experiment data. J. Geophys. Res., 97,7613-7617.
-, and Coauthors, 1993: Uncertainties in CO, radiative forcing in general circulation models. Science, 262, 1252-1255.
-, and Coauthors, 1995: Absorption of solar radiation by clouds: Observations versus models. Science, 267, 496-499.
Chahine, M. T., 1974: Remote sounding of cloudy atmospheres. I. The single cloud layer. J. Atmos. Sci., 31, 233-243.
-, 1992: The hydrological cycle and its influence on climate.
Nature, 359,373-380. Chang, C. P., and H. Lim, 1988: Kelvin wave-CISK: A possible
mechanism for the 30-50 day oscillations. J. Afmos. Sci., 45, 1709-l 720.
Charlock, T., F. Rose, T. Alberta, G. L. Smith, D. Rutan, N. Manalo-
Smith, P. Minnis, and B. Wielicki, 1994: Cloud profiling radar requirements: Perspective from retrievals of the surface and
atmospheric radiation budget and studies of atmospheric ener- getics. UtilityandFeasibilityofa CloudProfiling Radar, WCRP- 84, IGPO Publication Series No. 10, Jan 1994. BlO-B21.
Charlson, R. J., S. E. Schwartz, J. M. Hales, R. D. Cess, J. A. Coakley Jr., J. E. Hansen, and D. J. Hofmann, 1992: Climate forcing by anthropogenic aerosols. Science, 255, 423-430.
Vol. 76, No. 11, November 1995
Cherfock, B., R. Frouin, and R. C. J. Sommerville, 1991: Global
monitoring of net solar irradiance at the ocean surface: Clima- tological variability and the 1982-1983 El NiAo. J. Climate, 4,
639-650. Coakley, J. A., Jr., and F. P. Bretherton, 1982: Cloudcoverfrom high
resolutionscannerdata: Detectingandallowingfor partially filled
fields of view. J. Geophys. Res., 67,4917-4932. -, and R. Davies, 1986: The effect of cloud sides on reflected
solar radiation as deduced from satellite observations. J. Atmos.
Sci., 43,1025-l 035.
Hansen, J. E., and J. B. Pollack, 1970: Infrared light scattering by
terrestrial clouds. J. Atmos. Sci., 27, 265-281. -, and L. D. Travis, 1974: Light scattering in planetary atmo-
spheres. Space Sci. Rev., 16,527-610. Hanson, H. P., 1991: Marine stratocumulus climatologies. Inter. J.
Climate, 11,147-164.
-, R. L. Bernstein, and P. A. Durkee, 1987: Effect of ship-stack effluents on cloud reflectivity. Science, 237, 1020-l 022.
Cox, S. K., D. S. McDougal, D. A. Randall, and R. A. Schiffer, 1987: FIRE-The First ISCCP Regional Experiment. Bull. Amer. Me-
teor. Sot., 68,114-l 18. Darnell, W. L., W. F. Staylor, S. K. Gupta, N. A. Ritchey, and A. C.
Wilber, 1992: Seasonal variation of surface radiation budget derived from International Satellite Cloud Climatology Project
Cl data. J. Geophys. Res., 97,15 741-15 760.
Davies, R., W. L. Ridgway, and K. E. Kim, 1984: Spectral absorp-
tion of solar radiation in cloudy atmosphere: A 20 crn~’ model. J.Atmos.Sci., 41,2126-2137.
Duda, D. P., and G. L. Stephens, 1994: Macrophysical and micro- physical influences on radiative transfer in two dimensional marine stratus. Atmospheric Science Paper 565, Colorado State
University, 202 pp. [Available from Dept. of Atmospheric Sci- ence, Colorado State University, Fort Collins, CO 80523.1
Ebert, E. E., 1987: A pattern-recognition technique for distinguish- ing surface and cloud types in the polar regions. J. Climate
Appl. Meteor., 26, 1412-l 427.
Harrison, E. F., P. Minnis, B. R. Barkstrom, V. Ramanathan, R. D. Cess, and G. G. Gibson, 1990: Seasonal variation of cloud radiative forcing derived from the Earth Radiation Budget
Experiment. J. Geophys. Res., 95,18 687-18 703. -, -, G. G. Gibson, and F. M. Denn, 1992: Orbital analysis and
instrument viewing considerations for the Earth Observing Sys- tem (EOS) satellite. Astrodynamics 7997, Advances in the Astro-
nauticalSciences, 76, B. Kaufman, Ed., Univelt, lnc.,1215-1228. Harshvardhan, D. A. Randall, T. G. Corsetti, and D. A. Dazlich,
1989: Earth radiation budget and cloudiness simulations with a general circulation model. J. Atmos. Sci., 46, 1922-1942.
-, B. A. Wielicki and K. M. Ginger, 1994: The interpretation of
remotely sensed cloud properties from a model parameteriza-
tion perspective. J. Climate, 7, 1987-l 998.
Hegg, D. A., R. J. Ferek, and P. V. Hobbs, 1993: Light scattering and cloud condensation nucleus activity of sulfate aerosols
measured over the northeast Atlantic Ocean. J. Geophys.
Res., 98,14 887-l 4 894.
Emiliani, L., 1993: The Envisat programme. ESA Bull., 76, 59 pp.
Evans, K. F., and G. L. Stephens, 1995a: Microwave radiative transfer through clouds composed of realistically shaped ice
crystals. Part I: Single scattering properties. J. Atmos. Scb, 52,
2060-2076.
Houghton, J. T., G. J. Jenkins, and J. J. Ephraums, Eds., 1990: Climate Change: The IPCC Scientific Assessment. World Me- teorological Organization/United Nations Environment
Programme. Cambridge University Press, 364 pp.
Kaufman, Y. J., and B. C. Gao, 1992: Remote sensing of water vapor in the near IR from EOS/MODIS. IEEE Trans. Geosci.
Remote Sens., 30,871-884. -, R. S. Fraser, and R. L. Mahoney, 1991: Fossil fuel and
biomass burning effect on climate-heating or cooling? J.
Climate, 4,578-588.
-, and-, 1995b: Microwave radiative transferthrough clouds
composed of realistically shaped ice crystals. Part II: Remote sensing of ice clouds. J. Afmos. Sci., 52, 2077-2091.
Fowler, L. D., and D. A. Randall, 1994: A global radiative convec- tive feedback. Geophys. Res. Lett., 21,2035-2038.
Gao, B. C., A. F. H. Goetz, and W. J. Wiscombe, 1992: Cirruscloud
detection from airborne imaging spectrometer data using the 1.375,um water vapor band. Geophys. Res. Left, 20,301-304.
Gleason, J. F., and Coauthors, 1993: Record low global ozone in
1992. Science, 260, 523-526.
Kiehl, J. T., and B. P. Briegleb, 1993: The relative roles of sulfate
aerosols and greenhouse gases in climate forcing. Science,
260,311-314. King, M. D., 1993: Radiative properties of clouds.Aeroso/-C/oud-
Climate Interactions, P. V. Hobbs, Ed., Academic Press, 123-l 49.
Green, R. N., F. B. House, P. W. Stackhouse, X. Wu, S. A. Ackerman, W. L. Smith, and M. J. Johnson, 1990: Intercomparison
of scanner and nonscanner measurements for the Earth Radia-
tion Budget Experiment. J. Geophys. Res., 95,11 785-l 1 798. Greenwald, T. J., G. L. Stephens, T. H. Vonder Haar, and D. L.
Jackson, 1993: A physical retrieval of cloud liquid water over the global oceans using Special Sensor Microwave/lmager
(SSM/I) observations. J. Geophys. Res., 98,18 471-18 488. Gupta, S. K., 1989: A parameterization for longwave surface
radiation from sun-synchronous satellite data. J. Climate, 2,
305-320.
-, Y. J. Kaufman, W. P. Menzel, and D. TanrB, 1992: Remote
sensing of cloud, aerosol, and water vapor properties from the Moderate Resolution Imaging Spectrometer (MODIS). IEEE
Trans. Geosci. Remote Sens., 30, 2-27. -, L. F. Radke, and P. V. Hobbs, 1993: Optical properties of
marine stratocumulus clouds modified by ships. J. Geophys.
Res., 98,2729-2739. -, S. C. Tsay, and S. E. Platnick, 1995: In situ observations of
the indirect effects of aerosol on clouds. Aerosol Forcing of Climate, R. J. Charlson and J. E. Heintzenberg, Eds., John
Wiley and Sons, 227-248.
-, W. L. Darnell, and A. C. Wilber, 1992: A parameterization for surface longwave radiation from satellite data: Recent im-
provements. J. Appl. Meteor., 31, 1361-1367.
Hahn, C. J., S. G. Warren, J. London, R. M. Chervin, and R. Jenne, 1982: Atlas of simultaneous occurrence of different cloud types over the ocean. NCAR Tech Note TN-201 +STR, 212 pp. [NTIS
PB83-152074.1
Kinne, S., and K. N. Liou, 1989: The effects of the nonsphericity and size distributions of ice crystals on the radiative properties
of cirrus clouds. Atmos. Res., 24, 273-284. Klein, S. A., and D. L. Hartmann, 1993: Spurious changes in the
ISCCP dataset. Geophys. Res. Left., 20,455-458. Langner, J., and H. Rodhe, 1991: Aglobal three-dimensional model
of the tropospheric sulfur cycle. J. Atmos. Chem., 13,225-263. Lean, J., and D. A. Warrilow, 1989: Climate impact of Amazon
deforestation. Nature, 342, 311-313. Li, Z., and F. Becker, 1993: Feasibility of land surface temperature
and emissivity determination from AVHRR data. Remote Sens.
Env., 43,67-85.
Han, Q., W. B. Rossow, and A. A. Lacis, 1994: Near-global survey -, and H. G. Leighton, 1993: Global climatologies of solar
of effective droplet radii in liquid water clouds using ISCCP radiation budgets at the surface and in the atmosphere from 5
data. J. Climate, 7, 465-497. years of ERBE data. J. Geophys. Res., 96, 4919-4930.
Bulletin of the American Meteorological Society 2151

-, -, K. Masuda, and T. Takashima, 1993: Estimation of SW
flux absorbed at the surface from TOA reflected flux. J. Climate,
6,317-330.
-, C. H. Whitlock, and T. P. Charlock, 1995: Assessment of the
global monthly mean surface insolation estimated from satellite
measurements using Global Energy Balance Archive data. J. Climate, 8, 315-328.
Lin, X., and J. A. Coakley Jr., 1993: Retrieval of properties for semitransparent clouds from multispectral infrared imagery data.
J. Geophys. Res., 98,18 501-18 514. Liu, W. T., and C. Gautier, 1990: Thermal forcing on the tropical
Pacific from satellite data. J. Geophys. Res., 95, 13 209- 13217.
-, A. Zhang, and J. K. B. Bishop, 1994: Evaporation and solar
irradiance as regulators of sea surface temperature in annual and interannual changes. J. Geophys. Res., 99, 12 623- 12 637.
Luo, G., X. Lin, and J. A. Coakley Jr., 1994: 1 l-pm emissivities and
droplet radii for marine stratocumulus. J. Geophys. Res., 99,
3685-3698. Manabe, S., and K. Bryan, 1969: Climate calculations with a com-
bined ocean-atmosphere model. J. Atmos. Sci., 26, 786789. -, K. Bryan, and M. J. Spelman, 1975: A global ocean-
atmosphere climate model. Part 1: The atmospheric circula-
tion. J. Phys. Oceanogr., 5, 3-29. -, R. J. Stouffer, M. J. Spelman, and K. Bryan, 1991: Transient
responses of a coupled ocean-atmosphere model to gradual
changes of atmospheric CO,. Part I: Annual mean response. J. Climate, 4, 785-818.
McCormick, M. P., and R. E. Viega, 1992: SAGE II measurements of early Pinatubo aerosols, Geophys. Res. Left., 19, 155-l 56.
-, -, and W. P. Chu, 1992: Stratospheric ozone profile and
total ozone trends derived from the SAGE I and SAGE II data.
J. Geophys. Res., 19,269-272. Minnis, P., 1989: Viewing zenith angle dependence of cloudiness
determined from coincident GOES EAST and GOES WEST data. J. Geophys. Res., 94, 2303-2320.
-, 1994: Radiative forcing by the 1991 Mt. Pinatubo eruption. Preprints,EighfhConferenceonAtmospheric Radiation, Nash-
ville, TN, Amer. Meteor. Sot., J9-Jll. -, and E. F. Harrison, 1984: Diurnal variability of regional
cloud and clear-sky radiative parameters derived from GOES
data. Part I: Analysis method. J. Climate Appl. Meteor., 23,
993-l 011. -, D. F. Young, K. Sassen, J. Alvarez, and C. J. Grund, 1990:
The 27-28 October 1986 FIRE IF0 cirrus case study: Cirrus
parameter relationships derived from satellite and lidar data. Mon. Wea. Rev., 1182402-2425.
-, P. Heck, D. F. Young, C. W. Fairall, and J. B. Snider, 1992:
Stratocumulus cloud properties derived from simultaneous satellite and island-based instrumentation during FIRE. J.
Appl. Meteor., 31,317-339. -, E. F. Harrison, L. L. Stowe, G. G. Gibson, F. M. Denn, D. R.
Doelling, and W. L. Smith Jr., 1993: Radiative climate forcing by
the Mount Pinatubo eruption. Science, 259, 1411-1415. Nakajima, T., and M. D. King, 1990: Determination of the optical
thickness and effective particle radius of clouds from reflected
solar radiation measurements. Part I: Theory. J. Atmos. S&.,47,
1878-1893. -, -, J. D. Spinhirne, and L. F. Radke, 1991: Determination
of the optical thickness and effective particle radius of clouds from reflected solar radiation measurements. Part II: Marine
stratocumulus observations. J. Atmos. Sci., 48, 728-750.
Nobrk-C. A., P. J. Sellers, and J. Shukla, 1991: Amazonian deforestation and regional climate change. J. Climate, 4,
957-988.
Ohmura, A., and H. Gilgen, 1991: Global Energy Balance Archive
GEBA. The GEBA Database, lnteractiveApp/icatns, Retriev-
ing Data, World Climate Program Water Project A7, Report 2, Zurcher Geographische Schriften Nr. 44, Geographisches
lnstitut ETH, 60 pp.
Peixoto, J. P., and A. H. Oort, 1992: Physics of Climate. Amer. Inst.
Phys., 520 pp. Pinker, R., and I. Laszlo, 1992: Modelingsurfacesolar irradiancefor
satellite applications on a global scale. J. Appl. Meteor., 31, 194-211.
Platnick, S. E., and S. Twomey, 1994: Determining the susceptibility of cloud albedo to changes in droplet concentration with the
Advanced Very High Resolution Radiometer. J. Appl. Meteor., 33,334-347.
Platt, C. M., and Coauthors, 1994: The Experimental Cloud Lidar
Pilot Study (ECLIPS) for cloud-radiation research. Bull. Amer. Meteor. Sot., 75,1635-l 654.
Platt, T., S. Sathyendranath, C. M. Caverhill, and M. R. Lewis,
1988: Ocean primary production and available light: Further algorithms for remote sensing. Deep Sea Res., 35, 855-879.
Prabhakara, C., R. S. Fraser, G. Dalu, M. L. C. Wu, and R. J. Curran, 1988: Thin cirrus clouds: Seasonal distribution over oceans deduced from Nimbus-4 IRIS. J. Climate Appl. Meteor., 27, 279-299.
Price, R. D., M. D. King, J. T. Dalton, K. S. Pedelty, P. E. Ardanuy, and M. K. Hobish, 1994: Earth science dataforall: EOS and the
EOS Data and Information System. Photogramm. Eng. Re-
mote Sens., 60,277-285. Radke, L. F., J. A. Coakley Jr., and M. D. King, 1989: Direct and
remote sensing observations of the effects of ships on clouds. Science, 246,1146-l 149.
Ramanathan, V., and W. Collins, 1991: Thermodynamic regulation
of ocean warming by cirrus clouds deduced from observations of the 1987 El Niiio. Nature, 351, 27-32.
-, R. D. Cess, E. F. Harrison, P. Minnis, B. R. Barkstrom, E. Ahmad, and D. Hartmann, 1989: Cloud-radiative forcing and
climate: Results from the Earth Radiation Budget Experiment. Science, 243,57-63.
-, B. Subasilar, G. J. Zhang, W. Conant, R. D. Cess, J. T. Kiehl,
H. Grassl, and L. Shi, 1995: Warm pool heat budget and short- wave cloud forcing: A missing physics? Science, 267,
499-503.
Randall, D. A., J. Coakley, C. Fairall, R. Kropfli, and D. Lenschow,
1984: Outlook for research on marine subtropical stratocumu- lus clouds. Bull. Amer. Meteor. Sot., 65, 1290-l 301.
-, Harshvardhan, D. A. Dazlich, and T. G. Corsetti, 1989: Interactions among radiation, convection, and large-scale dy-
namics in a general circulation model. J. Atmos. Sci., 46,
1943-l 970. Rao, C. R. N., L. L. Stowe, and E. P. McClain, 1989: Remote
sensing of aerosol overthe ocean using AVHRR data: Theory, practice, and applications. lnt. J. Remote Sens., 10,743-749.
Rossow, W. B., F. Masher, E. Kinsella, A. Arking, M. Desbois, E.
Harrison, P. Minnis, E. Ruprecht, G. Seze, C. Simmer, and E. Smith, 1985: ISCCP cloud algorithm intercomparison. J. C/i- mate Appl. Meteor., 24, 877-903.
-, L. C. Garder, P.-J. Lu, and A. Walker, 1991: International Satellite Cloud Climatology Project (\SCCP) documentation of
cloud data. World Meteorological Organization Tech. Docu- ment, WMOITD-No. 266 (Revised), 76 pp.
Saunders, R. W., and K. T. Kriebel, 1988: An improved method for
detecting clear sky and cloudy radiances from AVHRR data. lnt. J. Remote Sens., 9, 123-150.
Sellers, P. J., and F. G. Hall, 1992: FIFE in 1992: Results, scientific gains, and future research directions. J. Geophys. Res., 97, 19 091-19 109.
2152 Vol. 76, No. I 1, November 1995

-, and D. S. Schimel, 1993: Remote sensing of the land
biosphere and biogeochemistry in the EOS era. Global and
Planetary Change, 7,279-297.
Shuttleworth, W. J., and R. E. Dickinson, 1989: Comments on “Modelling tropical deforestation: A study of GCM land-surface
parameterizations.” Quart. J. Roy. Meteor Sot., 115, 1177-
1179. Simpson, J., Ft. F. Adler, and G. R. North, 1988: A proposed
Tropical Rainfall Measuring Mission (TRMM) satellite. Bull.
Amer. Meteor. Sot., 69,278-295. Slingo, A., 1990: Sensitivity of the Earth’s radiation budget to
changes in low clouds. Nature, 343, 49-51. -, and J. M. Slingo, 1988: The response of a general circulation
model to cloud longwave radiative forcing. I: introduction and
initial experiments. Quart. J. Roy. Meteor. Sot., 114,1027-l 062. -, and M. Webb, 1992: Simulation longwave
radiation over the oceans using operational analyses. Quart. J.
Roy. Meteor. Sot., 116, 1117-l 144. Smith, W. L., and H. M. Woolf, 1976: The use of eigenvectors of
statistical covariance matrices for interpreting satellite sound- ing radiometer observations. J. Atmos. Sci., 33, 1127-l 140.
Stephens, G. L., 1978: Radiation profiles in extended water clouds.
II: Parameterization schemes. J. Atmos. Sci., 35,2123-2132.
-, and S. Tsay, 1990: On the cloud absorption anomaly. Quart. J. Roy. Meteor. Sot., 116, 671-704.
-, A. Slingo, M. J. Webb, P. J. Minnett, P. H. Daum, L. Kleinman,
I. Wittmeyer, and D. A. Randall, 1994: Observations of the Earth’s radiation budget in relation to atmospheric hydrology. Part IV: Atmospheric column radiative cooling of the world’s
oceans. J. Geophys. Res., 99,18 585-18 604. Stokes, G. M., and S. E. Schwartz, 1994: The Atmospheric
Radiation Measurement (ARM) Program: Programmatic back-
ground and design of the cloud and radiation test bed. Bull. Amer. Meteor. Sot., 75, 1201-1221.
Stone, R. S., G. L. Stephens, C. M. R. Platt, and S. Banks, 1990: The remote sensing of thin cirrus clouds using satellites, lidar and radiative transfer theory. J. Appl. Meteor., 29, 353-366.
Stowe, L. L., C. G. Wellemeyer, T. F. Eck, H. Y. M. Yeh, and Nimbus-7 Cloud Data Processing Team, 1988: Nimbus-7 global cloud climatology. Pat-l I: Algorithm and validation. J.
Climate, 1,445-470. -, E. P. McClain, R. Carey, P. Pellegrino, G. Gutman, P. Davis,
C. Long, and S. Hart, 1991: Global distributions of cloud cover derived from NOAA/AVHRR operational satellite data. Adv.
Space Res., 14,51-54. -, R. M. Carey, and P. P. Pellegrino, 1992: Monitoring the Mt.
Pinatubo aerosol layer with NOAA-7 7 AVHRR data. Geophys.
Res. Lett., 19, 159-l 62. Suttles, J. T., R. N. Green, P. Minnis, G. L. Smith, W. F. Staylor, B.
A. Wielicki, I. J. Walker, D. F. Young, V. R. Taylor, and L. L. Stowe, 1988: Angular Radiation Models ForEarth-Atmosphere System. Volume I-Shortwave Radiation. NASA Reference
Publication 1184, NASA, 147 pp.
-, B. A. Wielicki, and S. Vemury, 1992: Top-of-atmosphere
radiative fluxes: Validation of ERBE scanner inversion algorithm
using Nimbus-7 ERB data. J. Appt. Meteor., 31,784-796. Takano, Y., and K. N. Liou, 1989: Solar radiative transfer in cirrus
clouds. I. Single-scattering and optical properties of hexagonal
ice crystals. J. Atmos. Sci., 46, 3-20. Tally, L. D., 1984: Meridianal heat transport in the Pacific Ocean.
J. Phys. Oceanogr., 14,231-241. Tian, L., and J. A. Curry, 1989: Cloudoverlapstatistics. J. Geophys.
Res., 94,9925-9935. Twomey, S., 1977: The influence of pollution on the shortwave
albedo of clouds. J. Atmos. Sci., 34, 1149-l 152.
Vonder Haar, T. H., and A. H. Oort, 1973: New estimate of annual poleward energy transport by Northern Hemisphere oceans. J.
Phys. Oceanogr., 3,169-l 72. WCRP (World Climate Research Programme), 1982: Cage experi-
ment: A feasibility study. WCRP-22, 95 pp. -, 1991: Radiation and climate. Second Workshop on Implemen-
tation of the Baseline Surface Radiation Network. WCRP-64,
WMO/TD-No. 453. -, 1994: Utility and Feasibility of a Cloud Profiling Radar.
WCRP-84, IGPO Publication Series No. 10, 46 pp.
Welch, R. M., S. K. Sengupta, A. K. Goroch, P. Rabindra, N.
Rangaraj, and M. S. Navar, 1992: Polar cloud and surface classification using AVHRR imagery: An intercomparison of
methods. J. Appl. Meteor., 31, 405-420. Wielicki, B. A., and J. A. Coakley Jr., 1981: Cloud retrieval using
infrared sounder data: An error analysis. J. Appl. Meteor., 20,
37-49. -, and R. M. Welch, 1986: Cumulus cloud field propertiesderived
using Landsat digital data. J. Climate Appl. Meteor, 25,261-276.
-, and B. R. Barkstrom, 1991: Clouds and the Earth’s Radiant
Energy System (CERES): An Earth Observing System experi- ment. Preprints, SecondSymp. on GlobalChangeStudies, New Orleans, LA, Amer. Meteor. Sot., 1 l-l 6.
-, and L. Parker, 1992: On the determination of cloud cover from satellite sensors: The effect of sensor spatial resolution. J.
Geophys. Res., 97,12 799-l 2 823. -, J. T. Suttles, A. J. Heymsfield, R. M. Welch, J. D. Spinhirne,
M. L. C. Wu, S. K. Cox, D. O’C. Starr, L. Parker, and R. F. Arduini, 1990: The 27-28 October 1986 FIRE IF0 cirrus case study: Comparison of radiative transfer theory with observa- tions bysatelliteandaircraft.Mon. Wea. Rev., 116,2356-2376.
Wylie, D. P., and W. P. Menzel, 1989: Two years of cloud cover
statistics using VAS. J. Climate, 2, 380-392. Yamanouchi, T., K. Suzuki, and S. Kawaguci, 1987: Detection of
clouds in Antarctica from infrared multispectral data of AVHRR.
J. Meteor. Sot. Japan, 65,949-962. Zhu, T., J. Lee, R. C. Weger, and R. M. Welch, 1992: Clustering,
randomness, and regularity in cloud fields: 2. Cumulus cloud
fields. J. Geophys. Res., 97, 20 537-20 558.
[Reprinted tiom BULLETIN OF THE AMERICAN METEOROLOGICAL SOCIETY, Vol. 76, No. I 1. November 19951
Printed in U. S. A.
Bulletin of the American Meteorological Society 2153