missing data procedures for psychosocial...
TRANSCRIPT

Missing data procedures for psychosocial research
Elizabeth Stuart
Mental Health Summer Institute 330.616Johns Hopkins Bloomberg School of Public Health
Department of Mental HealthDepartment of Biostatistics
Department of Health Policy and [email protected]
www.biostat.jhsph.edu/∼estuart
June 15-16, 2015
Liz Stuart (JHSPH (330.616)) Missing data June 15-16, 2015 1 / 155

Outline: Day 1
1 Introduction and terminologyUnderstanding types of missingness
2 Ways of handling missing data(Generally) improper ways of handling missing data...Better ways of dealing with missing data...
3 Implementing multiple imputation
4 What if you think your data is NMAR?
5 Data complications and FAQ’s
6 Conclusions
7 SoftwareIllustrative dataset
8 References
Liz Stuart (JHSPH (330.616)) Missing data June 15-16, 2015 2 / 155

Outline: Day 2
Will demonstrate some statistical software for creating and analyzingmultiply imputed data
Will at least briefly cover:For creating imputations:
SAS: IVEWare, proc miStata: mi suite of commands, iceR: mice, mi
For analyzing multiply imputed data:
SAS: proc mianalyzeStata: mi, mim, micombineR: mitools, miMplusHLM
Will have some time for individual work if you want to bring in yourown dataset to try things out on
Liz Stuart (JHSPH (330.616)) Missing data June 15-16, 2015 3 / 155

Outline
1 Introduction and terminologyUnderstanding types of missingness
2 Ways of handling missing data(Generally) improper ways of handling missing data...Better ways of dealing with missing data...
3 Implementing multiple imputation
4 What if you think your data is NMAR?
5 Data complications and FAQ’s
6 Conclusions
7 SoftwareIllustrative dataset
8 References
Liz Stuart (JHSPH (330.616)) Missing data June 15-16, 2015 4 / 155

Course description
Nearly every study in mental health research suffers from at least some amount ofmissing data: either individuals who did not respond to an entire survey (termed “unitnonresponse” or “attrition”) or individuals with partially observed data but some missingitems (termed “item nonresponse”). Analyses that use just the individuals for whomdata is observed can lead to bias and misleading results. This course will first discusstypes of missing data, and implications of the misssingness on analyses. It will thencover solutions for dealing with both types of missing data. These solutions includeweighting approaches for unit nonresponse and imputation approaches for itemnonresponse. An emphasis wills be on practical implementation of the proposedstrategies, including discussion of software to implement imputation approaches. Thiswill focus on recently developed software to implement multiple imputation, such asIVEware for SAS and ICE for Stata. Examples will come from school-based preventionresearch as well as drug abuse and dependence. Course attendees are not expected tohave extensive background in statistical methods; an emphasis will be on making theideas accessible to a broad audience.
Liz Stuart (JHSPH (330.616)) Missing data June 15-16, 2015 5 / 155
Missing data
Missing data common, especially with administrative data or sensitivesurveys
Advanced methods have been developed to handle missing data
But how do we actually implement those methods?
What are the implications for analyses?
Liz Stuart (JHSPH (330.616)) Missing data June 15-16, 2015 6 / 155

Why should you pay attention?
Ignoring or inappropriately handling missing data may lead to...
Biased estimates
Incorrect standard errors
Incorrect inferences/results!
Liz Stuart (JHSPH (330.616)) Missing data June 15-16, 2015 7 / 155

An example
Hill et al. (2005): maternal employment and child development
Abstract: “Our results demonstrate small but significant negativeeffects of maternal employment on children’s cognitive outcomes forfull-time employment in the 1st year postbirth as compared withemployment postponed until after the 1st year. Multiple imputationyields noticeably different estimates as compared with a completecase approach for many measures.”
Missingness rate ranged from 0-60% across variables
Liz Stuart (JHSPH (330.616)) Missing data June 15-16, 2015 8 / 155

Hill et al. (2005); Table 2
Liz Stuart (JHSPH (330.616)) Missing data June 15-16, 2015 9 / 155
Types of missing data
Will discuss two main types of missing data:
“Unit nonresponse”: when data for an entire “unit” (e.g., individual)is missing
e.g., did not respond at all to follow-up surveyAlso called “attrition”Usually handled using nonresponse weighting adjustments or maximumlikelihood methods
“Item nonresponse”: when individual items are missing for anindividual
e.g., someone answered most of the survey questions, but left a fewblankUsually handled using imputation approaches or maximum likelihoodmethods
Liz Stuart (JHSPH (330.616)) Missing data June 15-16, 2015 10 / 155

A little notation
X obs denotes observed values
Xmis denotes missing values
Y denotes some observed outcome of interest
R denotes missing data indicators
Rij = 1 if person i has variable j missing, Rij if that value observed
Liz Stuart (JHSPH (330.616)) Missing data June 15-16, 2015 11 / 155
Four common methods for dealing with missingness
1 Complete-case analysis
Assumes data missing completely at random: can lead to very biasedresultsOften results in large reductions in sample size; reduced power
2 Simple (single) imputations
e.g., mean imputation, regression prediction imputation, hot-deckimputationDoesn’t account for uncertainty in imputations
3 Multiple imputation
Best imputation approachEasy to use software now exists
4 Maximum likelihood methods
For some models (e.g., longitudinal models), maximum likelihoodmethods can take missing data into accountUse the observed data, standard errors accurately reflect the missingdata
Liz Stuart (JHSPH (330.616)) Missing data June 15-16, 2015 12 / 155

Lots of reasons for missingness...
Non-response/attrition
Data entry errors
Administrative data with missing values
Lost survey forms
Individuals not wanting to disclose (or not knowing) particularinformation
Note: sometimes entire variables are missing in that they are “latent”;we will generally not be talking about those types of variables
Liz Stuart (JHSPH (330.616)) Missing data June 15-16, 2015 13 / 155

More formally...“Missing data mechanisms”
Need to understand what led to missing values
Missing Completely at Random (MCAR): Missingness is totallyrandom; does not depend on anything
P(R|Y ,X ) = P(R|Y ,X obs ,Xmis) = P(R|ψ)Cases with missing values a random sample of the original sampleNo systematic differences between those with missing and observedvaluesAnalyses using only complete cases will not be biased, but may havelow powerGenerally unrealistic, although may be reasonable for things like dataentry errors
Liz Stuart (JHSPH (330.616)) Missing data June 15-16, 2015 14 / 155

Missing At Random (MAR): Missingness depends on observed data
P(R|Y ,X ) = P(R|Y ,X obs , ψ)e.g., women more likely to respond than menSo there are differences between those with observed and missingvalues, but we observe the ways in which they differCan use weighting or imputation approaches to deal with themissingnessThis is probably the assumption made most frequentlyIncluding a lot of predictors in the imputation model can make thismore plausible
Liz Stuart (JHSPH (330.616)) Missing data June 15-16, 2015 15 / 155

Not Missing At Random (NMAR): Missingness depends onunobserved values
(R|Y ,X ) cannot be simplifiede.g., probability of someone reporting their income depends on whattheir income ise.g., probability of reporting prior arrests depends on whether or notthey had previously been arrestede.g., probability of reporting prior arrests depends on whether or notthey are left-handed, and we do not observe left-handedness for anyonei.e., even among people with the same values of the observedcovariates, those with missing values on Y have a different distributionof Y than do those with observed YSo we can’t just use the observed cases to help impute the missingcasesUnfortunately no easy ways of dealing with this...have to posit somemodel of the missing data process
Liz Stuart (JHSPH (330.616)) Missing data June 15-16, 2015 16 / 155

Of course those are assumptions...
Never know which of them is correct
Can do diagnostics/tests for whether missingness is MCAR vs. (MARor NMAR) (Enders 2010, p. 18)
Does the probability of missingness depend on other variables?e.g., are the mean ages of people with missing and non-missing valuesof drug use behavior different?e.g., In a logistic regression predicting missingness on some variable,are there other variables that are significant predictors?Little (1998; JASA): test for MCAR
Liz Stuart (JHSPH (330.616)) Missing data June 15-16, 2015 17 / 155

But never know for sure if missingness is MAR or NMAR...
Have to use substantive understanding of what might have led tomissing valuese.g., Are those who had been arrested more likely to not respond to aquestion asking about previous arrests? (They may not want to lie, butalso may not want to tell the truth...)Helps to have a good understanding of the data collection processIf believe missingness is NMAR, have to posit some model for themissingness (e.g., that those with previous arrests are 10% more likelyto not respond to that question)Tailored for each research questionSiddique and Belin (2008): example of missing depression levels;simulations show value in using a variety of assumptions and modelsMore later . . .
Liz Stuart (JHSPH (330.616)) Missing data June 15-16, 2015 18 / 155

Why is it hard to come up with guidelines regarding the %of missingness: The fraction of missing information
Hard to say what % of missing data is too much (or too little toworry about)
Variable with 90% missing might be fine if really good predictors areobservedVariable with 15% missing might be very problematic if no goodpredictors are observed
Instead: fraction of missing information
How much information is in the observed data regarding a particularparameter?Can be estimated by examining variation across multiple imputations(more later...)
Liz Stuart (JHSPH (330.616)) Missing data June 15-16, 2015 19 / 155

Outline
1 Introduction and terminologyUnderstanding types of missingness
2 Ways of handling missing data(Generally) improper ways of handling missing data...Better ways of dealing with missing data...
3 Implementing multiple imputation
4 What if you think your data is NMAR?
5 Data complications and FAQ’s
6 Conclusions
7 SoftwareIllustrative dataset
8 References
Liz Stuart (JHSPH (330.616)) Missing data June 15-16, 2015 20 / 155
Inappropriate ways of handling missing data
Ignoring it
Complete case
Missing indicator approach
Last observation carried forward
Single imputation
Liz Stuart (JHSPH (330.616)) Missing data June 15-16, 2015 21 / 155

Ignoring it...
Common approach is to “ignore” it; just run models without doinganything about missingness
Then what is done will depend on the defaults of the software
Usually will be the same as complete-case analyses, discussed next
Liz Stuart (JHSPH (330.616)) Missing data June 15-16, 2015 22 / 155
Complete case analysis
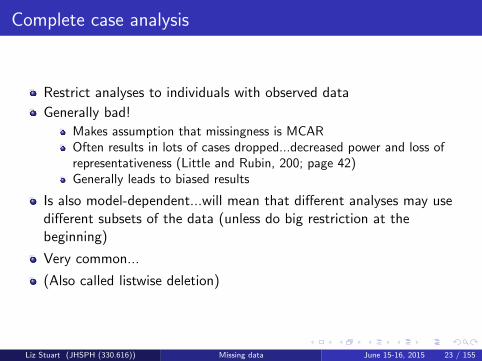
Restrict analyses to individuals with observed data
Generally bad!
Makes assumption that missingness is MCAROften results in lots of cases dropped...decreased power and loss ofrepresentativeness (Little and Rubin, 200; page 42)Generally leads to biased results
Is also model-dependent...will mean that different analyses may usedifferent subsets of the data (unless do big restriction at thebeginning)
Very common...
(Also called listwise deletion)
Liz Stuart (JHSPH (330.616)) Missing data June 15-16, 2015 23 / 155

Researchers will often compare characteristics of the people in thefinal sample with those in the original sample
This okay, but doesn’t tell the whole storyDoes give some evidence for generalizability of results, but what if therelationships differ?
Liz Stuart (JHSPH (330.616)) Missing data June 15-16, 2015 24 / 155

Missing data indicator approach
Sometimes people will create an indicator for the missingness andinclude that as an additional predictor in regression models
Categorical variables: create an additional category
e.g., Gender: “male”, “female”, “missing”
Continuous variables: create an additional variable, and impute themean for the cases with missing values
In regression models, include both the variable itself (e.g., age) and theindicator for having age missing (e.g., mage)
Doesn’t work very well and can lead to bias (Vach and Blettner 1991,Donders et al. 2006, Greenland and Finkle 1995)
(Note: This does actually work well within propensity scoreestimation context)
Liz Stuart (JHSPH (330.616)) Missing data June 15-16, 2015 25 / 155

Last observation carried forward
For longitudinal studies
If someone drops out of study, the last value observed for them is“carried forward” (copied) to later time points
Used often in FDA clinical trials
But generally biased (Carpenter et al. 2004; Cook, Zeng, and Yi,2004; Jansen et al. 2006)
A simple form of single imputation (see next slides...)
Liz Stuart (JHSPH (330.616)) Missing data June 15-16, 2015 26 / 155

Single imputation
Single imputation fills in (“imputes”) each missing value with a“best-guess”Ways of doing that prediction:
Mean
Regression prediction (“conditional mean imputation”)
e.g., impute mean within categories of observed covariates (gender,race, etc.)e.g., fit regression model among observed cases, use to predict predictresponse for individuals with missing values
Yi = α + βXi
Regression prediction plus error (“stochastic regression imputation”)
Like regression prediction, but also add error term on (impute off theregression line)
Yi = α + βXi + ei , ei ∼ N(0, σ2)
Liz Stuart (JHSPH (330.616)) Missing data June 15-16, 2015 27 / 155

“Hot-deck”
For an individual with missing data, find individuals with the sameobserved values on other variables, randomly pick one of their values asthe one to use for imputation
Predictive mean matching
Like a combination of regression prediction and hot-deckTake observed value from someone with similar predicted value
Liz Stuart (JHSPH (330.616)) Missing data June 15-16, 2015 28 / 155

Simple example: Observed data
Individual Gender Age MIQ IQ Test Score
1 M 24 0 1222 M 32 0 1093 M 41 0 1314 M 22 1 ?5 F 20 0 1356 F 42 0 1027 F 31 0 1248 F 32 1 ?
Liz Stuart (JHSPH (330.616)) Missing data June 15-16, 2015 29 / 155

Simple example: Mean imputation
Impute mean across all individuals (120.5)
Individual Gender Age MIQ IQ Test Score
1 M 24 0 1222 M 32 0 1093 M 41 0 1314 M 22 1 (120.5)5 F 20 0 1356 F 42 0 1027 F 31 0 1248 F 32 1 (120.5)
Liz Stuart (JHSPH (330.616)) Missing data June 15-16, 2015 30 / 155

Simple example: Conditional mean imputation
Impute mean separately for males and females
Individual Gender Age MIQ IQ Test Score
1 M 24 0 1222 M 32 0 1093 M 41 0 1314 M 22 1 (120.7)5 F 20 0 1356 F 42 0 1027 F 31 0 1248 F 32 1 (120.3)
Liz Stuart (JHSPH (330.616)) Missing data June 15-16, 2015 31 / 155
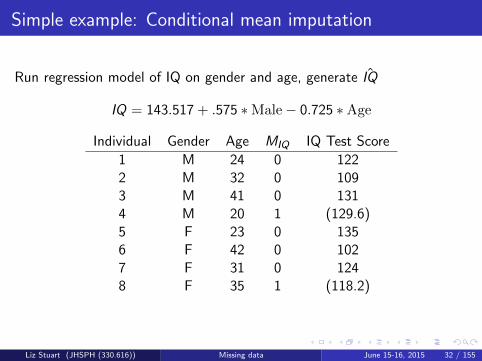
Simple example: Conditional mean imputation
Run regression model of IQ on gender and age, generate ˆIQ
IQ = 143.517 + .575 ∗Male− 0.725 ∗Age
Individual Gender Age MIQ IQ Test Score
1 M 24 0 1222 M 32 0 1093 M 41 0 1314 M 20 1 (129.6)5 F 23 0 1356 F 42 0 1027 F 31 0 1248 F 35 1 (118.2)
Liz Stuart (JHSPH (330.616)) Missing data June 15-16, 2015 32 / 155

Simple example: Stochastic mean imputation
Run regression model of IQ on gender and age, generate ˆIQ
IQ = 143.517 + .575 ∗Male− 0.725 ∗Age + N(0, σ2)
Individual Gender Age MIQ IQ Test Score
1 M 24 0 1222 M 32 0 1093 M 41 0 1314 M 20 1 (113.03)5 F 23 0 1356 F 42 0 1027 F 31 0 1248 F 35 1 (121.09)
Liz Stuart (JHSPH (330.616)) Missing data June 15-16, 2015 33 / 155

Simple example: Hot-deck imputation
Based just on gender here...For each person with a missing value, impute a value drawn randomlyfrom the observed values of people with the same gender
Individual Gender Age MIQ IQ Test Score
1 M 24 0 1222 M 32 0 1093 M 41 0 1314 M 20 1 (109)5 F 23 0 1356 F 42 0 1027 F 31 0 1248 F 35 1 (124)
Liz Stuart (JHSPH (330.616)) Missing data June 15-16, 2015 34 / 155

Predictive mean matching
Another way of generating imputations
Like a mix of MICE and hot-deck
For each person with a missing value, generates a predicted value(using some model like in MICE) and then finds individuals withobserved values but similar predictions, “takes” their observed valuefor the person with a missing value
Works best for continuous variables and monotone missing data
Liz Stuart (JHSPH (330.616)) Missing data June 15-16, 2015 35 / 155

Summary of single imputation approaches
Best are regression prediction plus error or hot-deck (based oncategorical versions of all of the variables observed)
Can be reasonable (especially if not a lot of missing data, e.g., < 5%(Graham 2008))
BUT...results in overly precise estimates
Analyses following single imputation do not know that some of thevalues have been imputedSimply treats all of the values as observed valuesSo does not take into account the uncertainty in the imputations
Anti-conservative...results will have more significance, narrowerconfidence intervals, than they should (Donders et al. 2006)
Higher Type I error rates
So what to do instead?
Liz Stuart (JHSPH (330.616)) Missing data June 15-16, 2015 36 / 155

Appropriate ways of handling missingness
Maximum likelihood
Weighting
Getting information from another source
Multiple imputation
Liz Stuart (JHSPH (330.616)) Missing data June 15-16, 2015 37 / 155

Maximum likelihood approaches
In some cases, maximum likelihood approaches exist
Sometimes called “full information maximum likelihood”
Directly maximize the likelihood function, f (X ,Y )
Likelihood factors into two pieces: piece due to cases with fullyobserved data and piece due to cases with missing dataThese two maximized together to get the maximum likelihoodestimates (MLEs)Often uses Expectation-Maximization (EM) algorithm (Dempster,Laird, and Rubin, 1977)Can think of as iterating between generating imputations of missingvalues and estimating model of interestIterate until convergence
Liz Stuart (JHSPH (330.616)) Missing data June 15-16, 2015 38 / 155

Use observed values, take missingness into account
e.g., longitudinal analyses that use the observations available for eachperson and correctly account for the missing observations
When ML methods exist, can work very well
But they don’t always exist so not always a feasible option
Mostly assume only missing outcomes, not missing predictors
Another drawback is that you cannot use auxiliary information toimprove the predictions; uses only the variables in the actual analysis
Assumes MAR given the variables in the model
Exist mostly in structural equation modeling software (LISRESL,Mplus)
Graham (2008), Siddique et al. (2008; a mixed-effects regressionmodel), Enders (2010; Chapter 4)
Liz Stuart (JHSPH (330.616)) Missing data June 15-16, 2015 39 / 155

Nonresponse weighting
Often used to deal with attrition
Generate model predicting non-response given observed covariates
Weight respondents by their inverse probability of response
Weights the respondents up to represent the full sampleSame idea as survey sampling weights
Use analysis methods that allow for weights (e.g., survey packages)
Works well for simple missing data patterns (e.g., attrition)
Horton and Lipsitz (1999), Carpenter et al. (2006), Seaman andWhite (2013)
Liz Stuart (JHSPH (330.616)) Missing data June 15-16, 2015 40 / 155

A simple example...
Imagine 100 males and 100 females in sample
But only 80 males and 75 females respond
Male respondents will get weight of 100/80 = (1/(80/100)) = 1.25
Female respondents will get weight of 100/75 = (1/(75/100)) =1.333
So, e.g., a male respondent represents 1.25 males in the originalsample
These weights will make the 80 male and 75 female respondentsrepresent the full sample of 200
Liz Stuart (JHSPH (330.616)) Missing data June 15-16, 2015 41 / 155

To implement weighting adjustments:
Fit model predicting response as a function of fully observedcharacteristicsAssign respondents a weight of 1/(p(response))Use those weights in regression models and summary statistics
Will weight the respondents to look like the full original sample
Like survey sampling weights, except estimated instead of known
Can be used for attrition as well as for original survey response
Liz Stuart (JHSPH (330.616)) Missing data June 15-16, 2015 42 / 155

Use model with many characteristics, generally measured at baseline(especially those predictive of response as well as the variables ofprimary interest)
Treat the weights like you would survey sampling weights (e.g., usingsurvey packages), run weighted models (e.g., pweight in Stata)
Some concern about extreme weights
Check distribution of weights, respecify model if needed, trim outliersSome do a “weighting class adjustment” where actually just form 5subclasses based on the probabilities and everyone in each subclass getsthe same weightExtreme weights may also indicate extrapolation from complete toincomplete cases
Relatively simple (and widely accepted) way of handling attrition/unitnon-response
Liz Stuart (JHSPH (330.616)) Missing data June 15-16, 2015 43 / 155

Proposal for creation of weights (Seaman and White,2013, p. 287)
1 Identify a priori predictors of missingness. Exclude any that are likelynot predictive of key variables of ultimate interest. Add any stronglypredictive of primary outcome of interest.
2 Examine distribution of continuous predictors, transform as needed toavoid long tails.
3 Fit missingness model using full set of predictors. Consider lasso orother non-parametric models.
4 Check model fit using Hosmer-Lemeshow and/or Hinkley’s method.
5 Check distribution of weights for complete and incomplete cases. Ifany zeros, simplify model. Check for extreme weights, modify modelas needed.
Liz Stuart (JHSPH (330.616)) Missing data June 15-16, 2015 44 / 155

Alternative sources of information
In some cases, can utilize a secondary data source to get neededinformation
e.g., school records to get high school graduatione.g., criminal records to get criminal activitye.g., national death records to get death informationCan be resource intensive, especially if need to cover a lot ofgeographic areas/lots of schools
In other cases, can calibrate numbers to known totals
e.g., issue of missing information about offender and incident in theSupplemental Homicide Reports (SHR)Compare victim counts in SHR to similar data from NCHS, adjust asnecessary (Fox and Zawitz 2004)Wadsworth and Roberts (2008) evaluates four common techniques fordealing with this missingness that utilize supplemental info from policerecords
Liz Stuart (JHSPH (330.616)) Missing data June 15-16, 2015 45 / 155

Multiple imputation
Same idea as single imputation, but fills in each missing valuemultiple times
Like repeating the stochastic mean imputation multiple times(Although could potentially use hot-deck or predictive mean matchingas well; just do each multiple times and allow for randomness in whichobserved values selected each time)
Three steps:1 Generate imputations: Create multiple (e.g., 10) “complete” data sets
by filling in (imputing) the missing values2 Run analysis on each imputed data set (can be almost any analysis)3 Combine (pool) results from the imputed data sets using standard
“combining rules” (Rubin 1987)
In pooled result, total variance a function of within-imputationvariance and between-imputation variance
Takes into account the uncertainty in the imputations
Also nice because very general: same set of imputations can be usedfor many analyses
Liz Stuart (JHSPH (330.616)) Missing data June 15-16, 2015 46 / 155

Simple example: Multiple imputation (1)
Run regression model of IQ on gender and age, generate ˆIQ
IQ = 143.517 + .575 ∗Male− 0.725 ∗Age + N(0, σ2)
Individual Gender Age MIQ IQ Test Score
1 M 24 0 1222 M 32 0 1093 M 41 0 1314 M 20 1 (113.03)5 F 23 0 1356 F 42 0 1027 F 31 0 1248 F 35 1 (121.09)
Liz Stuart (JHSPH (330.616)) Missing data June 15-16, 2015 47 / 155

Simple example: Multiple imputation (2)
Run regression model of IQ on gender and age, generate ˆIQ
IQ = 143.517 + .575 ∗Male− 0.725 ∗Age + N(0, σ2)
Individual Gender Age MIQ IQ Test Score
1 M 24 0 1222 M 32 0 1093 M 41 0 1314 M 20 1 (131.93)5 F 23 0 1356 F 42 0 1027 F 31 0 1248 F 35 1 (120.16)
Liz Stuart (JHSPH (330.616)) Missing data June 15-16, 2015 48 / 155

Simple example: Multiple imputation (3)
Run regression model of IQ on gender and age, generate ˆIQ
IQ = 143.517 + .575 ∗Male− 0.725 ∗Age + N(0, σ2)
Individual Gender Age MIQ IQ Test Score
1 M 24 0 1222 M 32 0 1093 M 41 0 1314 M 20 1 (111.35)5 F 23 0 1356 F 42 0 1027 F 31 0 1248 F 35 1 (126.93)
Liz Stuart (JHSPH (330.616)) Missing data June 15-16, 2015 49 / 155

The goal of MI, or actually any procedure to deal withmissing data
The goal is not to predict the missing values or get the missing valuesclose to the true values . . . goal is to obtain valid statistical inferencesaccounting for the missing data
Liz Stuart (JHSPH (330.616)) Missing data June 15-16, 2015 50 / 155

Outline
1 Introduction and terminologyUnderstanding types of missingness
2 Ways of handling missing data(Generally) improper ways of handling missing data...Better ways of dealing with missing data...
3 Implementing multiple imputation
4 What if you think your data is NMAR?
5 Data complications and FAQ’s
6 Conclusions
7 SoftwareIllustrative dataset
8 References
Liz Stuart (JHSPH (330.616)) Missing data June 15-16, 2015 51 / 155

How to create multiple imputations
Two main approaches:
Joint model of all variables
e.g., assume multivariate normal distribution of all of the variablesFit using the observed casesUse to predict (multiple times) the missing valuesSometimes multivariate normal model used even with categoricalvariables (imputations are then rounded back to categories), but thiscan be severely biased (Horton, Lipsitz, and Parzen, 2003; Allison 2005)Software: Norm, mix, SAS proc mi
Multiple imputation by chained equations (MICE)
Model each variable one at a time as a function of the other variablesAllows for much more flexible models for each variable (e.g.,counts/binary/continuous)Doesn’t necessarily imply a proper joint distribution, but doesn’t seemto be a big problem in practiceWill discuss and illustrate software tomorrow
Liz Stuart (JHSPH (330.616)) Missing data June 15-16, 2015 52 / 155

An aside . . . monotone missing data
Monotone missing data has a structure where the variables can besorted such that:
If variable X is missing, then the rest of the variables are missing
e.g., longitudinal data with drop out (and once people drop out theydon’t come back)
Data missingness pattern looks like a staircase
When have a monotone structure, MI easy to implement–can justimpute in order from least missing to most missing
Doesn’t require iteration, which we’ll see MICE does require
Liz Stuart (JHSPH (330.616)) Missing data June 15-16, 2015 53 / 155

Multiple Imputation by Chained Equations (MICE)
MICE procedure allows modeling each variable one at a time
Fit model of each variable, conditional on all othersIterate fitting model and imputing each variableAllows bounds (e.g., age started smoking)Incorporates restriction to subpopulations (e.g., age started smoking)
Also called “fully conditional specification” (FCS)
Raghunathan et al. (2001)
Liz Stuart (JHSPH (330.616)) Missing data June 15-16, 2015 54 / 155

Example of MICE
3 variables: X1 (binary), X2 (continuous), X3 (ordinal)Steps in MICE:
1 Do simple imputations to fill in missing values for X1, X2, X3
2 Using cases with observed X1, fit logistic regression model ofX1 ∼ X2 + X3; predict missing values of X1
3 Using cases with observed X2, fit normal regression model ofX2 ∼ X1 + X3; predict missing values of X2
4 Using cases with observed X3, fit proportional odds regression modelof X3 ∼ X1 + X2; predict missing values of X3
5 Iterate Steps 2-4
6 Repeat Step 5 to get multiple imputations
Liz Stuart (JHSPH (330.616)) Missing data June 15-16, 2015 55 / 155

Software to implement MICE procedure
SAS and stand-alone: IVEWare
Stata: mi suite of commands (mi impute chained), ice
R/Splus: mice, mi
IVEWare used to create multiple imputations of National HealthInterview Survey (NHIS) for public-use
Liz Stuart (JHSPH (330.616)) Missing data June 15-16, 2015 56 / 155

Steps to implementing MI methods
1 Examine rates and patterns of missingness, and any predictors ofmissingness
2 Generate imputations
3 Diagnose and assess imputations
4 Analysis
See Azur et al. (2011) for a tutorial; also some great websites available(links given later)
Liz Stuart (JHSPH (330.616)) Missing data June 15-16, 2015 57 / 155

Motivating example: The CMHI Evaluation
Goal: Develop service systems to provide comprehensive mentalhealth services to children and their families
Since 1993, the Center for Mental Health Initiatives (CMHI) hasfunded 126 grantees and served over 83,000 children
Monitoring data available
9,186 youthIn 45 sites396 variables to be imputed (demographics, behavior, substance use,delinquency, etc.)
But lots of missingness
Data will be imputed and then publicly released, for potentially broad(and diverse) use
Stuart et al. (2009)
Liz Stuart (JHSPH (330.616)) Missing data June 15-16, 2015 58 / 155

Step 1: Rates of missingness in CMHI data
High rates of missingness for some variables
Variable % MissingDate of birth 1.7Sex 1.7Race 10.8Family income 11.9DSM-IV diagnoses 23.8% of day in special ed 40.0
Also varies across sites
Liz Stuart (JHSPH (330.616)) Missing data June 15-16, 2015 59 / 155

Missingness depends on observed characteristics
Not MCAR
Also varies a lot across sites
Don’t have reason to think missingness is NMAR so comfortable withMAR
Liz Stuart (JHSPH (330.616)) Missing data June 15-16, 2015 60 / 155

Step 2: Generate imputations
Need to specify model for each variable, conditional on all othervariables
Check to see if transformations make sense (e.g., to look morenormally distributed; see White et al., 2011 for examples)
If non-normal, can also use predictive mean matching (White et al.,2011)
With so many variables, can’t possibly do careful model selection foreach one; some packages will do stepwise selection
Liz Stuart (JHSPH (330.616)) Missing data June 15-16, 2015 61 / 155

What variables should be included?
Any variables that will be used in subsequent analyses
Otherwise its associations with other variables will be attenuated inanalyses
Any higher-order effects that are of interest in the analysis phase
Any other special features of the data (e.g., survey weights)
If have a categorical variable (like race) should keep it as categoricaland impute that way, rather than breaking it into individual dummyvariables before the imputation
That said, can’t make the models too big or may run intoconvergence problems
Note: Don’t need to specify which are dependent vs. independent
Liz Stuart (JHSPH (330.616)) Missing data June 15-16, 2015 62 / 155

Auxiliary variables
Can be very beneficial to include “auxiliary variables:” not of interestin the analysis in and of themselves, but might help with theimputations
Collins et al. (2003) show that not much cost to including these extravariables and they can help a lot
Including a lot of variables can also make MAR assumption morereasonable
(No easy way to incorporate this extra information in maximumlikelihood approaches; see Enders (2010; Chapter 5))
Liz Stuart (JHSPH (330.616)) Missing data June 15-16, 2015 63 / 155

Interactions and non-linear terms
Any interaction or non-linear terms (e.g., X 2) that will be in theanalysis need to also be included in the imputation model
Treat them as “just another variable” (White, Royston, and Wood):create a variable that is the interaction term or X 2 to use in theimputation process
For interactions with binary or group variables, could also imputeeach group separately (e.g., male/female or race groups); this allowsall possible interactions
In Stata, can use “by()” option
Liz Stuart (JHSPH (330.616)) Missing data June 15-16, 2015 64 / 155

Imputation and analysis compatibility
Imputation model should be more general (“bigger”) than analysismodel that will be used: otherwise risk finding null effects simplybecause data imputed assuming no relationship between variables
Imputation model may need to explicitly set some relationships to 0
Basically, include all variables and associations of interest in theanalyses
Difficult to include too many interactions in models; limits theanalyses that can be done
Also termed “congeniality”
Liz Stuart (JHSPH (330.616)) Missing data June 15-16, 2015 65 / 155

Model specification
IVEWare and ice in Stata allow the use of stepwise selection to selectthe imputation model for each variable
mi ice gives a wrapper to use ice within the mi suite of commands(http://www.stata.com/support/faqs/statistics/mi-versus-ice-and-mim/)
Uses some criteria (e.g., # of predictors, minimum marginal R2)
Smaller minimum marginal R2 will lead to more variables beingincluded
CMHI: Used minimum additional R2 = 0.01 (also did sensitivityanalysis trying 0.005)
Not all packages have this feature
By default, mice (R) and ice (Stata) use all variables as predictors forall other variablesCan also specify particular models (see documentation)May have convergence problems if try to run with all predictorsincluded; stepwise often more feasible computationally
Liz Stuart (JHSPH (330.616)) Missing data June 15-16, 2015 66 / 155
Bounds
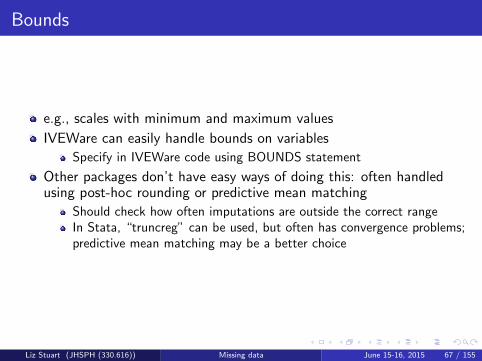
e.g., scales with minimum and maximum values
IVEWare can easily handle bounds on variables
Specify in IVEWare code using BOUNDS statement
Other packages don’t have easy ways of doing this: often handledusing post-hoc rounding or predictive mean matching
Should check how often imputations are outside the correct rangeIn Stata, “truncreg” can be used, but often has convergence problems;predictive mean matching may be a better choice
Liz Stuart (JHSPH (330.616)) Missing data June 15-16, 2015 67 / 155

Restrictions
IVEWare can also handle variables that are only defined for a subsetof the sample
e.g., instruments only given to children above a certain age
e.g., skip patterns, where only children who endorse a particularquestion are asked follow-up questions
e.g., “How many days did you drink alcohol in past 30 days?” onlyasked of those who said they had drunk any alcohol in the past 30 days
Specify in IVEWare using RESTRICT command
Will give a fake value for individuals for whom the value is meaninglessImportant to recognize this in imputed datasets: set values back tomissing, to avoid confusion
Liz Stuart (JHSPH (330.616)) Missing data June 15-16, 2015 68 / 155

Questions to address in CMHI example
How big/inclusive to make the models?
CMHI: Tried a few minimum R2 values to assess sensitivityCouldn’t include too many predictorsDid include interactions of primary interest (e.g., race*gender)
Force some variables into the models?
e.g., siteCMHI: didn’t force any; let data decide which site indicators to include
CMHI: In end, about 6 predictors included in each model
Liz Stuart (JHSPH (330.616)) Missing data June 15-16, 2015 69 / 155
How many imputations to generate?
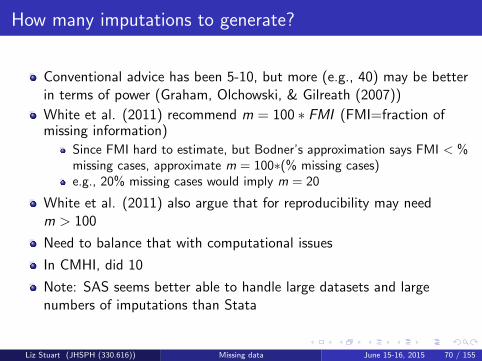
Conventional advice has been 5-10, but more (e.g., 40) may be betterin terms of power (Graham, Olchowski, & Gilreath (2007))
White et al. (2011) recommend m = 100 ∗ FMI (FMI=fraction ofmissing information)
Since FMI hard to estimate, but Bodner’s approximation says FMI < %missing cases, approximate m = 100∗(% missing cases)e.g., 20% missing cases would imply m = 20
White et al. (2011) also argue that for reproducibility may needm > 100
Need to balance that with computational issues
In CMHI, did 10
Note: SAS seems better able to handle large datasets and largenumbers of imputations than Stata
Liz Stuart (JHSPH (330.616)) Missing data June 15-16, 2015 70 / 155

Stata’s mcerr option
From https://www.ssc.wisc.edu/sscc/pubs/stata mi estimate.htm
“mcerr” option in “mi estimate” command will give an estimate ofthe Monte Carlo error in estimation results
Leaves out one imputation at a time
White, Royston, and Wood guidelines:1 The Monte Carlo error of a coefficient should be less than or equal to
10% of its standard error2 The Monte Carlo error of a coefficient’s T-statistic should be less than
or equal to 0.13 The Monte Carlo error of a coefficient’s P-value should be less than or
equal to 0.01 if the true P-value is 0.05, or 0.02 if the true P-value is0.1
If those conditions are not met, you should increase the number ofimputations.
Liz Stuart (JHSPH (330.616)) Missing data June 15-16, 2015 71 / 155

Step 3: Diagnosing and assessing imputations
With so many variables, it is hard to carefully check each model todetermine that it is reasonable
Try to identify potentially problematic variables
Two types of comparisons:
Before and after imputationAcross two imputation sets with slightly different settings (e.g.,different criteria in the stepwise model)
Standard packages have very limited diagnostics
Note: Differences don’t mean something is wrong! Could be becauseof differences in the types of people with observed vs. missing data
Liz Stuart (JHSPH (330.616)) Missing data June 15-16, 2015 72 / 155

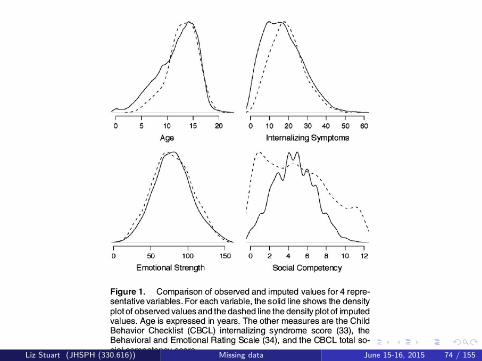
Graphical summaries
Bivariate scatterplots of observed and imputed values
Residual plots, for observed and imputed values
Density plots of observed and imputed values
Example from Stuart et al. (2009); Figure 1
Liz Stuart (JHSPH (330.616)) Missing data June 15-16, 2015 73 / 155
Liz Stuart (JHSPH (330.616)) Missing data June 15-16, 2015 74 / 155
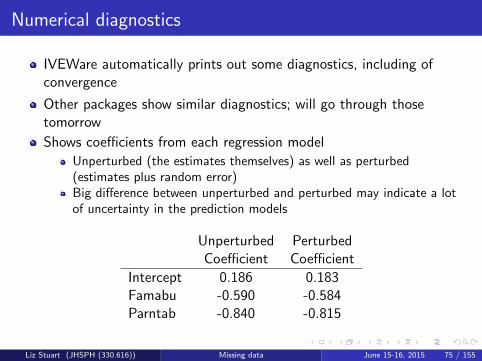
Numerical diagnostics
IVEWare automatically prints out some diagnostics, including ofconvergence
Other packages show similar diagnostics; will go through thosetomorrow
Shows coefficients from each regression model
Unperturbed (the estimates themselves) as well as perturbed(estimates plus random error)Big difference between unperturbed and perturbed may indicate a lotof uncertainty in the prediction models
Unperturbed PerturbedCoefficient Coefficient
Intercept 0.186 0.183Famabu -0.590 -0.584Parntab -0.840 -0.815
Liz Stuart (JHSPH (330.616)) Missing data June 15-16, 2015 75 / 155
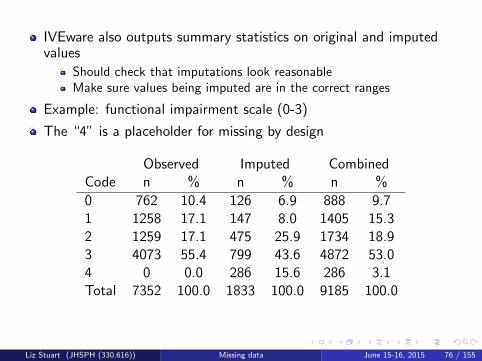
IVEware also outputs summary statistics on original and imputedvalues
Should check that imputations look reasonableMake sure values being imputed are in the correct ranges
Example: functional impairment scale (0-3)
The “4” is a placeholder for missing by design
Observed Imputed CombinedCode n % n % n %
0 762 10.4 126 6.9 888 9.71 1258 17.1 147 8.0 1405 15.32 1259 17.1 475 25.9 1734 18.93 4073 55.4 799 43.6 4872 53.04 0 0.0 286 15.6 286 3.1Total 7352 100.0 1833 100.0 9185 100.0
Liz Stuart (JHSPH (330.616)) Missing data June 15-16, 2015 76 / 155
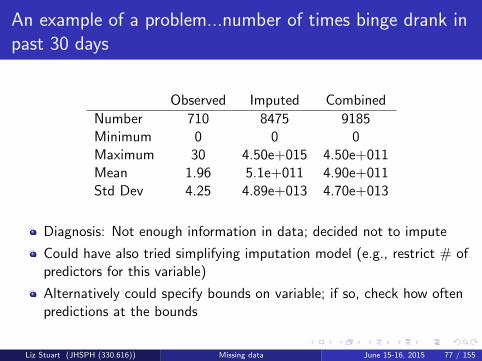
An example of a problem...number of times binge drank inpast 30 days
Observed Imputed Combined
Number 710 8475 9185Minimum 0 0 0Maximum 30 4.50e+015 4.50e+011Mean 1.96 5.1e+011 4.90e+011Std Dev 4.25 4.89e+013 4.70e+013
Diagnosis: Not enough information in data; decided not to impute
Could have also tried simplifying imputation model (e.g., restrict # ofpredictors for this variable)
Alternatively could specify bounds on variable; if so, check how oftenpredictions at the bounds
Liz Stuart (JHSPH (330.616)) Missing data June 15-16, 2015 77 / 155

In the CMHI data...
Results looked better than expected
Not very many problematic variables
Each site generally had a problem with < 5% of the variables
Each variable generally had a problem with < 2% of the sites
Some variables and sites more problematic
e.g., Race imputations for Vermont site
Most difficult variables: rare outcomes and those that are conditionalon others
Liz Stuart (JHSPH (330.616)) Missing data June 15-16, 2015 78 / 155

Some differences between imputations and observed values
Variable Rate among Rate among Significanceimputations observed values (p-value)
American Indian 18.3 6.3 *** (.000)Caucasian 49.5 61.0 *** (.000)Conduct disorder 15.8 8.9 *** (.000)Eligible for Medicaid 74.5 69.2 *** (.000)Has ADHD 36.3 42.0 *** (.000)Parental history of psych hosp 38.9 42.3 ** (.050)Convicted of a crime 38.5 33.0 ** (.046)% of day in special ed 35.3 36.4 (.761)
Note: * Sig at 10% level, ** Sig at 5% level, *** Sig at 1% level
Liz Stuart (JHSPH (330.616)) Missing data June 15-16, 2015 79 / 155

Sensitivity analysis
Also helps to do sensitivity analyses
Change imputation settings slightly, see how different theimputations/final models are
e.g., for CMHI, changed the stepwise selection criteria to includemore variables
Nice if imputations not very sensitive to small changes like that
Liz Stuart (JHSPH (330.616)) Missing data June 15-16, 2015 80 / 155

More advanced diagnostics
Cross-validation approach of imposing random missingness afterimputation; impute again, see how well it recovers values (Gelman,King, and Liu, 1998)
Posterior predictive checks (He et al., 2009)
Compare estimates from the complete data (observed plus imputed) toestimates from simulated data generated solely from the modelsMay help identify parameters for which the imputation was notappropriate
Liz Stuart (JHSPH (330.616)) Missing data June 15-16, 2015 81 / 155

Step 4: Analyses
Combining rules allow the combination of results across the multiplyimputed data sets (Rubin 1987)
Account for both within- and between-imputation variance
Run analysis separately within each “complete” dataset, thencombine across datasets
Software packages have automated version of this for many models
Stata: mim, mifit, micombineSAS: proc mianalyzeHLM: multiple imputation optionsMplus: multiple imputation command
For other models, may need to do it “by hand”
Liz Stuart (JHSPH (330.616)) Missing data June 15-16, 2015 82 / 155

The math behind the combining
Qj = estimate of scalar quantity of interest (e.g., regressioncoefficient) from complete dataset j
Uj = standard error of Qj
Overall estimate just the average of the estimates from each completedataset
Q =1
m
m∑j=1
Qj
Liz Stuart (JHSPH (330.616)) Missing data June 15-16, 2015 83 / 155
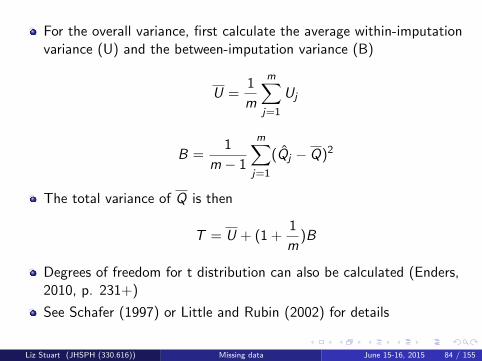
For the overall variance, first calculate the average within-imputationvariance (U) and the between-imputation variance (B)
U =1
m
m∑j=1
Uj
B =1
m − 1
m∑j=1
(Qj − Q)2
The total variance of Q is then
T = U + (1 +1
m)B
Degrees of freedom for t distribution can also be calculated (Enders,2010, p. 231+)
See Schafer (1997) or Little and Rubin (2002) for details
Liz Stuart (JHSPH (330.616)) Missing data June 15-16, 2015 84 / 155
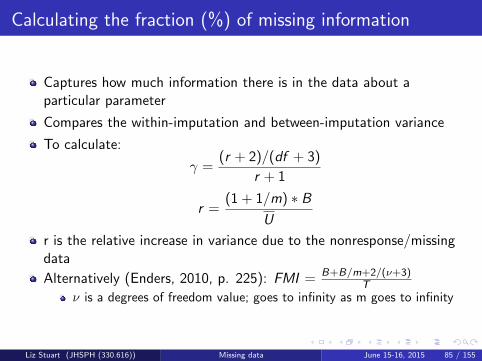
Calculating the fraction (%) of missing information
Captures how much information there is in the data about aparticular parameter
Compares the within-imputation and between-imputation variance
To calculate:
γ =(r + 2)/(df + 3)
r + 1
r =(1 + 1/m) ∗ B
U
r is the relative increase in variance due to the nonresponse/missingdata
Alternatively (Enders, 2010, p. 225): FMI = B+B/m+2/(ν+3)T
ν is a degrees of freedom value; goes to infinity as m goes to infinity
Liz Stuart (JHSPH (330.616)) Missing data June 15-16, 2015 85 / 155

FMI will typically be lower than % of missing values because ofcorrelations in the data
Quantifies influence of missing data on the standard errors
Also can be used as diagnostic: should pay more attention tovariables that have high FMI when doing imputation diagnostics
Liz Stuart (JHSPH (330.616)) Missing data June 15-16, 2015 86 / 155

Example: mim command in Stata
mim: logit dsmmood sex age
Multiple-imputation estimates (logit) Imputations = 10
Logistic regression Minimum obs = 9185
Minimum dof = 4.8
--------------------------------------------------------------------------
dsmmood| Coef. Std. Err. t P>|t| [95% Conf. Int.] MI.df
-------------+------------------------------------------------------------
sex| .470223 .060136 7.82 0.000 0.346444 0.594003 25.3
age| .099599 .019677 5.06 0.004 0.04845 0.150748 4.8
cons|-2.05873 .257295 -8.00 0.001 -2.72791 -1.38954 4.8
--------------------------------------------------------------------------
Liz Stuart (JHSPH (330.616)) Missing data June 15-16, 2015 87 / 155

Post-imputation results make more sense (Stuart et al.2009; Table 2)
Liz Stuart (JHSPH (330.616)) Missing data June 15-16, 2015 88 / 155

Differences pre- and post-imputation
Results sometimes will, sometimes won’t differ if comparecomplete-case analyses with analyses after MI
Won’t know until you try whether or not it will matter!Of course will depend on % of missingness, as well as on the missingdata mechanisms
MI results should be preferred
Liz Stuart (JHSPH (330.616)) Missing data June 15-16, 2015 89 / 155

Some quantities cannot be easily combined using Rubin’srules
Likelihood ratio tests hard to combine; better to use Wald tests withmultiply imputed data (White et al., 2011)
Stata’s mi package can combine subsets of coefficients or linear ornonlinear hypotheses (mi test, mi testtransform, mim: testparm)See code here for combining likelihood ratio tests:http://www.stefvanbuuren.nl/publications/MICE%20V1.0%20Manual%20TNO00038%202000.pdf
If model you are running not part of standard combining software, canjust send point estimates and variances to a few functions
e.g., R: mitools, Stata: mi estimate (option cmdok)
Combining R2 values:http://www.ats.ucla.edu/stat/stata/faq/mi r squared.htm
Combining rules assume normality so some parameters work betterwhen transformed (Enders, 2010, p. 220+); e.g., correlationcoefficient
Liz Stuart (JHSPH (330.616)) Missing data June 15-16, 2015 90 / 155

White et al. (2011), Table VIII
Liz Stuart (JHSPH (330.616)) Missing data June 15-16, 2015 91 / 155
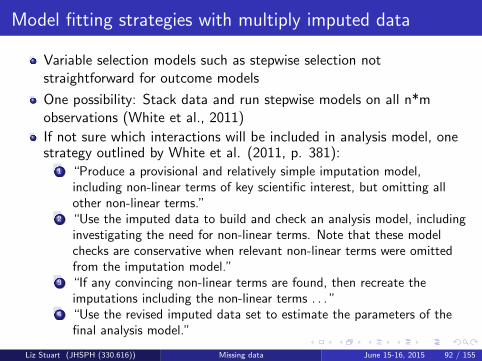
Model fitting strategies with multiply imputed data
Variable selection models such as stepwise selection notstraightforward for outcome models
One possibility: Stack data and run stepwise models on all n*mobservations (White et al., 2011)
If not sure which interactions will be included in analysis model, onestrategy outlined by White et al. (2011, p. 381):
1 “Produce a provisional and relatively simple imputation model,including non-linear terms of key scientific interest, but omitting allother non-linear terms.”
2 “Use the imputed data to build and check an analysis model, includinginvestigating the need for non-linear terms. Note that these modelchecks are conservative when relevant non-linear terms were omittedfrom the imputation model.”
3 “If any convincing non-linear terms are found, then recreate theimputations including the non-linear terms . . . ”
4 “Use the revised imputed data set to estimate the parameters of thefinal analysis model.”
Liz Stuart (JHSPH (330.616)) Missing data June 15-16, 2015 92 / 155

Outline
1 Introduction and terminologyUnderstanding types of missingness
2 Ways of handling missing data(Generally) improper ways of handling missing data...Better ways of dealing with missing data...
3 Implementing multiple imputation
4 What if you think your data is NMAR?
5 Data complications and FAQ’s
6 Conclusions
7 SoftwareIllustrative dataset
8 References
Liz Stuart (JHSPH (330.616)) Missing data June 15-16, 2015 93 / 155

Sometimes MAR is not a reasonable assumption
If missingness related to unobserved variables, data is really NMAR
i.e., people who are the same on observed characteristics but someare missing and some are not missing may have different values of themissing values
e.g., substance abuse treatment studies, where those with most usealso most likely to drop out of study
e.g., depression treatment studies, where those who we can’t find atfollow-up may be more (or less) depressed than those who don’t
Liz Stuart (JHSPH (330.616)) Missing data June 15-16, 2015 94 / 155
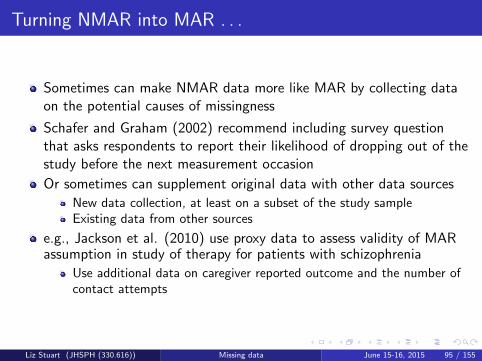
Turning NMAR into MAR . . .
Sometimes can make NMAR data more like MAR by collecting dataon the potential causes of missingness
Schafer and Graham (2002) recommend including survey questionthat asks respondents to report their likelihood of dropping out of thestudy before the next measurement occasion
Or sometimes can supplement original data with other data sources
New data collection, at least on a subset of the study sampleExisting data from other sources
e.g., Jackson et al. (2010) use proxy data to assess validity of MARassumption in study of therapy for patients with schizophrenia
Use additional data on caregiver reported outcome and the number ofcontact attempts
Liz Stuart (JHSPH (330.616)) Missing data June 15-16, 2015 95 / 155

Strategies for dealing with NMAR data
Include beliefs about NMAR structure in imputations
Impute under MAR, then add a constant to the imputed values toacknowledge fact that true values may be higher (or lower) than whatis predicted under MAR; repeat this for various sizes of the constantand assess sensitivity of results (Enders 2010, Section 10.2)Non-ignorable approximate Bayesian bootstrap (see below . . . )
Model the missingness: Allow for relationship between missing valuesand the missingness indicator (e.g., a joint model of missingness andthe data: p(Y,R); Enders (2011), Enders (2010, Chapter 10))
Selection models: Combine substantive analysis with model predictingresponse probabilitiesPattern mixture models: Estimates substantive analyses separatelywithin groups defined by missing data patterns
Note: None of these solutions really solve the problem in the sensethat they all rely on models and untestable assumptions. Beststrategy might be to try a few.
Liz Stuart (JHSPH (330.616)) Missing data June 15-16, 2015 96 / 155
Can also set up as sensitivity analysis
Impute assuming MAR, and then specify sensitivity parameters to seehow much they would change results
Sensitivity parameter characterizes difference in variable betweenthose with missing and non-missing values
Obtain new adjusted results
sensMICE package works with mice for R:http://lertim.fr/Members/rgiorgi/DossierPublic/fonctions-r-s/
Liz Stuart (JHSPH (330.616)) Missing data June 15-16, 2015 97 / 155

Resseguier et al. (2011); Table
Liz Stuart (JHSPH (330.616)) Missing data June 15-16, 2015 98 / 155
SAMON software
www.missingdatamatters.org [Dan Scharfstein and others; accountrequired to download software]
Global sensitivity analysis to determining at what point results froman RCT would change given NMAR missingness on outcomes
For monotone missingness, where people drop out of the study overtime
http://www.biostat.jhsph.edu/∼dscharf/missingdatamatters/samon 1.0 userDoc.pdf
Liz Stuart (JHSPH (330.616)) Missing data June 15-16, 2015 99 / 155

Creating imputations under a NMAR assumption
Siddique and Belin (2008): “non-ignorable approximate Bayesianbootstrap” (ABB)
Main idea: Use hot deck/predictive mean matching procedure, butvary probabilities of selection of each subject based on their outcome
e.g., draw high values with higher probability (see next slide)
Recommend using a different ABB for each imputed data set; resultswill then average over possible missing data mechanisms(acknowledges the uncertainty in the missing data mechanism)
Motivating example: depression treatment intervention study
Liz Stuart (JHSPH (330.616)) Missing data June 15-16, 2015 100 / 155

Siddique and Belin (2008), Figure 1
Liz Stuart (JHSPH (330.616)) Missing data June 15-16, 2015 101 / 155

Selection models
p(Y ,R) = p(R|Y )p(Y )
Two part model1 substantive regression model2 response model
Allows for correlation in the errors of the two models: this is whatrelaxes MAR
Relies on multivariate normality; can be sensitive to model form,variables included, etc.
Heckman (1976, 1979)
Liz Stuart (JHSPH (330.616)) Missing data June 15-16, 2015 102 / 155

Pattern mixture models
p(Y ,R) = p(Y |R)p(R)
Estimates model separately within groups defined by missing datapatterns
Often requires smoothing across those groups: not enough data toreally estimate separate models in each group
A simplified description is that model includes parameters formissingness (e.g., missing data indicators)
Relies on unestimable parameters
Hedeker and Gibbons (1997)
Liz Stuart (JHSPH (330.616)) Missing data June 15-16, 2015 103 / 155

Outline
1 Introduction and terminologyUnderstanding types of missingness
2 Ways of handling missing data(Generally) improper ways of handling missing data...Better ways of dealing with missing data...
3 Implementing multiple imputation
4 What if you think your data is NMAR?
5 Data complications and FAQ’s
6 Conclusions
7 SoftwareIllustrative dataset
8 References
Liz Stuart (JHSPH (330.616)) Missing data June 15-16, 2015 104 / 155

Should I impute a scale or the individual items?
Impute the scale if: (1) over half of the individual items observed ifany are observed, (2) items have high α’s, and (3) the item-totalcorrelations are similar across items (Graham, 2008)
Otherwise (and if have the code to recreate the scales), impute theitems
e.g., in CMHI data the CBCL scale has 113 items....we imputed theoverall scales
e.g., in CMHI data the delinquency scale has 25 items and each ofinterest to researchers...we imputed the individual items
For more options and information, see Enders (2010, Section 9.6)
Liz Stuart (JHSPH (330.616)) Missing data June 15-16, 2015 105 / 155

What about raw or standardized scores?
Assuming you have the ability to recreate the standardized scores...
Impute whichever one looks more normally distributed
e.g., in CMHI data internalizing raw scores looked more normallydistributed than standardized scores so imputed the raw scores
Liz Stuart (JHSPH (330.616)) Missing data June 15-16, 2015 106 / 155
Multilevel or clustered data
Not a lot of guidance on this
If analysis will have only random intercepts, can just include clusterindicators as possible predictors (this done in CMHI data)
If analysis will have random intercepts and slopes (i.e., if going tolook at relationships between variables separately for differentclusters), impute separately within each cluster or includecluster*variable interactions in imputation model (Graham, 2008)
MLWwiN and REALCOM impute macros for imputing multi-leveldata: www.missingdata.org.uk (inc. sample code)
Yucel (2008)
Liz Stuart (JHSPH (330.616)) Missing data June 15-16, 2015 107 / 155

In studies estimating causal effects
Impute covariates and outcomes together, include lots of interactionsbetween treatment status, covariates, and outcomes in imputationmodel (Want to make sure not to impose a treatment effect on theimputations)
Although some people may balk at including outcome in imputationprocess, better to impute them than to leave it out, which wouldassume no treatment effect (Moons et al., 2006; Sterne et al., 2009)
That said . . . some recommendation to include only those withobserved treatment and outcome in the outcome analyses (but stilluse the outcome and treatment when creating the imputations)
Using imputed treatment status and imputed outcomes in analyses mayjust add noise/random error (White et al., 2011)
Liz Stuart (JHSPH (330.616)) Missing data June 15-16, 2015 108 / 155

Longitudinal data
Makes sense to convert data into “wide” format so observed timepoints can be used to help impute missing time points
In Stata: “mi reshape” can be used to help convert the imputed databack into long format
Liz Stuart (JHSPH (330.616)) Missing data June 15-16, 2015 109 / 155

Survey data
In general, want to incorporate information about the survey design(e.g., strata, PSU) in the imputation if possible
May capture relevant information about individuals
Can sometimes run weighted imputation models
But at a minimum can also include the weight and other surveydesign variables in the imputation model (as predictors)
In Stata, can run “mi estimate: svy: COMMAND” to run models onsurvey data that has been imputed
For creating imputations, “svy” cannot be used with “mi imputechained” (can use weights by specifying [pweight=weight])
So run weighted models, and include strata or PSU variables aspredictors in the imputation model
Liz Stuart (JHSPH (330.616)) Missing data June 15-16, 2015 110 / 155

FAQ’s
Isn’t imputation “making up” data?
No! It is creating our best guesses at the missing valuesIn fact non-imputation methods (e.g., complete case analysis) generallyrely on much stronger assumptionsAlso important to note that we aren’t assuming that we are imputingthe correct values...generating the imputations only as an intermediatestep to estimating the model parameters of real interest
What if the imputation model is wrong?
Usually it’s fine; most results indicate that MI still works well even ifthe imputation models are not correct (Schafer 1997)Can help the situation by, for example, taking logs to make data morenormally distributed when using linear regression
Liz Stuart (JHSPH (330.616)) Missing data June 15-16, 2015 111 / 155

Are there guidelines for how much missingness is “too much”?
Unfortunately, noAnd remember that if there is not good information in the data to doimputations (i.e., not much that is predictive of the missing values), MIwill take that into account by making the imputations very variableGood results have been found with over 40% missingnessKey quantity is the fraction of missing information (Schafer 1997),which combines the % missing with how correlated the missing variableis with observed values
What is “planned missingness”? (Enders 2010, p. 21+)
Study design where purposefully only select data from some individualsSimple example: Instead of asking everyone all 100 questions, askeveryone 50 questions and randomly select half to get the other 20 andhalf to get the other 30Known to be missing at random (by design)Can help save resourcesUseful for long surveys and longitudinal designs (follow up a subset ateach time point)
Liz Stuart (JHSPH (330.616)) Missing data June 15-16, 2015 112 / 155

Should I include variables that are predictive of the missingness orpredictive of the missing values?
Ideally would be inclusive and include any variables that may be relatedto the missingness AND/OR the values themselvesIf can’t do that (e.g., small samples), better to include variablespredictive of the missing values
What should I do if some analysis I want to do isn’t covered by any ofthe existing packages that analyze multiply imputed data?
If just exploratory (e.g., regression diagnostics, graphics), run it on 2-3of the imputed datasets separately and see how consistent the resultsare. If results consistent, just go with them. If not consistent, rethinkimputations: why are they so variable?If want to actually estimate models, will need to write code to do thecombining across datasets yourselfThe mitools() package for R gives some examples of this, makes it easyif you can send it coefficient estimates and their associated variances
Liz Stuart (JHSPH (330.616)) Missing data June 15-16, 2015 113 / 155

Outline
1 Introduction and terminologyUnderstanding types of missingness
2 Ways of handling missing data(Generally) improper ways of handling missing data...Better ways of dealing with missing data...
3 Implementing multiple imputation
4 What if you think your data is NMAR?
5 Data complications and FAQ’s
6 Conclusions
7 SoftwareIllustrative dataset
8 References
Liz Stuart (JHSPH (330.616)) Missing data June 15-16, 2015 114 / 155
National Research Council recommendations
Report on how to handle missing data in clinical trials (Little et al.,2012).
Recommendations:
Continue collecting data on everyone, even those who discontinuetreatmentLimit missing data (see next slide)Do not use complete case analysis or single imputation methods (suchas last observation carried forward)Use approaches such as multiple imputation or maximum likelihoodDo sensitivity analysis to assess robustness to underlying assumptions
Liz Stuart (JHSPH (330.616)) Missing data June 15-16, 2015 115 / 155

Little et al. (2012), Table 1
Liz Stuart (JHSPH (330.616)) Missing data June 15-16, 2015 116 / 155

Little et al. (2012), Table 2
Liz Stuart (JHSPH (330.616)) Missing data June 15-16, 2015 117 / 155
Selecting MI vs. ML (Enders 2010, Section 11.4)
If same variables used in both, both methods should give similarresults and both can yield accurate standard errors and inferences. Infact, asymptotically they are the same (Seaman and White, 2013).But each has advantages . . .
Advantages of MI:
Easy use of auxiliary variablesEasier handling of incomplete predictor variables (MI doesn’t care if avariable is predictor or outcome); some ML methods will still dropcases with missing covariatesBetter for handling missingness on individual items within a scaleMore flexible; can be used for almost any analysisCan also be used in context where imputer and analyst are different(e.g., imputer may have access to more data)
Liz Stuart (JHSPH (330.616)) Missing data June 15-16, 2015 118 / 155

Advantages of ML:
Easier for estimating moderating effectsSEM models: often handle missingness automatically. In contrast,pooling SEM fit indices after MI not straightforwardFewer “procedural ambiguities” and open questions of implementationOften easier to implement than MI
Liz Stuart (JHSPH (330.616)) Missing data June 15-16, 2015 119 / 155

Selecting MI vs. weighting
Advantages of MI:
More flexible, can handle any missing data patternCan use variables in imputation model that are not fully observed(weighting requires predictors of response be fully observed)Generally more efficient (Seaman and White, 2013), because uses moreinformation
Advantages of weighting:
Computationally simple for unit nonresponsePotentially easier to specify the nonresponse model than theimputation model(s)May be easier to see when extrapolating from complete to incompletecases (Seaman and White, 2013); will see large weights
Can also use them together!http://missingdata.lshtm.ac.uk/talks/RSS 2012 04 18 seaman.pdf
Liz Stuart (JHSPH (330.616)) Missing data June 15-16, 2015 120 / 155
Lessons for doing imputation
If rates of missingness low (e.g., 1-2%), consider doing singleimputation (e.g., regression prediction with noise)
Make imputation models very general: lots of terms and interactions(little cost to including lots of potential predictors)
MICE can be a very useful method for dealing with missing data
Compare distributions of data pre- and post-imputation
Determine ways to summarize the results across variables
If others will be using the imputed data, make clear documentation
Specify models used, interactions includedHighlight potentially problematic variables
Liz Stuart (JHSPH (330.616)) Missing data June 15-16, 2015 121 / 155
Overall lessons
Missing data can have serious implications for analyses
Requires making assumptions about the missingness and missingvalues
Best approach: Minimize the amount of missing data up frontInvest substantial resources in following up individuals (e.g., Fumagalliet al., 2013)Design surveys to encourage full responseExplore alternative data sources (e.g., administrative records) asnecessary
Important to have a good understanding of the missing data processWhy were some cases missing?How plausible is MAR? Are we worried about NMAR?Can we collect additional data that will inform about the missingness?e.g., for attrition, can ask in earlier waves about individual’s likelihoodof answering subsequent surveysIs it possible to follow-up a subsample of those who initially did notrespond?
Liz Stuart (JHSPH (330.616)) Missing data June 15-16, 2015 122 / 155

Outline
1 Introduction and terminologyUnderstanding types of missingness
2 Ways of handling missing data(Generally) improper ways of handling missing data...Better ways of dealing with missing data...
3 Implementing multiple imputation
4 What if you think your data is NMAR?
5 Data complications and FAQ’s
6 Conclusions
7 SoftwareIllustrative dataset
8 References
Liz Stuart (JHSPH (330.616)) Missing data June 15-16, 2015 123 / 155

General resources
http://www.stefvanbuuren.nl/mi/Software.html
Code for many packages in Horton and Kleinman (2007)
http://www.math.smith.edu/muchado-appendix.pdf
Liz Stuart (JHSPH (330.616)) Missing data June 15-16, 2015 124 / 155

Software for MICE: R
mi package (Gelman et al., 2015)
http://cran.r-project.org/web/packages/mi/index.htmlhttp://cran.r-project.org/web/packages/mi/vignettes/mi vignette.pdfFor creating and analyzing multiply imputed dataMultiple imputation by chained equations incorporated with predictivemean matchingLots of good diagnosticsAutomatically determines the correct model (e.g., linear vs.multinomial logit)Goal is for the software to handle many complexities automatically (likecollinearity, perfect prediction)
Liz Stuart (JHSPH (330.616)) Missing data June 15-16, 2015 125 / 155

mice package (van Buuren, 2015)
http://cran.r-project.org/web/packages/mice/index.htmlFor creating and analyzing multiply imputed dataMultiple imputation by chained equationsSome good diagnostics, added functionality recentlyCan incorporate bounds, restrictions, passive imputation (variables thatare functions of other variables)See program mice-R.R, output (mice-R.out)
Liz Stuart (JHSPH (330.616)) Missing data June 15-16, 2015 126 / 155

Analyzing MI data in R
mice and mi packages have built in commands
See sample code in R-mi.R and R-mice.R
mitools package (sample code in R-mice.R)
Run imputationList() command to combine the imputed datasets(could be from mice or from another package)Use the with() command to run analysis on each complete dataset inthe imputationList objectUse micombine() command on the results from the with() command toget results pooled across the complete datasetsVery general: Can run as long as you have the estimates and variancesfrom each complete datasethttp://cran.r-project.org/web/packages/mitools/mitools.pdf
Zelig package
Can run almost any modelJust say data=mi(dataset1, dataset2, ...) in the command
Liz Stuart (JHSPH (330.616)) Missing data June 15-16, 2015 127 / 155

Software for MICE: SAS
IVEWare (stand-alone as well)
http://www.isr.umich.edu/src/smp/ive/For creating multiple imputationsMultiple imputation by chained equationsMore details below
proc mi
Uses multivariate normalAs of Version V9.3, can also do MICE
proc mianalyze
http://www.sas.com/rnd/app/papers/mianalyzev802.pdfFor analyzing multiply imputed dataCan be run on data imputed using proc mi or imputed using anotherpackageHorton and Kleinman (2007) appendix shows code for reading multiplyimputed data into SAS and running mianalyze
Liz Stuart (JHSPH (330.616)) Missing data June 15-16, 2015 128 / 155

Software for MICE: Stata
ice
http://ideas.repec.org/c/boc/bocode/s446602.htmlhttp://www.ats.ucla.edu/stat/Stata/library/ice.htmFor creating multiple imputationsMultiple imputation by chained equations enditemizeFor analyzing mi data: micombine, mim, mi estimateStata 11: mi suite of commandsStata 12: mi suite now integrated with ice using “mi impute chained”and “mi ice” commands(Pre-Stata 12, can easily go between ice and mi functions using “miimport ice” and “mi export ice” commands so can use mi’s procedures,like for analyzing MI data)
Liz Stuart (JHSPH (330.616)) Missing data June 15-16, 2015 129 / 155

Using mi commands in Stata
https://www.ssc.wisc.edu/sscc/pubs/stata mi intro.htm
Will walk through sample code (Stata-mi.do)
Liz Stuart (JHSPH (330.616)) Missing data June 15-16, 2015 130 / 155

Key steps in using Stata’s mi suite
1 Set data as mi
2 Register variables (imputed, regular, passive)3 Check the imputation models (can use the “dryrun” option to easily
see the models that will be used)
May need to simplify models until you get them to run
4 Impute!
5 Check convergence
6 Check the imputed values
7 Manage the mi data
8 Run outcome models (“mi estimate”)
Liz Stuart (JHSPH (330.616)) Missing data June 15-16, 2015 131 / 155

Using ice in Stata
To install ice: ssc install ice, replace
Can run ice through the mi suite in two ways:
mi ice wrapper, which runs ice: in Stata, type net fromhttp://www.homepages.ucl.ac.uk/∼ucakjpr/statami impute chained
mi impute chained supports factor variables
mi ice supports stepwise model selection
Sample code at the end of the Stata-mi.do code
Liz Stuart (JHSPH (330.616)) Missing data June 15-16, 2015 132 / 155

Details
[mi] ice cohort sex age income totchild totadu nrace3 nrace5 nrace7totrole bersraw ctotcomr ctotraw cintraw cextraw ytotraw yintrawyextraw i.siteid, clear;
Default is to let each variable be regressed on all other variables
Often run into convergence/collinearity issuesCan also specify particular regression models for each variableNot as feasible as IVEware for large datasets
http://www.ats.ucla.edu/stat/stata/seminars/missing data/mi in stata pt2.htm
http://www.ats.ucla.edu/stat/Stata/library/ice.htm
http://www.stata.com/support/faqs/statistics/mi-versus-ice-and-mim/
Liz Stuart (JHSPH (330.616)) Missing data June 15-16, 2015 133 / 155

Options in ice
Passive imputation: for variables that are a direct function of others(e.g., interactions)
Need to make sure the imputations are consistent with each other“passive” optionpassive(sexxrace1: sex*nrace1 \ sexxrace3: sex*nrace3)
Specify regression model to be used
e.g., default for categorical is multinomial logit (unordered), but whatif want to use ordered logit?“cmd” optioncmd(income:ologit)
Liz Stuart (JHSPH (330.616)) Missing data June 15-16, 2015 134 / 155

Specify predictors in particular regression models
ice doesn’t do stepwise, so what if want to use simpler model (notinclude all variables as predictors)?“eq” optioneq(income: sex cintraw, cextraw: nrace1 nrace2)(Note: of course the models in previous line make no sense; no reasonto do that, but this could be useful to, e.g., exclude certain predictorsfrom particular models)“stepwise” option will run stepwise selection (and can specify particulartypes of stepwise models)
Impute categorical variables as categories, but when predictors useseries of dummy variables
“sub” optionpassive(\ inc1:(income==1) \ inc2:(income==2)) sub(income: inc1inc2)(Assuming just 2 levels of income variable)
Liz Stuart (JHSPH (330.616)) Missing data June 15-16, 2015 135 / 155

Software for SPSS
ftp://public.dhe.ibm.com/software/analytics/spss/documentation/statistics/20.0/en/client/Manuals/IBM SPSS Statistics Algorithms.pdf
http://support.spss.com/ProductsExt/SPSS/ESD/17/Download/User%20Manuals/English/SPSS%20Missing%20Values%2017.0.pdf
Missing values add-on package: Creates imputations and analyzes MIdata
Monotone or MICE approaches
Liz Stuart (JHSPH (330.616)) Missing data June 15-16, 2015 136 / 155
Software for MPlus
From Stef van Buuren’s page(http://www.stefvanbuuren.nl/mi/Software.html):
Mplus Version 6 implements routines to generate, analyze andpool multiply imputed data. Multivariate imputations cancreated under a joint model based on the variance-covariancematrix (default) or by a form of conditional specification. Mplusembeds multiple imputation using an unrestricted imputationmodel that is specified behind the scenes (called H1 imputation).It is possible to specify a custom imputation model inconjunction with the Bayesian estimator (called H0 imputation).
Liz Stuart (JHSPH (330.616)) Missing data June 15-16, 2015 137 / 155

Analyzing MI data in Mplus
Create text file with column list of file names with the multiplyimputed datasets
Reference that file in the “DATA: FILE IS” statement
Specify “IMPUTATION” in the “TYPE” statement
Liz Stuart (JHSPH (330.616)) Missing data June 15-16, 2015 138 / 155

Subset of data from CMHI
Subset of kids from longitudinal follow-up sample (N=9,551)
From 45 sites
Baseline data only
For illustrative use only! A subset of the data to help models runquickly.
Data: sinst-subset.dta, sinst-subset.csv
Liz Stuart (JHSPH (330.616)) Missing data June 15-16, 2015 139 / 155

Variables
Demographics: age,sex, race (nrace3), family income (income), number of kids infamily (totchild), number of adults in family (totadult)
Role scales: total roles (school, home, community) (totrole)
Child Behavior Checklist (CBCL) scales: Total competency raw (ctotcomr), totalproblem (ctotraw), internalizing (cintraw), externalizing (cextraw)
Youth Self Report (YSR) scale: Total problem score (ytotraw)
Liz Stuart (JHSPH (330.616)) Missing data June 15-16, 2015 140 / 155

Sample programs
Stata: Stata-mi.do, Stata-mi.log
R: R-mice.R, R-mice.out, R-mi.R, R-mi.out
IVEWare: iveware-sas.sas
Liz Stuart (JHSPH (330.616)) Missing data June 15-16, 2015 141 / 155

A note on the concordance between packages
The 3 packages to create imputations (IVEware, mice, ice) yieldsomewhat different imputations
Slightly different proceduresIn our example, different variables used because of computinglimitations in R and StataIVEware allowed the use of the largest set of variables
The packages to analyze multiply imputed data (zelig, glm.mids,MIcombine, micombine, mim) generate the same results when giventhe same imputed datasets
This reassuring!(They are all using the same combining rules)
Liz Stuart (JHSPH (330.616)) Missing data June 15-16, 2015 142 / 155

Outline
1 Introduction and terminologyUnderstanding types of missingness
2 Ways of handling missing data(Generally) improper ways of handling missing data...Better ways of dealing with missing data...
3 Implementing multiple imputation
4 What if you think your data is NMAR?
5 Data complications and FAQ’s
6 Conclusions
7 SoftwareIllustrative dataset
8 References
Liz Stuart (JHSPH (330.616)) Missing data June 15-16, 2015 143 / 155

References: General references on missing data
http://missingdata.org.uk/
http://www.stat.psu.edu/∼jls/mifaq.html
http://missingdata.lshtm.ac.uk (esp. “Bibliography” link)
https://www.ssc.wisc.edu/sscc/pubs/stata mi ex.htm
Google group: https://groups.google.com/forum/#!forum/missing-data
Liz Stuart (JHSPH (330.616)) Missing data June 15-16, 2015 144 / 155

Allison, PD. (2002) Missing Data in Quantitative Applications in theSocial Sciences. Thousand Oaks, CA. Sage.
Carpenter, J. (2006). Missing Data Example Analysis [accessedDecember 19, 2006]. Available online athttp://www.lshtm.ac.uk/msu/missingdata/example.html
Little, R.J. et al. (2012). The prevention and treatment of missingdata in clinical trials. New England Journal of Medicine 367(14):1355-1360.
van der Heidjen, G.J.M.G., Donders, A.R.T., Stijnen, T., and Moons,K.G.M. (2006). Imputation of missing values is superior to completecase analysis and the missing-indicator method in multivariablediagnostic research: A clinical example. Journal of ClinicalEpidemiology 59: 1102-1109.
Wadsworth, T., and Roberts, J.M. (2008). When missing data arenot missing: A new approach to evaluating supplemental homicidereport imputation strategies. Criminology 46(4): 841-870.
Liz Stuart (JHSPH (330.616)) Missing data June 15-16, 2015 145 / 155

References: Books
Carpenter, J.R., and Kenward, M.G. (2013). Multiple imputation and itsapplication. Wiley.
Enders, C.K. (2010). Applied missing data analysis. Guilford Press.
Schafer, J.L. (1997) Analysis of Incomplete Multivariate Data. Chapman & Hall,London.
Little, R.J.A. and Rubin, D.B. (2002) Statistical Analysis with Missing Data, 2ndEdition. J. Wiley & Sons, New York.
van Buuren, S. (2012). Flexible Imputation of Missing Data. Chapman &Hall/CRC, Boca Raton, FL.
Liz Stuart (JHSPH (330.616)) Missing data June 15-16, 2015 146 / 155

References: Guidance for dealing with missing data
Carpenter, J. (2006). Annotated Bibliography on Missing Data [accessed July 30,2006]. Available online at http://www.lshtm.ac.uk/msu/missingdata/biblio.html
Carpenter, J.R. and Kenward, M.G. (2007). Missing data in randomised controlledtrials: A practical guide. Final report available athttp://www.pcpoh.bham.ac.uk/publichealth/methodology
/docs/invitations/Final Report RM04 JH17 mk.pdf.
Graham, J.W. (2008). Missing data analysis: Making it work in the real world.Annual Review of Psychology 60(6): 1-28.
Lavori, P. et al. (2008). Missing data in longitudinal clinical trials Part A: Designand Conceptual Issues. Psychiatric Annals 38(12): 784-792.
Schafer, J.L., & Graham, J.W. (2002). Missing data: Our view of the state of theart. Psychological Methods 7(2): 147-177.
Siddique J. et al. (2008). Missing data in longitudinal trials Part B AnalyticIssues. Psychiatric Annals 38(12): 793-801.
Liz Stuart (JHSPH (330.616)) Missing data June 15-16, 2015 147 / 155

References: Statistical basis for MI
Kenward, M.G. and Carpenter, J. (2007). Multiple imputation:Current perspectives. Statistical Methods in Medical Research 16:199-218.
Raghunathan, T.E., Lepkowski, J.M., Van Hoewyk, J., &Solenberger, P. (2001). A multivariate technique for multiplyimputing missing values using a sequence of regression models.Survey Methodology 27: 85-95.
Rubin, D.B. (1976) Inference and missing data. Biometrika, 63,581-592.
Rubin, D.B. (1987) Multiple Imputation for Nonresponse in Surveys.J. Wiley & Sons, New York.
Rubin, D.B. (1996) Multiple imputation after 18+ years (withdiscussion). Journal of the American Statistical Association, 91,473-489.
Liz Stuart (JHSPH (330.616)) Missing data June 15-16, 2015 148 / 155
References: Tutorials and software for implementing MI
www.multiple-imputation.com
MI FAQ’s: http://www.stat.psu.edu/∼jls/mifaq.html
Azur, M., Stuart, E.A., Frangakis, C.M., and Leaf, P.J. (in press). Multipleimputation by chained equations: What is it and how does it work? Forthcomingin International Journal of Methods in Psychiatric Research.
Donders ART, van der Heijden GJMG, Stijnen T, Moons KGM.(2006). Review: Agentle introduction to imputation of missing values. Journal of ClinicalEpidemiology 1087-1091.
Horton, N. & Kleinman, K.P. (2007). Much ado about nothing: A comparison ofmissing data methods and software to fit incomplete data regression models. TheAmerican Statistician 61(1): 79-90. Software appendix:http://www.math.smith.edu/muchado-appendix.pdf
Lunt, M. (2008). A guide to imputing missing data with Stata.http://personalpages.manchester.ac.uk/staff/mark.lunt/mi.html
Liz Stuart (JHSPH (330.616)) Missing data June 15-16, 2015 149 / 155

Raghunathan, T.E., Solenberger, P.W., & Van Hoewyk, J.V. (2002). IVEWare:Imputation and Variance Estimation Software User’s Guide. Ann Arbor, MI:Institute for Social Research, University of Michigan.www.isr.umich.edurs/c/smp/ive/
Schafer, J.L. (1999). Multiple imputation: A primer. Statistical methods inmedical research 8(1): 3-15.
Sterne, J.A.C., et al. (2009). Multiple imputation for missing data inepidemiological and clinical research: potential and pitfalls. British MedicalJournal 338:b2393.
Stuart, E.A., Azur, M., Frangakis, C.E., and Leaf, P. (2009). Multiple imputationwith large datasets: A case study of the Children’s Mental Health Initiative.American Journal of Epidemiology 169(9): 1133-1139.
White, I.R., Royston, P., and Wood, A.M. (2011). Multiple imputation usingchained equations: Issues and guidance for practice. Statistics in Medicine 30:377-399. (Includes Stata code snippets).
Liz Stuart (JHSPH (330.616)) Missing data June 15-16, 2015 150 / 155

References: Survey weighting for nonresponse
Kalton, G., and Flores-Cervantes, I. (2003). Weighting Methods.Journal of Official Statistics, 19, pp. 81-97.
Kalton, G. and Kasprzyk, D. (1986). The Treatment of MissingSurvey Data. Survey Methodology, Vol. 12, No. 1: 1-16.
Oh, H. and Scheuren, F. (1983). Weighting Adjustment for UnitNonresponse. Chap. 13 in vol. 2, part 4 of Incomplete Data inSample Surveys. New York: Academic Press
Seaman, S.R., and White, I.R. (2013). Review of inverse probabilityweighting for dealing with missing data. Statistical Methods inMedical Research 22: 278-295.
Liz Stuart (JHSPH (330.616)) Missing data June 15-16, 2015 151 / 155

References: Not missing at random models
Enders, C.K. (2011). Missing not at random models for latent growthcurve analysis. Psychological Methods 16(1): 1-16.
Jackson, D., White, I.R., and Leese, M. (2010). How much can welearn about missing data? An exploration of a clinical trial inpsychiatry. Journal of the Royal Statistical Society Series A 173(3):593-612.
Resseguier, N., Giorgi, R. & Paoletti, X. (2011). Sensitivity AnalysisWhen Data Are Missing Not-at-random. Epidemiology 22(2): 282.
Siddique, J. and Belin, T.R. (2008). Using an approximate Bayesianbootstrap to multiply impute nonignorable missing data.Computational Statistics and Data Analysis 53: 405-415.
Liz Stuart (JHSPH (330.616)) Missing data June 15-16, 2015 152 / 155

References: Other
Abayomi, K., Gelman, A., & Levy, M. (2008). Diagnostics for multivariateimputations. Applied Statistics 57(3), 273-291.
Allison, P.D. (2005). Imputation of Categorical Variables with PROC MI [accessedJuly 30, 2006]. Available online at http:// www2.sas.com/proceedings/sugi30/113-30.pdf
Carpenter, J., Kenward, M., Evans, S., and White, I. (2004). Last ObservationCarry-Forward and Last Observation Analysis. Statistics in Medicine 23: 32413244.
Collins LM, Schafer JL, Kam CK. (2001). A comparison of inclusive and restrictivestrategies in modern missing-data procedures. Psychological Methods 6(4):330351.
Cook, R. J., Zeng, L., and Yi, G. Y. (2004). Marginal Analysis of IncompleteLongitudinal Binary Data: A Cautionary Note on LOCF Imputation. Biometrics60: 820828.
Dempster, A. P., Laird, N. M., and Rubin, D. B. (1977). Maximum LikelihoodFrom Incomplete Data via theEMAlgorithm. Journal of the Royal StatisticalSociety, Series B 39: 122.
Liz Stuart (JHSPH (330.616)) Missing data June 15-16, 2015 153 / 155

Greenland S and Finkle WD. (1995). A Critical Look at Methods forHandling Missing Covariates in Epidemiologic Regression Analyses.American Journal of Epidemiology 142:1255-64.
Hill, J.L., Waldfogel, J., Brooks-Gunn, J., and Han, W-J. (2005).Maternal employment and child development: A fresh look usingnewer methods. Developmental Psychology 41(6): 833-850.
Vach W and Blettner M. (1991). Biased Estimation of the OddsRatio in Case-Control Studies due to the Use of Ad Hoc Methods ofCorrecting for Missing Values for Confounding Variables. AmericanJournal of Epidemiology 134:895-907.
Liz Stuart (JHSPH (330.616)) Missing data June 15-16, 2015 154 / 155