mirror, mirror on the wall - carleton university...mirror, mirror on the wall: medicare part d pays...
TRANSCRIPT

Mirror, Mirror on the Wall:
Medicare Part D pays needlessly high brand-name drug prices compared
with other OECD countries and with U.S. government programs
By
Marc-André Gagnon, PhD.
Associate Professor, School of Public Policy and Administration, Carleton University
And
Sidney Wolfe, MD.
Founder, Senior Adviser for the Health Research Group, Public Citizen
Policy Brief
July 23 2015
Disclosure: The authors declare that they have no competing interests
Acknowledgments: The authors would like to thank Tanya Potashnik and Orlando Manti for their
help with databases; Walid Gellad, Aaron Kesselheim and Steve Morgan for their help on specific
dimensions of the issue; as well as Karena Volesky for editorial assistance. All remaining errors, if
any, are the authors’ sole responsibility.
Note: This report was updated to correct the name of the U.S. Department of Veterans Affairs
agency whose data was analyzed. It is the Veterans Health Administration.
2
HIGHLIGHTS
1. After including rebates, brand-name drugs cost Medicare Part D 198% of the median
costs for the same brand-name drugs in the 31 OECD countries.
2. Medicare Part D pays on average 73% more than Medicaid and 80% more than the
Veterans Health Administration (VHA) for brand-name drugs.
3. Medicare Part D would save from $15.2 billion to $16 billion a year if it could secure the
same prices that Medicaid or VHA, respectively, receives on the same brand-name
drugs.
4. While Medicaid and VHA often are used as benchmarks because of the rebates or
discounts they secure, even these organizations pay higher prices than many OECD
countries.
5. Under current Medicare Part D pricing, non-innovative “me-too” drugs are priced as
much or more than older, equally effective versions. By currently paying inflated prices
for drugs that do not provide value for money, Medicare Part D artificially increases the
returns and incentives for non-innovative “me-too” drugs to the detriment of new
innovative medicines for unmet needs.
6. Reducing brand-name drug prices would reduce the high level of cost-related non-
adherence (people not filling their prescription for financial reasons) found in Part D, by
reducing beneficiaries’ premiums and co-pays. In addition, since the government pays
for the majority of Medicare Part D, taxpayers’ contribution would decrease by at least
$11 billion every year.
The study concludes with specific recommendations for legislation, including suggestions from
current Medicaid and VHA policies, to lower Medicare Part D prices. This would thereby alleviate
the current de facto rationing that occurs because so many Medicare recipients cannot afford
these inordinately high prices and suffer the health consequences of cost-related non-adherence
to drugs prescribed for them.
3
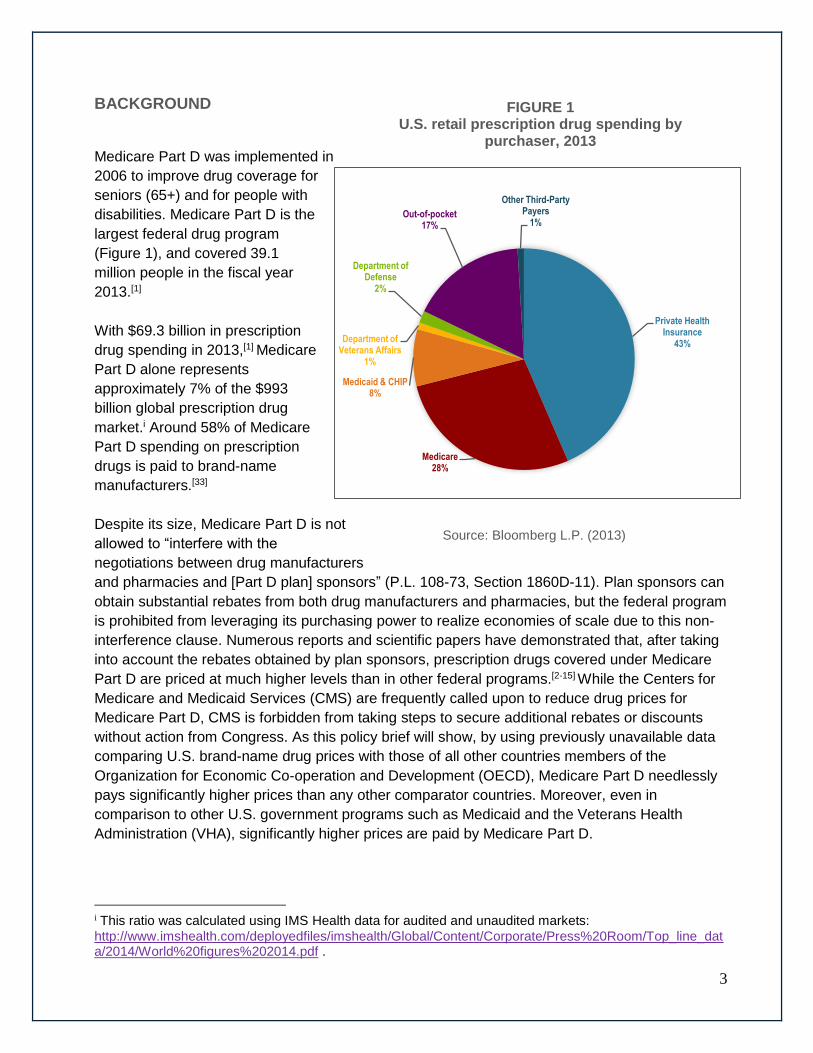
BACKGROUND
Medicare Part D was implemented in
2006 to improve drug coverage for
seniors (65+) and for people with
disabilities. Medicare Part D is the
largest federal drug program
(Figure 1), and covered 39.1
million people in the fiscal year
2013.[1]
With $69.3 billion in prescription
drug spending in 2013,[1] Medicare
Part D alone represents
approximately 7% of the $993
billion global prescription drug
market.i Around 58% of Medicare
Part D spending on prescription
drugs is paid to brand-name
manufacturers.[33]
Despite its size, Medicare Part D is not
allowed to “interfere with the
negotiations between drug manufacturers
and pharmacies and [Part D plan] sponsors” (P.L. 108-73, Section 1860D-11). Plan sponsors can
obtain substantial rebates from both drug manufacturers and pharmacies, but the federal program
is prohibited from leveraging its purchasing power to realize economies of scale due to this non-
interference clause. Numerous reports and scientific papers have demonstrated that, after taking
into account the rebates obtained by plan sponsors, prescription drugs covered under Medicare
Part D are priced at much higher levels than in other federal programs.[2-15] While the Centers for
Medicare and Medicaid Services (CMS) are frequently called upon to reduce drug prices for
Medicare Part D, CMS is forbidden from taking steps to secure additional rebates or discounts
without action from Congress. As this policy brief will show, by using previously unavailable data
comparing U.S. brand-name drug prices with those of all other countries members of the
Organization for Economic Co-operation and Development (OECD), Medicare Part D needlessly
pays significantly higher prices than any other comparator countries. Moreover, even in
comparison to other U.S. government programs such as Medicaid and the Veterans Health
Administration (VHA), significantly higher prices are paid by Medicare Part D.
i This ratio was calculated using IMS Health data for audited and unaudited markets:
http://www.imshealth.com/deployedfiles/imshealth/Global/Content/Corporate/Press%20Room/Top_line_data/2014/World%20figures%202014.pdf .
Private Health Insurance
43%
Medicare28%
Medicaid & CHIP8%
Department of Veterans Affairs
1%
Department of Defense
2%
Out-of-pocket17%
Other Third-Party Payers
1%
FIGURE 1 U.S. retail prescription drug spending by
purchaser, 2013
Source: Bloomberg L.P. (2013)
4
Advocates for price reductions argue that reductions in Part D prices would produce significant
savings for the Medicare program itself and reduce beneficiary premiums, thereby aligning
Medicare Part D with these other programs. Advocates for price reductions often argue that
Medicare Part D was designed less as a system for social protection for the sick than as a system
of corporate welfare for brand-name drug companies.[3,16-17] Price reduction opponents argue that
a rebate policy would be compensated by reduced incentives for manufacturers to offer favorable
rebates to private payers, that it would undermine the competitive system used in Part D and that
it would lead to higher beneficiary premiums. While contending that it would increase costs for
payers, opponents also argue that it would reduce revenue available for private investment in
research and development for new drugs and thereby harm innovation.[18-20]
This policy brief assesses the price reduction issue by:
1. Comparing domestic and international prices for patented drugs;
2. Analyzing price levels for brand-name drugs obtained by different U.S. government
programs;
3. Looking at the correlation between price levels and research and development spending;
and
4. Examining the potential impacts of policy reforms.
ANALYSES
1 – How the United States compares to other countries
The U.S. system for the provision of prescription drugs is characterized by the predominance of
private drug plans. Among all OECD countries, the U.S. ranks last in terms of the proportion of its
population covered by a public drug plan, with the majority of OECD countries having 100% of the
population covered by a public drug plan (Figure 2).
While all other OECD countries provide public coverage for at least three-quarters or, more often,
all of its population, the U.S. and Canada remain anomalies. These two countries rely mostly on
private plans, and they are both characterized by very high drug costs, lack of cost-efficiency,
significant waste, and a large proportion of their populations not being able to fill prescriptions due
to financial reasons.[21] Countries with universal public drug coverage have significantly lower
costs per capita for prescription drugs, and their population has better access to medicines.[22]

5
FIGURE 2
Percentage of the population covered by a public drug insurance plan in all OECD
countries (%), 2013 (or latest year)
(e): estimate
Source: OECD Health Data: Social Protection (Extracted from OECD iLibrary)
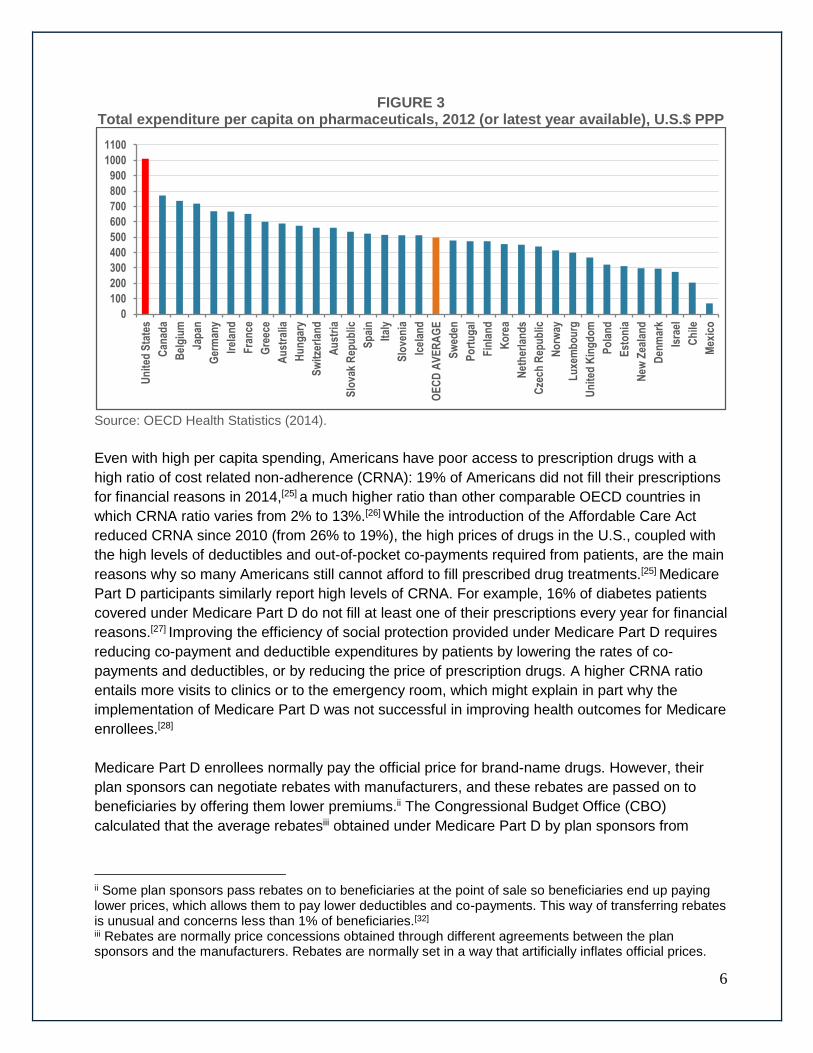
Studies comparing international prices consistently show that average U.S. retail or manufacturer
prices for prescription drugs are much higher than in other OECD countries.[22-24] The U.S. is
characterized by the highest cost per capita for pharmaceuticals among all OECD countries.
Figure 3 shows that U.S. costs per capita for pharmaceuticals ($1,010) are in fact more than twice
as much as the OECD average ($498).
0 10 20 30 40 50 60 70 80 90 100
Australia (e)
Czech Republic
Denmark
Finland
Hungary
Ireland
Israel
Italy
Japan
Korea
New Zealand
Norway
Portugal
Slovenia
Sweden
Switzerland
United Kingdom
Austria
France
Iceland
Netherlands (e)
Belgium
Spain
Turkey
Luxembourg (e)
Slovak Republic
Estonia
Mexico (e)
Poland
Germany
Greece
Canada (e)
United States (e)
6
FIGURE 3 Total expenditure per capita on pharmaceuticals, 2012 (or latest year available), U.S.$ PPP
Source: OECD Health Statistics (2014).
Even with high per capita spending, Americans have poor access to prescription drugs with a
high ratio of cost related non-adherence (CRNA): 19% of Americans did not fill their prescriptions
for financial reasons in 2014,[25] a much higher ratio than other comparable OECD countries in
which CRNA ratio varies from 2% to 13%.[26] While the introduction of the Affordable Care Act
reduced CRNA since 2010 (from 26% to 19%), the high prices of drugs in the U.S., coupled with
the high levels of deductibles and out-of-pocket co-payments required from patients, are the main
reasons why so many Americans still cannot afford to fill prescribed drug treatments.[25] Medicare
Part D participants similarly report high levels of CRNA. For example, 16% of diabetes patients
covered under Medicare Part D do not fill at least one of their prescriptions every year for financial
reasons.[27] Improving the efficiency of social protection provided under Medicare Part D requires
reducing co-payment and deductible expenditures by patients by lowering the rates of co-
payments and deductibles, or by reducing the price of prescription drugs. A higher CRNA ratio
entails more visits to clinics or to the emergency room, which might explain in part why the
implementation of Medicare Part D was not successful in improving health outcomes for Medicare
enrollees.[28]
Medicare Part D enrollees normally pay the official price for brand-name drugs. However, their
plan sponsors can negotiate rebates with manufacturers, and these rebates are passed on to
beneficiaries by offering them lower premiums.ii The Congressional Budget Office (CBO)
calculated that the average rebatesiii obtained under Medicare Part D by plan sponsors from
ii Some plan sponsors pass rebates on to beneficiaries at the point of sale so beneficiaries end up paying lower prices, which allows them to pay lower deductibles and co-payments. This way of transferring rebates is unusual and concerns less than 1% of beneficiaries.[32] iii Rebates are normally price concessions obtained through different agreements between the plan sponsors and the manufacturers. Rebates are normally set in a way that artificially inflates official prices.
0
100
200
300
400
500
600
700
800
900
1000
1100U
nit
ed S
tate
s
Can
ada
Bel
giu
m
Jap
an
Ger
man
y
Irel
and
Fra
nce
Gre
ece
Au
stra
lia
Hu
ng
ary
Sw
itze
rlan
d
Au
stri
a
Slo
vak
Rep
ub
lic
Sp
ain
Ital
y
Slo
ven
ia
Icel
and
OE
CD
AV
ER
AG
E
Sw
eden
Po
rtu
gal
Fin
lan
d
Ko
rea
Net
her
lan
ds
Cze
ch R
epu
blic
No
rway
Lu
xem
bo
urg
Un
ited
Kin
gd
om
Po
lan
d
Est
on
ia
New
Zea
lan
d
Den
mar
k
Isra
el
Ch
ile
Mex
ico
7
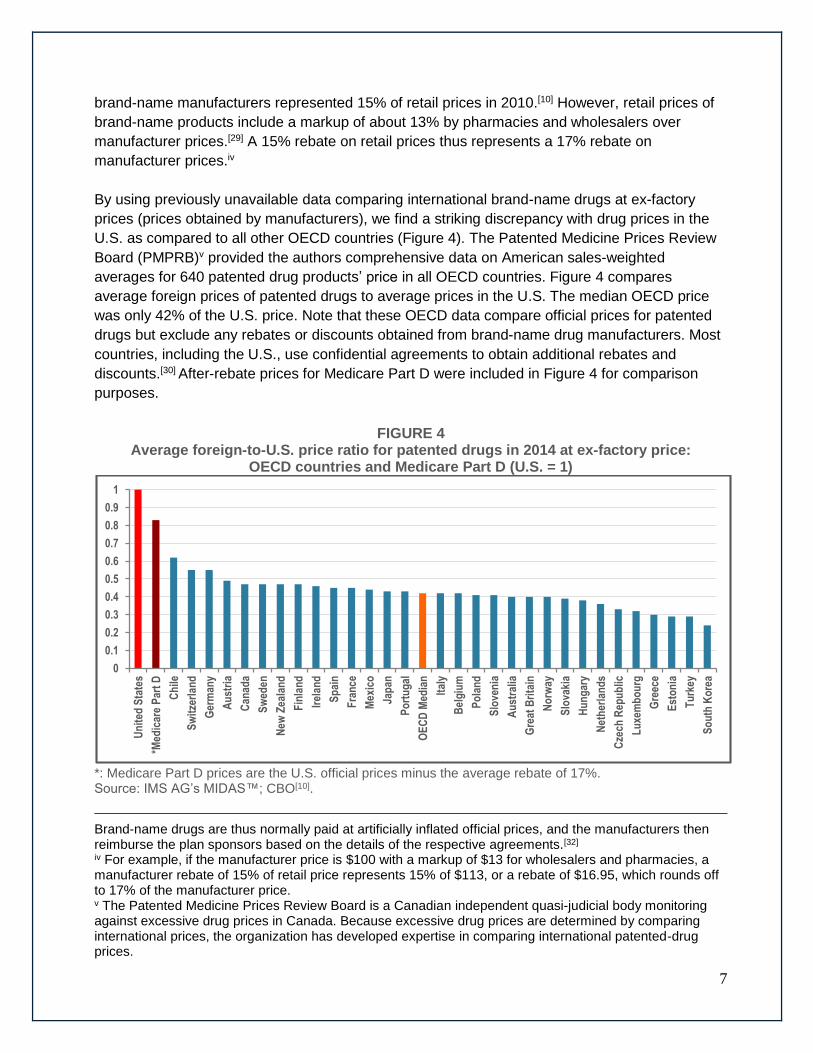
brand-name manufacturers represented 15% of retail prices in 2010.[10] However, retail prices of
brand-name products include a markup of about 13% by pharmacies and wholesalers over
manufacturer prices.[29] A 15% rebate on retail prices thus represents a 17% rebate on
manufacturer prices.iv
By using previously unavailable data comparing international brand-name drugs at ex-factory
prices (prices obtained by manufacturers), we find a striking discrepancy with drug prices in the
U.S. as compared to all other OECD countries (Figure 4). The Patented Medicine Prices Review
Board (PMPRB)v provided the authors comprehensive data on American sales-weighted
averages for 640 patented drug products’ price in all OECD countries. Figure 4 compares
average foreign prices of patented drugs to average prices in the U.S. The median OECD price
was only 42% of the U.S. price. Note that these OECD data compare official prices for patented
drugs but exclude any rebates or discounts obtained from brand-name drug manufacturers. Most
countries, including the U.S., use confidential agreements to obtain additional rebates and
discounts.[30] After-rebate prices for Medicare Part D were included in Figure 4 for comparison
purposes.
FIGURE 4 Average foreign-to-U.S. price ratio for patented drugs in 2014 at ex-factory price:
OECD countries and Medicare Part D (U.S. = 1)
*: Medicare Part D prices are the U.S. official prices minus the average rebate of 17%. Source: IMS AG’s MIDAS™; CBO[10].
Brand-name drugs are thus normally paid at artificially inflated official prices, and the manufacturers then reimburse the plan sponsors based on the details of the respective agreements.[32]
iv For example, if the manufacturer price is $100 with a markup of $13 for wholesalers and pharmacies, a manufacturer rebate of 15% of retail price represents 15% of $113, or a rebate of $16.95, which rounds off to 17% of the manufacturer price. v The Patented Medicine Prices Review Board is a Canadian independent quasi-judicial body monitoring against excessive drug prices in Canada. Because excessive drug prices are determined by comparing international prices, the organization has developed expertise in comparing international patented-drug prices.
0
0.1
0.2
0.3
0.4
0.5
0.6
0.7
0.8
0.9
1
Un
ited
Sta
tes
*Med
icar
e P
art
D
Ch
ile
Sw
itze
rlan
d
Ger
man
y
Au
stri
a
Can
ada
Sw
eden
New
Zea
lan
d
Fin
lan
d
Irel
and
Sp
ain
Fra
nce
Mex
ico
Jap
an
Po
rtu
gal
OE
CD
Med
ian
Ital
y
Bel
giu
m
Po
lan
d
Slo
ven
ia
Au
stra
lia
Gre
at B
rita
in
No
rway
Slo
vaki
a
Hu
ng
ary
Net
her
lan
ds
Cze
ch R
epu
blic
Lu
xem
bo
urg
Gre
ece
Est
on
ia
Tu
rkey
So
uth
Ko
rea

8
IMS Health estimates that global off-invoice rebates and discounts represented approximately
25% of global sales growth in recent years.[31] Due to the importance of off-invoice rebates and
discounts and their variations in different countries, any comparison of international drug prices
must be interpreted with caution. However, since Medicare Part D does not benefit from
additional rebates, one can safely conclude that Medicare Part D, as shown in Figure 4, pays at
least twice as much as the OECD median for patented drugs.
While rebates have existed in the U.S. since the 1980s, other OECD countries typically
negotiated or regulated transparent list prices. Since the mid-2000s, however, almost all OECD
countries started obtaining off-invoice rebates depending on their bargaining capacity with brand-
name drug manufacturers. The increasing use of confidential rebates at the global level appears
to be driven largely by manufacturers’ desire to circumvent existing price regulations.[30] Many
countries use external benchmarking (regulation using foreign official prices as an index) to cap
domestic prices. Confidential rebates defuse such regulation by artificially inflating official prices.
In the same way, mandatory rebates set as a percentage of official prices, as is the case in some
programs in the U.S., are rendered inefficient at containing drug prices due to the artificial
accompanying increase of official prices. While rebates are passed on to Medicare Part D
enrollees through lower premiums, artificially inflated prices still result in artificially inflated co-
pays and deductibles for the same enrollees, which induce an increase in CRNA.
2 – How Medicare Part D compares to other U.S. programs
This section compares the rebates received from brand-name manufacturers by Medicare Part D
with both rebates received by Medicaid and discounts for Veterans Health Administration (VHA),
and shows the subsequent average manufacturer price of brand-name prescription drugs in these
three programs.
Medicare Part D
Even though the government Medicare Part D program cannot directly negotiate rebates with
brand-name manufacturers due to the non-interference clause, plan sponsors can, and the
savings are purportedly redistributed to beneficiaries through lower premiums. However, the
Office of Inspector General (OIG) at the Department of Health and Human Services has raised
serious concerns that the rebates are not always passed on to beneficiaries.[32] According to the
OIG, sponsors underestimated the beneficiary rebates in 69% of their bids for plan year 2008,
which resulted in artificially inflated premiums for Medicare Part D enrollees. As mentioned, the
plan sponsors’ rebates obtained under Medicare Part D from brand-name manufacturers
represented 17% of the manufacturers’ price in 2010. This represents a total amount of $6.1
billion in rebates, while a total of $36 billion was paid to brand-name manufacturers during that
year.[33]
9
By design, beneficiaries of Medicare Part D receive different types of rebates depending on
amount of their spending. The basic drug benefits under Medicare Part D in 2014 were as
follows[10]:
1. No coverage for the first $310 per year (no rebate obtained).
2. Coverage for 75% of spending between the deductible and an initial coverage limit of
$2,850 (average rebate of 17% on brand-name drugs).
3. “Doughnut hole”: Limited coverage for generic and brand-name drugs when spending is
between the initial coverage limit and a catastrophic limit on out-of-pocket costs of $4,550.
While in the “doughnut hole”, beneficiaries receive a mandatory discountvi of 50% for
brand-name drugs.
4. Coverage for 95% of spending above the catastrophic limit (average rebate of 17% on
brand-name drugs).
Medicaid
Medicaid benefits from two separate statutory rebates from brand-name manufacturers:[10]
1. The “basic rebate”: Brand-name manufacturers offer a mandatory rebate of at least 23.1%
of the average manufacturer’s price. If the manufacturer offers any “qualified” purchaser
(hospital, mail-order pharmacy, HMO) a rebate in excess of 23.1%, then the rebate
received by Medicaid is increased to match that larger private rebate.
2. The “inflation rebate”: This rebate is imposed if the average manufacturer’s price for a
brand-name drug rises faster than general inflation.
The “inflation rebate” represents more than half of the rebates obtained on brand-name drugs.[11]
Such a rebate seems necessary because many brand-name and generic drugs increase their
prices at a pace significantly higher than inflation.[11,35] In 2010, Medicaid spent $27.4 billion on
prescription drugs including 11.4 billion in rebates[34]. Of the remaining $16 billion, 76% was spent
on brand-name drugs ($12.2 billion), including $1.8 billion (15%) to wholesalers and
pharmacies.[33] In the end, Medicaid paid $10.4 billion to brand-name manufacturers after
benefiting from rebates totaling $11.4 billion.vii Medicaid thereby benefited from rebates of 52%
(11.4 billion / 21.8 billion) on brand-name drugs. Note that while a mandatory “basic rebate” on
official prices can achieve some savings, it also creates an adverse effect by encouraging brand-
name manufacturers to artificially increase the initial official prices of brand-name drugs.[36] The
“inflation rebate” does not produce such an adverse effect because an artificial increase of prices
over inflation would be countered by an automatically greater inflation rebate. However, if the
vi Note that discounts are different from rebates. Rebates are normally reimbursed by manufacturers after the drug was paid at its full price. Discounts are price reductions at the point of sale, which allow buyers not to pay for drugs at their full price. vii Note that the federal rebates totaled $10.4 billion while some states benefited from additional rebates obtained at the state level. Additional rebates by these states totaled $1 billion. It is important, however, to emphasize that only some states obtained additional rebates of various magnitudes and that the analysis of average prices or average rebates masks diversity between states.
10
price rises faster than inflation, the inflation rebates do not compensate beneficiaries on their co-
pays based on inflated drug prices at the point of sale, which might increase CRNA.
Veterans Health Administration (U.S. Department of Veterans Affairs)
VHA utilizes four contracting mechanisms to acquire its prescription drugs at discounted prices:[2]
1. The Federal Supply Schedule (FSS): VHA uses the FSS, which is a catalog of discounted
prices obtained through federal procurement policy. FSS prices for brand-name drugs
must be no greater than the prices manufacturers charge their “most favored customers”
under comparable terms and conditions.
2. Performance-based incentive agreements, or Blanket Purchase Agreements (BPAs): The
most common BPA revolves around market share agreements in which VHA commits to
purchase a specific volume of drugs in exchange for additional discounts.
3. Pricing under the Veterans Health Care Act of 1992 (P.L. 102-585): Under this law,
pharmaceutical manufacturers agree to sell VHA drugs at no more than 76% of the non-
federal average manufacturers price (non-FAMP) minus any additional discounts,
including mandatory discounts to counter price increase over the inflation rate. Note that
the “inflation discounts,” contrary to “inflation rebates,” reduce drug prices at the point of
sale. There is impact on co-pays, however, since VHA beneficiaries pay flat co-pays
whatever the price of the drugs they buy.
4. National standardization contracts: VHA seeks competitive bids from manufacturers for
products that are therapeutically equivalent within specific drug classes, and contracts
with those manufacturers whose products it believes provide the best value based on
medical effectiveness, safety and price, in exchange for including their products on VHA’s
national formulary and committing to use products throughout the VHA health care
system. Such bids can be considered a rational use of market forces which allows the
price reduction of patented brand-name drugs by putting them in competition with other
brand-name drugs of equivalent therapeutic value.
On a drug-by-drug basis, VHA selects the mechanism that offers the lowest price. By actively
managing its drug formulary, VHA ensures the maximization of value for money without producing
incentives for manufacturers to artificially inflate their official prices. The exact amount of
discounts and rebates obtained by VHA is not known because VHA normally does not disclose
publicly the prices it pays. The studies by Austin B. Frakt,[4,37] an health economist associated with
the U.S. Department of Veterans Affairs, synthesize existing literature analyzing discounts
obtained by VHA and estimate that VHA paid brand-name drugs at an average retail price of 60%
of what was paid by Medicare Part D. For this brief, however, our calculations are based on
manufacturer prices, not on retail prices. Considering that the price reductions applied only to the
manufacturers’ prices, and considering that retail prices include a markup of 13% for wholesalers
and pharmacies,[29] the retail price difference means in fact that VHA paid an average
manufacturer price of 54% of what was paid by Medicare Part D. Since Medicare Part D itself
11
paid on average 83% of the official manufacturer price, VHA thus paid about 46% of the official
manufacturer prices.viii
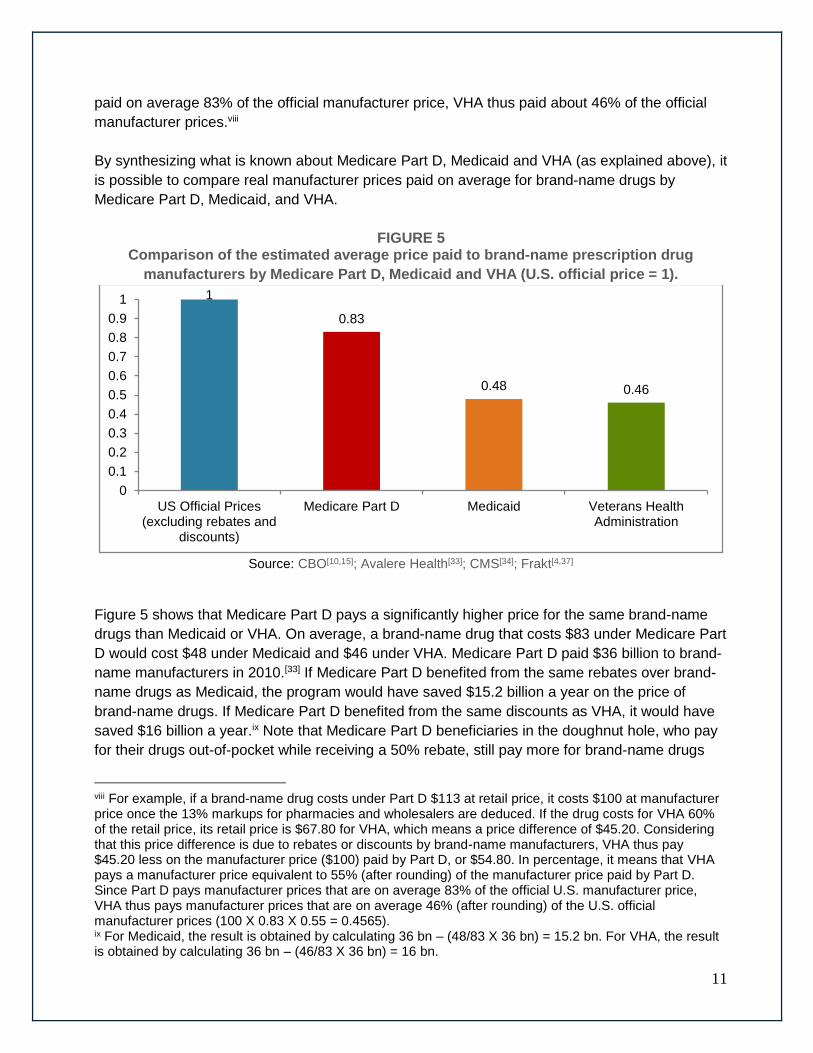
By synthesizing what is known about Medicare Part D, Medicaid and VHA (as explained above), it
is possible to compare real manufacturer prices paid on average for brand-name drugs by
Medicare Part D, Medicaid, and VHA.
FIGURE 5 Comparison of the estimated average price paid to brand-name prescription drug
manufacturers by Medicare Part D, Medicaid and VHA (U.S. official price = 1).
Source: CBO[10,15]; Avalere Health[33]; CMS[34]; Frakt[4,37]
Figure 5 shows that Medicare Part D pays a significantly higher price for the same brand-name
drugs than Medicaid or VHA. On average, a brand-name drug that costs $83 under Medicare Part
D would cost $48 under Medicaid and $46 under VHA. Medicare Part D paid $36 billion to brand-
name manufacturers in 2010.[33] If Medicare Part D benefited from the same rebates over brand-
name drugs as Medicaid, the program would have saved $15.2 billion a year on the price of
brand-name drugs. If Medicare Part D benefited from the same discounts as VHA, it would have
saved $16 billion a year.ix Note that Medicare Part D beneficiaries in the doughnut hole, who pay
for their drugs out-of-pocket while receiving a 50% rebate, still pay more for brand-name drugs
viii For example, if a brand-name drug costs under Part D $113 at retail price, it costs $100 at manufacturer price once the 13% markups for pharmacies and wholesalers are deduced. If the drug costs for VHA 60% of the retail price, its retail price is $67.80 for VHA, which means a price difference of $45.20. Considering that this price difference is due to rebates or discounts by brand-name manufacturers, VHA thus pay $45.20 less on the manufacturer price ($100) paid by Part D, or $54.80. In percentage, it means that VHA pays a manufacturer price equivalent to 55% (after rounding) of the manufacturer price paid by Part D. Since Part D pays manufacturer prices that are on average 83% of the official U.S. manufacturer price, VHA thus pays manufacturer prices that are on average 46% (after rounding) of the U.S. official manufacturer prices (100 X 0.83 X 0.55 = 0.4565). ix For Medicaid, the result is obtained by calculating 36 bn – (48/83 X 36 bn) = 15.2 bn. For VHA, the result is obtained by calculating 36 bn – (46/83 X 36 bn) = 16 bn.
1
0.83
0.48 0.46
0
0.1
0.2
0.3
0.4
0.5
0.6
0.7
0.8
0.9
1
US Official Prices(excluding rebates and
discounts)
Medicare Part D Medicaid Veterans HealthAdministration
12
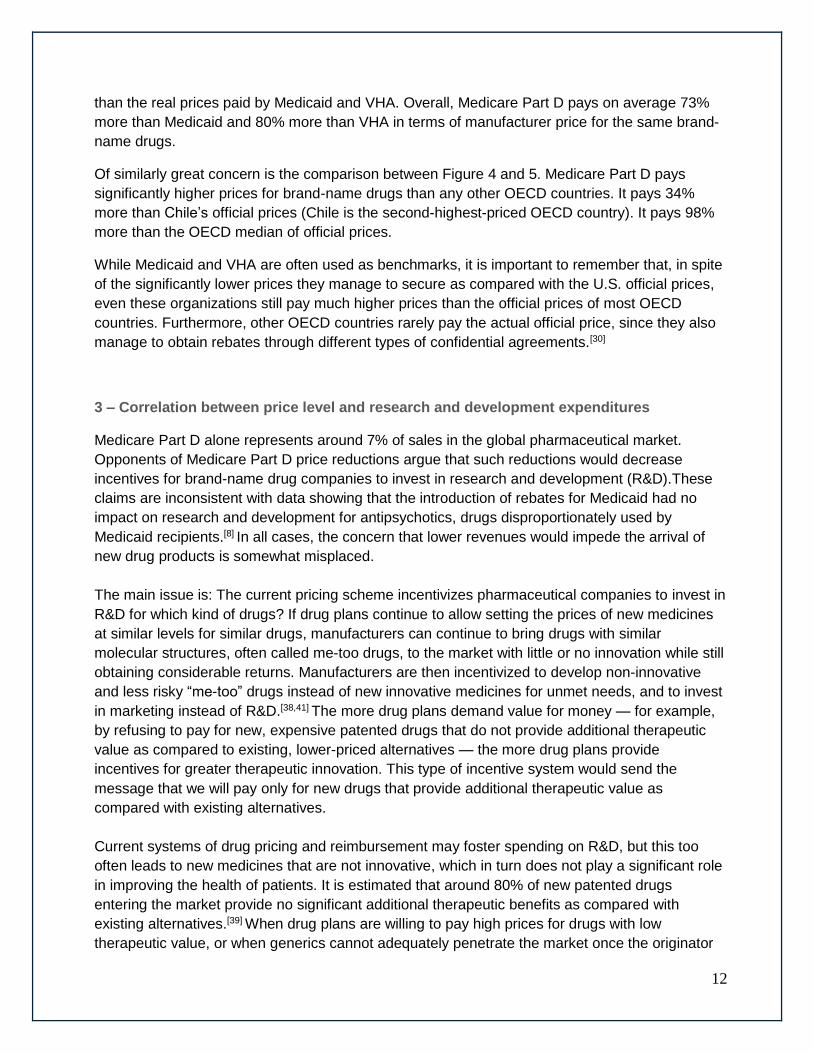
than the real prices paid by Medicaid and VHA. Overall, Medicare Part D pays on average 73%
more than Medicaid and 80% more than VHA in terms of manufacturer price for the same brand-
name drugs.
Of similarly great concern is the comparison between Figure 4 and 5. Medicare Part D pays
significantly higher prices for brand-name drugs than any other OECD countries. It pays 34%
more than Chile’s official prices (Chile is the second-highest-priced OECD country). It pays 98%
more than the OECD median of official prices.
While Medicaid and VHA are often used as benchmarks, it is important to remember that, in spite
of the significantly lower prices they manage to secure as compared with the U.S. official prices,
even these organizations still pay much higher prices than the official prices of most OECD
countries. Furthermore, other OECD countries rarely pay the actual official price, since they also
manage to obtain rebates through different types of confidential agreements.[30]
3 – Correlation between price level and research and development expenditures
Medicare Part D alone represents around 7% of sales in the global pharmaceutical market.
Opponents of Medicare Part D price reductions argue that such reductions would decrease
incentives for brand-name drug companies to invest in research and development (R&D).These
claims are inconsistent with data showing that the introduction of rebates for Medicaid had no
impact on research and development for antipsychotics, drugs disproportionately used by
Medicaid recipients.[8] In all cases, the concern that lower revenues would impede the arrival of
new drug products is somewhat misplaced.
The main issue is: The current pricing scheme incentivizes pharmaceutical companies to invest in
R&D for which kind of drugs? If drug plans continue to allow setting the prices of new medicines
at similar levels for similar drugs, manufacturers can continue to bring drugs with similar
molecular structures, often called me-too drugs, to the market with little or no innovation while still
obtaining considerable returns. Manufacturers are then incentivized to develop non-innovative
and less risky “me-too” drugs instead of new innovative medicines for unmet needs, and to invest
in marketing instead of R&D.[38,41] The more drug plans demand value for money — for example,
by refusing to pay for new, expensive patented drugs that do not provide additional therapeutic
value as compared to existing, lower-priced alternatives — the more drug plans provide
incentives for greater therapeutic innovation. This type of incentive system would send the
message that we will pay only for new drugs that provide additional therapeutic value as
compared with existing alternatives.
Current systems of drug pricing and reimbursement may foster spending on R&D, but this too
often leads to new medicines that are not innovative, which in turn does not play a significant role
in improving the health of patients. It is estimated that around 80% of new patented drugs
entering the market provide no significant additional therapeutic benefits as compared with
existing alternatives.[39] When drug plans are willing to pay high prices for drugs with low
therapeutic value, or when generics cannot adequately penetrate the market once the originator
13
goes off-patent, the need to invest in the development of new innovative products declines
accordingly.[40] In fact, by agreeing to pay inflated prices even for me-too drugs, drug plans like
Medicare Part D artificially increases the returns on me-too drugs and thus reduces incentives for
breakthrough innovation.[41]
An increase in profits does not necessarily lead to increased investment in research. Profits are
generally distributed to shareholders, through dividends and share buybacks. They also can be
used to buy competitors through mergers and acquisitions, often resulting in the closure of
research laboratories. An accounting study based on the annual reports of 10 of the largest global
pharmaceutical firms over the 10-year period from 1996 to 2005 revealed net operating profits
after tax of $413 billion and a net return on shareholders’ invested capital of 29%.[42] Compared
with other industrial sectors, this is an exceptionally high return. These firms distributed 77% of
net earnings ($317 billion) to their shareholders as dividends or share buybacks, they used 16%
($65 billion) of their net earnings to build provisions for future mergers and acquisitions, and they
invested only 10% of net earnings ($43 billion) in tangible fixed assets. The pharmaceutical
industry generated higher profit margins than any other major industrial sector in 2013 and
2014.[43] 2014 was a record year in terms of share buybacks[44] and mergers and acquisitions in
the pharmaceutical sector.[45] For these reasons, the connection between net revenues and R&D
spending is not clear.
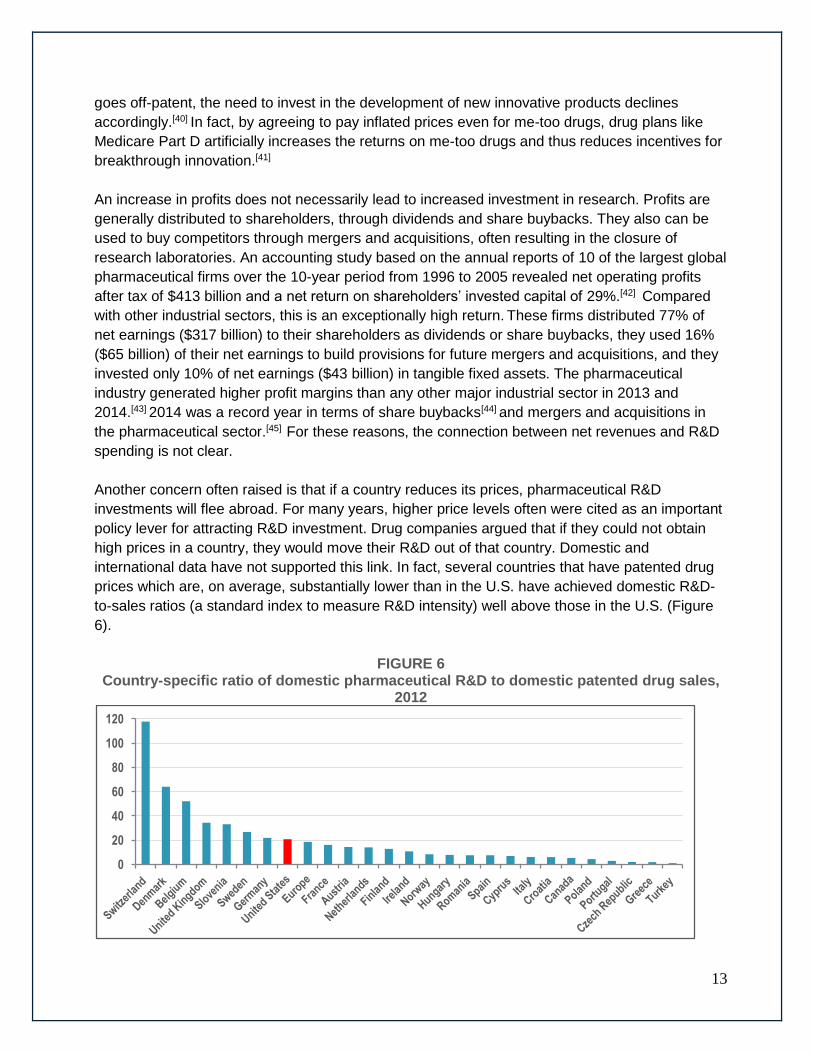
Another concern often raised is that if a country reduces its prices, pharmaceutical R&D
investments will flee abroad. For many years, higher price levels often were cited as an important
policy lever for attracting R&D investment. Drug companies argued that if they could not obtain
high prices in a country, they would move their R&D out of that country. Domestic and
international data have not supported this link. In fact, several countries that have patented drug
prices which are, on average, substantially lower than in the U.S. have achieved domestic R&D-
to-sales ratios (a standard index to measure R&D intensity) well above those in the U.S. (Figure
6).
FIGURE 6 Country-specific ratio of domestic pharmaceutical R&D to domestic patented drug sales,
2012
0
20
40
60
80
100
120
14
Source: Pharmaceutical Research and Manufacturers of America (PhRMA);[46] European Federation of
Pharmaceutical Industries and Associations (EFPIA);[47] PMPRB[48]
Increasingly, analyses show that the impact of drug prices on companies’ decisions on where to
invest and conduct research are, at best, of marginal importance. Other factors — such as where
companies can find the best science base at reasonable cost, taxation incentives, flexible labor
markets and economic stability — are seen as having greater importance in companies’ decisions
than drug prices.[48-49] There is no reason to believe that Medicare Part D price reductions would
cause a flight of pharmaceutical R&D investment outside the country.
4 – Conclusions and policy considerations
The after-rebate prices Medicare Part D plan sponsors pay for brand-name drugs remain
significantly higher than the current market prices found in other countries or in other programs
such as Medicaid or VHA. Medicare Part D would save between $15.2 billion and $16 billion a
year if it could obtain the same manufacturer prices that Medicaid or VHA, respectively, obtains
for the same brand-name drugs. Lower brand-name drug prices for Medicare Part D not only
would generate savings, but, by increasing patient access to prescribed drugs, it also could
improve adherence to treatments by reducing the high level of cost-related non-adherence found
in Medicare Part D.
One of the arguments invoked against price reductions asserts that public interference in drug
negotiations would undermine the plan sponsors’ competitive system used in Medicare Part D
and lead to higher costs for beneficiaries.[20] This argument should not be an obstacle against
reducing prices. Part D is designed based on a model of “managed competition” among private
insurers. The same model is active in countries such as Switzerland and the Netherlands that
offer universal drug coverage for their populations through regulated private insurers. Competition
among private insurers in these countries is not undermined by lower brand-name prices, and
beneficiaries pay significantly lower premiums. In fact, these countries often are cited as models
in terms of “managed competition” for drug coverage.[50] According to Figure 4, average brand-
name drug prices in Switzerland (excluding rebates) are 34% less than after-rebate prices in
Medicare Part D, while average brand-name drug prices in the Netherlands (excluding rebates)
are 57% less than in Medicare Part D.
Because Medicare Part D represents 7% of global pharmaceutical sales, there is also concern
that reducing brand-name drug prices would reduce spending in R&D. As discussed in Section 3,
pricing schemes and the amount of revenues are factors in terms of R&D investment decisions.
They are especially important factors in determining the types of R&D that will be fostered.
Because of the design of their pricing schemes, Medicare Part D and Medicaid do not mainly
emphasize paying for valuable products. They foster, instead, a pharmaceutical business model
with few incentives for developing innovative products. They provide incentives for developing
less risky me-too products that do not lead to improvements in the health of patients. In fact,
15
because of its high price level, Medicare Part D acts as an indirect subsidy for me-too products, to
the detriment of more innovative research.
Proposed modifications to Medicare Part D’s pricing scheme create an opportunity to provide not
more but better incentives for R&D. A purchasing system emphasizing therapeutic value — for
example through value-based pricing —not only would decrease prices but also would provide
greater incentives for R&D investment in drugs that represent improvements on existing
therapies.[41,51]
A managed formulary, such as the Veterans Health Administration National Formulary, weighs
the additional therapeutic value of a drug to determine the amount of reimbursement. It is based
on the capacity to refuse reimbursement of a drug if its low therapeutic value does not justify its
price. For example, such formularies normally implement mandatory generic substitution to avoid
paying for higher-priced brand-name drugs when the same clinical results can be obtained with
generics. While a managed formulary often is considered a tool to reduce costs, it also is, in fact,
an important tool to eliminate waste by reducing opportunity costs so that maximum therapeutic
value for every dollar spent can be realized. Large scale savings could thus be obtained with
managed formularies and price negotiations, even within the constraints imposed by a monopoly-
supported private R&D system, through a better use of market competition for similar products.
While Medicaid and VHA obtain almost equivalent brand-name price levels, they create
completely different incentives for pharmaceutical R&D. The unconditional “basic rebates” of
Medicaid foster the current business of developing me-too drugs while creating an incentive to
artificially inflate official prices. The proactive drug formulary management of VHA maximizes
therapeutic value for every dollar spent and thus provides greater incentives for producing more
innovative products.
The main argument against managed formularies is that such formularies restrict patients’
choices. Indeed, managed formularies do not reimburse all new drugs, only those that provide
value for money. However, freedom of choice is never at stake, since patients can decide to pay
out of pocket for the drugs or treatments they desire, even if clinical evidence shows that these
treatments do not provide therapeutic value for money. A managed formulary for prescription
drugs does not reduce freedom of choice; it only reduces the freedom to needlessly waste
taxpayers’ money.
5 – Recommendations
Based on the analysis provided by this policy brief, the following is recommended for inclusion in
legislation to significantly lower Medicare Part D drug costs:
1. Medicare Part D should reduce brand-name drug prices to at least the level of Medicaid or
VHA.

16
2. Mandatory rebates on official prices (i.e., Medicaid’s “basic rebate”) should be avoided,
but mandatory discounts for drug prices that increase over the rate of inflation (i.e., VHA’s
“inflation discounts”) should be introduced for both brand-name and generic drugs.
3. Mandatory generic substitution for all plans under Medicare Part D should be introduced.
4. A managed formulary applicable to all plans under Medicare Part D should be introduced.
5. Price reductions should be used to reduce co-payments and deductibles in order to
reduce cost-related non-adherence.
6. To preserve freedom of choice, patients wanting access to treatments that are more
expensive than equivalent, equally safe and effective treatments covered under Medicare
Part D should have the opportunity to access these treatments, but they should have to
pay the price difference out-of-pocket.
Given the complex nature of this issue, it is recommended that members of Congress create a
joint working group to investigate the ways and means of implementing the recommended
reforms. The mandate of this working group should not be if the structure and pricing for Medicare
Part D drugs should be reformed, but how they should be reformed to ensure the greatest benefit
to the American people.
17
ENDNOTES
1. The Boards of Trustees, Federal Hospital Insurance and Federal Supplementary Medical Insurance Trust Funds. 2014. “The 2014 annual report of the boards of trustees of the federal hospital insurance and federal supplementary medical insurance trust funds”. Washington D.C., July 2014.
2. Gretchen A. Jacobson, Sidath Viranga Panangala, and Jean Hearne. 2007. Pharmaceutical Costs: A Comparison of Department of Veterans Affairs (VA), Medicaid, and Medicare Policies. Congressional Research Office. January 2007.
3. Families USA. 2007. No Bargain: Medicare Drug Plans Delivers High Prices.
Families USA. January 9 2007.
4. Frakt AB, Pizer SD, Hendricks AM. 2008. “Controlling prescription drug costs:
regulation and the role of interest groups in medicare and the Veterans Health
Administration”. Journal of Health Politics, Policy and Law 33(6):1079–1106.
5. Gellad W, Schneeweiss S, Brawarsky P, Lipsitz S, Hass J. 2008. “What if the
federal government negotiated pharmaceutical prices for seniors? An estimate of
national savings”. Journal of General Internal Medicine 23(9):1435–1440.
6. Kevin Outterson and Aaron S. Kesselheim. 2009. “How Medicare Could Get Better
Prices On Prescription Drugs”. Health Affairs 28, no.5 (2009):w832-w841
7. Congressional Budget Office. 2011. Reducing the Deficit; Spending and Revenue
Options. Congressional Budget Office. March 2011.
8. Richard Frank. 2012. Prescription Drug Procurement and the Federal Budget,
Henry J. Kaiser Family Foundation, March 2012.
9. Joshua Cohen, Ashley Malins and Zainab Shahpurwala. “Compared To US
Practice, Evidence-Based Reviews In Europe Appear To Lead To Lower Prices For
Some Drugs”. Health Affairs, 32, no.4 (2013):762-770
10. Congressional Budget Office. 2014. Competition and the Cost of Medicare
Prescription Drug Program. Congressional Budget Office. July 2014.
11. Office of Inspector General. 2015. Medicaid rebates for brand-name drugs
exceeded part d rebates by a substantial margin. Department of Health and Human
Services. April 2015: http://oig.hhs.gov/oei/reports/oei-03-13-00650.pdf .
12. Sikora, P., and H. Schiavone. 2006. Not Low Enough: Medicare Part D “Donut
Hole” Prices Compared with Retail and VA Prices. Consumers Union, October
2006.
13. Congressional Budget Office. Prices for Brand-Name Drugs in Selected Federal
Programs. June 2005.
14. Nugent, G., A. Hendricks, L. Nugent, and M. Render. 2004. “Value for Taxpayers’
Dollars: What VA Care Would Cost at Medicare Prices”. Medical Care Research
and Review 61, 2004: 495-508.
15. Congressional Budget Office. 2014. Comparing the Costs of the Veterans’ Health
Care System with Private Sector Costs. CBO, December 2014.
16. Senator Bill Nelson. 2015. Lawmakers seek to end drug industry windfall. Media
release. April 24 2015.
17. Mark Lange. 2007. A landmark in corporate welfare. Christian Science Monitor. July
18 2007.
18
18. Joseph Antos and Guy King. 2011. Tampering with Part D Will Not Solve Our Debt
Crisis. American Enterprise Institute Health Studies Working Paper. June 29, 2011.
19. Douglas Holtz-Eakin and Michael Ramlet. 2011. Cost Shifting Debt Reduction to
America’s Senior. American Action Forum, July 21, 2011.
20. Peter J. Pitts. 2015. “Obama's drug crusade comes at high price; Medicare Part D
program, which provides affordable drug insurance, needs to be emulated, not
reformed”. Houston Chronicle, June 11 2015.
21. Marc-André Gagnon. 2014. A Roadmap to a Rational Pharmacare Policy in
Canada. Ottawa: Canadian Federation of Nurses Unions. August 2014:
https://nursesunions.ca/sites/default/files/pharmacare_report.pdf
22. OECD. 2008. Pharmaceutical Pricing Policies in a Global Market. Paris: OCDE,
2008.
23. Panos Kanavos, Alessandra Ferrario, Sotiris Vandoros and Gerard F. Anderson.
2013. “Higher US Branded Drug Prices And Spending Compared To Other
Countries May Stem Partly From Quick Uptake Of New Drugs”. Health Affairs, 32,
no.4 (2013):753-761.
24. PMPRB. 2014. Annual Report 2013. Ottawa: PMPRB, 2014. 25. Sara R. Collins, Petra W. Rasmussen, Michelle M. Doty, and Sophie Beutel. 2015.
The Rise in Health Care Coverage and Affordability Since Health Reform Took Effect; Findings from the Commonwealth Fund Biennial Health Insurance Survey, 2014. The Commonwealth Fund, January 2015.
26. Steve Morgan and Jae Kennedy. 2010. Prescription Drug Accessibility and Affordability in the United States and Abroad. Issues in International Health Policy Vol. 89. Commonwealth Fund, June 2010.
27. Williams J, Steers WN, Ettner SL, Mangione CM, Duru OK. 2013. “Cost-related Nonadherence by Medication Type among Medicare Part D Beneficiaries with Diabetes”. Medical care. 2013; 51(2):193-198.
28. Becky A. Briesacher, Jeanne M. Madden, Fang Zhang, Hassan Fouayzi, Dennis
Ross-Degnan, Jerry H. Gurwitz, and Stephen B. Soumerai. 2015. “Did Medicare
Part D Affect National Trends in Health Outcomes or Hospitalizations?: A Time-
Series Analysis”. Annals of Internal Medicine, 162 (12), June 2015: 825-833.
29. Congressional Budget Office. Medicaid’s Reimbursement to Pharmacies for Prescription Drugs. December 2004.
30. Steven Morgan, Jamie Daw and Paige Thomson. 2013.” International Best
Practices For Negotiating 'Reimbursement Contracts' With Price Rebates From
Pharmaceutical Companies”. Health Affairs 32, no.4 (2013): 771-777.
31. IMS Institute for Healthcare Informatics. 2014 Global Outlook for Medicines through
2018. IMS Health. November 2014.
32. Office of Inspector General. 2011. Concerns with Rebates in the Medicare part D
Program. Department of Health and Human Services, March 2011.
33. Avalere Health. 2011. Federal Spending on Brand Pharmaceuticals. Washington
D.C.: Avalere Health, LLC , April 2011.
34. Centers for Medicare & Medicaid Services. Financial Management Report for
FY2002 through FY2010. CMS-64 Quarterly Expense Report, 2012:
http://www.cms.gov/Research-Statistics-Data-and-Systems/Computer-Data-and-
Systems/MedicaidBudgetExpendSystem/CMS-64-Quarterly-Expense-Report.html
19
35. Gale Scott. 2015. Attack on Generics' Price Escalates. MD Magazine. June 12
2015.
36. Congressional Budget Office.1996. How the Medicaid Rebate on Prescription
Drugs Affects Pricing in the Pharmaceutical Industry. Congressional Budget Office,
January 1996:
www.cbo.gov/sites/default/files/cbofiles/ftpdocs/47xx/doc4750/1996doc20.pdf
37. Austin B. Frakt, Steven D. Pizer and Roger Feldman. 2012. “Should Medicare
adopt the Veterans Health Administration Formulary?” Health Economics, Vol. 21,
2012: 485-495.
38. Don Husereau and Philip Jacobs. Investigation and Analysis of Options to Enhance
Canada's Patented Medicine Price Ceiling Regulatory Regime. Institute of Health
Economics, 2013:
http://ihe.ca/documents/Patented%20Medicine%20Pricing%20Options%20Report.p
df.
39. Marc-Andre Gagnon. 2012. “Corporate influence over clinical research: Considering
the alternatives.” Prescrire International 21(129), July 2012: 191-194.
40. Marc-Andre Gagnon. 2015. “New Drug Prices; Does it Make Any Sense?”.
Prescrire International, 24 (162), July 2015: 192-195.
41. Marc-Andre Gagnon. 2013. “Corruption of Pharmaceutical Markets: Addressing the
Misalignment of Financial Incentives and Public Health,” in Journal of Law,
Medicine and Ethics, Vol. 41 #3, September 2013: 571-580.
42. L.-P. Lauzon, and M. Hasbani. 2006. “Analyse socio-économique: Industrie
Pharmaceutique Mondiale pour la période de 10 ans 1996-2005” Chaire d’études
socio-économiques de l’UQAM. 2006.
43. R. Anderson. “Pharmaceutical Industry Gets High on Fat Profit”. BBC News;
November 6, 2014.
44. The Economist. 2014. “The Repurchase revolution” Economist; Sept. 13 2014.
45. A. Ward. 2014. “Big Pharma cashes in as M&A fever sweeps sector” Financial
Times; December 26, 2014.
46. Pharmaceutical Research and Manufacturers of America (PhRMA). 2013. 2013
Profile. PhRMA, 2013.
47. European Federation of Pharmaceutical Industries and Associations (EFPIA). 2014.
The Pharmaceutical Industry in Figures; Key data 2014. EFPIA, June 2014.
48. Patented Medicines Price Review Board. 2013. Annual report 2012. PMPRB, 2013.
49. NERA Economic Consulting, Key Factors in Attracting Internationally Mobile
Investments by the Research-Based Pharmaceutical Industry. MMC, 2007.
50. Nadeem Esmail and Bacchus Barua. 2015. Drug Coverage for low income families;
The Canadian Reality and Lessons from Switzerland and the Netherlands. Fraser
Institute. April 2015.
51. Don Husereau and Chris Cameron. 2011. Value-Based Pricing of Pharmaceuticals
in Canada: Opportunities to Expand the Role of Health Technology Assessment?
CHSRF Report. December 2011:
http://www.chsrf.ca/PublicationsAndResources/ResearchReports/ArticleView/11-12-
16/8eeaf655-b2b6-4c39-a909-6854acfea850.aspx