miritec: queue management system
TRANSCRIPT
Queue Management SystemAdd value to your retail business with QMS
July 2015
Prospects
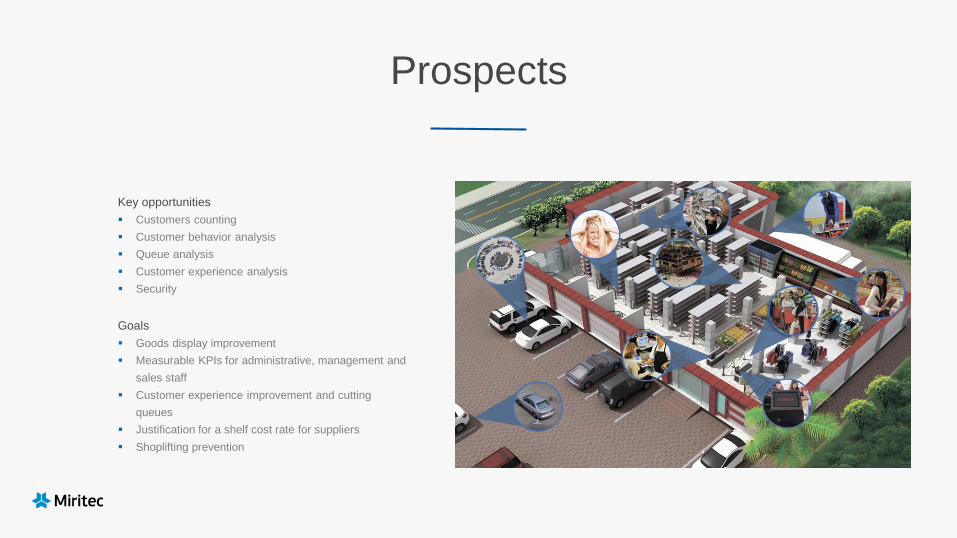
Key opportunities
Customers counting
Customer behavior analysis
Queue analysis
Customer experience analysis
Security
Goals
Goods display improvement
Measurable KPIs for administrative, management and
sales staff
Customer experience improvement and cutting
queues
Justification for a shelf cost rate for suppliers
Shoplifting prevention
Customer Behavior Analysis
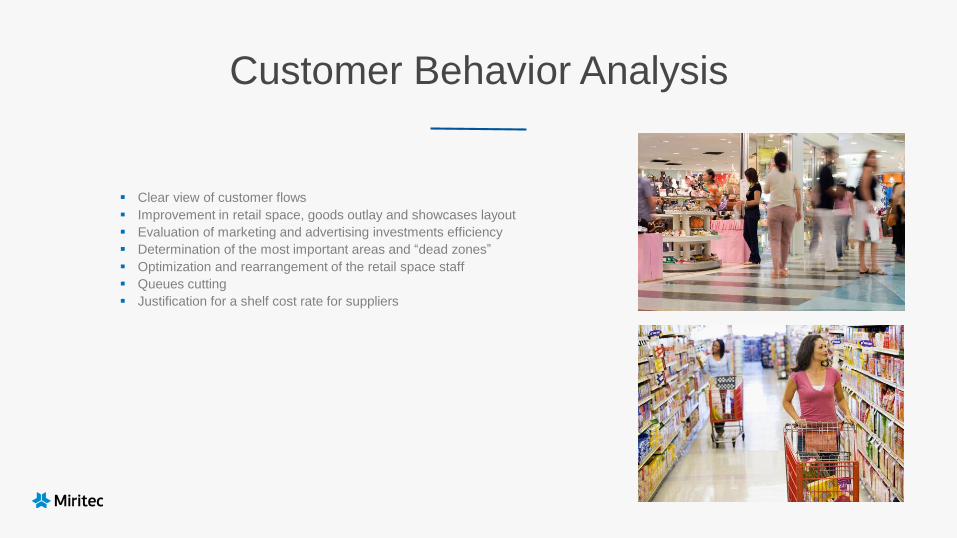
Clear view of customer flows
Improvement in retail space, goods outlay and showcases layout
Evaluation of marketing and advertising investments efficiency
Determination of the most important areas and “dead zones”
Optimization and rearrangement of the retail space staff
Queues cutting
Justification for a shelf cost rate for suppliers

Customer Experience
Sales increase due to queues reduction
Queue Length Control
Service quality enhancement
Queue Time Control Service Tome Control
Management of cash operating staff and
shiftwork scheduling

Numerous Questions Answered
1. What are the most time-consuming areas for customers and what rows do they
pass by?
2. Which goods outlays and promotions attract the most of shoppers?
3. What is the efficiency ratio of the certain shopping rows and the end caps?
4. When do the longest shopping queues appear and how many checkout operators
are needed to avoid exceeding the target queue length during these peaks?
5. How to design the most convenient shiftwork schedule depending on customers’
number in the store?
6. How many customers have left the store with no purchases? Why?
7. … and many others.
Assistance in making strategic decisions to boost sales

The Operation Pattern
People counting Customer flow analysis
Queue analysis Face detection Statistics analysis
SMS notification

Customers Counting
Key opportunities
The software detects an individual by characteristic
features
95-95% veracity rate, including queuing peaks
Data correction and adjustment to sales staff
Aside from customers, 25% of counted people may
be the staff
Software suggests staff uniform analysis and deletion
of data, leading to errors
It applies detection procedures to certain groups of
customers
Associate (orange shirt,
black pants)
Customers

Customer Flow Analysis
The software analyzes customers’ movements
around the retail space and records the trajectories in
a special database
There are different ways to visualize the collected
data
Customers recording in restricted areas
Examples of different ways to visualize collected data
30 in day
68
12
3
Min
Max
Dead zone

Queue Analysis
Target goals
Boosting sales due to reduction queue length
Customer experience enhancement
Cash operating staff management
Queue length forecast
Using collected data, monitoring system provides
forecasts for 15, 30, 45 minutes ahead that allows
enabling extra checkout points
Designated staff is notified by a system via SMS
Detection of customer groups
The considerable number of purchases is made by
families
Large coverage areas and advanced algorithms
enable detection of families in queues and
recognizing them as the one customer
Queue analysis statistics
The number of customers in queue
Checkout capacity
Average queuing time
Peak hours
Downtime hours
Resource Optimization
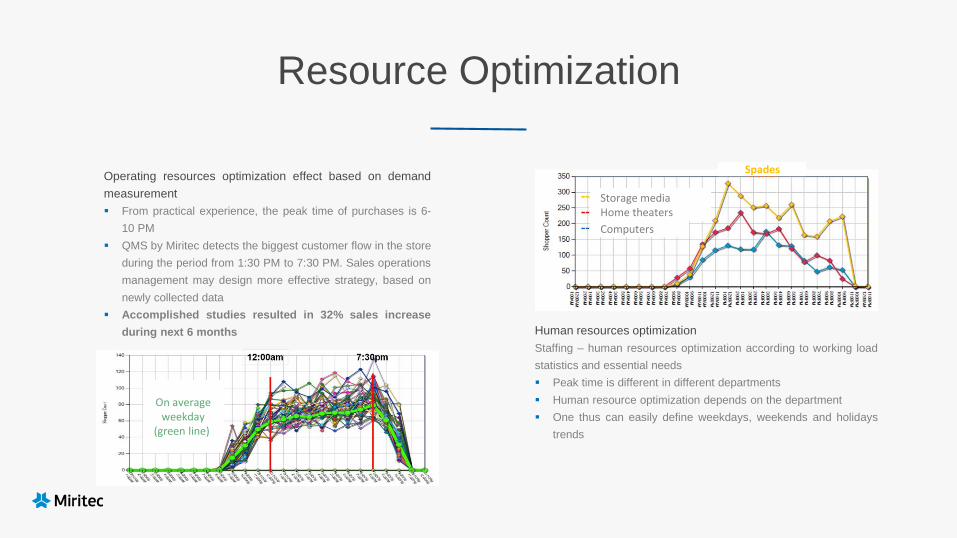
Operating resources optimization effect based on demand
measurement
From practical experience, the peak time of purchases is 6-
10 PM
QMS by Miritec detects the biggest customer flow in the store
during the period from 1:30 PM to 7:30 PM. Sales operations
management may design more effective strategy, based on
newly collected data
Accomplished studies resulted in 32% sales increase
during next 6 months Human resources optimization
Staffing – human resources optimization according to working load
statistics and essential needs
Peak time is different in different departments
Human resource optimization depends on the department
One thus can easily define weekdays, weekends and holidays
trends
On average weekday
(green line)
Storage mediaHome theaters
Computers
Spades

Efficiency Ratio by Department

Different Customer Locations
11,000 people per day 3700 people per day Customer counting per store
Show window analysisMeasurable space around the show
window and its analysis
Queue Management System (QMS) Custom Development
Dev Center Miritec
UI/UX Design Independent Software
Testing
IT-System Migration and
Reengineering
Custom Development and
Support

Miritec Projects

Thanks for Watching
Contacts
www.miritec.com/en/ [email protected] 03680 Kiev, 4 Ivan Lepse blv,
Ukraine
+38 (044) 359-05-90