minoritie2s in 010 higher education · 6. undergraduate and graduate fall enrollment in higher...
TRANSCRIPT

TwenTy-FOURTH STaTUS RepORT
2011 Supplement
2010Minorities in Higher Education
Young M. Kim

TwenTy-FOURTH STaTUS RepORT
2011 Supplement
2010Minorities in Higher Education
Young M. Kim
© October 2011
American Council on Education
ACE and the American Council on Education are registered marks of the American Council on Education and cannot be
used or reproduced without the express written consent of the American Council on Education.
American Council on Education
One Dupont Circle NW
Washington, DC 20036
GED® is a federally registered trademark of the American Council on Education and cannot be used or reproduced without
the express written consent of the American Council on Education.
All rights reserved. No part of this book may be reproduced or transmitted in any form or by any means electronic or
mechanical, including photocopying, recording, or by any information storage and retrieval system, without permission in
writing from the publisher.
PROJECT COORDINATOR:Linda Mabrey, Senior Program Manager, Center for Advancement of Racial and Ethnic Equity, American Council on Education
EDITORS:Bryan Cook, Director, Center for Policy Analysis, American Council on EducationGailda Davis, Associate Director, Center for Advancement of Racial and Ethnic Equity, American Council on Education
AUTHOR:Young M. Kim, Research Analyst, Center for Policy Analysis, American Council on Education

FOREwORD . . . . . . . . . . . . . . . . . . . . . . . . . . . . . . . . . . . . . . . . . . . . . . . . . . . . . . . . . . . . . . . . . . . . . . . . . . . . . . . . . . . . . . . . . i
SUMMARY OF 2011 UPDATE . . . . . . . . . . . . . . . . . . . . . . . . . . . . . . . . . . . . . . . . . . . . . . . . . . . . . . . . . . . . . . . . . . . . . . . . . .1
LIST OF TABLES
1. educational attainment Rates for adult population, by Race/ethnicity, Gender, and age: 1989 to 2009 . . . . . . . . . . .5
2. High School Completion and College enrollment Rates for Traditional College-aged population (aged 18 to 24), by Gender and Race/ethnicity: 1989 to 2009 . . . . . . . . . . . . . . . . . . . . . . . . . . . . . . . . . . . . . . . 7
3. Total Fall enrollment in Higher education, by Type of Institution and Race/ethnicity: 1998 to 2008 (Selected years) . . . . . . . . . . . . . . . . . . . . . . . . . . . . . . . . . . . . . . . . . . . . . . . . . . . . . . . . . . . . . . . 8
4. Total Fall enrollment in Higher education, by Gender and Race/ethnicity: 1998 to 2008 (Selected years) . . . . . . . . . . . . . . . . . . . . . . . . . . . . . . . . . . . . . . . . . . . . . . . . . . . . . . . . . . . . . . . 9
5. Total Fall enrollment in Higher education, by Control of Institution and Race/ethnicity: 1998 to 2008 (Selected years) . . . . . . . . . . . . . . . . . . . . . . . . . . . . . . . . . . . . . . . . . . . . . . . . . . . . . . . . . . . . . . 10
6. Undergraduate and Graduate Fall enrollment in Higher education, by Race/ethnicity: 1998 to 2008 (Selected years) . . . . . . . . . . . . . . . . . . . . . . . . . . . . . . . . . . . . . . . . . . . . . . . . . . . . . . . . . . . . . . 11
7. associate Degrees, by Race/ethnicity and Gender: 1998 to 2008 (Selected years) . . . . . . . . . . . . . . . . . . . . . . . . . 12
8. Bachelor’s Degrees, by Race/ethnicity and Gender: 1998 to 2008 (Selected years) . . . . . . . . . . . . . . . . . . . . . . . . 13
9. Master’s Degree, by Race/ethnicity and Gender: 1998 to 2008 (Selected years) . . . . . . . . . . . . . . . . . . . . . . . . . . 14
10. Doctoral Degree, by Race/ethnicity and Gender: 1998 to 2008 (Selected years) . . . . . . . . . . . . . . . . . . . . . . . . . . 15
Table of Contents

MInORITIeS In HIGHeR eDUCaTIOn: 2011 SUppLeMenT aMeRICan COUnCIL On eDUCaTIOn i
Foreword
The American Council on Education (ACE) is pleased to release this short update to Minorities
in Higher Education 2010. This is the second edition in the special supplement series since
ACE made the decision to publish a full status report biennially, with a supplement in the
intervening years to update the most frequently accessed information.
The decision to publish the full report biennially was made for strategic and practical rea-
sons, and does not reflect any change in ACE’s historical commitment to fostering greater access,
equity, and diversity in American higher education. The data presented in the Minorities in Higher
Education report series vary little in any single-year span, so the annual changes reported are
often small. By producing the full status report every other year, staff can pursue a more diverse
range of research and programmatic activities that address the important diversity and equity
agenda.
In this global economy, especially during the recent economic challenges, providing greater
access to postsecondary education to individuals from all racial and ethnic backgrounds remains
one of the most important challenges facing our nation. Demographic changes have dramatically
increased the proportions of people of color in the United States, and our academic institutions
must continue to strive to reflect the complex mosaic that is the American population.
Although greater access to higher education for students of color is an absolute imperative, it
is only part of the equation. Ensuring their academic success and readiness to thrive in an inter-
connected world remains the ultimate goal. This special supplement tells us how far we have
come in our quest for educational excellence for all students, but also cautions us that equity in
education for all Americans remains a goal that we must endeavor to reach.
Gailda P. Davis Bryan J. Cook
Associate Director, Center for Advancement Director, Center for Policy Analysis
of Racial and Ethnic Equity

MInORITIeS In HIGHeR eDUCaTIOn: 2011 SUppLeMenT aMeRICan COUnCIL On eDUCaTIOn 1
Summary of 2011 Update
This update aims to help campus leaders,
policy makers, and the general public by
providing reliable and timely informa-
tion that can build support for improvements
in higher education. Especially at a time when
demand for a college-educated workforce is
increasing, the tracking of educational prog-
ress among races/ethnicities and by gender
is important because substantial gaps persist
among these groups. In addition, the fast-
growing racial/ethnic groups are the ones
that historically have attained lower levels of
education. Closing these gaps in educational
attainment is essential for raising the educa-
tion level of the overall U.S. population.
POSTSECONDARY EDUCATIONAL ATTAINMENT
As of 2009, 29.9 percent of young Americans
aged 25 to 29 had obtained at least a bache-
lor’s degree, and an additional 7.9 percent had
earned an associate degree. The current bach-
elor’s degree attainment rate has shown only
modest improvement in 20 years—it is up by
6.6 percentage points since 1990.
These average rates conceal large dispari-
ties among subgroups. Asian Americans aged
25 to 29 are at the top, with 58 percent hold-
ing a bachelor’s degree, followed by whites
(36 percent), African Americans (18 percent),
Hispanics (12 percent), and finally, American
Indians (10 percent). These large gaps are
unlikely to change without reducing dispari-
ties at each transition point in the educational
pipeline.
One disturbing trend that we identified
in previous editions continues to surface:
The younger generation in the United States
no longer achieves a much higher level of
education than its predecessors. As of 2009,
37.8 percent of U.S. adults aged 25 to 29 had
obtained at least an associate degree, only
marginally higher than adults aged 30 and
older (35.1 percent). Only two groups, Asian
Americans and whites, made notable gains
over their elders (65.6 percent versus 54.2 per-
cent, and 44.9 percent versus 38.5 percent,
respectively). No gains were observed for
African Americans and Hispanics (24.7 percent
versus 25.0 percent, and 17.9 percent ver-
sus 17.9 percent, respectively). For American
Indians, however, attainment rates for young
adults were lower than their older counter-
parts (16.9 percent versus 21.6 percent).
These trends vary by gender. Young
women in their late 20s surpassed their elders
in all racial/ethnic groups, except American
Indians. However, young racial/ethnic minor-
ity men, except Asian Americans, have fallen
behind their predecessors in postsecondary
attainment. Young white men achieved about
the same level of education as older age
groups.
MInORITIeS In HIGHeR eDUCaTIOn: 2011 SUppLeMenT aMeRICan COUnCIL On eDUCaTIOn 2
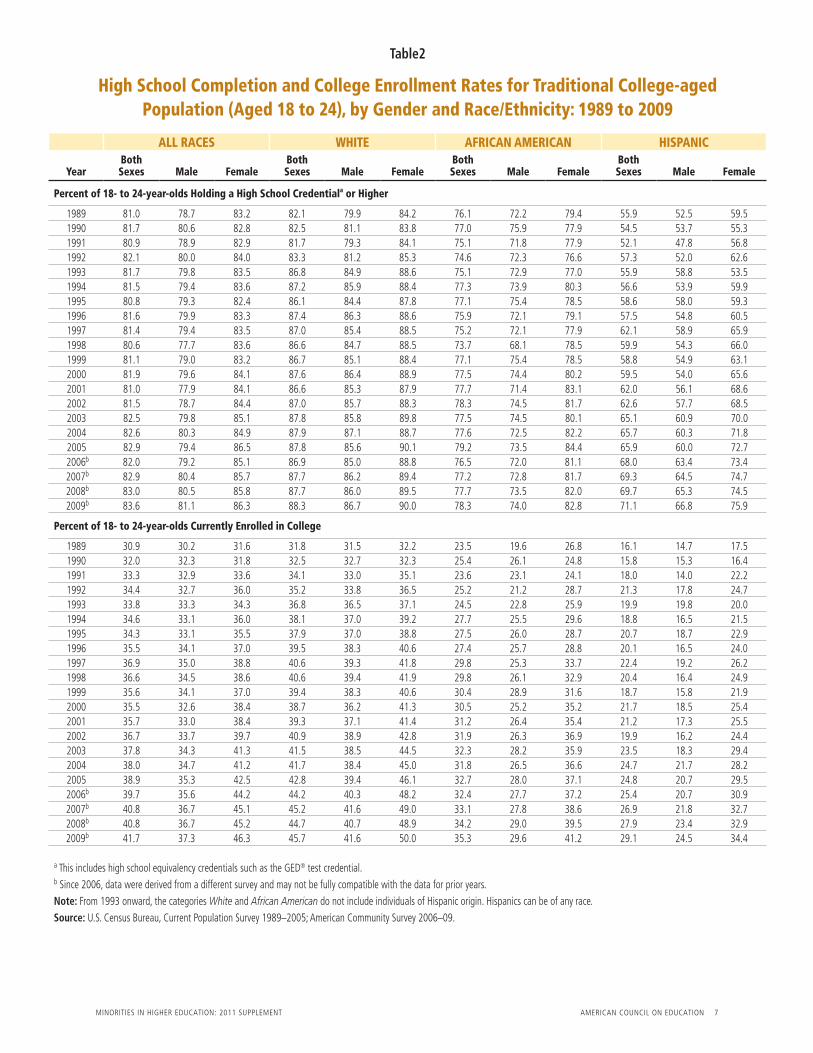
HIGH SCHOOL COMPLETIONDuring the past two decades, the high
school completion rate remained stagnant for
young people at about 82 percent, on aver-
age.1 At the same time, gender gaps have wid-
ened, primarily because young women made
greater strides than men, now outpacing men
in every racial/ethnic category in the rate of
obtaining a high school credential.
Hispanics made the largest improvement
during this time period, yet they still had the
lowest rate of high school completion among
all groups, at 71 percent.2 African Americans
showed no appreciable gains in the past 20
years, while the rate for whites improved little
during the last 10 years.3 Asian Americans had
the highest rate of high school completion
(91 percent), followed by whites (88 percent),
African Americans (78 percent), and American
Indians (72 percent).
COLLEGE ENROLLMENT4
College enrollment rates.
In contrast to high school completion, the past
two decades witnessed a steady rise in col-
lege enrollment rates among young people
in every racial/ethnic background. Enrollment
rates stalled briefly in the mid-1990s but began
rising again after 2000, and now 42 percent
of the traditional college-aged population are
enrolled in college. This represents a modest
increase of 10 percentage points in 20 years.
Despite universal progress, racial/ethnic
disparities slightly worsened because of dis-
proportionate rates of improvement. Among
whites, African Americans, and Hispanics, for
whom historical data are available, whites had
the highest rate as well as the largest gain,
rising from 32 percent in 1990 to 46 percent
in 2009. In contrast, African Americans made
smaller gains, from 23 percent to 35 percent.
Although Hispanics attained similar percentage
point increases as whites, Hispanics still have
the lowest college enrollment rates.
When Asian Americans and American
Indians are included, gaps become even
larger. Young Asian Americans marked the
highest rate of college enrollment (63 percent)
in 2009, while American Indians registered the
lowest rate (23 percent).
As with high school completion, gender
gaps widened in college enrollment rates. The
proportion of young women enrolled in col-
lege increased from 32 percent to 46 percent
between 1990 and 2009, a percentage point
increase almost three times as large as for
young men (32 percent to 37 percent). Of all
racial/ethnic groups, African Americans and
Hispanics showed the largest gender gaps in
college enrollment rates.
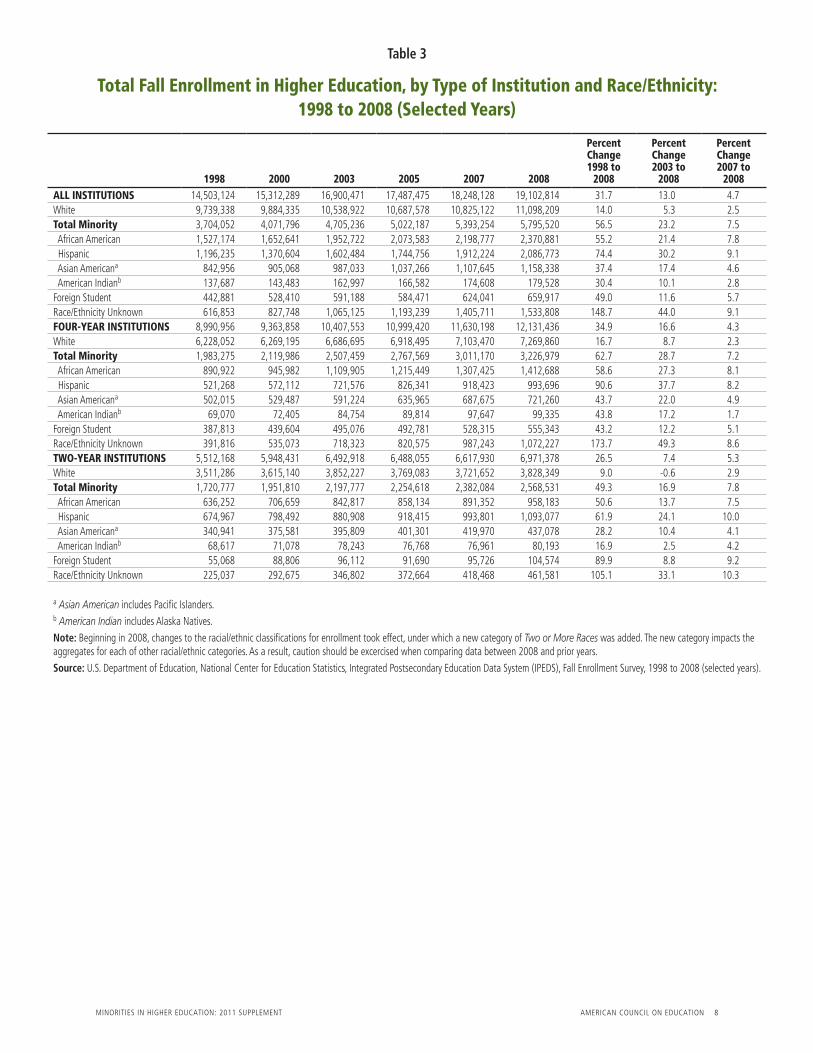
Overall college enrollment.
Population growth and improved enrollment
rates have led to a 32 percent enrollment
growth during the past 10 years. The recent
economic recession may also have played
a part in increasing enrollment, which now
reaches 19.1 million. The number of minor-
ity students grew 56 percent to 5.8 million,
1 High school completion rate is measured as the percentage of the traditional college-aged population (aged 18 to 24) holding a regular high school diploma or high school equivalency credential such as the GED® test credential.2 Despite progress made by Hispanics, the high school completion rate for all 18- to 24-year-olds remains unchanged since 1989 because of demographic shifts, with a growing share of the age group consisting of African Americans and Hispanics, whose performance on this mea-sure lags behind whites and Asian Americans.3 Trend data for high school completion rates are not available for Asian Americans and American Indians.4 This report discusses college enrollment in two ways. Enrollment rates are measured as the percentage of the traditional college-aged pop-ulation (aged 18 to 24) currently enrolled postsecondary education. Enrollment may rise because of population growth, but with no change in enrollment rates. This measure is important in examining the subgroup gaps, particularly when each subpopulation grows at a differing rate. In comparison, based on aggregate statistics, overall college enrollment provides information about the entire body of students—who could be of any age—such as the minority share of student population.
MInORITIeS In HIGHeR eDUCaTIOn: 2011 SUppLeMenT aMeRICan COUnCIL On eDUCaTIOn 3
and the number of white students increased
by 14 percent to 11.1 million during the past
decade. Among minorities, Hispanics experi-
enced the largest absolute and percent growth
rate gains.
Because of increases among students
of color, white students made up a declin-
ing share of total enrollment, dropping from
67 percent in 1998 to 58 percent in 2008,
while the minority share rose from 26 percent
to 30 percent. In 2008, students of color repre-
sented 37 percent of the student body at two-
year institutions, compared with 27 percent at
four-year institutions.
DEGREES CONFERRED
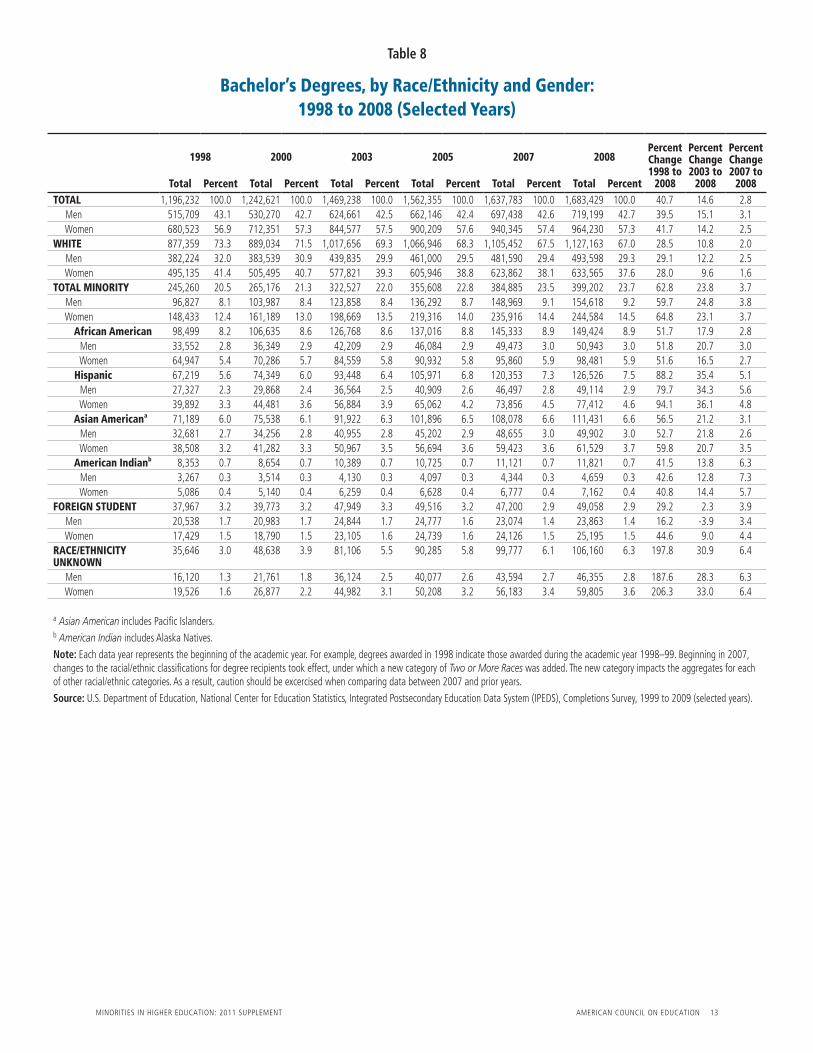
Undergraduate degrees.
Between 1998 and 2008, the number of associ-
ate and bachelor’s degrees awarded grew by
40 percent and 41 percent, respectively. These
increases were attributable to gains by every
racial/ethnic group. Hispanics led all others in
growth rate for both types of undergraduate
degrees; in particular, the number of associ-
ate degrees awarded to Hispanics has nearly
doubled in 10 years. People of color received
24 percent of total bachelor’s degrees awarded
in 2008, up from 21 percent 10 years earlier.
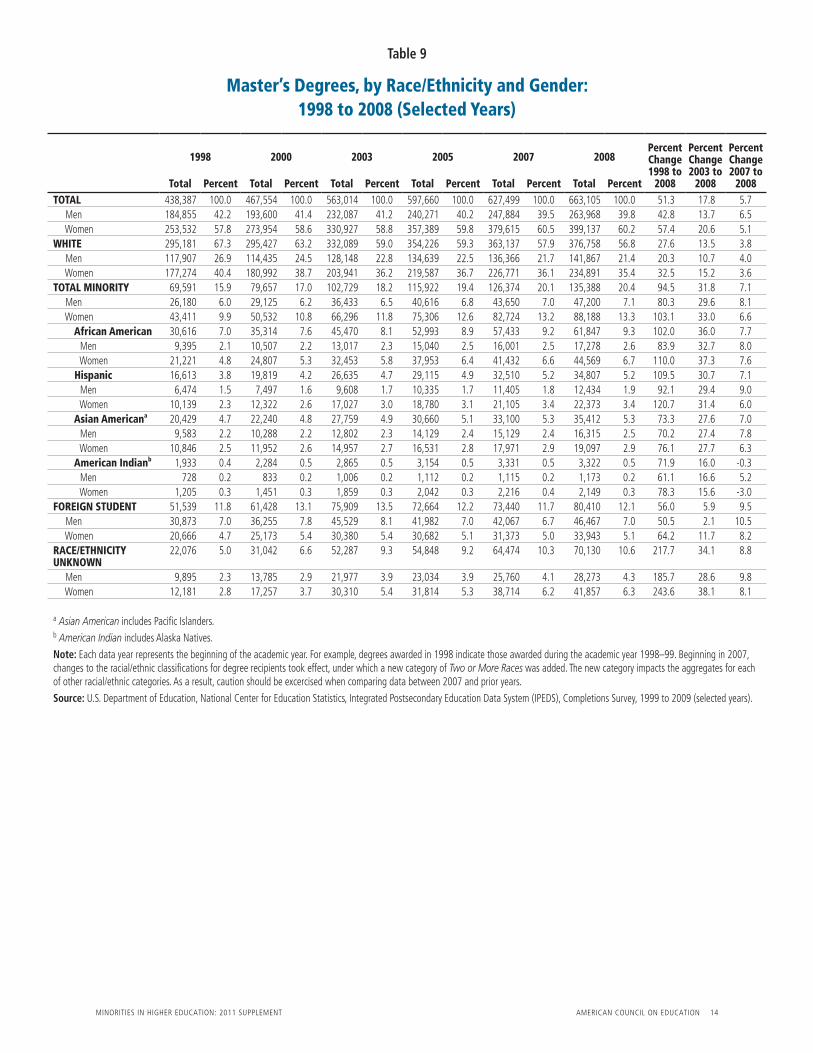
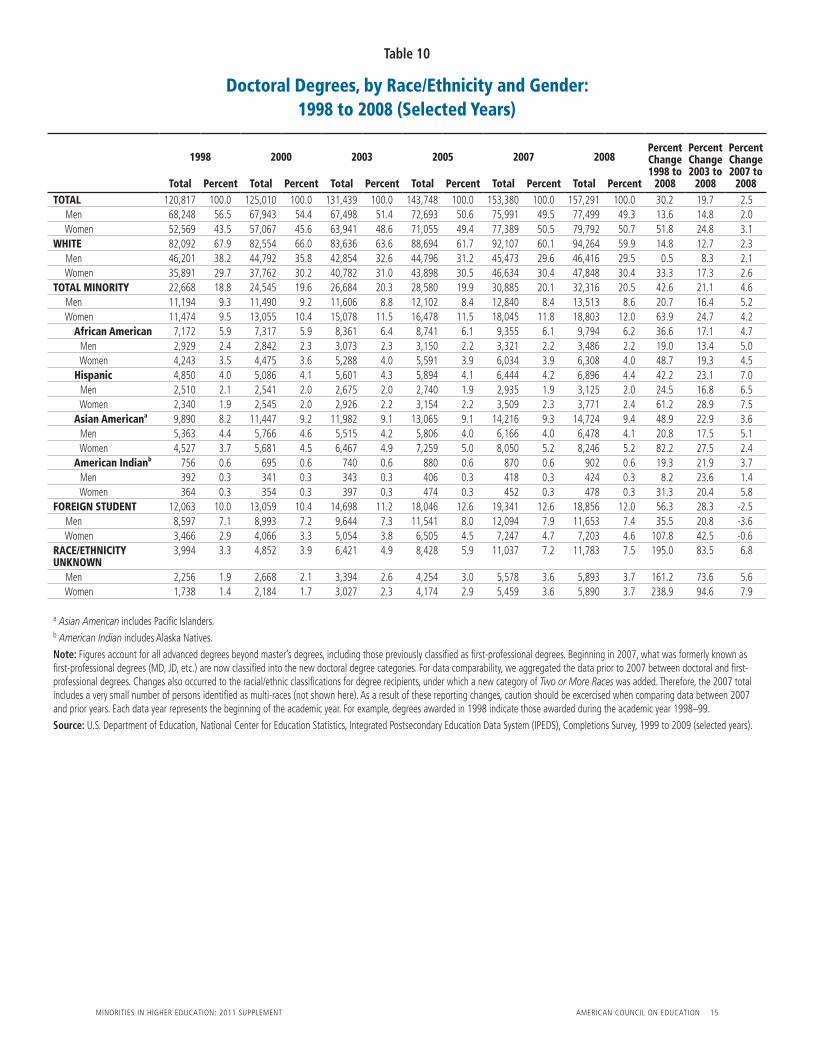
Graduate degrees.
Between 1998 and 2008, the total number of
master’s and doctoral degrees conferred rose
by 51 percent and 30 percent, respectively.5
At each of these levels, the growth in degrees
conferred is attributable largely to minori-
ties. Their gains are notable especially at the
master’s degree level, where the number of
degrees conferred to students of color nearly
doubled.
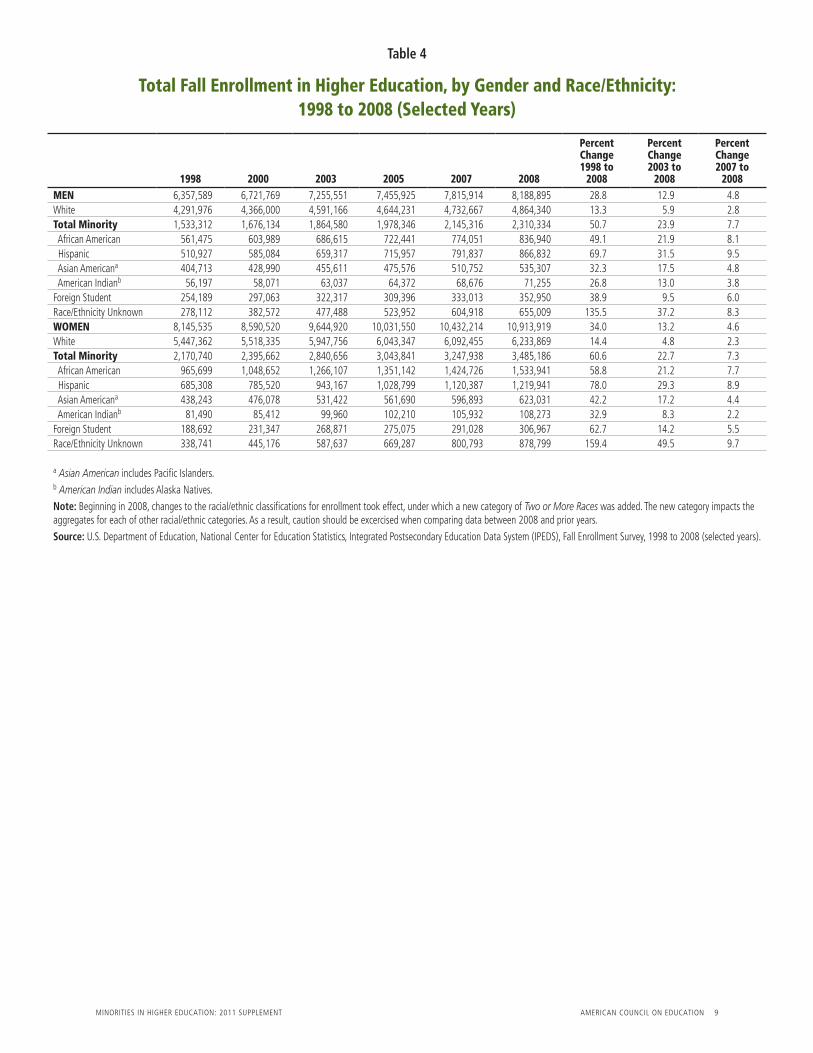
In relation to gender, women primarily
were responsible for the growth in number of
graduate degrees conferred. The total num-
ber of master’s degrees awarded to African-
American and Hispanic women has more than
doubled during the past decade. Doctoral
degrees conferred to women of all races/eth-
nicities grew by four times the rate of growth
for men. Women now receive more doctoral
degrees than men.
METHODOLOGY AND DATA SOURCES
The primary data sources for Minorities in
Higher Education are the U.S. Census Bureau
and the National Center for Education Statistics
of the U.S. Department of Education. This
2011 update uses the most current data avail-
able, from 2008 or 2009, depending on the
data source. Historical data are provided for
10 years or longer.
Since 2008, this report series has includ-
ed information about Asian Americans and
American Indians, making the race/ethnicity
picture more complete. This inclusion was
made possible thanks to a new Census Bureau
survey: the American Community Survey
(ACS), which provides larger sample sizes
for these two groups. In this report, Asian
Americans include Hawaiians and other Pacific
Islanders, and American Indians include
Alaska Natives.
It should be noted that attainment and
enrollment rates for 2006 through 2009 were
drawn from ACS. Prior to 2006, the Current
Population Survey (CPS) was the primary
data source. In analyzing historical trends,
three-year averages for CPS data were used
to obtain a large enough sample size to make
reliable estimates to account for aberrations in
any single year of data.6 Single years of CPS 5 Beginning in 2007, what was formerly known as first-professional degrees (MD, JD, etc.) are now classified into the new doctoral degree categories.6 For three-year averages, the middle year is the one identified. For example, data for 1990 are averages of data for 1989, 1990, and 1991.
MInORITIeS In HIGHeR eDUCaTIOn: 2011 SUppLeMenT aMeRICan COUnCIL On eDUCaTIOn 4
data are presented in the tables accompanying
this summary. The single years of ACS data
are considered adequate.
Unlike other publications (including
the U.S. Department of Education’s Digest
of Education Statistics), this report does not
impute data to account for persons whose
race/ethnicity is unknown. The tables in the
report include a separate category for these
individuals. Because a rapidly growing num-
ber of people do not identify their race/eth-
nicity, it may be misleading to examine the
changing demographics of American higher
education without taking this population into
consideration.
Two recent changes in data reporting for
the National Center for Education Statistics
(NCES), the U.S. Department of Education,
affect this report: new racial/ethnic categories
and elimination of the first-professional degree
category. Beginning with the academic year
2007–08, the racial/ethnic categories included
the new Two or More Races, which has been
expected to cause interruptions in racial/ethnic
trend studies. But the volume of institutions
reporting the new racial/ethnic category con-
tinues to be minimal and thus does not disrupt
the trend analysis. Therefore, the race/ethnic-
ity categories used in this report were kept
essentially the same as before, and the new
category is not displayed separately, though
the individuals reported under the new cat-
egory are accounted for in the totals.
For academic years 2007–08 and 2008–09,
institutions were given the option to con-
tinue to classify first-professional degrees
separately from doctoral degrees, or to report
them under one of the three types of doctoral
degrees: research/scholarship, professional
practice, or other doctoral degrees. In order
to show uninterrupted trend analysis, without
showing trend data for the old with the new
degree classification, the first-professional
degree category was combined with other
doctoral degrees for all years of data shown
for the 10-year trends in this report. Beginning
with academic year 2009–10, all institutions
will be required to conform to the new degree
guidelines.
Lastly, the institutions of higher education
represented in this report are Title IV-eligible,
degree-granting institutions in the 50 states
and the District of Columbia. Our universe of
institutions is similar to that of NCES, with one
exception: The Community College of the Air
Force is not open to the public, and therefore
is excluded from the calculation of national
higher education data for this report.

MInORITIeS In HIGHeR eDUCaTIOn: 2011 SUppLeMenT aMeRICan COUnCIL On eDUCaTIOn 5
table 1
Educational Attainment Rates for Adult Population,by Race/Ethnicity, Gender, and Age: 1989 to 2009
ALL RACES WHITE AFRICAN AMERICAN HISPANICBothSexes Male Female
BothSexes Male Female
BothSexes Male Female
BothSexes Male Female
Percent of Younger Adults Holding a High School Credentiala or Higher (25- to 29-year-olds)
1989 85.5 84.4 86.5 86.0 84.8 87.1 82.2 80.6 83.6 61.0 61.0 61.01990 85.7 84.4 87.0 86.3 84.6 88.1 81.7 81.5 81.8 58.2 56.6 59.91991 85.4 84.9 85.8 85.8 85.1 86.6 81.7 83.5 80.1 56.7 56.4 57.11992 86.3 86.1 86.5 87.0 86.5 87.6 80.9 82.5 79.5 60.9 61.1 60.61993 86.7 86.0 87.4 91.2 90.6 91.8 82.8 85.0 80.9 60.9 58.3 64.01994 86.1 84.5 87.6 91.1 90.0 92.3 84.1 82.9 85.0 60.3 58.0 63.01995 86.8 86.3 87.4 92.5 92.0 93.0 86.5 88.1 85.1 57.1 55.7 58.71996 87.3 86.5 88.1 92.6 92.0 93.1 85.6 87.2 84.2 61.1 59.7 62.91997 87.4 85.8 88.9 92.9 91.7 94.0 86.2 85.2 87.1 61.8 59.2 64.91998 88.1 86.6 89.6 93.6 92.5 94.6 87.6 87.6 87.6 62.8 59.9 66.31999 87.8 86.1 89.5 93.0 91.9 94.1 88.7 88.2 89.2 61.6 57.5 65.92000 88.1 86.7 89.4 94.0 92.9 95.2 86.8 87.6 86.3 62.8 59.3 66.42001 86.8 85.3 88.3 93.4 93.1 93.7 86.7 85.9 87.4 62.4 58.3 67.32002 86.4 84.7 88.1 93.0 92.2 93.8 87.6 85.8 88.9 62.3 60.2 65.02003 86.5 84.9 88.2 93.7 92.8 94.5 88.5 87.4 89.4 61.7 59.7 64.22004 86.6 85.2 88.0 93.3 92.1 94.5 88.7 91.3 86.6 62.4 60.1 65.22005 86.0 85.0 87.0 92.8 91.7 93.8 86.4 86.4 86.5 63.3 63.2 63.4
2006b 85.5 83.2 88.0 91.8 90.5 93.2 83.7 81.1 86.2 65.4 61.7 69.9 2007b 86.3 84.0 88.6 92.1 90.9 93.3 85.6 82.9 88.1 66.6 63.3 70.8 2008b 86.5 84.2 88.9 92.3 91.3 93.4 85.0 82.2 87.7 67.2 63.1 72.2 2009b 87.3 85.2 89.4 93.0 91.9 94.1 85.6 82.4 88.7 68.3 64.9 72.4
Percent of All Adults Holding a High School Credentiala or Higher (25-year-olds and Older)
1989 76.9 77.2 76.6 78.4 78.6 78.2 64.6 64.2 65.0 50.9 51.0 50.71990 77.6 77.7 77.5 79.1 79.1 79.0 66.2 65.8 66.5 50.8 50.3 51.31991 78.4 78.5 78.3 79.9 79.8 79.9 66.7 66.7 66.7 51.3 51.4 51.21992 79.4 79.7 79.2 80.9 81.1 80.7 67.7 67.0 68.2 52.6 53.7 51.51993 80.2 80.5 80.0 84.1 84.5 83.8 70.4 69.6 71.1 53.1 52.9 53.21994 80.9 81.0 80.7 84.9 85.1 84.7 72.9 71.7 73.8 53.3 53.4 53.21995 81.7 81.7 81.6 85.9 86.0 85.8 73.8 73.4 74.1 53.4 52.9 53.81996 81.7 81.9 81.6 86.0 86.1 85.9 74.3 74.3 74.2 53.1 53.0 53.31997 82.1 82.0 82.2 86.3 86.3 86.3 74.9 73.5 76.0 54.7 54.9 54.61998 82.8 82.8 82.9 87.1 87.1 87.1 76.0 75.2 76.7 55.5 55.7 55.31999 83.4 83.4 83.4 87.7 87.7 87.7 77.4 77.2 77.5 56.1 56.0 56.32000 84.1 84.2 84.0 88.4 88.5 88.4 78.9 79.1 78.7 57.0 56.6 57.52001 84.1 84.1 84.2 88.6 88.6 88.6 79.1 79.5 78.8 56.8 55.5 58.02002 84.1 83.8 84.4 88.7 88.5 88.9 79.2 79.0 79.4 57.0 56.1 57.92003 84.6 84.1 85.0 89.4 89.0 89.7 80.3 79.9 80.7 57.0 56.3 57.82004 85.2 84.8 85.4 90.0 89.9 90.1 81.1 80.8 81.2 58.4 57.3 59.52005 85.2 84.9 85.5 90.1 89.9 90.3 81.2 81.1 81.2 58.5 58.0 59.1
2006b 84.1 83.5 84.6 88.9 88.6 89.1 79.5 78.2 80.6 60.3 58.9 61.8 2007b 84.5 84.0 85.1 89.4 89.1 89.7 80.3 79.3 81.1 60.6 59.2 62.1 2008b 85.0 84.3 85.7 90.1 89.7 90.4 80.9 79.4 82.1 60.8 59.1 62.6 2009b 85.3 84.6 85.9 90.4 90.0 90.7 81.6 80.2 82.7 60.9 59.4 62.5
Continued on next page
a This includes high school equivalency credentials such as the GeD® test credential.b Since 2006, data were derived from a different survey and may not be fully compatible with the data for prior years.
note: From 1993 onward, the categories White and African American do not include individuals of Hispanic origin. Hispanics can be of any race.
Source: U.S. Census Bureau, Current population Survey 1989–2005; american Community Survey 2006–09.
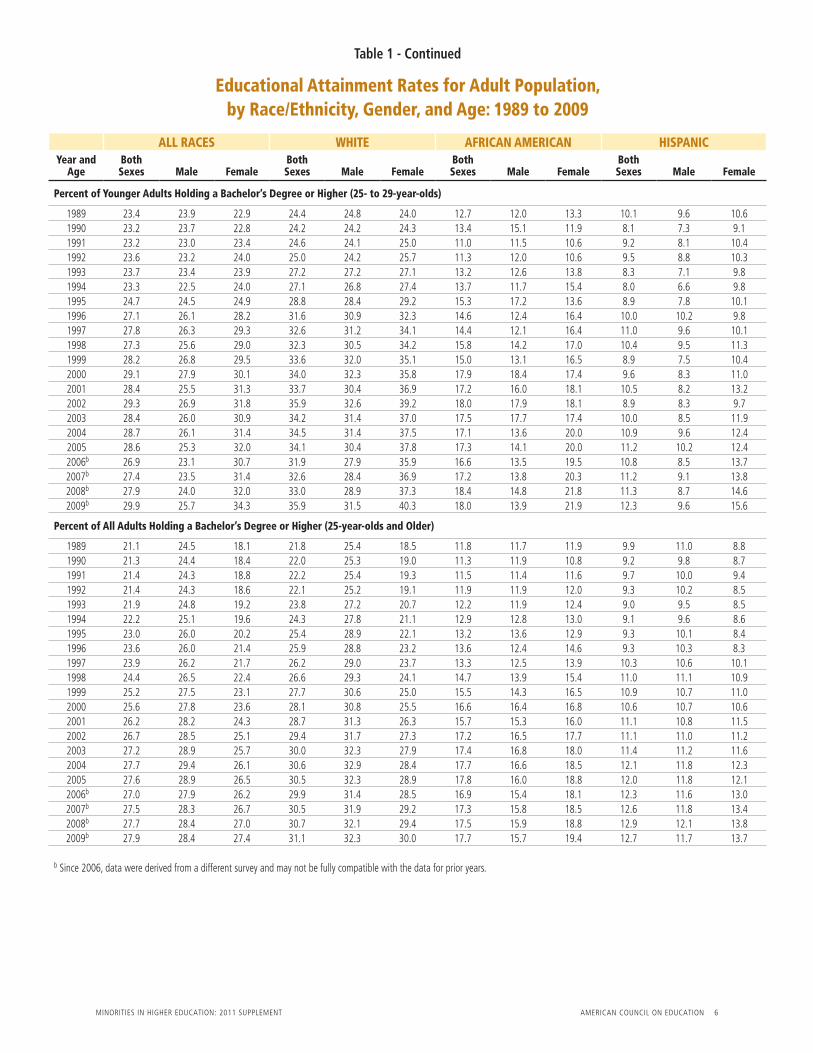
MInORITIeS In HIGHeR eDUCaTIOn: 2011 SUppLeMenT aMeRICan COUnCIL On eDUCaTIOn 6
table 1 - Continued
Educational Attainment Rates for Adult Population,by Race/Ethnicity, Gender, and Age: 1989 to 2009
ALL RACES WHITE AFRICAN AMERICAN HISPANICYear and
AgeBothSexes Male Female
BothSexes Male Female
BothSexes Male Female
BothSexes Male Female
Percent of Younger Adults Holding a Bachelor’s Degree or Higher (25- to 29-year-olds)
1989 23.4 23.9 22.9 24.4 24.8 24.0 12.7 12.0 13.3 10.1 9.6 10.61990 23.2 23.7 22.8 24.2 24.2 24.3 13.4 15.1 11.9 8.1 7.3 9.11991 23.2 23.0 23.4 24.6 24.1 25.0 11.0 11.5 10.6 9.2 8.1 10.41992 23.6 23.2 24.0 25.0 24.2 25.7 11.3 12.0 10.6 9.5 8.8 10.31993 23.7 23.4 23.9 27.2 27.2 27.1 13.2 12.6 13.8 8.3 7.1 9.81994 23.3 22.5 24.0 27.1 26.8 27.4 13.7 11.7 15.4 8.0 6.6 9.81995 24.7 24.5 24.9 28.8 28.4 29.2 15.3 17.2 13.6 8.9 7.8 10.11996 27.1 26.1 28.2 31.6 30.9 32.3 14.6 12.4 16.4 10.0 10.2 9.81997 27.8 26.3 29.3 32.6 31.2 34.1 14.4 12.1 16.4 11.0 9.6 10.11998 27.3 25.6 29.0 32.3 30.5 34.2 15.8 14.2 17.0 10.4 9.5 11.31999 28.2 26.8 29.5 33.6 32.0 35.1 15.0 13.1 16.5 8.9 7.5 10.42000 29.1 27.9 30.1 34.0 32.3 35.8 17.9 18.4 17.4 9.6 8.3 11.02001 28.4 25.5 31.3 33.7 30.4 36.9 17.2 16.0 18.1 10.5 8.2 13.22002 29.3 26.9 31.8 35.9 32.6 39.2 18.0 17.9 18.1 8.9 8.3 9.72003 28.4 26.0 30.9 34.2 31.4 37.0 17.5 17.7 17.4 10.0 8.5 11.92004 28.7 26.1 31.4 34.5 31.4 37.5 17.1 13.6 20.0 10.9 9.6 12.42005 28.6 25.3 32.0 34.1 30.4 37.8 17.3 14.1 20.0 11.2 10.2 12.4
2006b 26.9 23.1 30.7 31.9 27.9 35.9 16.6 13.5 19.5 10.8 8.5 13.7 2007b 27.4 23.5 31.4 32.6 28.4 36.9 17.2 13.8 20.3 11.2 9.1 13.8 2008b 27.9 24.0 32.0 33.0 28.9 37.3 18.4 14.8 21.8 11.3 8.7 14.6 2009b 29.9 25.7 34.3 35.9 31.5 40.3 18.0 13.9 21.9 12.3 9.6 15.6
Percent of All Adults Holding a Bachelor’s Degree or Higher (25-year-olds and Older)
1989 21.1 24.5 18.1 21.8 25.4 18.5 11.8 11.7 11.9 9.9 11.0 8.81990 21.3 24.4 18.4 22.0 25.3 19.0 11.3 11.9 10.8 9.2 9.8 8.71991 21.4 24.3 18.8 22.2 25.4 19.3 11.5 11.4 11.6 9.7 10.0 9.41992 21.4 24.3 18.6 22.1 25.2 19.1 11.9 11.9 12.0 9.3 10.2 8.51993 21.9 24.8 19.2 23.8 27.2 20.7 12.2 11.9 12.4 9.0 9.5 8.51994 22.2 25.1 19.6 24.3 27.8 21.1 12.9 12.8 13.0 9.1 9.6 8.61995 23.0 26.0 20.2 25.4 28.9 22.1 13.2 13.6 12.9 9.3 10.1 8.41996 23.6 26.0 21.4 25.9 28.8 23.2 13.6 12.4 14.6 9.3 10.3 8.31997 23.9 26.2 21.7 26.2 29.0 23.7 13.3 12.5 13.9 10.3 10.6 10.11998 24.4 26.5 22.4 26.6 29.3 24.1 14.7 13.9 15.4 11.0 11.1 10.91999 25.2 27.5 23.1 27.7 30.6 25.0 15.5 14.3 16.5 10.9 10.7 11.02000 25.6 27.8 23.6 28.1 30.8 25.5 16.6 16.4 16.8 10.6 10.7 10.62001 26.2 28.2 24.3 28.7 31.3 26.3 15.7 15.3 16.0 11.1 10.8 11.52002 26.7 28.5 25.1 29.4 31.7 27.3 17.2 16.5 17.7 11.1 11.0 11.22003 27.2 28.9 25.7 30.0 32.3 27.9 17.4 16.8 18.0 11.4 11.2 11.62004 27.7 29.4 26.1 30.6 32.9 28.4 17.7 16.6 18.5 12.1 11.8 12.32005 27.6 28.9 26.5 30.5 32.3 28.9 17.8 16.0 18.8 12.0 11.8 12.1
2006b 27.0 27.9 26.2 29.9 31.4 28.5 16.9 15.4 18.1 12.3 11.6 13.0 2007b 27.5 28.3 26.7 30.5 31.9 29.2 17.3 15.8 18.5 12.6 11.8 13.4 2008b 27.7 28.4 27.0 30.7 32.1 29.4 17.5 15.9 18.8 12.9 12.1 13.8 2009b 27.9 28.4 27.4 31.1 32.3 30.0 17.7 15.7 19.4 12.7 11.7 13.7
b Since 2006, data were derived from a different survey and may not be fully compatible with the data for prior years.
MInORITIeS In HIGHeR eDUCaTIOn: 2011 SUppLeMenT aMeRICan COUnCIL On eDUCaTIOn 7
table2
High School Completion and College Enrollment Rates for Traditional College-aged Population (Aged 18 to 24), by Gender and Race/Ethnicity: 1989 to 2009
ALL RACES WHITE AFRICAN AMERICAN HISPANIC
YearBothSexes Male Female
BothSexes Male Female
BothSexes Male Female
BothSexes Male Female
Percent of 18- to 24-year-olds Holding a High School Credentiala or Higher
1989 81.0 78.7 83.2 82.1 79.9 84.2 76.1 72.2 79.4 55.9 52.5 59.51990 81.7 80.6 82.8 82.5 81.1 83.8 77.0 75.9 77.9 54.5 53.7 55.31991 80.9 78.9 82.9 81.7 79.3 84.1 75.1 71.8 77.9 52.1 47.8 56.81992 82.1 80.0 84.0 83.3 81.2 85.3 74.6 72.3 76.6 57.3 52.0 62.61993 81.7 79.8 83.5 86.8 84.9 88.6 75.1 72.9 77.0 55.9 58.8 53.51994 81.5 79.4 83.6 87.2 85.9 88.4 77.3 73.9 80.3 56.6 53.9 59.91995 80.8 79.3 82.4 86.1 84.4 87.8 77.1 75.4 78.5 58.6 58.0 59.31996 81.6 79.9 83.3 87.4 86.3 88.6 75.9 72.1 79.1 57.5 54.8 60.51997 81.4 79.4 83.5 87.0 85.4 88.5 75.2 72.1 77.9 62.1 58.9 65.91998 80.6 77.7 83.6 86.6 84.7 88.5 73.7 68.1 78.5 59.9 54.3 66.01999 81.1 79.0 83.2 86.7 85.1 88.4 77.1 75.4 78.5 58.8 54.9 63.12000 81.9 79.6 84.1 87.6 86.4 88.9 77.5 74.4 80.2 59.5 54.0 65.62001 81.0 77.9 84.1 86.6 85.3 87.9 77.7 71.4 83.1 62.0 56.1 68.62002 81.5 78.7 84.4 87.0 85.7 88.3 78.3 74.5 81.7 62.6 57.7 68.52003 82.5 79.8 85.1 87.8 85.8 89.8 77.5 74.5 80.1 65.1 60.9 70.02004 82.6 80.3 84.9 87.9 87.1 88.7 77.6 72.5 82.2 65.7 60.3 71.82005 82.9 79.4 86.5 87.8 85.6 90.1 79.2 73.5 84.4 65.9 60.0 72.7
2006b 82.0 79.2 85.1 86.9 85.0 88.8 76.5 72.0 81.1 68.0 63.4 73.4 2007b 82.9 80.4 85.7 87.7 86.2 89.4 77.2 72.8 81.7 69.3 64.5 74.7 2008b 83.0 80.5 85.8 87.7 86.0 89.5 77.7 73.5 82.0 69.7 65.3 74.5 2009b 83.6 81.1 86.3 88.3 86.7 90.0 78.3 74.0 82.8 71.1 66.8 75.9
Percent of 18- to 24-year-olds Currently Enrolled in College
1989 30.9 30.2 31.6 31.8 31.5 32.2 23.5 19.6 26.8 16.1 14.7 17.51990 32.0 32.3 31.8 32.5 32.7 32.3 25.4 26.1 24.8 15.8 15.3 16.41991 33.3 32.9 33.6 34.1 33.0 35.1 23.6 23.1 24.1 18.0 14.0 22.21992 34.4 32.7 36.0 35.2 33.8 36.5 25.2 21.2 28.7 21.3 17.8 24.71993 33.8 33.3 34.3 36.8 36.5 37.1 24.5 22.8 25.9 19.9 19.8 20.01994 34.6 33.1 36.0 38.1 37.0 39.2 27.7 25.5 29.6 18.8 16.5 21.51995 34.3 33.1 35.5 37.9 37.0 38.8 27.5 26.0 28.7 20.7 18.7 22.91996 35.5 34.1 37.0 39.5 38.3 40.6 27.4 25.7 28.8 20.1 16.5 24.01997 36.9 35.0 38.8 40.6 39.3 41.8 29.8 25.3 33.7 22.4 19.2 26.21998 36.6 34.5 38.6 40.6 39.4 41.9 29.8 26.1 32.9 20.4 16.4 24.91999 35.6 34.1 37.0 39.4 38.3 40.6 30.4 28.9 31.6 18.7 15.8 21.92000 35.5 32.6 38.4 38.7 36.2 41.3 30.5 25.2 35.2 21.7 18.5 25.42001 35.7 33.0 38.4 39.3 37.1 41.4 31.2 26.4 35.4 21.2 17.3 25.52002 36.7 33.7 39.7 40.9 38.9 42.8 31.9 26.3 36.9 19.9 16.2 24.42003 37.8 34.3 41.3 41.5 38.5 44.5 32.3 28.2 35.9 23.5 18.3 29.42004 38.0 34.7 41.2 41.7 38.4 45.0 31.8 26.5 36.6 24.7 21.7 28.22005 38.9 35.3 42.5 42.8 39.4 46.1 32.7 28.0 37.1 24.8 20.7 29.5
2006b 39.7 35.6 44.2 44.2 40.3 48.2 32.4 27.7 37.2 25.4 20.7 30.9 2007b 40.8 36.7 45.1 45.2 41.6 49.0 33.1 27.8 38.6 26.9 21.8 32.7 2008b 40.8 36.7 45.2 44.7 40.7 48.9 34.2 29.0 39.5 27.9 23.4 32.9 2009b 41.7 37.3 46.3 45.7 41.6 50.0 35.3 29.6 41.2 29.1 24.5 34.4
a This includes high school equivalency credentials such as the GeD® test credential.b Since 2006, data were derived from a different survey and may not be fully compatible with the data for prior years.
note: From 1993 onward, the categories White and African American do not include individuals of Hispanic origin. Hispanics can be of any race.
Source: U.S. Census Bureau, Current population Survey 1989–2005; american Community Survey 2006–09.
MInORITIeS In HIGHeR eDUCaTIOn: 2011 SUppLeMenT aMeRICan COUnCIL On eDUCaTIOn 8
table 3
Total Fall Enrollment in Higher Education, by Type of Institution and Race/Ethnicity: 1998 to 2008 (Selected Years)
1998 2000 2003 2005 2007 2008
PercentChange1998 to
2008
PercentChange2003 to
2008
PercentChange2007 to
2008ALL INSTITUTIONS 14,503,124 15,312,289 16,900,471 17,487,475 18,248,128 19,102,814 31.7 13.0 4.7white 9,739,338 9,884,335 10,538,922 10,687,578 10,825,122 11,098,209 14.0 5.3 2.5Total Minority 3,704,052 4,071,796 4,705,236 5,022,187 5,393,254 5,795,520 56.5 23.2 7.5 african american 1,527,174 1,652,641 1,952,722 2,073,583 2,198,777 2,370,881 55.2 21.4 7.8 Hispanic 1,196,235 1,370,604 1,602,484 1,744,756 1,912,224 2,086,773 74.4 30.2 9.1 asian americana 842,956 905,068 987,033 1,037,266 1,107,645 1,158,338 37.4 17.4 4.6 american Indianb 137,687 143,483 162,997 166,582 174,608 179,528 30.4 10.1 2.8Foreign Student 442,881 528,410 591,188 584,471 624,041 659,917 49.0 11.6 5.7Race/ethnicity Unknown 616,853 827,748 1,065,125 1,193,239 1,405,711 1,533,808 148.7 44.0 9.1FOUR-YEAR INSTITUTIONS 8,990,956 9,363,858 10,407,553 10,999,420 11,630,198 12,131,436 34.9 16.6 4.3white 6,228,052 6,269,195 6,686,695 6,918,495 7,103,470 7,269,860 16.7 8.7 2.3Total Minority 1,983,275 2,119,986 2,507,459 2,767,569 3,011,170 3,226,979 62.7 28.7 7.2 african american 890,922 945,982 1,109,905 1,215,449 1,307,425 1,412,688 58.6 27.3 8.1 Hispanic 521,268 572,112 721,576 826,341 918,423 993,696 90.6 37.7 8.2 asian americana 502,015 529,487 591,224 635,965 687,675 721,260 43.7 22.0 4.9 american Indianb 69,070 72,405 84,754 89,814 97,647 99,335 43.8 17.2 1.7Foreign Student 387,813 439,604 495,076 492,781 528,315 555,343 43.2 12.2 5.1Race/ethnicity Unknown 391,816 535,073 718,323 820,575 987,243 1,072,227 173.7 49.3 8.6TWO-YEAR INSTITUTIONS 5,512,168 5,948,431 6,492,918 6,488,055 6,617,930 6,971,378 26.5 7.4 5.3white 3,511,286 3,615,140 3,852,227 3,769,083 3,721,652 3,828,349 9.0 -0.6 2.9Total Minority 1,720,777 1,951,810 2,197,777 2,254,618 2,382,084 2,568,531 49.3 16.9 7.8 african american 636,252 706,659 842,817 858,134 891,352 958,183 50.6 13.7 7.5 Hispanic 674,967 798,492 880,908 918,415 993,801 1,093,077 61.9 24.1 10.0 asian americana 340,941 375,581 395,809 401,301 419,970 437,078 28.2 10.4 4.1 american Indianb 68,617 71,078 78,243 76,768 76,961 80,193 16.9 2.5 4.2Foreign Student 55,068 88,806 96,112 91,690 95,726 104,574 89.9 8.8 9.2Race/ethnicity Unknown 225,037 292,675 346,802 372,664 418,468 461,581 105.1 33.1 10.3
a Asian American includes pacific Islanders.b American Indian includes alaska natives.
note: Beginning in 2008, changes to the racial/ethnic classifications for enrollment took effect, under which a new category of Two or More Races was added. The new category impacts the aggregates for each of other racial/ethnic categories. as a result, caution should be excercised when comparing data between 2008 and prior years.
Source: U.S. Department of education, national Center for education Statistics, Integrated postsecondary education Data System (IpeDS), Fall enrollment Survey, 1998 to 2008 (selected years).
MInORITIeS In HIGHeR eDUCaTIOn: 2011 SUppLeMenT aMeRICan COUnCIL On eDUCaTIOn 9
table 4
Total Fall Enrollment in Higher Education, by Gender and Race/Ethnicity:1998 to 2008 (Selected Years)
1998 2000 2003 2005 2007 2008
PercentChange1998 to
2008
PercentChange2003 to
2008
PercentChange2007 to
2008MEN 6,357,589 6,721,769 7,255,551 7,455,925 7,815,914 8,188,895 28.8 12.9 4.8white 4,291,976 4,366,000 4,591,166 4,644,231 4,732,667 4,864,340 13.3 5.9 2.8Total Minority 1,533,312 1,676,134 1,864,580 1,978,346 2,145,316 2,310,334 50.7 23.9 7.7 african american 561,475 603,989 686,615 722,441 774,051 836,940 49.1 21.9 8.1 Hispanic 510,927 585,084 659,317 715,957 791,837 866,832 69.7 31.5 9.5 asian americana 404,713 428,990 455,611 475,576 510,752 535,307 32.3 17.5 4.8 american Indianb 56,197 58,071 63,037 64,372 68,676 71,255 26.8 13.0 3.8Foreign Student 254,189 297,063 322,317 309,396 333,013 352,950 38.9 9.5 6.0Race/ethnicity Unknown 278,112 382,572 477,488 523,952 604,918 655,009 135.5 37.2 8.3WOMEN 8,145,535 8,590,520 9,644,920 10,031,550 10,432,214 10,913,919 34.0 13.2 4.6white 5,447,362 5,518,335 5,947,756 6,043,347 6,092,455 6,233,869 14.4 4.8 2.3Total Minority 2,170,740 2,395,662 2,840,656 3,043,841 3,247,938 3,485,186 60.6 22.7 7.3 african american 965,699 1,048,652 1,266,107 1,351,142 1,424,726 1,533,941 58.8 21.2 7.7 Hispanic 685,308 785,520 943,167 1,028,799 1,120,387 1,219,941 78.0 29.3 8.9 asian americana 438,243 476,078 531,422 561,690 596,893 623,031 42.2 17.2 4.4 american Indianb 81,490 85,412 99,960 102,210 105,932 108,273 32.9 8.3 2.2Foreign Student 188,692 231,347 268,871 275,075 291,028 306,967 62.7 14.2 5.5Race/ethnicity Unknown 338,741 445,176 587,637 669,287 800,793 878,799 159.4 49.5 9.7
a Asian American includes pacific Islanders.b American Indian includes alaska natives.
note: Beginning in 2008, changes to the racial/ethnic classifications for enrollment took effect, under which a new category of Two or More Races was added. The new category impacts the aggregates for each of other racial/ethnic categories. as a result, caution should be excercised when comparing data between 2008 and prior years.
Source: U.S. Department of education, national Center for education Statistics, Integrated postsecondary education Data System (IpeDS), Fall enrollment Survey, 1998 to 2008 (selected years).
MInORITIeS In HIGHeR eDUCaTIOn: 2011 SUppLeMenT aMeRICan COUnCIL On eDUCaTIOn 10
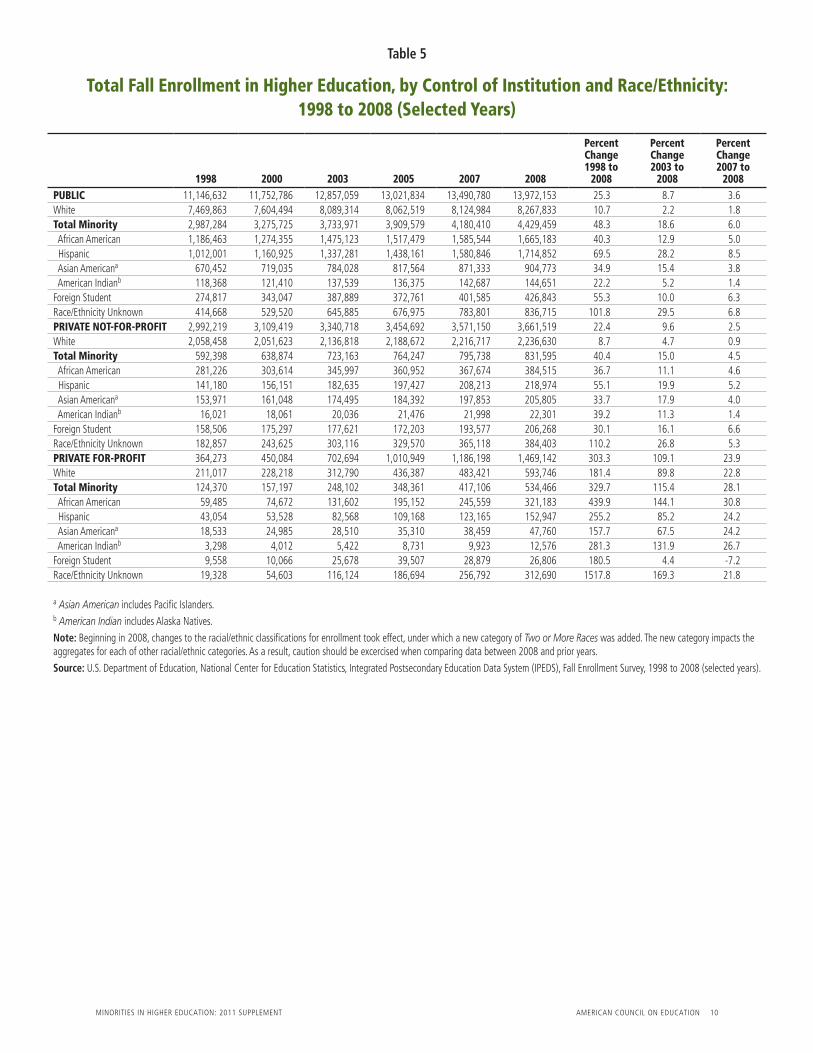
table 5
Total Fall Enrollment in Higher Education, by Control of Institution and Race/Ethnicity: 1998 to 2008 (Selected Years)
1998 2000 2003 2005 2007 2008
PercentChange1998 to
2008
PercentChange2003 to
2008
PercentChange2007 to
2008PUBLIC 11,146,632 11,752,786 12,857,059 13,021,834 13,490,780 13,972,153 25.3 8.7 3.6white 7,469,863 7,604,494 8,089,314 8,062,519 8,124,984 8,267,833 10.7 2.2 1.8Total Minority 2,987,284 3,275,725 3,733,971 3,909,579 4,180,410 4,429,459 48.3 18.6 6.0 african american 1,186,463 1,274,355 1,475,123 1,517,479 1,585,544 1,665,183 40.3 12.9 5.0 Hispanic 1,012,001 1,160,925 1,337,281 1,438,161 1,580,846 1,714,852 69.5 28.2 8.5 asian americana 670,452 719,035 784,028 817,564 871,333 904,773 34.9 15.4 3.8 american Indianb 118,368 121,410 137,539 136,375 142,687 144,651 22.2 5.2 1.4Foreign Student 274,817 343,047 387,889 372,761 401,585 426,843 55.3 10.0 6.3Race/ethnicity Unknown 414,668 529,520 645,885 676,975 783,801 836,715 101.8 29.5 6.8PRIVATE NOT-FOR-PROFIT 2,992,219 3,109,419 3,340,718 3,454,692 3,571,150 3,661,519 22.4 9.6 2.5white 2,058,458 2,051,623 2,136,818 2,188,672 2,216,717 2,236,630 8.7 4.7 0.9Total Minority 592,398 638,874 723,163 764,247 795,738 831,595 40.4 15.0 4.5 african american 281,226 303,614 345,997 360,952 367,674 384,515 36.7 11.1 4.6 Hispanic 141,180 156,151 182,635 197,427 208,213 218,974 55.1 19.9 5.2 asian americana 153,971 161,048 174,495 184,392 197,853 205,805 33.7 17.9 4.0 american Indianb 16,021 18,061 20,036 21,476 21,998 22,301 39.2 11.3 1.4Foreign Student 158,506 175,297 177,621 172,203 193,577 206,268 30.1 16.1 6.6Race/ethnicity Unknown 182,857 243,625 303,116 329,570 365,118 384,403 110.2 26.8 5.3PRIVATE FOR-PROFIT 364,273 450,084 702,694 1,010,949 1,186,198 1,469,142 303.3 109.1 23.9white 211,017 228,218 312,790 436,387 483,421 593,746 181.4 89.8 22.8Total Minority 124,370 157,197 248,102 348,361 417,106 534,466 329.7 115.4 28.1 african american 59,485 74,672 131,602 195,152 245,559 321,183 439.9 144.1 30.8 Hispanic 43,054 53,528 82,568 109,168 123,165 152,947 255.2 85.2 24.2 asian americana 18,533 24,985 28,510 35,310 38,459 47,760 157.7 67.5 24.2 american Indianb 3,298 4,012 5,422 8,731 9,923 12,576 281.3 131.9 26.7Foreign Student 9,558 10,066 25,678 39,507 28,879 26,806 180.5 4.4 -7.2Race/ethnicity Unknown 19,328 54,603 116,124 186,694 256,792 312,690 1517.8 169.3 21.8
a Asian American includes pacific Islanders.b American Indian includes alaska natives.
note: Beginning in 2008, changes to the racial/ethnic classifications for enrollment took effect, under which a new category of Two or More Races was added. The new category impacts the aggregates for each of other racial/ethnic categories. as a result, caution should be excercised when comparing data between 2008 and prior years.
Source: U.S. Department of education, national Center for education Statistics, Integrated postsecondary education Data System (IpeDS), Fall enrollment Survey, 1998 to 2008 (selected years).

MInORITIeS In HIGHeR eDUCaTIOn: 2011 SUppLeMenT aMeRICan COUnCIL On eDUCaTIOn 11
table 6
Undergraduate and Graduate Fall Enrollment in Higher Education, by Race/Ethnicity: 1998 to 2008 (Selected Years)
1998 2000 2003 2005 2007 2008
PercentChange1998 to
2008
PercentChange2003 to
2008
PercentChange2007 to
2008UNDERGRADUATE TOTAL 12,442,492 13,155,393 14,473,884 14,963,964 15,603,771 16,365,738 31.5 13.1 4.9white 8,367,445 8,534,962 9,086,030 9,203,387 9,318,318 9,560,453 14.3 5.2 2.6Total Minority 3,338,014 3,672,027 4,224,766 4,501,445 4,830,035 5,195,780 55.7 23.0 7.6 african american 1,375,113 1,484,276 1,743,859 1,841,458 1,943,510 2,095,528 52.4 20.2 7.8 Hispanic 1,105,911 1,270,254 1,480,534 1,613,871 1,772,731 1,938,671 75.3 30.9 9.4 asian americana 730,478 785,750 850,968 893,993 955,048 997,787 36.6 17.3 4.5 american Indianb 126,512 131,747 149,405 152,123 158,746 163,794 29.5 9.6 3.2Foreign Student 241,111 287,798 312,506 314,417 334,988 359,781 49.2 15.1 7.4Race/ethnicity Unknown 495,922 660,606 850,582 944,715 1,120,430 1,235,241 149.1 45.2 10.2
GRADUATE TOTAL 2,060,632 2,156,896 2,426,587 2,523,511 2,644,357 2,737,076 32.8 12.8 3.5white 1,371,893 1,349,373 1,452,892 1,484,191 1,506,804 1,537,756 12.1 5.8 2.1Total Minority 366,038 399,769 480,470 520,742 563,219 599,740 63.8 24.8 6.5 african american 152,061 168,365 208,863 232,125 255,267 275,353 81.1 31.8 7.9 Hispanic 90,324 100,350 121,950 130,885 139,493 148,102 64.0 21.4 6.2 asian americana 112,478 119,318 136,065 143,273 152,597 160,551 42.7 18.0 5.2 american Indianb 11,175 11,736 13,592 14,459 15,862 15,734 40.8 15.8 -0.8Foreign Student 201,770 240,612 278,682 270,054 289,053 300,136 48.8 7.7 3.8Race/ethnicity Unknown 120,931 167,142 214,543 248,524 285,281 298,567 146.9 39.2 4.7
a Asian American includes pacific Islanders.b American Indian includes alaska natives.
note: Graduate total accounts for enrollment in first-professional programs. Beginning in 2008, what was formerly known as first-professional programs (MD, JD, etc.) are now classified into enrollment in graduate programs. For data comparability, we aggregated the data prior to 2008. Changes also occurred to the racial/ethnic classifications for enrollment, under which a new category of Two or More Races was added. Therefore, the 2008 total includes a very small number of persons identified as multi-races (not shown here). as a result of these reporting changes, caution should be excercised when comparing data between 2008 and prior years.
Source: U.S. Department of education, national Center for education Statistics, Integrated postsecondary education Data System (IpeDS), Fall enrollment Survey, 1998 to 2008 (selected years).

MInORITIeS In HIGHeR eDUCaTIOn: 2011 SUppLeMenT aMeRICan COUnCIL On eDUCaTIOn 12
table 7
Associate Degrees, by Race/Ethnicity and Gender:1998 to 2008 (Selected Years)
1998 2000 2003 2005 2007 2008PercentChange1998 to
2008
PercentChange2003 to
2008
PercentChange2007 to
2008Total Percent Total Percent Total Percent Total Percent Total Percent Total PercentTOTAL 564,285 100.0 576,219 100.0 665,750 100.0 713,512 100.0 747,910 100.0 788,568 100.0 39.7 18.4 5.4 Men 220,082 39.0 230,859 40.1 260,469 39.1 270,406 37.9 281,385 37.6 298,673 37.9 35.7 14.7 6.1 women 344,203 61.0 345,360 59.9 405,281 60.9 443,106 62.1 466,525 62.4 489,895 62.1 42.3 20.9 5.0WHITE 401,146 71.1 394,761 68.5 431,692 64.8 457,329 64.1 466,164 62.3 488,212 61.9 21.7 13.1 4.7 Men 157,249 27.9 159,385 27.7 172,685 25.9 178,369 25.0 179,691 24.0 189,114 24.0 20.3 9.5 5.2 women 243,897 43.2 235,376 40.8 259,007 38.9 278,960 39.1 286,473 38.3 299,098 37.9 22.6 15.5 4.4TOTAL MINORITY 136,963 24.3 149,720 26.0 184,255 27.7 201,731 28.3 218,159 29.2 232,252 29.5 69.6 26.0 6.5 Men 51,492 9.1 57,537 10.0 66,037 9.9 69,943 9.8 76,577 10.2 82,706 10.5 60.6 25.2 8.0 women 85,471 15.1 92,183 16.0 118,218 17.8 131,788 18.5 141,582 18.9 149,546 19.0 75.0 26.5 5.6 African American 56,612 10.0 61,197 10.6 76,896 11.6 84,373 11.8 88,704 11.9 94,499 12.0 66.9 22.9 6.5 Men 19,160 3.4 21,175 3.7 24,326 3.7 25,840 3.6 27,665 3.7 29,730 3.8 55.2 22.2 7.5 women 37,452 6.6 40,022 6.9 52,570 7.9 58,533 8.2 61,039 8.2 64,769 8.2 72.9 23.2 6.1 Hispanic 47,408 8.4 55,033 9.6 68,356 10.3 76,123 10.7 85,095 11.4 91,332 11.6 92.7 33.6 7.3 Men 18,871 3.3 22,392 3.9 26,098 3.9 28,147 3.9 31,371 4.2 34,156 4.3 81.0 30.9 8.9 women 28,537 5.1 32,641 5.7 42,258 6.3 47,976 6.7 53,724 7.2 57,176 7.3 100.4 35.3 6.4 Asian Americana 26,794 4.7 27,099 4.7 31,302 4.7 33,148 4.6 36,102 4.8 38,157 4.8 42.4 21.9 5.7 Men 11,307 2.0 11,764 2.0 13,043 2.0 13,347 1.9 14,750 2.0 15,955 2.0 41.1 22.3 8.2 women 15,487 2.7 15,335 2.7 18,259 2.7 19,801 2.8 21,352 2.9 22,202 2.8 43.4 21.6 4.0 American Indianb 6,149 1.1 6,391 1.1 7,701 1.2 8,087 1.1 8,258 1.1 8,264 1.0 34.4 7.3 0.1 Men 2,154 0.4 2,206 0.4 2,570 0.4 2,609 0.4 2,791 0.4 2,865 0.4 33.0 11.5 2.7 women 3,995 0.7 4,185 0.7 5,131 0.8 5,478 0.8 5,467 0.7 5,399 0.7 35.1 5.2 -1.2FOREIGN STUDENT 10,713 1.9 11,517 2.0 14,536 2.2 13,383 1.9 14,411 1.9 15,204 1.9 41.9 4.6 5.5 Men 4,918 0.9 5,174 0.9 5,780 0.9 5,301 0.7 5,651 0.8 6,099 0.8 24.0 5.5 7.9 women 5,795 1.0 6,343 1.1 8,756 1.3 8,082 1.1 8,760 1.2 9,105 1.2 57.1 4.0 3.9RACE/ETHNICITY UNKNOWN
15,463 2.7 20,221 3.5 35,267 5.3 41,069 5.8 48,978 6.5 51,680 6.6 234.2 46.5 5.5
Men 6,423 1.1 8,763 1.5 15,967 2.4 16,793 2.4 19,389 2.6 20,326 2.6 216.5 27.3 4.8 women 9,040 1.6 11,458 2.0 19,300 2.9 24,276 3.4 29,589 4.0 31,354 4.0 246.8 62.5 6.0
a Asian American includes pacific Islanders.b American Indian includes alaska natives.
note: each data year represents the beginning of the academic year. For example, degrees awarded in 1998 indicate those awarded during the academic year 1998–99. Beginning in 2007, changes to the racial/ethnic classifications for degree recipients took effect, under which a new category of Two or More Races was added. The new category impacts the aggregates for each of other racial/ethnic categories. as a result, caution should be excercised when comparing data between 2007 and prior years.
Source: U.S. Department of education, national Center for education Statistics, Integrated postsecondary education Data System (IpeDS), Completions Survey, 1999 to 2009 (selected years).
MInORITIeS In HIGHeR eDUCaTIOn: 2011 SUppLeMenT aMeRICan COUnCIL On eDUCaTIOn 13
table 8
Bachelor’s Degrees, by Race/Ethnicity and Gender:1998 to 2008 (Selected Years)
1998 2000 2003 2005 2007 2008PercentChange1998 to
2008
PercentChange2003 to
2008
PercentChange2007 to
2008Total Percent Total Percent Total Percent Total Percent Total Percent Total PercentTOTAL 1,196,232 100.0 1,242,621 100.0 1,469,238 100.0 1,562,355 100.0 1,637,783 100.0 1,683,429 100.0 40.7 14.6 2.8 Men 515,709 43.1 530,270 42.7 624,661 42.5 662,146 42.4 697,438 42.6 719,199 42.7 39.5 15.1 3.1 women 680,523 56.9 712,351 57.3 844,577 57.5 900,209 57.6 940,345 57.4 964,230 57.3 41.7 14.2 2.5WHITE 877,359 73.3 889,034 71.5 1,017,656 69.3 1,066,946 68.3 1,105,452 67.5 1,127,163 67.0 28.5 10.8 2.0 Men 382,224 32.0 383,539 30.9 439,835 29.9 461,000 29.5 481,590 29.4 493,598 29.3 29.1 12.2 2.5 women 495,135 41.4 505,495 40.7 577,821 39.3 605,946 38.8 623,862 38.1 633,565 37.6 28.0 9.6 1.6TOTAL MINORITY 245,260 20.5 265,176 21.3 322,527 22.0 355,608 22.8 384,885 23.5 399,202 23.7 62.8 23.8 3.7 Men 96,827 8.1 103,987 8.4 123,858 8.4 136,292 8.7 148,969 9.1 154,618 9.2 59.7 24.8 3.8 women 148,433 12.4 161,189 13.0 198,669 13.5 219,316 14.0 235,916 14.4 244,584 14.5 64.8 23.1 3.7 African American 98,499 8.2 106,635 8.6 126,768 8.6 137,016 8.8 145,333 8.9 149,424 8.9 51.7 17.9 2.8 Men 33,552 2.8 36,349 2.9 42,209 2.9 46,084 2.9 49,473 3.0 50,943 3.0 51.8 20.7 3.0 women 64,947 5.4 70,286 5.7 84,559 5.8 90,932 5.8 95,860 5.9 98,481 5.9 51.6 16.5 2.7 Hispanic 67,219 5.6 74,349 6.0 93,448 6.4 105,971 6.8 120,353 7.3 126,526 7.5 88.2 35.4 5.1 Men 27,327 2.3 29,868 2.4 36,564 2.5 40,909 2.6 46,497 2.8 49,114 2.9 79.7 34.3 5.6 women 39,892 3.3 44,481 3.6 56,884 3.9 65,062 4.2 73,856 4.5 77,412 4.6 94.1 36.1 4.8 Asian Americana 71,189 6.0 75,538 6.1 91,922 6.3 101,896 6.5 108,078 6.6 111,431 6.6 56.5 21.2 3.1 Men 32,681 2.7 34,256 2.8 40,955 2.8 45,202 2.9 48,655 3.0 49,902 3.0 52.7 21.8 2.6 women 38,508 3.2 41,282 3.3 50,967 3.5 56,694 3.6 59,423 3.6 61,529 3.7 59.8 20.7 3.5 American Indianb 8,353 0.7 8,654 0.7 10,389 0.7 10,725 0.7 11,121 0.7 11,821 0.7 41.5 13.8 6.3 Men 3,267 0.3 3,514 0.3 4,130 0.3 4,097 0.3 4,344 0.3 4,659 0.3 42.6 12.8 7.3 women 5,086 0.4 5,140 0.4 6,259 0.4 6,628 0.4 6,777 0.4 7,162 0.4 40.8 14.4 5.7FOREIGN STUDENT 37,967 3.2 39,773 3.2 47,949 3.3 49,516 3.2 47,200 2.9 49,058 2.9 29.2 2.3 3.9 Men 20,538 1.7 20,983 1.7 24,844 1.7 24,777 1.6 23,074 1.4 23,863 1.4 16.2 -3.9 3.4 women 17,429 1.5 18,790 1.5 23,105 1.6 24,739 1.6 24,126 1.5 25,195 1.5 44.6 9.0 4.4RACE/ETHNICITY UNKNOWN
35,646 3.0 48,638 3.9 81,106 5.5 90,285 5.8 99,777 6.1 106,160 6.3 197.8 30.9 6.4
Men 16,120 1.3 21,761 1.8 36,124 2.5 40,077 2.6 43,594 2.7 46,355 2.8 187.6 28.3 6.3 women 19,526 1.6 26,877 2.2 44,982 3.1 50,208 3.2 56,183 3.4 59,805 3.6 206.3 33.0 6.4
a Asian American includes pacific Islanders.b American Indian includes alaska natives.
note: each data year represents the beginning of the academic year. For example, degrees awarded in 1998 indicate those awarded during the academic year 1998–99. Beginning in 2007, changes to the racial/ethnic classifications for degree recipients took effect, under which a new category of Two or More Races was added. The new category impacts the aggregates for each of other racial/ethnic categories. as a result, caution should be excercised when comparing data between 2007 and prior years.
Source: U.S. Department of education, national Center for education Statistics, Integrated postsecondary education Data System (IpeDS), Completions Survey, 1999 to 2009 (selected years).
MInORITIeS In HIGHeR eDUCaTIOn: 2011 SUppLeMenT aMeRICan COUnCIL On eDUCaTIOn 14
table 9
Master’s Degrees, by Race/Ethnicity and Gender:1998 to 2008 (Selected Years)
1998 2000 2003 2005 2007 2008PercentChange1998 to
2008
PercentChange2003 to
2008
PercentChange2007 to
2008Total Percent Total Percent Total Percent Total Percent Total Percent Total PercentTOTAL 438,387 100.0 467,554 100.0 563,014 100.0 597,660 100.0 627,499 100.0 663,105 100.0 51.3 17.8 5.7 Men 184,855 42.2 193,600 41.4 232,087 41.2 240,271 40.2 247,884 39.5 263,968 39.8 42.8 13.7 6.5 women 253,532 57.8 273,954 58.6 330,927 58.8 357,389 59.8 379,615 60.5 399,137 60.2 57.4 20.6 5.1WHITE 295,181 67.3 295,427 63.2 332,089 59.0 354,226 59.3 363,137 57.9 376,758 56.8 27.6 13.5 3.8 Men 117,907 26.9 114,435 24.5 128,148 22.8 134,639 22.5 136,366 21.7 141,867 21.4 20.3 10.7 4.0 women 177,274 40.4 180,992 38.7 203,941 36.2 219,587 36.7 226,771 36.1 234,891 35.4 32.5 15.2 3.6TOTAL MINORITY 69,591 15.9 79,657 17.0 102,729 18.2 115,922 19.4 126,374 20.1 135,388 20.4 94.5 31.8 7.1 Men 26,180 6.0 29,125 6.2 36,433 6.5 40,616 6.8 43,650 7.0 47,200 7.1 80.3 29.6 8.1 women 43,411 9.9 50,532 10.8 66,296 11.8 75,306 12.6 82,724 13.2 88,188 13.3 103.1 33.0 6.6 African American 30,616 7.0 35,314 7.6 45,470 8.1 52,993 8.9 57,433 9.2 61,847 9.3 102.0 36.0 7.7 Men 9,395 2.1 10,507 2.2 13,017 2.3 15,040 2.5 16,001 2.5 17,278 2.6 83.9 32.7 8.0 women 21,221 4.8 24,807 5.3 32,453 5.8 37,953 6.4 41,432 6.6 44,569 6.7 110.0 37.3 7.6 Hispanic 16,613 3.8 19,819 4.2 26,635 4.7 29,115 4.9 32,510 5.2 34,807 5.2 109.5 30.7 7.1 Men 6,474 1.5 7,497 1.6 9,608 1.7 10,335 1.7 11,405 1.8 12,434 1.9 92.1 29.4 9.0 women 10,139 2.3 12,322 2.6 17,027 3.0 18,780 3.1 21,105 3.4 22,373 3.4 120.7 31.4 6.0 Asian Americana 20,429 4.7 22,240 4.8 27,759 4.9 30,660 5.1 33,100 5.3 35,412 5.3 73.3 27.6 7.0 Men 9,583 2.2 10,288 2.2 12,802 2.3 14,129 2.4 15,129 2.4 16,315 2.5 70.2 27.4 7.8 women 10,846 2.5 11,952 2.6 14,957 2.7 16,531 2.8 17,971 2.9 19,097 2.9 76.1 27.7 6.3 American Indianb 1,933 0.4 2,284 0.5 2,865 0.5 3,154 0.5 3,331 0.5 3,322 0.5 71.9 16.0 -0.3 Men 728 0.2 833 0.2 1,006 0.2 1,112 0.2 1,115 0.2 1,173 0.2 61.1 16.6 5.2 women 1,205 0.3 1,451 0.3 1,859 0.3 2,042 0.3 2,216 0.4 2,149 0.3 78.3 15.6 -3.0FOREIGN STUDENT 51,539 11.8 61,428 13.1 75,909 13.5 72,664 12.2 73,440 11.7 80,410 12.1 56.0 5.9 9.5 Men 30,873 7.0 36,255 7.8 45,529 8.1 41,982 7.0 42,067 6.7 46,467 7.0 50.5 2.1 10.5 women 20,666 4.7 25,173 5.4 30,380 5.4 30,682 5.1 31,373 5.0 33,943 5.1 64.2 11.7 8.2RACE/ETHNICITY UNKNOWN
22,076 5.0 31,042 6.6 52,287 9.3 54,848 9.2 64,474 10.3 70,130 10.6 217.7 34.1 8.8
Men 9,895 2.3 13,785 2.9 21,977 3.9 23,034 3.9 25,760 4.1 28,273 4.3 185.7 28.6 9.8 women 12,181 2.8 17,257 3.7 30,310 5.4 31,814 5.3 38,714 6.2 41,857 6.3 243.6 38.1 8.1
a Asian American includes pacific Islanders.b American Indian includes alaska natives.
note: each data year represents the beginning of the academic year. For example, degrees awarded in 1998 indicate those awarded during the academic year 1998–99. Beginning in 2007, changes to the racial/ethnic classifications for degree recipients took effect, under which a new category of Two or More Races was added. The new category impacts the aggregates for each of other racial/ethnic categories. as a result, caution should be excercised when comparing data between 2007 and prior years.
Source: U.S. Department of education, national Center for education Statistics, Integrated postsecondary education Data System (IpeDS), Completions Survey, 1999 to 2009 (selected years).
MInORITIeS In HIGHeR eDUCaTIOn: 2011 SUppLeMenT aMeRICan COUnCIL On eDUCaTIOn 15
table 10
Doctoral Degrees, by Race/Ethnicity and Gender:1998 to 2008 (Selected Years)
1998 2000 2003 2005 2007 2008PercentChange1998 to
2008
PercentChange2003 to
2008
PercentChange2007 to
2008Total Percent Total Percent Total Percent Total Percent Total Percent Total PercentTOTAL 120,817 100.0 125,010 100.0 131,439 100.0 143,748 100.0 153,380 100.0 157,291 100.0 30.2 19.7 2.5 Men 68,248 56.5 67,943 54.4 67,498 51.4 72,693 50.6 75,991 49.5 77,499 49.3 13.6 14.8 2.0 women 52,569 43.5 57,067 45.6 63,941 48.6 71,055 49.4 77,389 50.5 79,792 50.7 51.8 24.8 3.1WHITE 82,092 67.9 82,554 66.0 83,636 63.6 88,694 61.7 92,107 60.1 94,264 59.9 14.8 12.7 2.3 Men 46,201 38.2 44,792 35.8 42,854 32.6 44,796 31.2 45,473 29.6 46,416 29.5 0.5 8.3 2.1 women 35,891 29.7 37,762 30.2 40,782 31.0 43,898 30.5 46,634 30.4 47,848 30.4 33.3 17.3 2.6TOTAL MINORITY 22,668 18.8 24,545 19.6 26,684 20.3 28,580 19.9 30,885 20.1 32,316 20.5 42.6 21.1 4.6 Men 11,194 9.3 11,490 9.2 11,606 8.8 12,102 8.4 12,840 8.4 13,513 8.6 20.7 16.4 5.2 women 11,474 9.5 13,055 10.4 15,078 11.5 16,478 11.5 18,045 11.8 18,803 12.0 63.9 24.7 4.2 African American 7,172 5.9 7,317 5.9 8,361 6.4 8,741 6.1 9,355 6.1 9,794 6.2 36.6 17.1 4.7 Men 2,929 2.4 2,842 2.3 3,073 2.3 3,150 2.2 3,321 2.2 3,486 2.2 19.0 13.4 5.0 women 4,243 3.5 4,475 3.6 5,288 4.0 5,591 3.9 6,034 3.9 6,308 4.0 48.7 19.3 4.5 Hispanic 4,850 4.0 5,086 4.1 5,601 4.3 5,894 4.1 6,444 4.2 6,896 4.4 42.2 23.1 7.0 Men 2,510 2.1 2,541 2.0 2,675 2.0 2,740 1.9 2,935 1.9 3,125 2.0 24.5 16.8 6.5 women 2,340 1.9 2,545 2.0 2,926 2.2 3,154 2.2 3,509 2.3 3,771 2.4 61.2 28.9 7.5 Asian Americana 9,890 8.2 11,447 9.2 11,982 9.1 13,065 9.1 14,216 9.3 14,724 9.4 48.9 22.9 3.6 Men 5,363 4.4 5,766 4.6 5,515 4.2 5,806 4.0 6,166 4.0 6,478 4.1 20.8 17.5 5.1 women 4,527 3.7 5,681 4.5 6,467 4.9 7,259 5.0 8,050 5.2 8,246 5.2 82.2 27.5 2.4 American Indianb 756 0.6 695 0.6 740 0.6 880 0.6 870 0.6 902 0.6 19.3 21.9 3.7 Men 392 0.3 341 0.3 343 0.3 406 0.3 418 0.3 424 0.3 8.2 23.6 1.4 women 364 0.3 354 0.3 397 0.3 474 0.3 452 0.3 478 0.3 31.3 20.4 5.8FOREIGN STUDENT 12,063 10.0 13,059 10.4 14,698 11.2 18,046 12.6 19,341 12.6 18,856 12.0 56.3 28.3 -2.5 Men 8,597 7.1 8,993 7.2 9,644 7.3 11,541 8.0 12,094 7.9 11,653 7.4 35.5 20.8 -3.6 women 3,466 2.9 4,066 3.3 5,054 3.8 6,505 4.5 7,247 4.7 7,203 4.6 107.8 42.5 -0.6RACE/ETHNICITY UNKNOWN
3,994 3.3 4,852 3.9 6,421 4.9 8,428 5.9 11,037 7.2 11,783 7.5 195.0 83.5 6.8
Men 2,256 1.9 2,668 2.1 3,394 2.6 4,254 3.0 5,578 3.6 5,893 3.7 161.2 73.6 5.6 women 1,738 1.4 2,184 1.7 3,027 2.3 4,174 2.9 5,459 3.6 5,890 3.7 238.9 94.6 7.9
a Asian American includes pacific Islanders.b American Indian includes alaska natives.
note: Figures account for all advanced degrees beyond master’s degrees, including those previously classified as first-professional degrees. Beginning in 2007, what was formerly known as first-professional degrees (MD, JD, etc.) are now classified into the new doctoral degree categories. For data comparability, we aggregated the data prior to 2007 between doctoral and first-professional degrees. Changes also occurred to the racial/ethnic classifications for degree recipients, under which a new category of Two or More Races was added. Therefore, the 2007 total includes a very small number of persons identified as multi-races (not shown here). as a result of these reporting changes, caution should be excercised when comparing data between 2007 and prior years. each data year represents the beginning of the academic year. For example, degrees awarded in 1998 indicate those awarded during the academic year 1998–99.
Source: U.S. Department of education, national Center for education Statistics, Integrated postsecondary education Data System (IpeDS), Completions Survey, 1999 to 2009 (selected years).

One Dupont Circle nwwashington, DC 20036-1193
phone: (202) 939-9300Fax: (202) 833-4760
www.acenet.edu