minnesota healthy homes strategic plan · 2 minnesota healthy homes | strategic plan cdc funding...
TRANSCRIPT

MINNESOTA HEALTHY HOMESStrategic Plan
November 2012


Minnesota Healthy Homes | Strategic Plan
Table of Contents
Section Title Page
List of Acronyms i
Executive Summary ii
1 Introduction 1
2 Why Do Healthy Homes Matter? 3
3 Housing and Health in Minnesota: An Overview of Existing Conditions 7
4 Planning Process 11
5 Community Assets for Healthy Homes and Communities 13
6 Mission, Goals, and Strategies 17
7 Evaluation 47
8 Sustainability Plan 49
References 51
Appendix A: Minnesota Health Homes Snapshot 55

Minnesota Healthy Homes | Strategic Plan
List of Acronyms
AHS American Housing SurveyAHH&C Alliance for Healthy Homes and CommunitiesCAP Community Action ProgramsCDC Centers for Disease Control and PreventionCHW Community Health WorkerCOPD Chronic obstructive pulmonary diseaseDHS Department of Human Services (Minnesota)DOE Department of Energy (Federal)DOLI Department of Labor and Industry (Minnesota)ECFE Early Childhood Family EducationEPA Environmental Protection Agency (Federal)FHF Family Housing FundGMHF Greater Minnesota Housing FundHH Healthy HomesHH&C Healthy Homes and CommunitiesHH Plan Healthy Homes Strategic PlanHRA Housing and Redevelopment AgenciesHUD Housing and Urban Development (Federal)IAQ Indoor Air QualityLEED Leadership in Energy and Environmental DesignLPH Local public health departmentsMCHP Minnesota Council of Health PlansMDH Minnesota Department of HealthMHFA Minnesota Housing Finance AgencyMHP Minnesota Housing PartnershipMPCA Minnesota Pollution Control AgencyNAHRO National Association of Housing and Redevelopment OfficialsNCHH National Center for Healthy HousingNGO Non-governmental organizationPCA Pollution Control Agency (Minnesota)ROI Return on InvestmentSHAPE Survey of the Health of All the Population and the EnvironmentSHIP State Health Improvement PlanSRC Sustainable Resources CenterUSDA US Department of Agriculture (provides homeownership and rental
opportunities to rural Americans)
WIC Women, Infants and Children (nutrition program sponsored by MDH)
i

Minnesota Healthy Homes | Strategic Plan ii
The Minnesota Healthy Homes Strategic Plan (HH Plan) was developed with funding from the Centers for Disease Control and Prevention (CDC) through the Minnesota Department of Health (MDH), and reflects the desire to broaden state level lead poisoning prevention programs into healthy homes programs. Many agencies and organizations engaged in health and housing in Minnesota strongly supported this approach, and participated in the planning efforts.
The Sustainable Resources Center (SRC) and the National Center for Healthy Housing (NCHH) conducted the plan development process with support from MDH and the Alliance for Healthy Homes and Communities (Alliance). The process included two statewide meetings and seven regional gatherings and follow up surveys. Participants represented a diverse range of sectors, including public health agencies, affordable housing developers, housing agencies, community planners, community action programs, universities, building and code officials, contractors, environmental advocacy organizations, early childhood educators, local governments, health insurers, and foundations.
The 2012 Federal Budget cut CDC funds for lead/healthy homes by 94%. Several months into the process CDC officially notified MDH that there would be no funding beyond the first year. As a result, this plan was developed with an assumption that the future MDH role in promoting and implementing the plan may be very limited. However, Minnesota has an extensive base of people, programs, and organizations that can contribute to healthy homes and communities, with over 500 existing community assets and resources identified as part of the HH Plan development process.
Why Do Healthy Homes Matter?
The connection between inadequate housing and ill health is well established. A large body of scientific research has demonstrated that numerous housing-related hazards pose a threat to human health. Unhealthy housing is costly in terms of economics, social capital, and personal health.
The healthy homes approach uses well-documented, evidence-based interventions to address these housing-related health hazards. A “healthy home” is a home designed, constructed, maintained, or rehabilitated in a manner that supports the health of residents. The healthy homes approach focuses on the “Seven Principles of Healthy Homes” established by NCHH: dry, clean, well ventilated, pest-free, contaminant free, safe, and maintained.
A healthy homes approach is more efficient and has a greater public health impact than single issue-focused programs because it promotes interrelated strategies that include: (1) Changes in structural conditions and building practices; (2) Modification of resident and property owners’
Executive Summary

Minnesota Healthy Homes | Strategic Planiii
behaviors; and (3) Development or revision of policies, legislation, and service systems to enable healthy housing practices.
Housing and Health in Minnesota
Homes that are poorly constructed or maintained can have a significant impact on the health and safety of residents. In addition, low-income populations and communities of color suffer dispro-portionately from housing quality concerns. Risk factors associated with poor housing quality and increased risk of housing-related illness include age of housing, poverty, geographic location, age of residents, and race and ethnicity. Asthma exacerbation, childhood lead exposure, radon ex-posure, and unintentional injuries are four examples of significant housing-related health issues associated with unhealthy housing conditions.
Promoting Respiratory Health
Asthma is a chronic disease in which the airways of the lungs become inflamed or narrowed, re-sulting in disruptions to normal breathing patterns and significant health consequences. Asthma disproportionately impacts low-income families and people of color living in substandard hous-ing. One in fourteen children and one thirteen adults in Minnesota report that they currently have asthma.
Preventing Lead Poisoning
Housing conditions associated with increased risk of lead poisoning in homes built before 1978 include chipping, peeling, and flaking paint on the exterior and interior of a home; paint on fric-tion-impact surfaces such as windows, doors, stairs, and railings; water leaks, moisture problems; and renovation of old houses without proper use of lead-safe work practices and clean-up. In 2011 there were 3,363 children in Minnesota who had a blood lead level above the CDC reference level of 5 micrograms lead per deciliter of whole blood (μg/dL).
Improving In-Home Safety
Between 1990 and 2008, the unintentional injury mortality rate for children ages 0-14 in Minne-sota declined by 38%. However, falls remain the leading cause of emergency department-treated injury for children in Minnesota. The unintentional fall death rate among adults ages 65 and older in Minnesota is substantially higher than the national rate. Residential fire deaths represented 80% of total fire deaths in 2011. Smoke alarms were absent or inoperable in 29% of residential fire deaths in 2011.
Creating Dry, Pest-and Contaminant-Free Homes
Pests and mold can exacerbate asthma and contribute to allergies and other respiratory illnesses. American Housing Survey data for the Minneapolis-St. Paul metro area demonstrate that over 10% of housing units have water leaks from the outside, and nearly 8% have interior leaks.

Minnesota Healthy Homes | Strategic Plan iv
Gases in indoor air such as carbon monoxide (CO) and radon pose threats to health, including accidental death and increased risk of cancer.
Mission, Goals, and Strategies
To help guide current and future healthy homes efforts the consensus mission statement from the first statewide planning meeting was:
Promote, support and provide healthy homes for all Minnesotans
The mission statement reflects the range of activities and the various roles needed to make healthy homes a reality for Minnesotans. The participants in the first statewide planning meeting also identified seven goals that describe a practical approach for implementing healthy homes in Minnesota. In subsequent meetings around the state attendees created specific strategies and action steps to accomplish the seven goals. Together, the goals, strategies and associated action steps provide a roadmap for healthy homes efforts in Minnesota for the next several years. The seven goals are:
• Connect People, Programs and Information• Increase Public Awareness and Education• Adopt Safe, Healthy Housing Policies and Corresponding Regulations• Implement Widespread and Comprehensive Healthy Housing Inspections• Develop Capacity in the Medical/Health Care Delivery System • Provide Increased, Sustainable Funding for Healthy Homes• Ensure Evaluation Infrastructure and Documented Outcomes
Sustainability
Sustainability for healthy homes means the capacity to support and maintain healthy homes activities over time. This requires long-term strategies such as building on existing partnerships and capacity, leveraging funding, and coordinating existing investments in healthy housing. Strategies to provide increased and sustainable funding for healthy homes in Minnesota include:
1. Support and expand funding for housing rehabilitation and new construction for low and moderate income families from existing local, state and federal sources.
2. Access new investments to improve health and housing conditions where there is an established return on investment in terms of health status and costs.
3. Coordinate investments and activities across sectors so that healthy homes improvements are leveraged.

Minnesota Healthy Homes | Strategic Planv
There is a growing understanding of the impact of unhealthy housing, the critical role housing plays in addressing health and educational disparities, and the importance of addressing home environments in order to improve certain health conditions. The creation of the Alliance reflects this growing interest.
Finally, healthy housing is not a program but a way of doing business so that healthy housing is the expectation. The recommendations in this plan provide all stakeholders with action steps they can take to create the expectation of healthy homes for everyone.

SECTION
1 Introduction
Minnesota Healthy Homes | Strategic Plan 1
The Minnesota Healthy Homes Strategic Plan (HH Plan) was developed with funding provided by the Centers for Disease Control and Prevention (CDC) through the Minnesota Department of Health (MDH), and reflects the desire to broaden lead poisoning prevention programs into more encompassing healthy homes programs. MDH distributed a request for proposals to solicit assistance in preparing the HH Plan consistent with requirements of the CDC in October 2011. Final proposals were due to MDH in early November 2011.
The Sustainable Resources Center (SRC) was chosen as the best applicant for the proposed creation of the HH Plan due to their wide ranging network within the housing community and their collaboration with the National Center for Healthy Housing (NCHH). SRC is also helping to create an Alliance for Healthy Homes and Communities in Minnesota (funded by the Blue Cross/Blue Shield Foundation) which has similar goals of identifying, prioritizing, and implementing healthy housing strategies. A grant agreement containing a specific work plan, deliverables, timelines, and collaborators became effective in December 2011. Initial meetings were held in January 2012 between MDH, SRC, NCHH, and Alliance developers.
The Alliance for Healthy Homes and Communities
The Alliance was formed in the spring of 2011 by several housing and healthy homes non-profit organizations to advance the cause of healthy homes and communities in Minnesota. With funding provided by the Blue Cross / Blue Shield of Minnesota Foundation the Alliance had already planned to conduct a broad based series of regional planning meetings and a statewide convening during the first half of 2012. The close connection between the development of the HH Plan and the Alliance project was apparent from the inception of the HH Plan project. For more on the Alliance, see: http://alliancehhc.org/.
The Alliance and the HH Plan project worked together to jointly promote, sponsor, and conduct Regional Gatherings around Minnesota. The gatherings addressed both healthy homes and healthy communities issues and drew participants with interest and experience in one or both areas. As healthy homes efforts are developed across the state the Alliance is anticipated to identify interested collaborators and promote building relationships between people, programs, and sectors. The HH Plan will serve as a source of priorities and projects for Alliance members.

Minnesota Healthy Homes | Strategic Plan2
CDC Funding Cut
The HH Plan was funded with support from the CDC Healthy Homes and Lead Poisoning Prevention Program, as part of the first year of an expected three year grant (award 1 UE 1EH000876-01). However, the 2012 Federal Budget eliminated over 90% of the CDC funds for the program area. Several months into the process CDC officially notified MDH that there would be no funding beyond the first year.
As a result, this plan was developed with an assumption that the future MDH role in promoting and implementing the plan may be very limited. The potentially limited role of public health agencies had a significant effect on strategies and action plans because there is currently no public or private agency in a similarly effective position to take the lead on promoting and implementing the recommendations included in the HH Plan.
Distribution
This HH Plan will be posted on the MDH and SRC websites. A limited number of hard copies will be produced, but the primary distribution method will be electronic. Notices of its availability will be included in routine mailings to local public health departments and on Alliance partner websites. A joint press release will also be prepared from MDH, SRC, and NCHH outlining the HH Plan and recommendations for next steps.
Due to the collaborative nature of work in healthy homes, changing funding environment for all public health programs, and changing demographics of high risk populations, the HH Plan is intended to be a “living” document that is reviewed and updated regularly. This initial version is neither exhaustive nor definitive and will be amended in the future to better reflect the evolving public health and housing environments. Links to primary literature sources are provided in the text and reference section to facilitate further study.

SECTION
Minnesota Healthy Homes | Strategic Plan 3
The connection between housing and health is well established. Unhealthy housing is costly in terms of economics, social capital, and personal health. The U.S. Department of Housing and Urban Development (HUD) and NCHH have summarized a large body of scientific research demonstrating that numerous housing-related hazards pose a threat to human health (HUD, 2011; NCHH, 2009). Hazards are frequently grouped into three major categories (HUD, 2011):
• Indoor biological contamination: Inadequate design and maintenance of housing can result in conditions that facilitate the growth of mold and bacteria as well as infestation of rats, mice, and other pests.
• Indoor chemical contamination: A number of indoor chemical contaminants, including lead, environmental tobacco smoke, carbon monoxide (CO), radon, volatile organic compounds (VOC), asbestos, and pesticides, pose serious threats to human health.
• Structuralandsafetydeficiencies: Inadequate and deferred maintenance of homes , inadequate design of new homes, and lack of important safety devices can result in preventable injuries, illness, and death in the home.
In addition to the three major categories, housing conditions such as lighting and noise have been linked to psychological health. Poor lighting has been linked with depression and mood disorders, such as seasonal affective disorder. Adequate lighting is also important in allowing people to see unsanitary conditions and to prevent injury, thus contributing to a healthier and safer environment. Noise can cause hearing impairment, sleep disturbance, negative cardiovascular and psycho-physiologic effects, psychiatric symptoms, and poor fetal development. In addition, noise can reduce attention to tasks, impede speech communication, hamper performance of daily tasks, increase fatigue, and cause irritability.
Hazardous conditions can negatively impact the health and safety of residents and can be highly interrelated (e.g. structural deficiencies often lead to indoor biological contamination). The following section presents an overview of four health-housing connections: asthma and respiratory health; childhood lead exposure and other chemical exposures; radon exposure; and unintentional injuries. Minnesota-specific information is presented in Section 3.
Asthma and Respiratory Health
Asthma is a chronic disease in which the airways of the lungs become inflamed or narrowed, resulting in disruptions to normal breathing patterns and significant health consequences. Asthma disproportionately impacts low-income families and people of color living in substandard housing because of the presence of pests, mold, environmental tobacco smoke, and other asthma triggers. Mold, pests, and other allergens can trigger asthma, which is the leading cause of school and work absences, emergency department visits, and hospitalizations in the United States
Why Do Healthy Homes Matter?2

Minnesota Healthy Homes | Strategic Plan4
(American Lung Association, 2011). Asthma results in annual costs of $20.7 billion to the nation (American Lung Association, 2011). Exposure to mold and dampness within homes contributes to an estimated 21% of all asthma cases in the United States (Mudarri & Fisk, 2007). In addition, dampness can lead to insomnia, allergies, headache, cough, and other respiratory health issues (Eggleston, et al., 2005; Kercsmar, et al., 2006). Chronic obstructive pulmonary disease (COPD) is the fourth-leading cause of death in the United States (MDH, Undated). COPD may be exacerbated by environmental exposures, including tobacco smoke and air pollutants. The highest COPD hospitalization rates are seen among older adults.
Childhood Lead Exposure and Other Chemical Exposures
Housing conditions associated with increased risk of lead poisoning include chipping, peeling, and flaking paint on the exterior and interior of a home; lead paint on friction-impact surfaces such as windows, doors, stairs, and railings; water leaks, moisture problems; and renovation of old houses without proper use of lead-safe work practices and clean-up. The connections between lead exposure and negative health impacts include neurological damage, decreased IQ, increased blood pressure, anemia, gastrointestinal issues, stunted growth, seizures, coma, and – at very high levels – death (Gould, 2009; Fewtrell, Pruss-Ustan, Landrigan, & Ayuso-Mateos, 2004). Even low levels of lead exposure can have a lasting impact on a child’s IQ, likelihood of having a learning disability, and educational attainment (Chandramouli, Steer, Ellis, & Emond, 2009; Miranda, Kim, Galeano, Paul, Hull, & Morgan, 2007; Miranda, Maxson, & Kim, 2010). No safe blood lead level in children has been identified, emphasizing the importance of primary prevention, “a strategy that emphasizes the prevention of lead exposure, rather than a response to exposure after it has taken place (Advisory Committee on Childhood Lead Poisoning Prevention, 2012).” The CDC reference value for childhood lead exposure provides a way to compare an individual child’s blood lead level to a population of children the same age (Advisory Committee on Childhood Lead Poisoning Prevention, 2012). The current reference value is 5 micrograms of lead per deciliter of blood (μg/dL) and will shift with population blood lead levels. More than 500,000 U.S. children ages 1-5 have BLLs greater than 5 μg/dL (Portier, 2012).
The U.S. Environmental Protection Agency (EPA) estimates that 74% of U.S. households use pesticides indoors to prevent or exterminate pests (EPA, 2004). Pesticides can cause a wide range of health problems, including acute and persistent injury to the nervous system, injury to reproductive systems, birth defects, and cancer (NCHH, Undated).

Minnesota Healthy Homes | Strategic Plan 5
Radon Exposure
Radon is a colorless, odorless gas that occurs naturally in rock and soil. It can enter the house through building foundations as well as through water systems when groundwater is the main water supply (EPA, 2003). Radon is the leading cause of lung cancer among nonsmokers and the second leading cause of lung cancer overall (EPA, 2003). Nearly one in fifteen homes in the U.S. has radon levels above the EPA’s recommended action level of 4 picocuries per liter (pCi/L) (EPA, Undated). Recent recommendations issued by the World Health Organization recommend taking action to reduce indoor radon levels at 2.0 pCi/L.
Unintentional Injuries
Inadequate and deferred maintenance of homes, inadequate design of new homes, and lack of important safety devices can result in preventable injuries, illness, and death in the home (HUD, 2011). Falls alone account for over half of all unintentional home injury deaths. Very young children and adults over age 70 are the most likely to be hurt at home. Poorly designed homes can also provide an unsafe or unsuitable environment for older adults and people with a disability. Because of falls, many elders experience devastating consequences such as broken bones and head injuries. Each year, approximately 18,000 injury deaths and 12 million non-fatal injuries occur nationally within homes (Runyan, et al., 2005a; Runyan, et al., 2005b). Falls account for over half of all unintentional injury deaths within the home (Runyan, et al., 2005b); fires, drowning, poisoning, suffocation, choking, and guns are other leading causes of death in the home.
Using a Healthy Homes Approach
The healthy homes approach uses well-documented, evidence-based interventions to address these housing-related health hazards (HUD, 2011; NCHH, 2009). A “healthy home” is a home designed, constructed, maintained, or rehabilitated in a manner that supports the health of residents. The healthy homes approach focuses on the “Seven Principles of Healthy Homes,” which are:
Keep it:1. Dry2. Clean3. Safe4. Ventilated5. Pest-Free6. Contaminant-Free7. Maintained

Minnesota Healthy Homes | Strategic Plan6
A healthy homes approach is more efficient than single issue-focused programs because it promotes cost-efficient housing interventions that address multiple, interrelated health hazards in the home, including: (1) Changes in structural conditions and building practices; (2) Modification of resident and property owners’ behaviors; and (3) Development or revision of policies, legislation, and service systems to enable healthy housing practices (HUD, 2011). Extensive evidence (NCHH, 2009) exists to support the implementation of specific healthy homes interventions, including:
• Multi-faceted, tailored asthma interventions• Integrated pest management• Moisture intrusion elimination• Radon air mitigation through active sub-slab depressurization• Smoking bans• Lead hazard control• Installation of working smoke alarms• Pre-set safe temperature hot water heaters
The existing evidence base demonstrating the connections between housing and health and the effectiveness of various healthy homes interventions provide important context for the identified priority action strategies outlined in this plan.
In 2012, MDH funded seven local public health boards to conduct healthy homes implementation activities. The agencies funded were: City of Minneapolis, City of Bloomington, Southwest Health and Human Services, Meeker/McLeod/Sibley Counties, St. Paul/Ramsey County, Horizon Community Health Board, and Rice County. They tested a home assessment tool, formed local coalitions, were trained in basic healthy homes strategies, and helped to identify best practices for implementing a healthy homes program. Minnesota recommendations were consistent with approaches supported by NCHH, HUD, and CDC.

SECTION
Minnesota Healthy Homes | Strategic Plan 7
On average Americans spend approximately 90% of their time indoors with the largest percentage of time spent within their homes. Your home provides your family with comfort and protection; but your home may also have hidden health hazards. Creating a healthier home, whether in new construction or in existing housing, has obvious benefits to your family’s health and well-being. The Surgeon General’s Call to Action to Promote Healthy Homes (2009) states that a comprehensive, coordinated approach to healthy homes will result in the greatest public health impact.
This section presents an overview of key health, housing, and community indicators for priority areas of MDH, including promoting respiratory health, preventing lead poisoning, preventing injury, and reducing exposure to contaminants, such as radon, in the home. Additional data on demographics, housing quality, neighborhood quality, and built-environment-related health outcomes in Minnesota are provided in Appendix A. The available data provide the foundation for understanding priority health and housing issues in Minnesota and priority action strategies outlined in this plan.
Housing and Other Demographic Information
Housing and Health in Minnesota - An Overview of Existing Conditions3
Homes that are poorly constructed or maintained can have a significant impact on the health and safety of residents. In addition, low-income populations and communities of color suffer disproportionately from housing quality concerns. Risk factors associated with poor housing quality and increased risk of housing-related illness include age of housing, poverty, geographic location, age of residents, and race and ethnicity. Across the state, 27.1% of Minnesota’s housing stock was built prior to 1950, and an additional 6.6% was built between 1950 and 1979 (U.S. Census Bureau, 2010). Many counties in southwestern Minnesota have higher percentages of pre-1950 housing than other parts of the state. Across the state, 7.5% of families and 11.6% of individuals live below the federal poverty level (U.S. Census Bureau, 2010). The first wave of the Baby Boom Generation began turning 65 in January 2011. The ratio of workers to retirees will fall from five per retiree in 2010, to four per retiree in 2020 to only three in 2030 (MN State Demographer, 2011). In 2005 the population of Minnesota was 86% white, 4% black, 4% Asian, 4% Latino, 1% American Indian, and 1% listed two or more races.
Image from the Metropolitan Design Center Image Bank. Used with permission.

Minnesota Healthy Homes | Strategic Plan8
Among children born in 2006 in Minnesota, 275 had a BLL of 10 μg/dL or greater (MDH,
2012). In 2011 there were 3,363 children less than 72 months old in Minnesota with blood lead test results above 5 ug/dL, which is the new CDC reference value.
Of children born between 2000 and 2006 in Minnesota, nearly 300,000 were tested for lead poisoning (Minnesota Department of Health, 2000-2006). Of these children, 2,651 were found to have a blood lead level of 10 micrograms per deciliter (mcg/dL) or greater. Minnesota has made great strides in increasing screening for lead poisoning in recent years. Over 76% of the children born in 2006 were tested for lead poisoning prior to 36 months of age, compared to only 42.2% of children born in 2000 (MDH, 2000-2006).
Preventing Lead Poisoning
Promoting Respiratory HealthOne in 14 children and one in 13 adults in Minnesota report that they currently have asthma. It is estimated that asthma in Minnesota costs $240 million in hospitalizations, emergency department visits, office visits, and medications, and an additional $181 million in lost school and work days, for a total estimated economic impact of $421 million in one year (MDH, 2012). In Minnesota, children less than 5 years old have the highest rate of hospitalizations and emergency department visits (MDH, 2012).
In Minnesota, adults ages 75-84 have the highest COPD hospitalization rates (91.9 per 10,000 people) (MDH, 2009).
Improving In-Home SafetyBetween 1990 and 2008, the unintentional injury mortality rate for children ages 0-14 in Minnesota declined by 38% (Kinde, 2011). However, falls remain the leading cause of emergency department-treated injury for children in Minnesota. Over 88,000 falls statewide were reported to the Minnesota Injury Data Access System in 2006. Additionally, the unintentional fall death rate among adults ages 65 and older in Minnesota is substantially higher than the rate in the U.S., 84.19 per 100,000 compared to 48.72 per 100,000 (CDC, 2011).

Minnesota Healthy Homes | Strategic Plan 9
Between 2010 and 2011, the number of fire deaths in Minnesota increased by 44% (Minnesota Department of Public Safety, 2011). Of the 56 fire fatalities in Minnesota in 2011, 80% occurred in residences (Minnesota Department of Public Safety, 2011). Smoke alarms, which have been required in every dwelling in Minnesota since 1993, were absent or inoperable in 29% of the residential fire deaths in 2011. In another 22%, it was not possible to determine if a smoke detector was present or operating.
One in three homes in
Minnesota has radon levels
above the EPA recommended action level.
Creating Dry, Pest- and Contaminant-Free Homes
In 2011, there were 56 fire fatalities in Minnesota. This is a 44% increase compared to the 2010 total of 39 fatalities. Residential fire deaths represented 80% of total fire deaths in 2011. Smoke alarms were absent or inoperable in 29% of the residential fire
deaths in 2011.
Pests and mold can exacerbate asthma and contribute to allergies and other respiratory illnesses. American Housing Survey (AHS) data provide a snapshot of housing quality nationally; however the survey only focuses on metropolitan statistical areas. AHS data for the Minneapolis-St. Paul metro area demonstrate that over 10% of housing units have water leaks from the outside, and nearly 8% have interior leaks (U.S. Census Bureau, 2009). Minneapolis-St. Paul metro residents report slightly higher rates of signs of mice than the U.S. average (6.1% compared to 5.5%), and lower rates of signs of rats (0.1% compared to 0.7%) (U.S. Census Bureau, 2009).

Minnesota Healthy Homes | Strategic Plan10
Building on SuccessesMinnesota has demonstrated tremendous success through its existing healthy homes efforts and aims to build upon these successes to address the priority housing and health concerns. For example:
• Minnesota dramatically increased screening for lead poisoning in the last decade. Over 76% of the children born in 2006 were tested for lead poisoning prior to 36 months of age, compared to only 42.2% of children born in 2000.
• Minnesota’s injury prevention efforts have also resulted in a 38% decline of the unintentional injury mortality rate for children ages 0-14 between 1990 and 2008.
• Minnesota’s smoke-free policy adoption resulted in a 10.5% decline between 2003 and 2007 in the number of Minnesotans exposed to secondhand smoke.
• All new homes in Minnesota must be constructed with appropriate mitigation infrastructure to reduce exposure to radon.
Gases in indoor air such as carbon monoxide (CO) and radon pose threats to health, including accidental death and increased risk of cancer. Although unintentional CO poisoning is preventable, approximately 131 Minnesota residents died from unintentional, non-fire related CO poisoning between 2000 and 2008 (Minnesota Department of Health, 2000-2008). During the same time period, there were approximately 35 hospitalizations and 250 emergency department visits each year for unintentional, non-fire related CO poisoning (Minnesota Department of Health, 2000-2008). One in three homes in Minnesota has radon levels above the EPA recommended action level, which is five time higher than the national average.

SECTION
Minnesota Healthy Homes | Strategic Plan 11
The HH Plan development process included two statewide meetings, seven regional gatherings and follow up surveys. A multitude of stakeholder groups were involved, including public health agencies, affordable housing developers, housing agencies, community planners, community action programs, universities, building and code officials, contractors, environmental advocacy organizations, early childhood educators, local governments, health insurers, and foundations. Over 180 individuals participated in one or more of the planning meetings.
Steering Committee
A steering committee was established by invitation from the MDH Commissioner to help guide creation of the HH Plan. Committee members then helped recruit participants for state and regional level meetings; reviewed the results of the public meetings; helped identify strategies and action steps; and provided other input to the plan. Steering Committee members included MDH staff (Asthma, Indoor Air, Lead Compliance, Injury Prevention, Tobacco Prevention), project team members from SRC and NCHH, and representatives from the Alliance, the Minnesota Housing Finance Agency, the Minnesota Department of Labor and Industry, the State Fire Marshall, the Minnesota Council of Health Plans, and the Minnesota Multi-Housing Association. The Steering Committee summarized information received at regional gatherings and provided information in advance to the participants in the second statewide meeting. The Steering Committee members also reviewed the draft plan.
Data Collection, Analysis and Presentation
SRC, NCHH, MDH, and the Minnesota Housing Partnership collected available data about the state of healthy homes and communities in Minnesota and the United States from existing health and housing data sources. Data summaries for the state and for each region were prepared and shared at state and regional gatherings as well as online.
The Alliance prepared a fact sheet that provided an overview of healthy homes and communities concepts as well as fact sheets targeted to housing developers and managers, health care providers, and employers. Drafts of the fact sheets were distributed at regional gatherings for participant feedback and then finalized using input received.
State Level Meetings
Two statewide meeting were held. In March, 74 attendees were provided background information on the state of healthy homes in Minnesota and then worked in small groups to address the question “What do we want to see in place in the State of Minnesota in 3-5 years as a result of collaboration among health and housing programs?” From this meeting seven goals were defined, which were then the focus of the regional gatherings. The second statewide meeting
Planning Process4

Minnesota Healthy Homes | Strategic Plan12
was held at the end of July. Fifty three participants used the ideas from the regional gatherings to select key strategies for each of the seven goals and develop action plans for implementation.
Regional Gatherings
Regional gatherings were an essential component of both the HH Plan and Alliance projects. Because the focus of the Alliance is on both healthy homes and healthy communities both topics were addressed at meetings. One hundred people attended the seven regional gatherings held in Eagan, Owatonna, Marshall, Bemidji, Fergus Falls, Duluth and Minnetonka.
SRC and the Alliance presented background information about the state of healthy homes in each region. Participants engaged in exercises identifying local assets and resources pertaining to healthy homes and communities, reviewed the draft vision, identified obstacles, and developed strategies to achieve the vision. Participants discussed the concept of the Alliance, how it might support state and local efforts to foster healthy homes and communities, and how statewide efforts should be organized.
Alliance for Healthy Homes and Communities Statewide Convening
A statewide convening was held in June 2012 to discuss issues and priorities for launching the Alliance. One hundred sixty-five people from across the state participated in the daylong event. The morning included a keynote and breakout groups. The afternoon was devoted to planning the work of the Alliance. The group established priorities for the Alliance using instant polling technology. Information gathered at the Alliance convening was incorporated into the HH Plan.

SECTION
Minnesota Healthy Homes | Strategic Plan 13
Minnesota has an extensive base of people, programs, and organizations engaged in activities that have been demonstrated to contribute to healthy homes and communities. At the first statewide meeting and the regional gatherings participants identified over 500 existing community assets and resources. Assets were grouped into twelve categories, described below. While this plan is focused on healthy homes, because of the collaboration with the Alliance, people identified assets related to both healthy homes and communities.
The availability of assets is uneven across the state. Some assets, such as the standards set by the state building code, exist everywhere. Enforcement of the code is variable, however, with some counties having no full time building inspectors.
1. Multi-modal TransportationMost transportation assets were identified in the metro area, particularly bike/walk commuting options; however, they were also mentioned in other regions in regards to safe routes to school and work and bike trails. Other examples include bus and light rail transit options, Nice Ride bike rentals https://www.niceridemn.org/, and Complete Streets policies.
2. EducationEvery region had numerous examples of education programs for the public. Examples include Early Childhood Family Education, Adult Basic Education, community resource fairs, and continuing education for professionals such as realtors and contractors.
3. Exercise and Active LivingEvery region noted opportunities for exercise and physical activity. Examples include Park and Recreation programs, running/walking paths, health club reimbursements, parks, playgrounds, and the MDH Statewide Health Improvement Program (SHIP).
4. Financial SupportThroughout the state, participants noted financial assistance and funding in the forms of loans and grants, ranging from individual loans to federal grant programs, as assets in their communities. Examples include SHIP http://www.health.state.mn.us/divs/oshii/ship/index.html, HUD grants, Housing and Redevelopment Agencies rehabilitation programs, public housing, Section 8, and energy efficiency financing programs.
5. Healthy Food and NutritionEfforts to improve access to healthy foods, often directly from local farmers or community gardens, are widespread in Minnesota. Examples include farmers markets, food co-ops, and community and school gardens.
Community Assets for Healthy Homes and Communities 5

Minnesota Healthy Homes | Strategic Plan14
6. InspectionsThere are a number of inspection functions in place, but they vary greatly in availability and frequency. Statewide they include building, fire and housing code inspections and day care licensing. Some municipalities have rental housing inspections. Healthy homes assessments are very limited.
7. Ordinances, Standards and PoliciesThere are a host of local ordinances that affect the health of homes and communities, including those that support inspections, zoning, well and septic system testing, energy codes, and public health nuisances. Standards being used include MN Green Communities http://mngreencommunities.org/resources/index.htm, EPA radon measurement guidelines, LEED, and HUD requirements. Policies identified include smoke free policies, employer wellness polices, and various requirements of financing institutions that promote healthy homes and communities.
8. Organizations, Programs, and PartnershipsParticipants identified almost 70 specific organizations, programs, and partnerships working on healthy homes and communities in Minnesota, including public health, health care, housing developers, community action agencies, advocacy groups, and many others.
9. SafetyParticipants identified programs focused on preventing unintentional injuries, such as fires, slips, falls, and poisonings, across Minnesota. Examples of programs include Safe Kids (MN Safety Council), fire department home surveys, hazardous materials collection events, and appliance replacement programs.
10. Social ConnectednessFormal and informal gatherings of neighbors, affinity groups, and the like support the well-being of the community. Examples include block parties, Neighborhood Watch, community clubs (Lions, Rotary, etc.) neighborhood associations, senior centers, faith communities, and schools as community hubs.
11. Weatherization/Energy ConservationEvery community in Minnesota has some low income weatherization services, and most gas and electric utilities support some residential conservation efforts such as energy audits, weather stripping, and water saving devices.
12.SpecificHealthyHomesIssuesSome regions have services to address specific issues such as lead poisoning, radon, air quality, smoking cessation, asthma, allergies, bedbugs and other pests.

Minnesota Healthy Homes | Strategic Plan 15
The following chart shows the types of assets identified in each region. If a category was not mentioned in a region it does not mean that it does not exist, only that it was not identified by those who attended the planning meetings.
COMMUNITY ASSETS Metro
1Metro
2NE NW SE NW WC
Alternative transportation x x x x x
Education x x x x x x x
Exercise/Active Living x x x x x x
Financial asst/funding/grants x x x x x x x
Healthy Food/Nutrition x x x x x x
Ordinances/Policy/Standards x x x x x x x
Inspections x x x x x x
Organizations/Agencies/Partnerships
x x x x x x
Weatherization Services x x x x x x
Safety x x x x x
Social connectedness x x x x x x
Specific Issues:
Lead Program x x x x
Radon x x x x
Air Quality x
Smoking Cessation x x
Asthma/Allergies x
Bedbugs/Pests x
One of the biggest benefits of implementing a healthy homes approach will be the improved identification and coordination of community assets across the state. Bringing established community assets together on a specific project represents a more efficient use of resources, is easier on residents, and more effectively mitigates housing based health threats.


SECTION
Minnesota Healthy Homes | Strategic Plan 17
The participants in the first statewide planning meeting identified seven goals that describe a practical vision for healthy homes in Minnesota. In subsequent meetings around the state attendees worked to flesh out strategies and action steps to meet the goals. Together, the goals, strategies and associated action steps provide a roadmap for healthy homes efforts in Minnesota for the next several years.
Mission Statement
Mission, Goals, and Strategies6
Promote, support and provide healthy homes for all Minnesotans
The mission statement reflects the range of activities and the various roles needed to make healthy homes a reality for Minnesotans. Many sectors of society affect the health of our housing and our communities. Almost every organization, public and private, has a role they can play toward meeting this mission.
Goals, Strategies, and Action Steps
The strategies and associated action steps outlined in the following pages reflect refined strategies to address identified obstacles and achieve the collective mission and vision for healthy homes in Minnesota.
For each goal, information will be presented in four categories for specific strategies: the current reality, success indicators, specific action steps, and possible stakeholders. The current reality reflects brainstorming by participants at all planning meetings to identify and characterize current programs, policies, resources, best practices, and collaborations. The success indicators help guide evaluation and program growth by providing clear targets and a vision of the future structure of a successful program. Specific action steps include recommendations for concrete steps that can be taken to support healthy homes in Minnesota. Finally, possible stakeholders identify which of the many diverse organizations may be working on a particular area. The stakeholders will closely align with implementation of the Alliance. A list of obstacles for each goal is presented at the end of the strategies to help align expectations, resources, and reasonable program implementation.


GO
AL
1 Connect People, Programs and Information
Min
neso
ta Health
y H
om
es | Strateg
ic Plan
Goal 1 Strategy 1
19
Current Reality Success Indicators Action Steps Possible Stakeholders• Information is disjointed and
not centralized• Information may need to be
updated• HH regulations are dispersed
and not standardized• No county-level information
exists• There is an overwhelming
amount of HH information available with no way to efficiently search
Central HH&C website:• Link to county resources• Organized with tabs for
target stakeholders (e.g., providers, consumers, professionals, etc.)
• Access to HH&C regulations
Evaluation:• Track web hits• Google (or other search
engine) rankings• Solicit feedback from public
• Identify what organization(s) will take on the responsibility for operating a central information source
• Specify target audiences and desired content
• Create website• Provide non-electronic access
via phone• Publicize the availability of
the central location to all stakeholders and encourage cross-linkages
• State agencies• MDH• Minnesota Housing
Finance Agency • Contractors• NGO• Elected and non-elected
officials (legislation & funding)
• Providers• Health care providers• Clinics/hospitals• Local Public Health
agencies• Insurance
Provide a central location for providers, consumers and other key stakeholders to access healthy homes information and services in a user-friendly manner, including both electronic and non-electronic information.
Goal #1 seeks to ensure that participants are engaged, aware, proactive, creative, and collaborative; in a word: connected. The ultimate goal of the HH Plan and the Healthy Homes program is to ensure that Minnesota residents are aware of and engaged with healthy activities in their homes and communities and live in healthy places. Sustained healthy activities lead to improved health conditions, lower health care costs, increased social capital, and the creation of homes and communities that support the well-being of residents.
Connecting people, programs and sectors will uncover new opportunities for established programs to find new, cost-effective approaches to ensure all Minnesotans have the opportunity to make choices that allow them to live a long, healthy life, regardless of their income, education or ethnic background.
Goal 1 Strategy 1

Min
neso
ta Health
y H
om
es | Strateg
ic Plan
GO
AL
1 Connect People, Programs and Information
20
Current Reality Success Indicators Action Steps Possible Stakeholders• Sustainable Resources
Centers (SRC) has variety of HH training classes
• Not everyone is aware of these training classes.
• MDH conducts some HH outreach
• Counties are funded through MDH healthy homes grants through 2012
• Minnesota Housing Partnership (MHP) has classes for federal regulations• Weatherization• Lead
• High attendance in training programs
• Availability of web-based training of HH
• Identification of a host agency for web-based training.
• Identification of 1-2 HH contact people in every county and collaborating state/local agency
• Identify classes and on-line training options currently available and the audiences they are directed to.
• Create specific curriculum for various audiences as needed.
• Identify cross-sector training opportunities, and make training available.
• Secure continuing education credits.• Provide healthy homes training to
county public health leaders across Minnesota
• Explore adding healthy homes curriculum into professional educational programs
• Standard HH training in educational institutions as well as Continuing Education
• All county PH leaders trained in 2-day HH course
• SRC and other NGO’s• MDH• Minnesota Housing
Partnership (MHP)• Habitat for Humanity• U of M Extension• Early Childhood Family
Education (ECFE)• Adult Community Education• Hardware Stores (“How To”
desk)• Neighborhood organizations• National Night Out• Local public health agencies
Provide education and training on maintaining a healthy home to specific target audiences including: Property owners and developers, tenants, public health nurses, social workers/community health workers, local police and fire departments, building and code enforcement officials
Goal 1 Strategy 2

Min
neso
ta Health
y H
om
es | Strateg
ic Plan
GO
AL
1 Connect People, Programs and Information
21
Current Reality Success Indicators Action Steps Possible Stakeholders• No formal HH
collaboration, especially in Greater MN (outside the Metro area)
• Gap exists between available information/knowledge base and the public’s understanding of HH
• Disconnect between health and housing
• Alliance being formed
• Multi-disciplinary meetings to discuss HH issues, mirroring Federal meetings
• Establish a HH Collaborative that meets regularly• MDH to organize regional and
statewide in-person meetings accessible via teleconference
• Health and housing representatives from every county participate.
• Housing and Redevelopment Authority (HRA’s)
• Public Health• MHFA• Community Action Program
(CAP)• CHW provide HH information
and resources to underserved populations (e.g., residents of mobile homes, undocumented and limited English proficiency populations.)
• Create healthy homes presentations for various audiences and make them available.
• Have stakeholders meet and identify specific and overlapping areas of expertise for coordination and collaboration purposes
• Create a speakers bureau of knowledgeable people able to present on healthy homes topics.
• Organize a statewide healthy homes conference with representation from multiple sectors such as public health, builders, housing developers, medical providers, medical insurers, etc.
• Encourage both large (state, regional) and small (City, individual program) scale collaborations
• MDH• MPCA• State Housing Agencies• MN DHS• Educators• Health providers• Community leaders and
local staff• County Commissioners • Alliance members
Provide and promote opportunities for cross sector collaboration and coordinationGoal 1 Strategy 3

Min
neso
ta Health
y H
om
es | Strateg
ic Plan
GO
AL
1 Connect People, Programs and Information
22
Obstacles
Participants identified the following obstacles to achieving this goal.• Lack of electronic access and knowledge of web-based technologies by some citizens• Maintenance needed to keep information current
• Determining qualifications for persons and organizations listed as resources• Creating and maintaining regionally specific resources
• Access concerns related to reading level, languages available, and culturally appropriate information• Multiple audiences with different needs• Vastly different resources in different areas of the state• Lack of standard assessment tools (see Policies strategy)• Lack of standards in some areas, such as mold levels (see Policies strategy)• Funding

GO
AL
Min
neso
ta Health
y H
om
es | Strateg
ic Plan
23
Current Reality Success Indicators Action Steps Possible Stakeholders• The HH issue is complicated
and unrefined• There is not a common
definition or understanding of “what is a healthy home?”
• There are inherent communication challenges for risk and hazard reduction: unified is not simple, simple is not comprehensive, comprehensive is not targeted
• HH messaging is consistent and recognizable
• Survey reveals increased awareness and understanding of HH
• Demand for information, resources and materials
• Conduct baseline survey of current public awareness
• Conduct communications audit
• Develop test messages and refine by audience
• Analyze receptive targets & develop list
• dentify partners and champions
• Seniors• Low income youth• Home buyers• Renters• Home owners• Rental property owners• Policy makers• Realtors• Bankers
Develop unified and simple health homes messagingGoal 2 Strategy 1
Goal #2 addresses education for the public and public officials, which is a vital component of creating and maintaining healthy homes and communities. In many cases, people are simply unaware that their housing or neighborhood may be making them sick. Many communities face cultural or language barriers, or lack the knowledge of how to best create a healthy home in Minnesota. Additionally, there are misperceptions about healthy housing and communities by both the public and public officials, including the perception that “healthy” is very costly or that only poor quality housing can be unhealthy. There is a lack of a unified and simple message that cuts across sectors and no recognized central place for information sharing. The health and housing sectors often work in silos and miss opportunities for knowledge and resource sharing. Public education can help reach across sectors to reshape the narrative on the critical importance of healthy homes and communities in Minnesota.
Increase Public Awareness and Education2

Min
neso
ta Health
y H
om
es | Strateg
ic Plan
GO
AL
24
Current Reality Success Indicators Action Steps Possible Stakeholders• There is inequality and
environmental injustice in our state
• Unhealthy and unsafe homes are less expensive, making them attractive to unaware low income buyers
• An increasing number of people are burdened by the high costs of housing
• Builders are driven by marketability and cost
• Code changes• Access to policy makers
• Identify communities most affected by unhealthy housing across the state
• Create GIS overlays to illustrate the impact and the context of unhealthy housing
• Engage existing in-home service providers to assess the status of the homes they visit and provide education to residents
• Organize grassroots efforts to ensure all people have access to healthy homes
• Policymakers• Seniors• Community leaders• Residents• Organizations that serve
underserved populations and children
• Landlords• Property owners• Local public health agencies
Involve the communities most affected and address the issues of equity and environmental justice
Goal 2Strategy 2
Increase Public Awareness and Education2

Min
neso
ta Health
y H
om
es | Strateg
ic Plan
GO
AL
25
Current Reality Success Indicators Action Steps Possible Stakeholders• No such program (or funding)
exists• HH&C educational efforts are
fragmented and siloed• This is an opportunity to
work across sectors
• Increased HH awareness and visibility
• HH stories are shared• Demand for public education
campaign• Standardized HH checklist• Visual comparison of a health
vs. an unhealthy home.
• Identify and understand target audiences
• Adopt a universal checklist for residents to use
• Identify success stories to include in the campaign
• Develop metrics to determine impact
• Develop campaign materials
• News media• Homeowners• Household product
businesses and industry • Home buyers• Real Estate professionals• Renters• Policy makers• Day care providers• Local public health agencies
Implement a comprehensive healthy homes public education campaignGoal 2 Strategy 3
Increase Public Awareness and Education2

Min
neso
ta Health
y H
om
es | Strateg
ic Plan
GO
AL
26
Increase Public Awareness and Education2 Obstacles
Participants identified the following obstacles to achieving this goal.• Language, cultural and geographical differences need to be accommodated, the message needs to fit the community it is di-
rected toward.• Lack of unified and simple message• Perception that only poor quality housing can be unhealthy• Perception that healthy is very costly• Difficulty of changing public perception• Lack of visible leaders/champions• Insufficient funding

GO
AL
27M
inn
esota H
ealthy H
om
es | Strateg
ic Plan Current Reality Success Indicators Action Steps Possible Stakeholders
• Different organizations and government agencies use different housing standards
• Lack of a statewide standard• Lack of funding• Multiple agencies and
stakeholders • Housing standards tend to
address structures; health standards tend to address individual behavior/conditions
• Consumers/residents are knowledgeable of HH standard and use this knowledge
• Clear messaging and awareness of HH standards
• Existence of a Healthy Homes Star Rating System
• Form a work group representative of stakeholder groups and organizations
• Examine existing standards in use elsewhere
• Determine whether standards should vary by housing type
• Develop or adopt standards • Disseminate to key partners
• Funders• Building code officials• Builders/contractors• Engineers/architects
(technical professionals)• Local and state government • Public health• Education• CAPs/other nonprofit
organizations• Real Estate professionals• MN Board on Aging
Develop a Healthy Housing Standard
Goal #3 addresses the need to have policies and regulations to ensure that healthy housing work is being done consistently, completely and correctly. Having accepted standards, methods, and policies will help professionals and the public better understand what is involved in having a healthy home, and what is not involved. Creativity will always be required to address individual housing situations, but a thoughtful, comprehensive set of guidelines and best practices will be important to successfully implementing healthy homes in Minnesota.
Adopt Safe, Healthy Housing Policies and Corresponding Regulations3
Goal 3 Strategy 1

Min
neso
ta Health
y H
om
es | Strateg
ic Plan
GO
AL
28
Current Reality Success Indicators Action Steps Possible Stakeholders• Multiple assessment models
exist• Various training programs
exist and access to training varies
• Multiple HH-related certifications/licensures are present
• Significant resistance to broad in-home enforcement programs: “Nanny state”
• Professionals utilize a standard HH assessment statewide
• Adequate numbers of HH inspection professionals available
• Key “intake” questions incorporated into HH checklists across multiple organizations
• Form a work group representative of stakeholder groups and organizations
• Review existing inspection tools and protocols.
• Establish standards for Minnesota that include the elements of the inspection, certification/licensure requirements for persons who conduct assessments and inspections, and training standards.
• Disseminate and promote standards
• Funders• Technical professionals• Builders• Property owners (multi-
family)• Building code inspectors• Public health• Training providers• Real estate professionals
Develop standard assessment, inspection criteria, protocols and trainingGoal 3 Strategy 2
Adopt Safe, Healthy Housing Policies and Corresponding Regulations3

Min
neso
ta Health
y H
om
es | Strateg
ic Plan
GO
AL
29
Current Reality Success Indicators Action Steps Possible Stakeholders• Different standards exists for
different programs • Multiple funding agencies
require use of HH standard• Coordinated and leveraged
funds (existing and new)• Key HH education standards
incorporated into other community services and programs
• Identify programs and funding sources that impact housing design, construction and maintenance that do not currently include comprehensive healthy homes standards
• Identify and address potential unintended consequences of applying standards (e.g. Disparate impact on low income households)
• Provide training on standards• Enact standards for state
funded or operated programs• Promote voluntary
participation by other public and private programs
• Funders• Participants in public funding
programs• Grantees of public funding
programs (such as WIC, Head Start, HUD, USDA Housing)
Broaden the application of healthy homes standards, focusing on programs and projects that use public funding
Goal 3 Strategy 3
Adopt Safe, Healthy Housing Policies and Corresponding Regulations3

Min
neso
ta Health
y H
om
es | Strateg
ic Plan
GO
AL
30
Adopt Safe, Healthy Housing Policies and Corresponding Regulations3 Obstacles
Participants identified the following obstacles to achieving this goal.• Lack of political will• Lack of public acceptance of the need for healthy homes• Opposition to government regulation of private property and behavior• Difficulty with conducting and paying for enforcement actions• Demonstrating return on investment• Poorly defined standards on some aspects of healthy homes• Shortage of trained people• Liability• Funding

GO
AL
Min
neso
ta Health
y H
om
es | Strateg
ic Plan
31
Current Reality Success Indicators Action Steps Possible StakeholdersStrengths:• Multiple assessment tools exist• Different priorities• Different groups targeted
Weaknesses:• Not everyone is being served• So many directions can be
confusing• Misconceptions exist• “Inspections” used as a selling
technique
Opportunities:• Increased interest and awareness• Assessments and checklists exist
(no need to reinvent the wheel)• Infrastructure of HH practitioners
exist
• Identificationofacommon assessment tool and standard
• Achieving progress on action steps
• Form a work group representative of stakeholder groups and organizations
• Identify and evaluate existing assessment tools
• Identify existing assessment programs, evaluate protocols and processes
• Conduct trial assessments• Adoptspecifictoolsfor
Minnesota• Disseminate and promote
use
• Local government inspectors• Code enforcement• Fire and safety• Building Inspectors• Public Health• Nurses• Service providers• Weatherization• Housing Rehabilitation • Non-profitorganizations• Forprofitorganizations• Anyone entering house• Realtors• Energy auditors• Trainers• Multi-housing Association• Insurance Companies• Landlords• Home inspectors• Appraisers
Define standards and protocols for healthy homes assessments to be performed by both building professionals and by others.
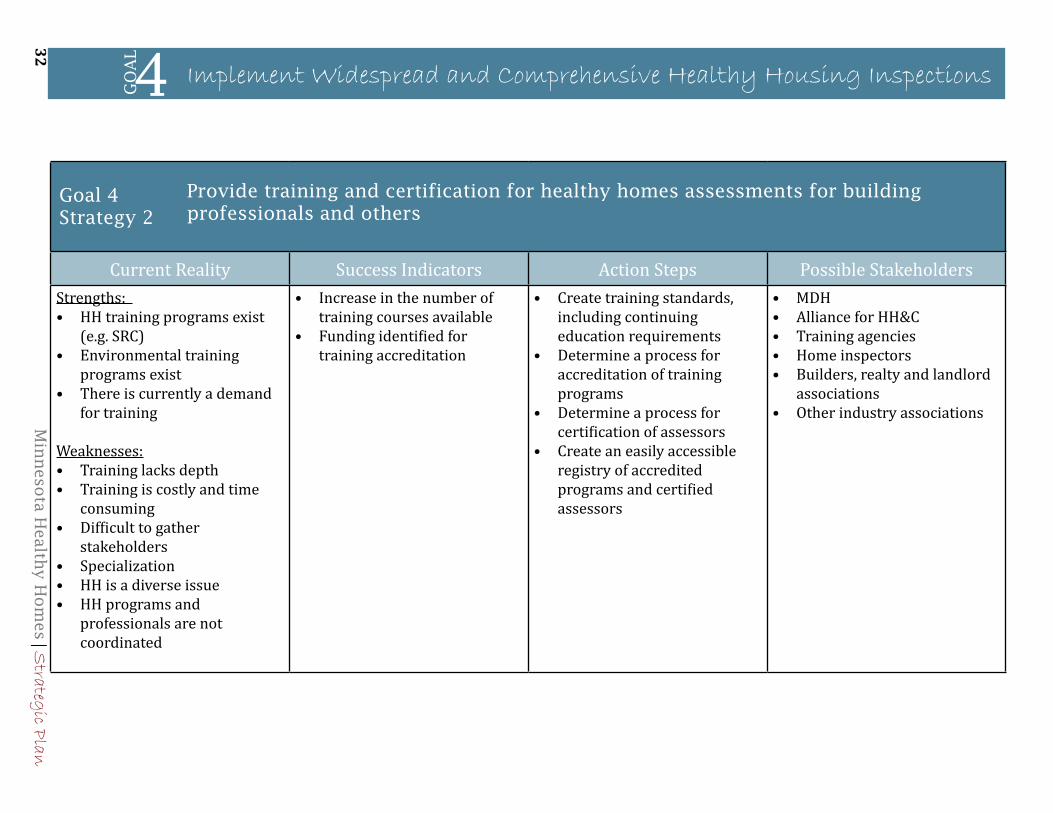
Goal #4 is consistent with the core public health functions of assessment and assurance, both of which require timely, accurate and complete data to assess housing conditions and assure delivery of appropriate, available services. Limited resources require that interventions be based on reliable data and address known housing-based health threats. Housing inspections already occur for a number of reasons, making the incorporation of healthy housing variables easier because trained capacity already exists. A number of diverse professions will be engaged and encouraged to collaborate. Please note that the current reality descriptions for this goal use a strengths and weaknesses approach. This is how the work group for this goal arranged their report.
Implement Widespread and Comprehensive Healthy Housing Inspections4
Goal 4 Strategy 1
Min
neso
ta Health
y H
om
es | Strateg
ic Plan
GO
AL
32
Current Reality Success Indicators Action Steps Possible StakeholdersStrengths: • HH training programs exist
(e.g. SRC) • Environmental training
programs exist• There is currently a demand
for training
Weaknesses:• Training lacks depth • Training is costly and time
consuming• Difficult to gather
stakeholders• Specialization• HH is a diverse issue• HH programs and
professionals are not coordinated
• Increase in the number of training courses available
• Funding identified for training accreditation
• Create training standards, including continuing education requirements
• Determine a process for accreditation of training programs
• Determine a process for certification of assessors
• Create an easily accessible registry of accredited programs and certified assessors
• MDH• Alliance for HH&C• Training agencies• Home inspectors• Builders, realty and landlord
associations• Other industry associations
Provide training and certification for healthy homes assessments for building professionals and others
Implement Widespread and Comprehensive Healthy Housing Inspections
Goal 4 Strategy 2
4

Min
neso
ta Health
y H
om
es | Strateg
ic Plan
GO
AL
33
Current Reality Success Indicators Action Steps Possible StakeholdersStrengths:• Home visiting programs exist
across sectors• Growing demand for healthy
homes• Growing awareness of how
the home environment affects health
Weaknesses:• Lack of funding and
competing time demands • Lack of understanding of
other home safety concerns
Both Strength and Weakness:• Multiple programs with
different priorities and focus
• Standardized checklist to be used by home visiting programs
• Identification of participating agencies
• Identify an expert group to create the checklist that can be used across sectors
• HH information integrated into school curriculum
• Promotional plan for dissemination including social media
• Investigate whether other states have made similar efforts and what their experience was
• Identify home visiting programs across sectors, including social service, education, health care and public safety.
• Examine how healthy housing could support the outcome of these programs
• Create referral protocols and identify resources for correcting unhealthy conditions identified in home visits.
• Promote inclusion of assessments within existing programs
• Support training and technical assistance for organizations willing to incorporate healthy housing assessments
• Government agencies who conduct housing assessments
• Agencies that have home visiting programs
• Local government inspectors• Code enforcement agencies
• Fire and safety• Building• Health
• Nurses• Service providers• Weatherization programs• Housing rehabilitation groups• Non-profit organizations • For profit organizations• Anyone entering house• Realtors• Energy auditors• Trainers
Incorporate healthy homes assessments into all home visiting programsGoal 4 Strategy 3
Implement Widespread and Comprehensive Healthy Housing Inspections4

Min
neso
ta Health
y H
om
es | Strateg
ic Plan
GO
AL
34
Implement Widespread and Comprehensive Healthy Housing Inspections4 Obstacles
Participants identified the following obstacles to achieving this goal.• Lack of standardized tools• Concerns about liability• Lack of a mandate or broad public support• Need to demonstrate the return on investment• Poorly defined inspection standards for some conditions (e.g. how wet is too wet, how much mold is too much)• Lack of training and certification standards• Limited access to the equipment needed for inspections (e.g. moisture meters, combustion gas analyzers, blower doors, etc)• Shortage of building code inspectors overall • Insufficient funding

GO
AL
Min
neso
ta Health
y H
om
es | Strateg
ic Plan
35
Current Reality Success Indicators Action Steps Possible Stakeholders• Lack of awareness of
HH services and what is reimbursable by Medicaid
• Lack of a coordinating agency (state or federal) for all referral sources
• Varying capacity among local public health departments
• Statewide hub of centralized and updated resources • Organized by county• Similar to 2-1-1 through
United Way• Health plans compensate for
HH services and assure that all stakeholders are aware of reimbursable activities
• Incorporate this function into the central location described in Goal 1, or another pre-existing information and referral service
• Identify and maintain information on local resources across the state
• Pilot test environmental referrals in a target area with a specific condition
• MDH• LPH• Health Plans• Clinic systems• Community resources such as
American Lung Association• CAP Agencies
Create a referral system to healthy homes services for health care providersGoal 5Strategy 1
(Note: Medical system is defined as Public Health, Payers of Health Care (Insurance Companies and HMOs), and Health Care Delivery Systems)
Goal #5 addresses the necessary interaction with the medical community to effectively address health issues created by housing-based hazards. A primary long-term benefit of implementing healthy homes projects will be reduced medical costs and improved health status. Some conditions, such as asthma, require both medical and environmental controls to be effectively addressed. Because of the cost savings and improved health of patients, medical providers have an interest in promoting healthy homes.
Develop Capacity in the Medical System5

Min
neso
ta Health
y H
om
es | Strateg
ic Plan
GO
AL
36
Current Reality Success Indicators Action Steps Possible Stakeholders• Lack of understanding what
is (and what is not) currently eligible for reimbursement
• Providers of HH assessment and medical providers know what is reimbursable from multiple sources• Health plans• Grant funding from CDC,
HUD, MDH, etc
• Work with insurers to collect information about what healthy homes related services are reimbursable, under what circumstances.
• Disseminate this information
• MCHP • CDC• MDH• Local Public Health• Clinic Systems
Identify and inform stakeholders on current reimbursement practicesGoal 5 Strategy 2
Develop Capacity in the Medical System5
Current Reality Success Indicators Action Steps Possible Stakeholders• Not all public health agencies
are on board• Clinics are busy and have
time demands making visits difficult
• Clinics are aware of resources for referrals and reimbursement and systems are in place
• Develop clinic visit curriculum and materials
• Make materials available to local agencies in printed and electronic formats
• Create a webinar to provide outreach and education to clinic staff
• MDH• Health Plans• LPH• Clinic Systems
Goal 5 Strategy 3
Make clinic visits to educate medical provider staff

Min
neso
ta Health
y H
om
es | Strateg
ic Plan
GO
AL
37
Develop Capacity in the Medical System5 Obstacles
Participants identified the following obstacles to achieving this goal.• Lack of reimbursement for healthy homes related activities• The brief time medical providers get to spend with patients• Clinic visits focus on the individual patient and not the family or community• Lack of recognition of public health measures• High staff turnover


GO
AL
Min
neso
ta Health
y H
om
es | Strateg
ic Plan
39
Current Reality Success Indicators Action Steps Possible Stakeholders• $35 million for housing in
2012 bonding bill• Through the Consolidated
State RFP and regional partnerships funders establish common requirements
• MN has long track record of secure federal housing funds and state dollars dedicated to housing
• Lack of strong connections between housing providers and public health providers (policy, funding, service delivery)
• Reduction in federal funding for housing and healthy homes.
• Challenging housing and finance markets
• More healthy homes produced through housing rehabilitation, new construction and specific mitigation programs
• HH issues are integrated into existing funding sources for housing as evidenced through work specifications and scopes of work
• Number of housing units that meet MN Green Communities or other healthy housing standards as a result of housing rehabilitation or new construction
• Number of smoke free units• Population health indicators show
signs of improvement• Elevated Blood Lead Level• Asthma rates• Trips/falls/slips
• Verify specific healthy homes improvements made
• Identify network of housing funders, providers and advocates
• Identify network of public health funders, providers and advocates
• Develop joint legislative agenda and strategy and work it
• Celebrate success!
• MHP• MN National Association of
Housing and Redevelopment Officials (NAHRO)
• Family Housing Fund (FHF)/ Greater Minnesota Housing Fund (GMHF)
• MN Housing Finance Agency• Faith based organizations• CDC• Non profits• Alliance for HH&C• Media• Policy makers• Low/moderate income
families with identified housing/public health needs
• Health care organizations and foundations
• Local and state public health associations
Support and expand funding for housing rehabilitation and new construction for low and moderate income families from existing sources of local, state and federal sources
Goal 6 Strategy 1
Goal #6 addresses the need to integrate health into affordable housing efforts, to capture future savings to finance current work and to coordinate across sectors and funding types. Sustainability for healthy homes means the capacity to support and maintain healthy homes activities over time. This requires long-term strategies such as building on existing partnerships and capacity, leveraging funding, and coordinating existing investments in healthy housing.
Provide Increased and Sustainable Funding for Healthy Homes6

Min
neso
ta Health
y H
om
es | Strateg
ic Plan
GO
AL
40
Current Reality Success Indicators Action Steps Possible Stakeholders• HH interventions are not currently
reimbursed such as:• Mattress covers • HEPA vacuums• Remediation of housing
hazards• Assessments (note: this is
technically possible but not approved in some public state plans)
• Home visits are reimbursed but they do not fully cover the real costs
• St Paul Health Partners can be used as a pilot project
• Some recognition by providers that reimbursement for HH activities is needed • Incentive exists• To prevent patient recidivism
• Affordable Health Care Act may be supportive of this strategy
• Most providers allow for reimbursements
• Decreased hospitalizations and emergency department visits
• Population’s health indicators improve over time
• Decrease in health care costs
• Convene stakeholders with knowledge and experience to make the case
• Develop compelling case with pilot and other data
• Present case to health care purchasers, insurers, Council of Health Plans and DHS/MDH
• Incorporate into public awareness campaign
• Health care providers• State and local public health
associations –Council of Health Plans
• MDH• DHS• American Lung Association• Alliance for HH&C
Access new investments to improve health and housing conditions where there is an established return on investment (ROI) in terms health status and costs by changing health insurance reimbursement practices to allow for addressing healthy homes issues when medically appropriate.
Goal 6Strategy 2
Provide Increased and Sustainable Funding for Healthy Homes6

Min
neso
ta Health
y H
om
es | Strateg
ic Plan
GO
AL
41
Current Reality Success Indicators Action Steps Possible Stakeholders• Some incentives are in place
from HUD re: DOE/CDC• Asthma & lead grants• Coordinated across siloed
funding programs• Preferred sustainability
status• Public health and housing not
well coordinated overall but some relationships are being established
• Lead poisoning prevention has a well established network that could be used as a platform
• Funding targets vary (e.g., funding for place/structures, funding for residents)
• More properties remediate with same level of funding
• Funding is more flexible (i.e., can fund place/structure or target population)
• Increased funding in both categories (place/structures and population due to documented ROI
• Documented ROI for people (health status)
• Documented ROI for structures (housing outcomes)
• Housing providers know more about public health, and vice versa
• Collaborative partners convene to identify coordination opportunities, priorities
• Examine policies and practices for existing sources/programs
• Determine who is doing what in this area
• Identify and inventory practices which can be replicated or adapted in other communities
• Identify gaps and opportunities
• Research models in other states if they exist
• Public health associations• Housing providers • Public and private housing
associations • Health insurance foundations• MDH/DHS
Coordinate investments and activities across sectors so that healthy homes improvements are leveraged
Provide Increased, Sustainable Funding for Healthy Homes
Goal 6 Strategy 3
6

Min
neso
ta Health
y H
om
es | Strateg
ic Plan
GO
AL
42
Provide Increased and Sustainable Funding for Healthy Homes6 Obstacles
Participants identified the following obstacles to achieving this goal.• Funding sources are fragmented with different requirements and scopes of work• Split between funders of structures and of services (dwellings or people)• Health payers do not pay for environmental assessments and interventions even when they benefit from reduced medical
expenses • Variations in program criteria, eligibility standards, and allowable activities• Federal limits on what can be used for matching funds• Lack of knowledge about what is funding resources are available• Concerns about waste and abuse of funds• Misinformation about how to address unhealthy conditions in homes

GO
AL
Min
neso
ta Health
y H
om
es | Strateg
ic Plan
43
Current Reality Success Indicators Action Steps Possible Stakeholders• Goals and metrics are now
program-specificdefined• Many programs have good
outcome measures• Evaluations are not linked to
each other• “Population” based outcomes
must be extrapolated• Evaluation processes exist
but they are scattered
• Evaluation plans in place for all elements of the strategic plan
• Health (population) and housing (structural) impacts and data sources are integrated
• Minimum number of common outcomes/data elements
• CleardefinitionofHHandindicators, based on NCHH 7 principles and Healthy Environment
Note: this is related to a “One stop shop” as data should be available from a centralized location.
• Describe the healthy homes initiative so that the overall impact on multiple sectors is clearly portrayed
• Review goals and metrics in use by other programs and other states
• DefineHHindicatorsandmetrics for Minnesota
• Create reporting systems for these
• MDH• U of M• Minnesota Department of
Commerce• Department of Labor and
Industry (DOLI)• Real Estate industry• Housing• Minnesota Housing Finance
Agency (MHFA) • Pollution Control Agency
(PCA)• Local public health
departments (LPH)
Define Healthy Homes Goals and MetricsGoal 7 Strategy 1
According to CDC, effective program evaluation is a systematic way to improve and account for public health actions and involves procedures that are useful, feasible, ethical, and accurate. Goal #7 ensures that interventions are being effective at improving the home environment and decreasing adverse health events. Additional information on Evaluation is in Section 7 of this HH Plan.
Ensure Evaluation Infrastructure and Documented Outcomes7

Min
neso
ta Health
y H
om
es | Strateg
ic Plan
GO
AL
44
Current Reality Success Indicators Action Steps Possible Stakeholders• Lead, Asthma and
Unintentional Injury programs have “mature and proven” indicators, metrics and patterns
• Other HH conditions do not necessarily have mature evaluation structures/indicators
• Each housing condition has a established definition of success
• Document and communicate what we know about these priority health issues to make the case for HH
• Development of a cohesive evaluation plan
• Show what we know about HH successes in these three areas, in Minnesota and elsewhere, in one place
• Create an evaluation template for healthy homes based on these established metrics
• Ensure that each housing condition has defined success indicators
• MDH• American Lung Association• Public safety (e.g. Fire
Department) • Building science professionals
• SRC• U of M• Building Professionals
• LPH
Draw from Lead, Asthma, and Safety/Unintentional Injury DataGoal 7 Strategy 2
Ensure Evaluation Infrastructure and Documented Outcomes7

Min
neso
ta Health
y H
om
es | Strateg
ic Plan
GO
AL
45
Current Reality Success Indicators Action Steps Possible Stakeholders• Evaluation plans exist
that can be used for a HH evaluation plan
• A lot of information exists related to HH but it is not connected
• Evaluation plans built in to all HH activities
• Identify and integrate “core” evaluation elements
• Establish evaluation plans for each goal that connects to the overall mission
• Ensure that these plans are implemented
• Identify lead agencies and individuals to be responsible for specific elements of the evaluation plan
Ensure that each goal has an evaluation planGoal 7 Strategy 3
Ensure Evaluation Infrastructure and Documented Outcomes7
Obstacles
Participants identified the following obstacles to achieving this goal.• Lack of clear definitions of healthy homes activities and expected outcomes• Lack of consensus on what is important to evaluate• The difficulty of measuring and comparing impacts in multiple sectors• The difficulty of measuring non-financial benefits• Lack of baselines


SECTION
Minnesota Healthy Homes | Strategic Plan 47
Minnesota has strong data and evaluation capacity across the state that can help support the ongoing evaluation of strategies outlined in this plan. Resources include, but are not limited to:
• Minnesota’s Public Health Data Access System, which includes query and mapping functions for data on air quality, asthma, birth defects, cancer, carbon monoxide poisoning, bio-monitoring, childhood immunizations, childhood lead poisoning, chronic obstructive pulmonary disease, drinking water quality, environmental tobacco smoke, heart attaches, and reproductive and birth outcomes. At: https://apps.health.state.mn.us/mndata/
• Minnesota’s Fire Reporting System, which tracks detailed data on the incidents to which Minnesota’s fire departments respond to each year. At: http://www.mnfirereport.net/
• Minnesota Housing Partnership, which compiles data on housing affordability trends and presents housing profiles by county and region. At: http://www.mhponline.org/
• Minnesota Compass, a social indicators project that tracks trends in education, economy and workforce, health, housing, and public safety across the state, by region, and by county, city, and neighborhood where possible. At: http://www.mncompass.org/
• Survey of the Health of All the Population and the Environment (SHAPE), a series of nationally recognized surveys collecting information on the health of Hennepin County residents and the factors that affect their health.
Evaluation efforts will focus specifically on ensuring evaluation infrastructure and documenting outcomes. Obstacles to achieving that goal include:
• Lack of clear definitions of healthy homes activities and expected outcomes• Lack of consensus on what is important to evaluate• The difficulty of measuring and comparing impacts in multiple sectors• The difficulty of measuring non-financial benefits• Lack of baselines
The strategies recommended to implement the evaluation infrastructure are:• Define Healthy Homes Goals and Metrics• Draw from Lead, Asthma and Safety/Unintentional Injury Data• Ensure that each goal has a detailed evaluation plan
Evaluation7

Minnesota Healthy Homes | Strategic Plan48
Action steps to implement evaluation strategies and success indicators for each strategy are in Section 6: Mission, Vision and Strategies. In addition, the detailed action plans developed for each of the seven Goals included in Section 6 outline. For the most part, success indicators describe expected outputs. These are clearly important to measure, but not sufficient. It will also be critical to measure outcomes. Three ways of defining outcomes were identified in the strategic planning process. They are:
1. Population health indicators, for example: • Elevated blood lead levels• Asthma rates• Trips/falls/slips
2. Documenting impacts of healthy homes interventions on health care costs3. Documenting Return on Investment (ROI), including returns on health status and
housing impacts.
There have been numerous research and evaluation projects that have conducted some type of outcome measurement. However; goals and metrics are typically defined by specific programs or organizations. Minnesota will need to work to connect existing information, data, and evaluation resources in order to move from evaluating program outcomes to examining population outcomes and ROI. There will need to be specific investment in epidemiology focused on healthy homes.
Success indicators outlined for each goal, accompanied with strategies identified in Goal 7, build the foundation of an evaluation plan for Minnesota’s healthy homes efforts. Across all goals, the following steps will be critical to ensuring effective evaluation:
• Building on established, “mature and proven” indicators, metrics, and patterns, such as those already established for the Lead, Asthma, and Unintentional Injury programs in Minnesota;
• Using existing data and evaluation outcomes to help build the case for investments in healthy homes. Existing data on lead poisoning prevention, asthma treatment, injury prevention, and radon mitigation demonstrate benefits that exceed costs and can be used to advocate for healthy homes investments across Minnesota.
• Building upon and leveraging existing data and evaluation capacity across state agencies, local agencies, academic institutions, and community-based organizations;
• Establishing agencies or coalitions responsible for monitoring progress on the strategic plan;
• Developing detailed evaluation plans at the outset of any new healthy homes strategies to ensure comprehensive evaluation;
• Documenting a wide range of outcomes, including partnerships, integration of healthy homes efforts into other programs and services, knowledge changes, policy changes, health outcomes, and ROI;
• Making data and evaluation efforts accessible for use by the public to provide residents, community-based originations, and other agencies with the data necessary to support healthy homes efforts in Minnesota.

SECTION
Minnesota Healthy Homes | Strategic Plan 49
A diverse set of resources and programs exist that will help sustain healthy homes in Minnesota. The HH Plan establishes a collective vision and collaborative strategies to achieve healthy homes for all Minnesotans, and lays the groundwork for maintaining and expanding healthy homes efforts across the state.
Sustainability for healthy homes means the capacity to support and maintain healthy homes activities over time. This requires long-term strategies such as building on existing partnerships and capacity, leveraging funding, and coordinating existing investments in healthy housing. The top strategies for sustaining healthy homes efforts are:
1. Support and expand funding for housing rehabilitation and new construction for low and moderate income families from existing local, state and federal sources. Application of healthy homes standards to investments in rehabilitation and new construction is a core sustainability strategy. For example, the adoption of Minnesota Green Communities standards by the Minnesota Housing Finance Agency (MHFA) means that healthy homes principles are met in every unit that receives MHFA funds.
2. Access new investments to improve health and housing conditions. Where there is an established ROI in terms of health status and costs, changing health insurance reimbursement practices to allow for addressing healthy homes issues when medically appropriate will be effective. There also must be mechanisms in place to capture some of the savings to pay for the cost of healthy homes interventions.
3. Coordinate investments and activities across sectors so that healthy homes improvements are leveraged. For example, if the people doing home visits for public health agencies have the training to screen for unhealthy conditions and knowledge about resources to address the problems they identify then health and housing agencies can complement each other’s efforts.
In addition to these three priority strategies, Minnesota will also need to focus on the four healthy homes issues for which cost effective interventions are well established: lead poisoning prevention, asthma trigger reductions, radon mitigation, and injury prevention. Even when cost effectiveness and ROI are established, however, it still may be difficult to capture future savings to finance currently needed services. For example, radon mitigation reduces lung cancer several decades into the future. In addition, some of the benefits of healthy homes are not monetary. Fully monetizing what a symptom free day for a person with severe asthma is worth is difficult.
The CDC Healthy Homes and Lead Poisoning Prevention Program, which funded this planning effort, was severely reduced in 2012. Lost federal funding will significantly impact resources available to MDH to promote healthy homes. Even though the healthy homes program is expected to operate in coordination with established programs and funding streams, resources are still needed to organize meetings, award and manage grants, develop guidelines, and respond to
Sustainability8

Minnesota Healthy Homes | Strategic Plan50
inquiries. Resources are also needed for staff to perform evaluation, estimates of ROI, data collection/assessment, and facilitation of connections to available services.
Fortunately there is a growing understanding of the impact of unhealthy housing, the critical role housing plays in addressing health and educational disparities, and the importance of addressing home environments to improve certain health conditions. The creation of the Alliance and active response to creating the HH Plan reflects this growing interest.
Finally, healthy housing is not a program but a way of doing business so that healthy housing is the expectation. The recommendations in this plan provide all stakeholders with action steps they can take to create the expectation of healthy homes for everyone.

Minnesota Healthy Homes | Strategic Plan
References
51
Advisory Committee on Childhood Lead Poisoning Prevention. (2012). Low Level Lead Exposure Harms Children: A Renewed Call for Primary Prevention. Available at: http://www.cdc.gov/nceh/lead/ACCLPP/Final_Document_030712.pdf.
American Lung Association. (2011). Charles D. Connor Appropriations Testimony (Department of Health and Human Services - Summary of Programs) to the U.S. House of Representatives, Subcommittee on Labor, Health and Human Services and Education. Retrieved August 14, 2012, from http://www.lung.org/get-involved/advocate/advocacy-documents/connor-appropriations-testimony.pdf
Centers for Disease Control and Prevention. (2011, December 19). Web-Based Injury Statistics Query and Reporting System. Retrieved February 24, 2012, from http://www.cdc.gov/injury/wisqars/index.html
Chandramouli, K., Steer, C., Ellis, M., & Emond, A. (2009). Effects of early childhood lead exposure on academic performance and behaviour of school age children. Archives of Disease in Childhood, 94 (11), 844-848.
Eggleston, P., Butz, A., Rand, C., Curtin-Brosnan, J., Kanchanaraksa, S., Swartz, L., et al. (2005). Home environmental intervention in inner-city asthma: A randomized controlled trial. Annals of Allergy, Asthma, and Immunology, 95 (6), 496-497.
Fewtrell, L., Pruss-Ustan, A., Landrigan, P., & Ayuso-Mateos, J. (2004). Estimating the global burden of disease of mild mental retardation and cardiovascular diseases from environmental lead exposure. Environmental Research, 94, 120-133.
Gould, E. (2009). Childhood lead poisoning: conservative estimates of the social and economic benefits of lead hazard control. Environmental Health Perspectives, 117 (7), 1162-1167.
Kercsmar, C. M., Dearborn, D. G., Schluchter, M., Xue, L., Kirchner, H. L., Sobolewski, J., et al. (2006). Reduction in asthma morbidity in children as a result of home remediation aimed at moisture sources. Environmental Health Perspectives, 114 (10), 1574-1580.
Kinde, M. (2011). Injury Trends, MN. 3rd Annual Childhood Injury Summit. Saint Paul, MN: Available at: http://www.minnesotasafetycouncil.org/safekids/summit/2011/MinnesotaChildhoodInjuryDataBehindtheNumbers.pdf.
Minnesota Department of Health. (2012). Asthma in Minnesota: 2012 Epidemiology Report. St. Paul, MN: Minnesota Department of Health.
Minnesota Department of Health. (2000-2008). Carbon Monoxide (CO) Poisoning. Retrieved February 24, 2012, from https://apps.health.state.mn.us/mndata/co
Minnesota Department of Health. (Undated). Chronic Obstructive Pulmonary Disease. St. Paul, MN: Minnesota Department of Health.

Minnesota Healthy Homes | Strategic Plan
References
52
Minnesota Department of Health. (2009). Minnesota Public Health Data Access: COPD Query. Retrieved February 24, 2012, from https://apps.health.state.mn.us/mndata/copd_query
Minnesota Department of Health. (2000-2006). Minnesota Public Health Data Acess: Childhood Lead Poisoning Query. Retrieved February 24, 2012, from https://apps.health.state.mn.us/mndata/lead_query
Minnesota Department of Public Safety. (2009). Fire in Minnesota: Fire Reporting System. Available at: https://dps.mn.gov/divisions/sfm/mfirs/Documents/Fire%20in%20Minnesota/Fire_in_MN_2009.pdf : Minnesota Department of Public Safety.
Miranda, M., Kim, D., Galeano, M., Paul, C., Hull, A., & Morgan, S. (2007). The relationship between early childhood blood lead levels and performance on end-of-grade tests. Environmental Health Perspectives, 115 (8), 1242-1247.
Miranda, M., Maxson, P., & Kim, D. (2010). Early childhood lead exposure and exceptionality designations for students. International Journal of Child Health and Human Development, 3 (1), 77-84.
Mudarri, D., & Fisk, W. (2007). Public health and economic impact of dampness and mold. Indoor Air, 17, 226-35.
National Center for Healthy Housing. (2009). Housing Interventions and Health: A Review of the Evidence. Columbia, MD: National Center for Healthy Housing.
National Center for Healthy Housing. (Undated). Pesticides. Retrieved August 13, 2012, from National Center for Healthy Housing: http://www.nchh.org/What-We-Do/Health-Hazards--Prevention--and-Solutions/Pesticides.aspx
Portier, C. (2012). The Latest Science on Lead’s Impacts on Children’s Development and Public Health. Testimony before the Committee on Environment and Public Works, United States Senate . Available at: http://epw.senate.gov/public/index.cfm?FuseAction=Files.View&FileStore_id=c7b84ff9-468a-4d92-8adc-c84aee2e6ff1.
Runyan, C., Casteel, C., Perkis, D., Black, C., Marshall, S., Johnson, R., et al. (2005a). Unintentional injuries in the home in the United States Park I: Mortality. American Journal of Preventive Medicine, 28, 73-79.
Runyan, C., Perkis, D., Marshall, S., Johnson, R., Coyne-Beasley, T., Waller, A., et al. (2005b). Unintentional injuries in the home in the United States Part II: Morbidity. American Journal of Preventive Medicine, 28, 80-87.
U.S. Census Bureau. (2010). American Community Survey. Retrieved February 24, 2012, from http://www.census.gov/acs/www/
U.S. Census Bureau. (2010). American Fact Finder. Retrieved February 24, 2012, from http://factfinder2.census.gov/

Minnesota Healthy Homes | Strategic Plan
References
53
U.S. Census Bureau. (2009). American Housing Survey for the Minneapolis-St. Paul Metropolitan Area: 2007. Washington, DC: U.S. Census Bureau.
U.S. Department of Housing and Urban Development. (2011). The Healthy Homes Program Guidance Manual. Washington, DC: U.S. Department of Housing and Urban Development.
U.S. Environmental Protection Agency. (2003). EPA Assessment of Risks from Radon in Homes. Washington, DC: U.S. Environmental Protection Agency.
U.S. Environmental Protection Agency. (2004). Pesticides industry sales and usage: 2000 and 2001 market estimates. Washington, DC: U.S. Environmental Protection Agency.
U.S. Environmental Protection Agency. (Undated). Radon Health Risks. Retrieved August 14, 2012, from http://www.epa.gov/radon/healthrisks.html

54
Minnesota United States Population1 2010 2010 Total population 5,303,925 308,745,538 % of households with 1 or more child 31.6% 33.1% % of households with 1 or more elderly resident 22.8% 24.8% Socioeconomic Characteristics1 Per capita income $28.563 $26,059 % completed high school or higher 91.8% 85.6% % of families below poverty level 7.5% 11.3% % of individuals below poverty level 11.6% 15.3% Race/Ethnicity1 % Hispanic or Latino 4.7% 16.3% % Black or African American 5.2% 12.6% % White 85.3% 72.4% % American Indian and Alaska Native 1.1% 0.9% % Asian 4.0% 4.8% % Other or two or more races 4.3% 9.3% Other Social Characteristics1 % foreign born 7.1% 12.9% % speak language other than English at home 10.5% 20.6% Housing Characteristics2 # of total housing units 2,347,201 131,704,730 # of occupied housing units 2,087,227 116,716,292 % of homes built prior to 1950 23% 19% % renter occupied 27% 35% Pests (occupied units)3 Minneapolis-St. Paul
Metro Only
# and % of homes with signs of rats 1,300 (0.1%) 760,000 (0.7%) # and % of homes with signs of mice 75,200 (6.1%) 6,052,000
(5.5%) Structural Deficiencies (occupied units)4 Minneapolis-St. Paul
Metro Only
Water leaks from outside structure 124,500 (10.1%) 11,347,000 (10.3%)
Interior leaks 97,000 (7.9%) 8,785,000 (7.9%)
Broken plaster/peeling paint 24,500 (2.0%) 2,186,000 (2.0%)
Housing-Related Health Outcomes 2006 % of children with elevated blood lead levels 0.49% 0.36% Asthma hospitalization rate among children ages 0-4 per 10,000
18.0 ---
Age-adjusted unintentional injury hospitalization rate per 100,000
479.82 ---
Age-adjusted carbon monoxide death rate per 100,000 0.28 0.15
APPENDIX A: MINNESOTA HEALTHY HOMES SNAPSHOT Summary of demographics, housing quality, and housing-related health outcomes

55
Minnesota United States Percent of Residents Paying ≥ 30% of Income for Housing5
2010 2010
Among owners 28% 30% Among renters 50% 53% Foreclosures37 2011 2010 Number of foreclosures 21,298 2,900,000 Homelessness37,6 2009 2006 Estimated number of homeless individuals on a single night 13,100 744,313 Safety7 2009 % of adults rating walking on their street as “unsafe” after dark 11.7% --- Commute Mode and Time8 2010 2010 % drive alone 78.2% 76.6% % carpool 8.5% 9.7% % use public transportation 3.5% 4.9% % walk or bicycle 3.5% 3.3% Mean travel time to work 22.9 minutes 25.3 minutes % of workers with no vehicle available 2.4% 4.4% Obesity9,10 2006 2010 % of adults that are obese 25% 33.8% % of children and adolescents that are obese --- 17% Air Quality11 2010 % of days exceeding the 24-hour PM2.5 National Ambient Air Quality Standard
3.5% ---
MINNESOTA HEALTHY COMMUNITIES SNAPSHOT Summary of neighborhood quality and built-environment related health outcomes

56
BUILDING ON ASSETS AND SUCCESSES
This document presents an overview of key health, housing, and community indicators related to healthy homes and communities and is intended to provide a snapshot of successes and opportunities as Minnesota develops its Healthy Homes Strategic Plan. This plan is a tool for creating a common agenda, shared measurement systems and mutually reinforcing activities that will tie together the activities of scores of local entities across the state. The state of Minnesota has a wide array of assets to support healthy homes and communities, including housing, health, and community programs that help residents identify and address home health and safety hazards. Minnesota has strong leadership at the state level, strong capacity at the local level, and existing statewide collaborative networks such as the Alliance for Healthy Homes and Communities project. The combination of available expertise, willingness to collaborate and try new approaches, and commitment to using valid scientific data to target and evaluate hazard reduction efforts gives Minnesota a strong team to promote healthy housing across the state. By working together, much can be accomplished. Minnesota has also demonstrated tremendous success through its existing healthy homes and communities efforts. The state dramatically increased screening for lead poisoning in the last decade. Over 76% of the children born in 2006 were tested for lead poisoning prior to 36 months of age, compared to only 42.2% of children born in 2000. Minnesota’s injury prevention efforts have also resulted in a 38% decline of the unintentional injury mortality rate for children ages 0-14 between 1990 and 2008. Minnesota’s smoke-free policy adoption resulted in a 10.5% decline between 2003 and 2007 in the number of Minnesotans exposed to secondhand smoke at any location. All new homes must be constructed with appropriate mitigation infrastructure to reduce exposure to radon. Minnesota is the sixth healthiest state in the country, and was among the top 10 states on 13 of the 22 measures in the 2011 America’s Health Ranking. According to the health rankings, Minnesota has “a high rate of high school graduation with 86.5 percent of incoming ninth graders who graduate within four years, a low occupational fatalities rate at 2.8 deaths per 100,000 workers, a low rate of uninsured population at 8.7%, a low premature death rate with 5,382 years of potential life lost before age 75 per 100,000 population, a low rate of deaths from cardiovascular disease at 206.3 deaths per 100,000 population and few poor physical health days per month at 2.9 days in the previous 30 days.” Minnesota is seeing increases in physical activity and non-motorized transportation. For example, bicycling in the Twin Cities has increased by 52% since 2007, and walking by 18%. As Minnesota implements its Healthy Homes Strategic Plan, it can build on these existing assets and public health successes. The challenges are great, but the rewards are even greater. Identifying the state’s strengths and implementing best practices will ensure that Minnesota is able to create and maintain safe and healthy homes and communities for all Minnesotans.

57
Source: Minnesota Department of Health, 2006-2008
Minnesota United States
Asthma Prevalence12,13 2007 (Child) and 2010 (Adult)
2009 and 2010
Lifetime asthma among children ages 0-17 8.7% 13.5% Current asthma among children ages 0-17 7.0% 8.4% Lifetime asthma among adults 10.9% 13.8% Current asthma among adults 7.6% 8.6% Asthma Hospitalizations14 2009 2007-2008 Age-adjusted asthma hospitalization rates per 10,000 7.5 15.2 Asthma hospitalization rate among children ages 0-4 per 10,000
18.0 ---
Chronic Obstructive Pulmonary Disease (COPD)15 2009 2007 Age-adjusted COPD hospitalizations per 10,000 residents aged 25 and older
31.5 ---
Age-specific rate of COPD hospitalizations per 10,000 people (65-75, 75-84, 85+)
56.0/91.9/80.4 ---
Asthma is a chronic disease in which the airways of the lungs become inflamed or narrowed, resulting in disruptions to normal breathing patterns and significant health consequences. Rates of asthma have nearly doubled in the United States over the last few decades. One in fourteen children and one thirteen adults in Minnesota report that they currently have asthma. It is estimated that asthma in Minnesota costs $240 million in hospitalizations, emergency department visits, office visits, and medications, and an additional $181 million in lost school and work days, for a total economic impact of $421 million in one year. In Minnesota, children less than 5 years old have the highest rate of hospitalizations and emergency department visits. Chronic obstructive pulmonary disease (COPD) is the fourth-leading cause of death in the United States. COPD may be exacerbated by environmental exposures, including tobacco smoke and air pollutants. The highest COPD hospitalization rates are seen among older adults. In Minnesota, adults ages 75-84 have the highest COPD hospitalization rates (91.9 per
PROMOTING RESPIRATORY HEALTH

58
Minnesota United States Screening16 2000-2006 Children tested for lead poisoning by 36 months 61.4% --- Childhood Lead Poisoning17,18 2006 2009-2010 % of children under age 6 with EBLL (≥10 μg/dL) 0.49% 0.36% % of children under age 6 with BLL ≥ 15 μg/dL 0.22% --- Housing Risk Factors19 2010 2010 Percent of housing built before 1950 22.9% 19.2%
Child Risk Factors20 2010 2010 % of children under five years of age living in poverty 17.2% 25%
Housing conditions associated with increased risk of lead poisoning include chipping, peeling, and flaking paint on the exterior and interior of a home; paint on friction-impact surfaces such as windows, doors, stairs, and railings; water leaks, moisture problems; and renovation of old houses without proper use of lead-safe work practices and clean-up. Young children living at or below the poverty line who reside in older housing are at greatest risk for lead poisoning. Of children born between 2000 and 2006 in Minnesota, nearly 300,000 were tested for lead poisoning. Of these children, 2,651 were found to have a blood lead level of 10 micrograms per deciliter (μg/dL) or greater. Minnesota has a slightly higher rate of lead poisoning compared with the national average. In Minnesota, 0.49% of children born in 2006 had an elevated blood lead level (EBLL), compared to 0.36% of children in the U.S. in 2009-2010. Minnesota has made great strides in increasing screening for lead poisoning in recent years. Over 76% of the children born in 2006 were tested for lead poisoning prior to 36 months of age, compared to only 42.2% of children born in 2000.
PREVENTING LEAD POISONING
Young children living at or below the poverty line who reside in older housing are at
greatest risk for lead poisoning. Data Source: United States Census, 2000

59
Minnesota United States Unintentional Injury21,22 2010 2009 Age-adjusted unintentional injury death rate per 100,000 36.06 37.17 Unintentional injury death rate, children 0-19 per 100,000 8.38 10.73 Age-adjusted unintentional injury hospitalization rate per 100,000 479.82 ---
Falls23,24 2010 2009 Age-adjusted unintentional fall death rate per 100,000 12.32 7.44 Unintentional fall death rate, adults ≥65 per 100,000 84.19 48.72 Age-adjusted unintentional fall hospitalization rate per 100,000 280.3 ---
Age-adjusted unintentional fall ER/ED visit rate per 100,000 1722.83 ---
Fires25,26 2011 2009 Unintentional residential fire deaths per 100,000 0.35 0.76 % of fire deaths where smoke detector was absent or not working 29% ---
Number of fire deaths 56 --- Poisoning27 2009 2009
Unintentional poisoning deaths per 100,000 7.07 10.29
Between 2010 and 2011, the number of fire deaths in Minnesota increased by 44%. Of the 56 fire fatalities in Minnesota in 2011, 80% occurred in residences. Smoke alarms, which have been required in every dwelling in Minnesota since 1993, were absent or inoperable in 29% of the residential fire deaths in 2011. In another 22%, it was not possible to determine if a smoke detector was present or operating.
IMPROVING IN-HOME SAFETY An estimated one-third of all
injuries in the U.S. occur in the home. Between 1990 and 2008, the unintentional injury mortality rate for children ages 0-14 in Minnesota declined by 38%. Falls remain the leading cause of emergency department-treated injury for children in Minnesota. Additionally, the unintentional fall death rate among adults ages 65 and older in Minnesota is substantially higher than the rate in the U.S., 84.19 compared to 48.72.
Fire Deaths in Residential Dwellings in Minnesota, 2011 Fatalities % of
Dwelling Fire
Deaths
% of Total Fire Deaths
No smoke alarms present 4 9% 7% Inoperable smoke alarms present 9 20% 16% Working smoke alarms present 12 27% 21% Unknown if alarms present/working 10 22% 18% Not a factor/suicides, explosions, etc. 10 22% 18% Total fire deaths in dwellings 45 100% 80%
Source: Minnesota Department of Public Safety, Fire Reporting System

60
Minnesota United States Pests28 Minneapolis-
St. Paul Metro
Signs of rats 1,300 (0.1%) 760,000 (0.7%) Signs of mice 75,200 (6.1%) 6,052,000 (5.5%) Mold and Moisture29 Minneapolis-St.
Paul Metro only
Water leaks from outside structure 124,500 (10.1%) 11,347,000 (10.3%) Interior leaks 97,000 (7.9%) 8,785,000 (7.9%) Carbon Monoxide30,31 2008 1999-2004 Age-adjusted carbon monoxide death rate per 100,000 0.28 0.15
Age-adjusted carbon monoxide hospitalization rate per 100,000 0.8 ---
Age-adjusted carbon monoxide ER/ED visit rate per 100,000 6.5 ---
Environmental Tobacco Smoke32 2011 Nonsmoking youth exposed to ETS (same room or car) 39% ---
Pests and mold can exacerbate asthma and contribute to allergies and other respiratory illnesses. Exposure to mold and dampness within homes contributes to an estimated 21% of all asthma cases in the United States.44 American Housing Survey (AHS) data provide a snapshot of housing quality nationally; however the survey only focuses on metropolitan statistical areas. AHS data for the Minneapolis-St. Paul metro area demonstrate that over 10% of housing units have water leaks from the outside, and nearly 8% have interior leaks. Minneapolis-St. Paul metro residents report slightly higher rates of signs of mice than the U.S. average, and lower rates of signs of rats. Gases in indoor air such as carbon monoxide (CO) and radon pose threats to health, including accidental death and increased risk of cancer. Unintentional CO poisoning is preventable. However, approximately 131 Minnesota
CO Poisoning Emergency Department Visits in Minnesota, by Age
Source: Minnesota Department of Health
residents died from unintentional, non-fire related CO poisoning between 2000 and 2008. During the same time period, there were approximately 35 hospitalizations and 250 emergency department visits each year for unintentional, non-fire related CO poisoning. In 2011, a little over a third (39%) of all nonsmoking youth reported being exposed to environmental tobacco smoke (ETS) in the same room or car as a smoker in the past week.
CREATING DRY, PEST- AND CONTAMINANT-FREE HOMES

61
Minnesota United States Housing Characteristics33 2010 2010 # total housing units/# of occupied housing units
2,348,242/ 2,091,548
131,791,065/ 114,567,419
27% 35% Structural Deficiencies34 2007 Broken plaster/peeling paint 24,500 (2.0%) 2,186,000 (2.0%) Open cracks and holes in walls 48,400 (3.9%) 5,310,000 (4.8%) Heating equipment breakdown 27,000 (2.2%) 2,655,000 (2.4%) Moderate physical problems 17,800 (1.4%) 3,965,000 (3.6%) Severe physical problems 19,100 (1.6%) 1,806,000 (1.6%) Household Crowding35 2003 Ratio of number of people living together to the number of rooms in a housing unit, percent with >1 person per room
8.1% ---
• Medicaid 16.9% ---
• White, non-Hispanic 2.8% ---
• Black, non-Hispanic 23.4% ---
• Hispanic 33.1% ---
• Other 33.5% ---
IMPROVING HOUSING QUALITY
Homes that are poorly constructed or maintained can have a significant impact on the health and safety of residents. Risk factors associated with poor housing quality and increased risk of housing-related illness include age of housing, poverty, geographical location, age of residents, and race and ethnicity. Across the state, 27.1% of Minnesota’s housing stock was built prior to 1950, and an additional 6.6% was built between 1950 and 1979. Many counties in southwestern Minnesota have higher percentages of pre-1950 housing than other parts of the state. Low-income populations and communities of color suffer disproportionately from housing quality concerns. For example, Minnesotans enrolled in Medicaid and non-white Minnesotans are significantly more likely to experience household crowding.
Age of housing is a risk factor associated with increased risk of housing-related illness. Data Source: United States Census, 2000

62
Minnesota United States Percent of Residents Paying ≥ 30% of Income for Housing36
2010 2010
Among owners 28% 30% Among renters 50% 53%
Foreclosures37 2011 2010 Number of foreclosures 21,298 2,900,000 Homelessness37 2009 2006 Estimated number of homeless individuals on a single night 13,100 744,313
PROMOTING HOUSING CHOICE
The shortage of affordable housing across the United States has substantial implications for health and well-being. It limits families’ and individuals’ choices about where they live. As a consequence, lower-income families are frequently forced to live in unhealthy housing located within unsafe neighborhoods with higher poverty rates and fewer resources such as education and employment.41 Unaffordable housing can also prevent families from meeting their basic needs such as nutrition and health care, and can result in housing instability and homelessness. Fifty percent (50%) of renters and 28% of homeowners in Minnesota are burdened by housing costs, paying 30% or more of their income for housing. The proportion of households burdened by housing costs has risen across the state over the last three decades. Between 1980 and 2010, the proportion of households in Minnesota paying 30% or more of their income for housing rose from 22.8% to 33.5%, and the proportion of households paying 50% or more of their income for housing rose from 8.4% to 13.8%. The national foreclosure crisis has had a significant impact in Minnesota, with over 21,000 homes going into foreclosure in 2011. Across the state, over 13,000 individuals were estimated to be homeless on a single night in 2009.

63
Minnesota United States
2009
% of adults rating walking on their street as “unsafe” after dark
11.7% ---
Commute Mode and Time39 2010 2010 % drive alone 78.2% 76.6% % carpool 8.5% 9.7% % use public transportation 3.5% 4.9% % walk or bicycle 3.5% 3.3% Mean travel time to work 22.9 minutes 25.3 minutes % of workers with no vehicle available 2.4% 4.4% Obesity9,10 2006 2010 % of adults that are obese 25% 33.8% % of children and adolescents that are obese --- 17% Air Quality40 2010 % of days exceeding the 24-hour PM2.5 National Ambient Air Quality Standard
3.5% ---
BUILDING HEALTHY COMMUNITIES
Adults’ Sense of Safety While Walking on Their Street after Dark, By Income,
Minnesota, 2009
0%
20%
40%
60%
80%
100%
Safe Not Safe
Less than$60,000$60,000 orhigher
Source: Minnesota Compass
The physical design and quality of neighborhoods can influence resident health by affecting access to employment opportunities, public resources such as transportation, healthy foods, and recreational opportunities. Residence in high poverty neighborhoods is linked to increased mortality, poor child and adult physical and mental health, negative health behaviors, and limited access to resources such as education and employment. Adults who consider their neighborhoods to be unsafe because of crime are less likely to be physically active than adults who consider their neighborhoods to be safe. In addition, safety is ranked as the most important factor in whether children are allowed to play outdoors.42, 43 In Minnesota, over 11% of adults consider their street to be unsafe after dark.
64
1 U.S. Census Bureau. American Fact Finder: http://factfinder2.census.gov/ 2 American Community Survey, 2010 3 American Housing Survey, 2007, Table 2.7 4 American Housing Survey, 2007, Table 2.7 5 Wilder Research: http://www.wilder.org/download.0.html?report=2293 6 National Coalition for the Homeless: http://www.nationalhomeless.org/factsheets/How_Many.html 7 Minnesota Compass – Fear of Crimes: http://www.mncompass.org/publicsafety/key-measures.php?km=Fearofcrime#7-242-g 8 U.S. Census Bureau. American Fact Finder: http://factfinder2.census.gov/ 9 Minnesota Department of Health. Minnesota Obesity Plan, 2008-2013. 10 Centers for Disease Control and Prevention. Overweight and Obesity Trends: http://www.cdc.gov/obesity/data/trends.html 11 Minnesota Public Health Data Access, Air Quality: https://apps.health.state.mn.us/mndata/air 12 Minnesota Department of Health Fact Sheet: Asthma in Minnesota. April 2011. 13 Centers for Disease Control and Prevention. Vital Signs: Asthma Prevalence, Disease Characteristics, and Self-Management Education – United States, 2001-2009. May 6, 2011. Morbidity and Mortality Weekly Report. 60 (17): 547-552. 14 Minnesota Public Health Data Access, Asthma Query: https://apps.health.state.mn.us/mndata/asthma_query 15 Minnesota Public Health Data Access, COPD Query: https://apps.health.state.mn.us/mndata/copd_query 16 Minnesota Public Health Data Access, Lead Poisoning Query: https://apps.health.state.mn.us/mndata/lead_query 17 Minnesota Public Health Data Access, Lead Poisoning Query: https://apps.health.state.mn.us/mndata/lead_query 18 National Health Examination and Nutrition Survey, 2009-2010. 19 American Community Survey. 2010 20 U.S. Census Bureau. American Fact Finder: http://factfinder2.census.gov/ 21 CDC’s Web-based Injury Statistics Query and Reporting System: http://www.cdc.gov/injury/wisqars/index.html 22 Minnesota Injury Data Access System: http://www.health.state.mn.us/injury/midas/index.cfm 23 CDC’s Web-based Injury Statistics Query and Reporting System: http://www.cdc.gov/injury/wisqars/index.html 24 Minnesota Injury Data Access System: http://www.health.state.mn.us/injury/midas/index.cfm 25 CDC’s Web-based Injury Statistics Query and Reporting System: http://www.cdc.gov/injury/wisqars/index.html 26 Fire in Minnesota: Fire Reporting System (2011). Minnesota Department of Public Safety: https://dps.mn.gov/divisions/sfm/mfirs/Documents/Fire%20in%20Minnesota/Fire_In_Minnesota_2011.pdf. 27 CDC’s Web-based Injury Statistics Query and Reporting System: http://www.cdc.gov/injury/wisqars/index.html 28 American Housing Survey, 2007, Table 2.7 29 American Housing Survey, 2007, Table 2.7 30 Minnesota Public Health Data Access, Carbon Monoxide Poisoning: https://apps.health.state.mn.us/mndata/co 31 Centers for Disease Control and Prevention. Morbidity and Mortality Weekly Report. December 21, 2007; 56 (50); 1309-1312, http://www.cdc.gov/mmwr/preview/mmwrhtml/mm5650a1.htm . 32 Minnesota Public Health Data Access, Environmental Tobacco Smoke: https://apps.health.state.mn.us/mndata/ets_youth 33 American Communities Survey 34 American Housing Survey (MSP). Tables 2.4, 2.6, and 2.7
ENDNOTES

65
35 CDC’s Pregnancy Risk Assessment Monitoring System (PRAMS) Online Data: http://apps.nccd.cdc.gov/cPONDER/ 36 Wilder Research: http://www.wilder.org/download.0.html?report=2293 37 Minnesota Housing Partnership. Housing Affordability in Minnesota, 2011: http://www.mhponline.org/images/stories/docs/research/countyprofiles/2011/minnesota.pdf 38 Minnesota Compass – Fear of Crimes: http://www.mncompass.org/publicsafety/key-measures.php?km=Fearofcrime#7-242-g 39 U.S. Census Bureau. American Fact Finder: http://factfinder2.census.gov/ 40 Minnesota Public Health Data Access, Air Quality: https://apps.health.state.mn.us/mndata/air_pm 41 Robert Wood Johnson Foundation. Issue Brief Series: Exploring the Social Determinants of Health. Housing and Health –May 2011. http://www.rwjf.org/files/research/sdohseries2011housing.pdf. 42 Centers for Disease Control and Prevention. Neighborhood safety and prevalence of physical inactivity-selected states. MMWR Morb Mortal Wkly Rep. 1996; 48:143-146. 43 Sallis JF, McKenzie TL, Elder JP, Broyles SL, Nader PR. Factors parents use in selecting play spaces for young children. Arch Pediatr Adolesc Med. 1997; 151(4):414-417. 44 Mudarri, D., & Fisk, W. (2007). Public health and economic impact of dampness and mold. Indoor Air , 17, 226-35.

MINNESOTA HEALTHY HOMESStrategic Plan
November 2012
Sustainable Resources, Inc. 1081 Tenth Avenue SoutheastMinneapolis, MN 55414612-870-4255Fax: 612-870-0729
Division of Environmental HealthEnvironmental Surveillance and AssessmentEnvironmental Impact Analysis Unit625 Robert Street NorthPO Box 64975St. Paul, MN 55164-0975651-201-4928TTY: 651-201-5797
If you require this document in another format, such as large print, Braille, or audio recording, call 651-201-4928.