ministry of agriculture and forestry atlas … · the atlas of biosecurity surveillance is a ......
TRANSCRIPT

MINISTRY OF AGRICULTURE AND FORESTRY
ATLAS OF BIOSECURITY SURVEILLANCE • 2011–MAY

ACKNOWLEDGEMENTSThe Atlas of Biosecurity Surveillance is a publication of the Surveillance Group, Readiness Response Directorate of the Investigation, Readiness and Response Branch of the Ministry of Agriculture and Forestry, New Zealand. We are grateful to all in the Surveillance Group for their patient assistance and participation in compiling this atlas. We are also grateful to the MAF Communications Team, especially Selena Henry, for assisting in the preparation and publication of this document.
ENQUIRIES All enquiries should be addressed to the Surveillance Group of the Investigation, Readiness and Response Branch of MAF.
CITATION Acosta, H; White, P (2011) Atlas of Biosecurity Surveillance. 2011–May. Wellington, New Zealand, Ministry of Agriculture and Forestry.
PUBLISHED BYMAF Biosecurity New Zealand Pastoral House 25 The Terrace PO Box 2526 Wellington 6140 New Zealand
Tel: 64 4 894 0100 or 0800 008 333 (within New Zealand) Fax: 64 4 894 0731
Web: www.maf.govt.nz
Crown Copyright© 2011– Ministry of Agriculture and Forestry. This document can be copied for non-commercial purposes providing its source is acknowledged.
Cover image © N. E. Acosta. First published – May 2011
ISBN 978-0-478-37566-4 (Print)
ISBN 978-0-478-37567-1 (Online)
DISCLAIMERWhile every effort has been made to ensure the accuracy of the information depicted in this atlas, no guarantees can be made as to quality, performance and usefulness of the maps or data for the user. The atlas should be considered as a dynamic document that is responsive to the surveillance priorities of the Ministry of Agriculture and Forestry. Specific questions regarding features of the atlas should be referred to MAF Surveillance Group. This atlas remains copyright of the Ministry of Agriculture and Forestry – Surveillance Group.

3 PREFACE
Biosecurity surveillance is vital by helping to detect pests and diseases before they can become established in New Zealand. Early detection protects the economy, environment and people from impacts associated with the introduction of pests and diseases. Some surveillance programmes also support New Zealand’s status as free from specific pests and diseases.
However, biosecurity surveillance is largely unseen or not well known. This is because most people are not aware of what surveillance is and what types of programme are conducted. Effective surveillance is often hard to appreciate because it is not possible to prove the absence of a pest or disease is the result of that programme, even when the likelihood of its becoming established would otherwise be very high. MAF’s biosecurity surveillance activities are extensive with a budget of several million dollars per year and stretch across the country collecting or trapping many thousands of samples annually. So the Atlas of Biosecurity Surveillance serves as a user interface to MAF’s biosecurity surveillance activities, demonstrating the breadth and depth of surveillance across the animal, plant, environment and marine sectors.
The purpose of the Atlas of Biosecurity Surveillance is to reveal the landscape of our surveillance programmes, showing what we do and where we do it. We run targeted and risk-based programmes that look for specific pests, pathogens or diseases, and passive programmes to raise awareness and encourage reporting of unwanted exotic pests and pathogens. Our surveillance programmes include trapping for ants in ports and transitional facilities, taking blood from cattle, surveying coastal environments, evaluating pathological samples, ensuring animal feed and fertiliser is safe, surveying trees and shrubs, and setting traps for fruit flies and gypsy moths. Other programmes check coastal habitats for saltmarsh mosquitoes that may carry diseases of humans and animals. All these programmes demonstrate transparency and fulfil important international trading commitments by reporting what we find to organisations such as the World Organisation for Animal Health (OIE) and the International Plant Protection Committee.
By presenting maps of some of our programmes, the Atlas of Biosecurity Surveillance makes our surveillance programmes more accessible. Mapping is a powerful communication tool that enables us make sense of data by revealing otherwise hidden patterns, and trends or gaps in the spatial distribution of surveillance and sampling.
We intend the Atlas of Biosecurity Surveillance to be a live document that will reflect the development of existing programmes and accommodate new programmes as they arise. To achieve this, the atlas will also be hosted on the internet and updated as required. For access to the latest version of this atlas, visit http://www.biosecurity.govt.nz/pests/surv-mgmt/surv
We hope the Atlas of Biosecurity Surveillance will increase your understanding of MAF’s surveillance activities, as well as stimulate discussion and research towards improving what we do and how we do it to provide even better protection of New Zealand’s people, economy and environment.
Brendan Gould Surveillance Manager Readiness and Response Directorate Investigation, Readiness and Response
PREFACE
CONTENTS4
CONTENTSACKNOWLEDGEMENTS
PREFACE
1 INTRODUCTION 7 1.1 BIOSECURITY: WHAT IT IS AND WHY WE SHOULD BOTHER 7
1.2 THE BIOSECURITY SYSTEM IN NEW ZEALAND 7
1.3 SURVEILLANCE: AN ESSENTIAL COMPONENT OF POST-BORDER BIOSECURITY 7
1.4 RISK AND HOW IT VARIES 8
1.5 ATLAS LAYOUT 11
1.6 MAP SPECIFICATIONS 11
2 SURVEILLANCE PROGRAMMES 14 2.1 ANIMAL HEALTH INFORMATION 14
2.2 ARBOVIRUS SURVEILLANCE PROGRAMME 16
2.3 AVIAN INFLUENZA SURVEILLANCE PROGRAMME 19
2.4 CHRONIC WASTING DISEASE SURVEILLANCE PROGRAMME 21
2.5 FRUIT FLY SURVEILLANCE PROGRAMME 24
2.6 GYPSY MOTH SURVEILLANCE PROGRAMME 28
2.7 HIGH RISK SITE SURVEILLANCE PROGRAMME 32
2.8 NATIONAL INVASIVE ANT SURVEILLANCE PROGRAMME 36
2.9 NATIONAL MARINE HIGH RISK SITE SURVEILLANCE PROGRAMME 40
2.10 RUMINANT PROTEIN REGULATION PROGRAMME 45
DATA SOURCES 48
REFERENCES AND FURTHER READING 49

CONTENTS5
LIST OF FIGURES FIGURE 1: THE BIOSECURITY SYSTEM 7
FIGURE 2: ARRIVALS AT THREE INTERNATIONAL AIRPORTS OVER TIME 8
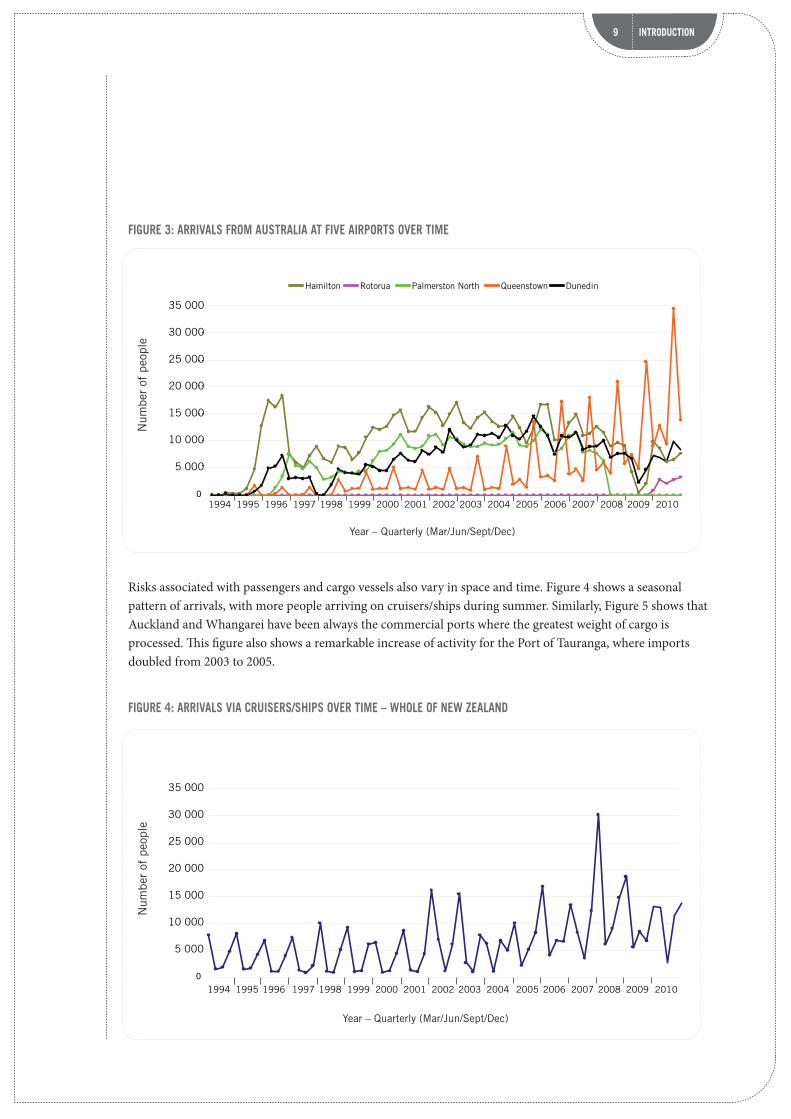
FIGURE 3: ARRIVALS FROM AUSTRALIA AT FIVE AIRPORTS OVER TIME 9
FIGURE 4: ARRIVALS VIA CRUISERS/SHIPS OVER TIME – WHOLE OF NEW ZEALAND 9
FIGURE 5: GROSS WEIGHT IMPORTS AT 13 COMMERCIAL PORTS OVER TIME 10
LIST OF MAPS 1: INTERNATIONAL AIRPORTS, COMMERCIAL SEA PORTS AND TRANSITIONAL FACILITIES 12
2: ANIMAL HEALTH INFORMATION 15
3: ARBOVIRUS SURVEILLANCE PROGRAMME – TEMPERATURE 17
4: ARBOVIRUS SURVEILLANCE PROGRAMME – CATTLE DENSITY 18
5: AVIAN INFLUENZA SURVEILLANCE PROGRAMME 20
6: CHRONIC WASTING DISEASE SURVEILLANCE PROGRAMME – NORTH ISLAND 22
7: CHRONIC WASTING DISEASE SURVEILLANCE PROGRAMME – SOUTH ISLAND 23
8: FRUIT FLY SURVEILLANCE PROGRAMME 25
9: FRUIT FLY SURVEILLANCE PROGRAMME – AUCKLAND AND WELLINGTON 26
10: FRUIT FLY SURVEILLANCE PROGRAMME – CHRISTCHURCH AND DUNEDIN 27
11: GYPSY MOTH SURVEILLANCE PROGRAMME 29
12: GYPSY MOTH SURVEILLANCE PROGRAMME – AUCKLAND AND WELLINGTON 30
13: GYPSY MOTH SURVEILLANCE PROGRAMME – CHRISTCHURCH AND DUNEDIN 31
14: HIGH RISK SITE SURVEILLANCE PROGRAMME 33
15: HIGH RISK SITE SURVEILLANCE PROGRAMME – AUCKLAND AND WELLINGTON 34
16: HIGH RISK SITE SURVEILLANCE PROGRAMME – CHRISTCHURCH AND DUNEDIN 35
17: NATIONAL INVASIVE ANT SURVEILLANCE PROGRAMME 37
18: NATIONAL INVASIVE ANT SURVEILLANCE PROGRAMME – AUCKLAND AND WELLINGTON 38
19: NATIONAL INVASIVE ANT SURVEILLANCE PROGRAMME – CHRISTCHURCH AND DUNEDIN 39
20: NATIONAL MARINE HIGH RISK SITE SURVEILLANCE PROGRAMME 42
21: NATIONAL MARINE HIGH RISK SITE SURVEILLANCE PROGRAMME – AUCKLAND AND WELLINGTON 43
22: NATIONAL MARINE HIGH RISK SITE SURVEILLANCE PROGRAMME – CHRISTCHURCH AND DUNEDIN 44
23: RUMINANT PROTEIN REGULATION PROGRAMME – NORTH ISLAND 46
24: RUMINANT PROTEIN REGULATION PROGRAMME – SOUTH ISLAND 47


7 INTRODUCTION
1 INTRODUCTION1.1 BIOSECURITY: WHAT IT IS AND WHY WE SHOULD BOTHERBiosecurity is the protection of the economy, environment and people from the risks1 associated with and consequences of, the introduction of damaging risk organisms2, and the mitigation of the effects of risk organisms that are already present.
1.2 THE BIOSECURITY SYSTEM IN NEW ZEALANDThe biosecurity system in New Zealand is co-ordinated by the Ministry of Agriculture and Forestry (MAF) and comprises three sequential, equally important and highly interactive sections: pre-border, border and post-border (Figure 1).
FIGURE 1: THE BIOSECURITY SYSTEM (FROM MAF BIOSECURITY NEW ZEALAND, 2009)
Biosecurity surveillance activities occur pre-border, at the border, and post-border. Post-border surveillance activities increase the likelihood of detecting pests and diseases early enough to conduct effective containment and eradication programmes.
1.3 SURVEILLANCE: AN ESSENTIAL COMPONENT OF POST-BORDER BIOSECURITYBiosecurity surveillance is defined as “the collection, collation, analysis, interpretation and timely dissemination of information on the presence, distribution of prevalence or risk organisms and the plants or animals that they affect” (MAF Biosecurity New Zealand, 2009). It is an essential component of post-border biosecurity (Figure 1).
Post-border surveillance is undertaken for a variety of reasons, some of the most important being: • to give evidence that a pest or disease is absent from a country, region or defined area, thus enabling access
to particular export markets; • to detect new pests and diseases early enough to enable cost-effective management; • to establish the boundaries of a known pest or disease incursion; • to monitor the progress of existing containment or eradication programmes.
1 “Risk” is a measure of the probability of a harm multiplied by the consequence of such harm.2 “Risk organism” is an organism either already present in, or new to, New Zealand that poses a potential biosecurity risk.
RISK
PRE-BORDER BORDER POST-BORDER RISK REDUCTION AND TRADE FACILITATION ACTIVITIES
RISK
RISK
RISK
IMPORTS
VESSELS
PASSENGERS
AIR
SEA
Internationalagreements
Import risk analysis
Border standards
Pest risk analysis
0800 pest and diseases hotline
Response plans
Internal border and pathway management
Response
Long-term management
Pathway risk analysis
Clearance standards
Mail, passenger and goods inspection
Surveillance

INTRODUCTION8
Biosecurity surveillance in New Zealand is undertaken across the four functional areas of animals, plants, environment and marine using active and passive, targeted and non-specific surveillance techniques in continual, seasonal and periodic programmes.
1.4 RISK AND HOW IT VARIESThe arrival in New Zealand of imports, vessels and passengers, as well as the connectivity that the air and sea creates with other regions of the world, has the potential to generate some risks (Figure 1) that, if unmanaged, could have serious impacts on New Zealand’s economic, environmental, human health, socio-cultural and Māori values. These risks are not static: they are highly dynamic and can vary in space and time.
The risks vary across the country. This is clearly shown in the map of New Zealand airports, commercial seaports and transitional facilities (Map 1, page 12). These localities are the most likely points of entry and spread for new organisms. Similarly, the risks vary over time. For example, Figure 2 shows a seasonal pattern of arrival numbers and thus risks at major international airports over the last 17 years. This figure also shows a steady increase in the number of arrivals at Auckland, which suggests an increase of the risk level at this location.
FIGURE 2: ARRIVALS AT THREE INTERNATIONAL AIRPORTS OVER TIME
A similar seasonal pattern is observed for people arriving from Australia at the airports of Hamilton, Rotorua, Palmerston North, Queensland and Dunedin (Figure 3, page 9). This figure shows how risks associated with arrivals can appear or disappear, depending on the dynamic of the airports across the country. Before 1995 for example, Queenstown did not receive any direct flights from Australia but today, it is one of the busiest airports for flights from there. Similarly, although Palmerston North does not now have any passenger flights from Australia, there were Australian flights to this city from 1996 to 2008.
Num
ber
of p
eopl
e
Auckland Christchurch Wellington
Year – Quarterly (Mar/Jun/Sept/Dec)
0
100 000
200 000
300 000
400 000
500 000
600 000
700 000
800 000
900 000
1 000 000
1994 1995 1996 1997 1998 1999 2000 2001 2002 2003 2004 2005 2006 2007 2008 2009 2010
INTRODUCTION9 INTRODUCTION9
0
5 000
10 000
15 000
20 000
25 000
30 000
35 000
FIGURE 3: ARRIVALS FROM AUSTRALIA AT FIVE AIRPORTS OVER TIME
0
5 000
10 000
15 000
20 000
25 000
30 000
35 000
FIGURE 4: ARRIVALS VIA CRUISERS/SHIPS OVER TIME – WHOLE OF NEW ZEALAND
Risks associated with passengers and cargo vessels also vary in space and time. Figure 4 shows a seasonal pattern of arrivals, with more people arriving on cruisers/ships during summer. Similarly, Figure 5 shows that Auckland and Whangarei have been always the commercial ports where the greatest weight of cargo is processed. This figure also shows a remarkable increase of activity for the Port of Tauranga, where imports doubled from 2003 to 2005.
1994 1995 1996 1997 1998 1999 2000 2001 2002 2003 2004 2005 2006 2007 2008 2009 2010
Num
ber
of p
eopl
e
1994 1995 1996 1997 1998 1999 2000 2001 2002 2003 2004 2005 2006 2007 2008 2009 2010
Hamilton Rotorua Palmerston North Queenstown Dunedin
Num
ber
of p
eopl
e
Year – Quarterly (Mar/Jun/Sept/Dec)
Year – Quarterly (Mar/Jun/Sept/Dec)

INTRODUCTION10
FIGURE 5: GROSS WEIGHT OF IMPORTS AT 13 COMMERCIAL PORTS OVER TIME
In order to fulfil its objective and optimise government resources, biosecurity surveillance is designed in a way that is responsive to the characteristics of current and emerging risks. The present atlas illustrates how this has been achieved in some of the surveillance programmes currently conducted by MAF.
Tonn
es
Year
0
1 000 000
2 000 000
3 000 000
4 000 000
5 000 000
6 000 000
20102009200820072006200520042003200220012000199919981997199619951994
Port of WhangareiPort of AucklandPort of TaurangaPort of GisbornePort TaranakiPort of NapierCentre Port WellingtonPort NelsonPort MarlboroughLyttelton PortPrime Port TimaruPort OtagoSouth Port

INTRODUCTION11
1.5 ATLAS LAYOUT Each programme begins with an introductory page with the following headings:
NAME OF THE PROGRAMME Target organism/s: The organism/s of concern for that particular programme. Potential impacts: A summary of the potential impacts that the target organism/s could have in New Zealand. Introduction mechanisms: The means by which the target organism/s could arrive and spread in New Zealand.
SURVEILLANCE PROGRAMME Objectives: The main objectives of the programme. Start: The year when the programme officially began. Methodology: The surveillance methods used to detect target organism/s. Sampling period: The period of the year when sampling is conducted. Status: Whether the target organism/s are currently present or not in New Zealand. Incursions: Known incursions in New Zealand of target organism/s.The introductory page is followed by a map of New Zealand depicting the usual sampling locations of the programme. For several programmes, additional large scale maps have been included to give the reader an idea of sampling density. These maps focus on the North Island and South Island or on the regions of Auckland,
1.6 MAP SPECIFICATIONSAll maps in the atlas have the following specifications. • software: ArcGIS 9.3.1 (ESRI®);• projection: New Zealand Transverse Mercator coordinate system;• datum: NZGD 2000.

12 INTRODUCTION
MAP 1: INTERNATIONAL AIRPORTS, COMMERCIAL SEAPORTS AND TRANSITIONAL FACILITIES

13

14 ANIMAL HEALTH
2.1 ANIMAL HEALTH INFORMATION
TARGET ORGANISM/S No specific organism is targeted but scanning surveillance techniques are used to watch for organisms of interest and to monitor and measure submissions to veterinary diagnostic laboratories.
POTENTIAL IMPACTS Potential impacts range from the very minor to extremely severe, depending on the organisms. Organism/s of high interest to the surveillance programme could have dramatic economic or human health impacts if they became established in New Zealand. For example:• foot and mouth disease would have a devastating effect on the market for animals and animal products;• Coxiella burnetii, the causative agent of Q fever, would have a significant human health impact.
INTRODUCTION MECHANISMS Commonly recognised introduction mechanisms for exotic organisms include carrier animals, international travel by humans and winds. Sometimes an arthropod3 vector4 is also involved. In addition, there is the potential for new mutations of existing pathogens, which alter the epidemiology and can result in increased wastage, reduced productivity or new zoonotic5 risks.
SURVEILLANCE PROGRAMME Objectives: • to provide early warning of disease incursions to facilitate containment and eradication;• to provide assurance of country freedom from specified diseases;• to demonstrate and quantify the veterinary infrastructure and submission patterns.
Start: Evolved from original government veterinary diagnostic services provided many decades ago.
Methodology: Samples submitted by clinical veterinary practitioners are tested by the veterinary diagnostic laboratory according to the intentions of the practitioner investigating the case. For cases that meet criteria regarding investigation of sick animal cases, MAF is provided with anonymous summary data and reports which are then stored in MAF systems where they can be retrieved, analysed and published as needed (Map 2).
Sampling: All samples across the country that fit the sampling criteria. Each year about 15 000 eligible cases are reported on.
STATUSNot applicable
INCURSIONSOn average there are several notifications each month to the 0800 pest and disease hotline as a direct result of investigations reported in the summarised cases. Most of these do not result in anything more than a detailed investigation, but occasionally a new organism or disease is detected, resulting in an incursion response.
3 Invertebrates that have a segmented body, jointed limbs and an exoskeleton.
4 Organisms that carry and transmit a disease from one host to another.5 Refers to diseases that can be transferred from animals to people.
2 SURVEILLANCE PROGRAMMES

15 ANIMAL HEALTH
MAP 2: ANIMAL HEALTH INFORMATION

16 ARBOVIRUS
2.2 ARBOVIRUS SURVEILLANCE PROGRAMME
TARGET ORGANISM/S• Bluetongue virus;• Epizootic haemorrhagic disease virus;• Akabane disease viruses;• Palyam virus.
The programme also targets all Culicoides species (midges), the vectors6 for these diseases.
POTENTIAL IMPACTSBy causing significant health problems (for example, illnesses of the central nervous system and haemorrhagic fevers) in cattle, sheep, goats and deer, the incursion of these diseases into the country would:• lead to international trade restrictions (even potentially a complete ban) on New Zealand’s animals and
animal products;• have a devastating impact on the domestic market for animals and animal products;• impose a socio-economic burden associated with control and eradication programmes.
INTRODUCTION MECHANISMS The term arbovirus indicates that these diseases are transmitted by arthropods7, in particular midges of Culicoides species. Although regarded as an unlikely event, there is a risk that infected midges could arrive in New Zealand from Australia via wind currents.
SURVEILLANCE PROGRAMMEObjectives:• to provide early warning of selected arboviruses to facilitate eradication;• to provide assurance of country freedom from selected arboviruses.
Start: 1991
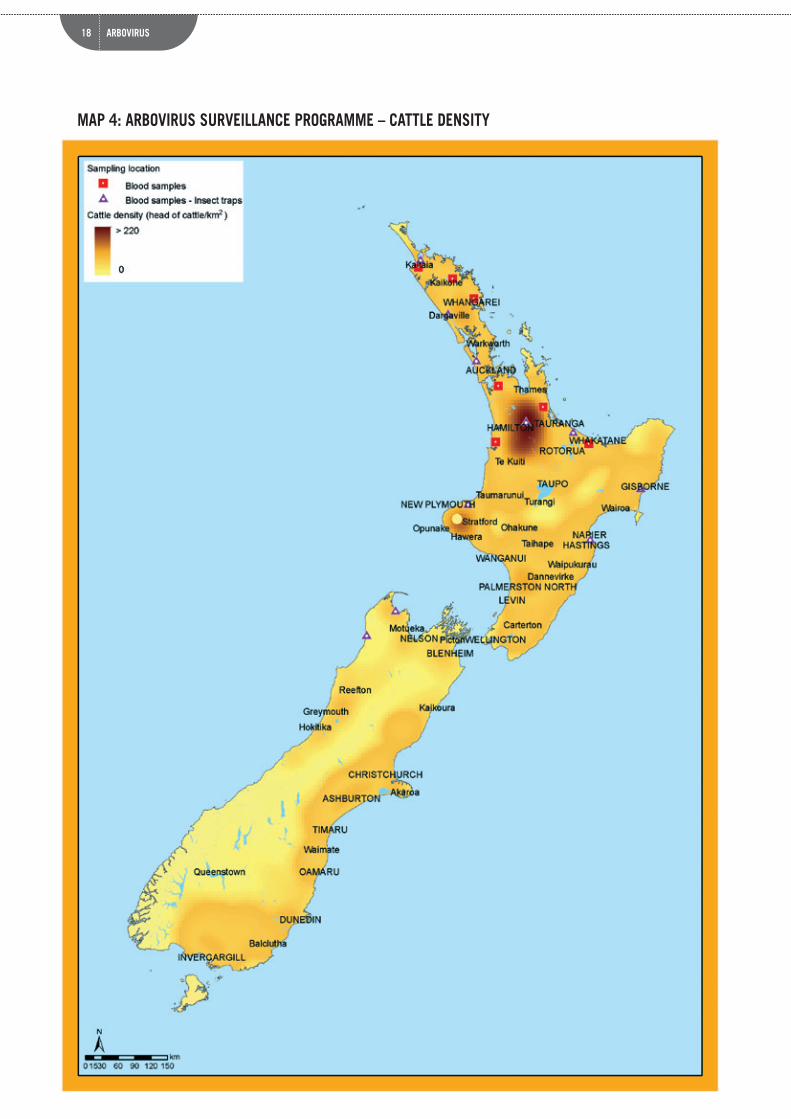
Methodology: Blood samples are taken from 10 randomly selected cattle from 17 sentinel herds8 located in areas with environmental characteristics (for example, temperature) considered suitable for Culicoides midges to survive and become established. Trapping of Culicoides species is also undertaken near 10 of the sentinel herds (eight in the North Island, two in the South Island) (Maps 3 and 4).
Sampling: Blood testing is conducted in December and June. Trapping is undertaken in all sites from February to April each year, as environmental conditions during this period are most favourable for the survival of the midges.
STATUSNew Zealand is considered free from all these diseases and Culicoides midges.
INCURSIONSNo incursions have been detected to date.
6 Organisms that carry and transmit a disease from one host to another.7 Invertebrates that have a segmented body, jointed limbs and an exoskeleton.8 Sentinel herds are groups of cattle that are considered a representative sample of the population at risk.

17 ARBOVIRUS
MAP 3: ARBOVIRUS SURVEILLANCE PROGRAMME – TEMPERATURE
18 ARBOVIRUS
MAP 4: ARBOVIRUS SURVEILLANCE PROGRAMME – CATTLE DENSITY

19 AVIAN INFLUENZA
2.3 AVIAN INFLUENZA SURVEILLANCE PROGRAMME
TARGET ORGANISM/SAll Type A avian influenza viruses with high pathogenicity9 and low-pathogenic avian influenza viruses of subtype H5 and H7, which are responsible for bird flu.
POTENTIAL IMPACTSAvian influenza can seriously affect multiple internal organs of infected birds, leading to a mortality rate of 90–100 percent in less than 48 hours. Although the risk from avian influenza to most people is low, since 1997 a number of cases of human infection have been reported. The presence of avian influenza in New Zealand could: • have a devastating effect on the domestic market for poultry and poultry products;• lead to international trade restrictions on New Zealand’s poultry and poultry products;• dramatically reduce the populations of wild and domesticated birds;• bring a socio-economic and ecological burden associated with control and eradication programmes;• have a health impact on the human population.
INTRODUCTION MECHANISMS Avian influenza viruses can enter into New Zealand via imports of live poultry, eggs, unprocessed poultry products, contaminated equipment, packaging, clothing and other commodities from infected areas. They can also be carried by migrating birds, whose interaction with local species could lead to cross-contamination.
SURVEILLANCE PROGRAMMEObjectives: • to provide early warning of avian influenza for containment and eradication;• to provide assurance of country freedom from notifiable avian influenza;• to provide assurance of country freedom from other avian influenza.
Start: 2004 (Previously, surveillance had been conducted since 1975)
Methodology: Throat10 and cloacal11 swabs are taken from migratory shorebirds (for example, red knot Calidris canutus) and waders (for example, bar-tailed godwit Limosa lapponica), and local waterfowl (mallard ducks Anas platyrhynchos). In the early stage of the programme (2004–2006) blood samples were also taken from mallard ducks.
Sampling: Migratory and native birds from coastal areas across New Zealand are sampled mainly in late spring and summer (Map 5). More than 8000 birds were sampled by the programme from 2004 to 2010.
STATUSNew Zealand is considered free from high-pathogenic avian influenza.
INCURSIONSAvian influenza has never been detected in chickens, but some cases of low-pathogenic avian influenza have been detected in wild mallard ducks. Cases of low-pathogenic avian influenza subtypes H5 have been detected in the North Island and subtypes H7 in the South Island.
9 Pathogenicity means the ability of an organism to produce an infectious disease.10 Specifically the oropharyngeal area, which refers to the pharynx between the soft palate and the epiglottis.11 In vertebrates such as fish, reptiles and birds it is the common cavity into which the intestinal, genital, and urinary tracts open.

20 AVIAN INFLUENZA
MAP 5: AVIAN INFLUENZA SURVEILLANCE PROGRAMME

21CHRONIC WASTINGDISEASE
2.4 CHRONIC WASTING DISEASE SURVEILLANCE PROGRAMME
TARGET ORGANISM/STransmissible spongiform encephalopathy (TSE) of deer and elk is commonly known as chronic wasting disease (CWD). TSE is the name given to a group of diseases affecting humans and animals, which are associated with the proliferation of an altered form of a normal intracellular protein. These protein particles are commonly known as prions.
POTENTIAL IMPACTSChronic wasting disease is a progressive and ultimately fatal disease that affects both the central and peripheral nervous systems, causing weight loss, behavioural changes, excessive salivation and increased drinking and urination. Its presence in New Zealand could therefore: • lead to international trade restrictions on deer and elk products;• raise questions about the status of other TSE diseases (for example, scrapie and bovine spongiform
encephalopathy);• have a devastating financial effect on the market for deer and elk and their products;• cause high mortality among domesticated deer and elk and even reduce the total population below a
critical mass; • bring a socio-economic and ecological burden associated with control and eradication programmes.
INTRODUCTION MECHANISMS The exact mechanism of transmission is still unknown, but in contrast to TSEs such as bovine spongiform encephalopathy in cattle, CWD is contagious and thus can be transmitted between farmed and wild populations of the same species. Prions are resistant to heat, desiccation and disinfectant treatments, and persist in the environment by binding to inorganic soil constituents. This implies that any product derived from or contaminated by an infected animal could potentially transmit the disease.
SURVEILLANCE PROGRAMMEObjectives: • to provide assurance of country freedom from CWD;• to provide early warning in the event of an incursion of CWD to facilitate containment and
eradication.
Start: 1990
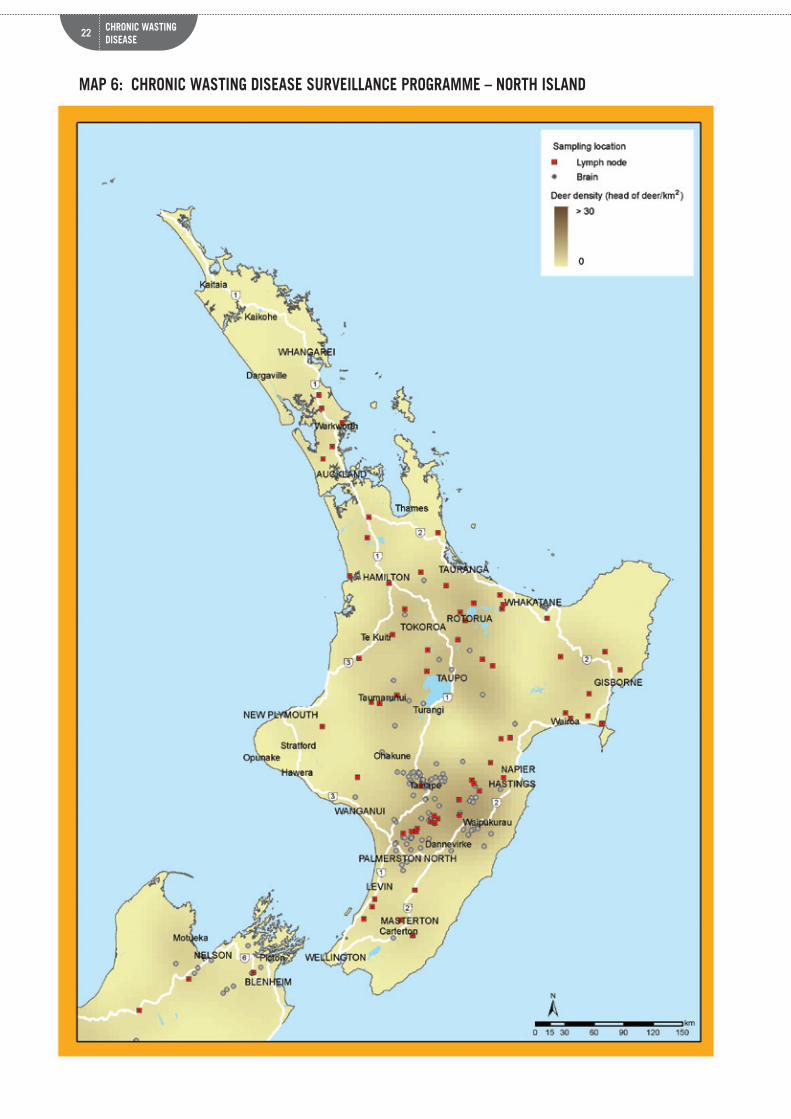
Methodology: Brain samples from adult deer and elk that are at least two years old and show clinical signs of progressive wasting, nervous disease, or acute aspiration pneumonia are submitted by veterinary practitioners for further diagnostic testing. Lymph node tissue samples collected from healthy adult animals sent to slaughter at commercial meat processing plants are also tested (Map 6 and 7).
Sampling: All samples across the country that fit the sampling criteria are tested. To date more than 2000 samples from several hundred farms have been screened by the programme.
STATUSNew Zealand is considered free from CWD.
INCURSIONSNo incursions have been detected in New Zealand to date.
22
MAP 6: CHRONIC WASTING DISEASE SURVEILLANCE PROGRAMME – NORTH ISLAND
CHRONIC WASTINGDISEASE

23
MAP 7: CHRONIC WASTING DISEASE SURVEILLANCE PROGRAMME – SOUTH ISLAND
CHRONIC WASTINGDISEASE

24 FRUIT FLY
2.5 FRUIT FLY SURVEILLANCE PROGRAMME
TARGET ORGANISM/SEconomically important fruit flies of the family Tephritidae such as:• Queensland fruit fly (Bactrocera tryoni); • Oriental fruit fly (Bactrocera dorsalis);• Mediterranean fruit fly (Ceratitis capitata)
POTENTIAL IMPACTSCollectively, fruit flies are considered the world’s worst fruit crop pest. Their larvae damage the pulp of fruit and vegetables, leaving them inedible and unmarketable. The presence of economically important fruit flies in New Zealand could therefore:• damage commercial and home crops;• generate trade restrictions on horticulture exports;• affect native flora;• impose an economic and ecological burden associated with control and eradication programmes.
INTRODUCTION MECHANISMS Fruit flies could enter New Zealand as eggs or maggots in fruit and vegetables imported commercially or brought in by travellers from overseas.
SURVEILLANCE PROGRAMMEObjectives: • to provide early detection of fruit fly incursions to facilitate eradication;• to provide assurance of country freedom from economically important fruit flies.
Start: mid 1970s
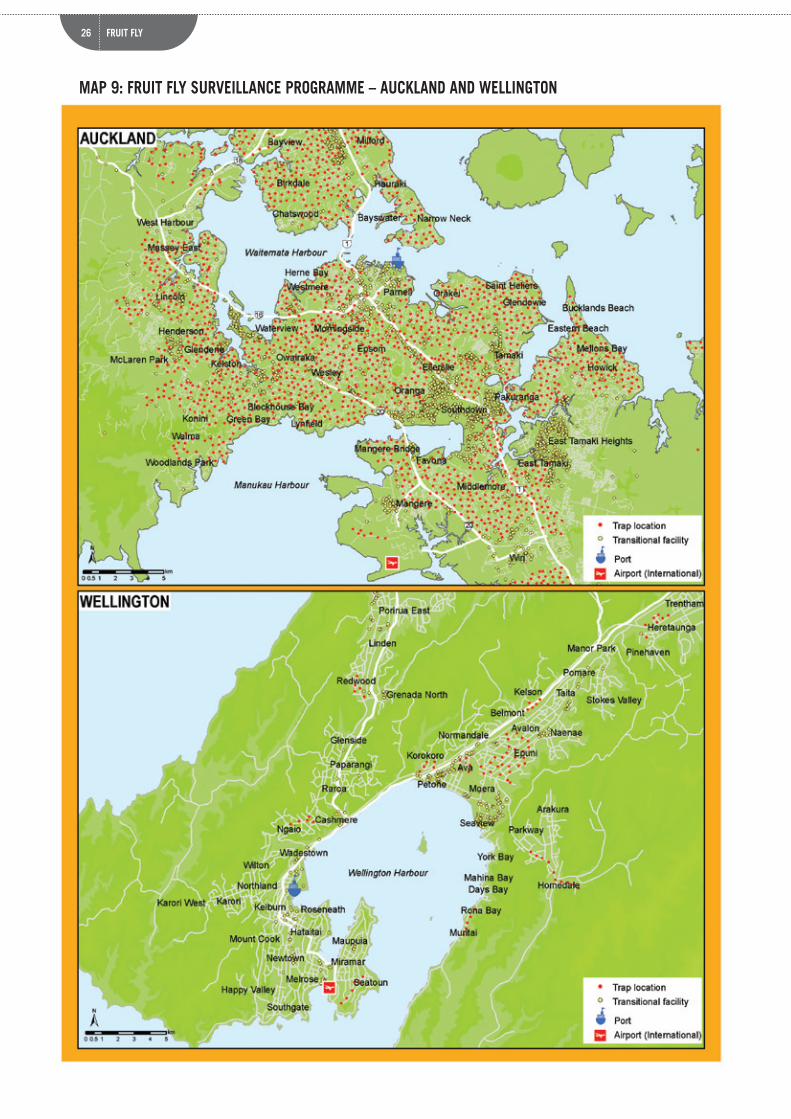
Methodology: Pheromone-lure traps are placed in potential host trees and arranged in a grid pattern designed to cover urban areas identified as likely points of entry because of their proximity to international airports, seaports and transitional facilities (Maps 8–10).
Sampling: September to June annually. This programme deploys about 7500 traps throughout the country.
STATUSNew Zealand is considered free from economically important fruit flies.
INCURSIONSThere have been five incursions in Auckland and Northland. All have been successfully eradicated. The last incursion was at Mount Roskill in 1996. There have been no incursions since X-ray screening was introduced at airports to detect fruit in passenger baggage.

25 FRUIT FLY
MAP 8: FRUIT FLY SURVEILLANCE PROGRAMME
26 FRUIT FLY
MAP 9: FRUIT FLY SURVEILLANCE PROGRAMME – AUCKLAND AND WELLINGTON

27 FRUIT FLY
MAP 10: FRUIT FLY SURVEILLANCE PROGRAMME – CHRISTCHURCH AND DUNEDIN

28 GYPSY MOTH
2.6 GYPSY MOTH SURVEILLANCE PROGRAMME
TARGET ORGANISM/SAll moth species of the genus Lymantria, including the Asian gypsy moth (Lymantria dispar asiatica) and the European gypsy moth (Lymantria dispar dispar). The Asian species is regarded as a higher risk owing to the numbers of containers and cars imported from Asia. It also presents a greater biological risk because it feeds on a wider range of hosts and the female has a greater flying capability.
POTENTIAL IMPACTSThe larvae of the gypsy month can strip trees of their foliage, damaging and exposing them to diseases. The presence of the gypsy moth in New Zealand could therefore:• damage forestry and horticulture tree species (for example, pines and apple trees);• generate restrictions on forestry, horticultural and industrial exports;• affect grasses, weeds, herbs and garden crops;• damage native bush, including the endemic black beech (Nothofagus solandri);• impose an economic and ecological burden associated with control and eradication programmes.
INTRODUCTION MECHANISMS Gypsy moths could enter New Zealand as egg masses, larvae or adult in vessels, shipping containers, imported cars, goods carried by travellers, and immigrants’ personal effects.
SURVEILLANCE PROGRAMMEObjectives: • to provide early detection of gypsy moth to facilitate eradication;• to provide assurance of country freedom from gypsy moth.
Start: 1992
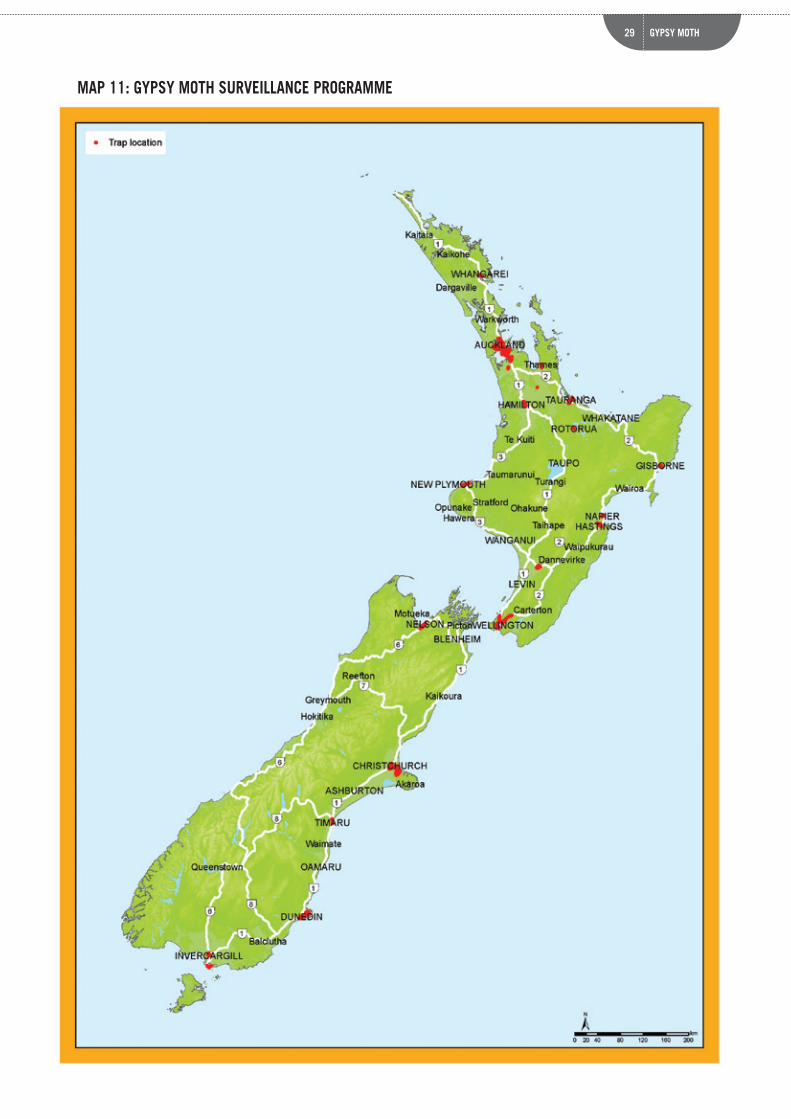
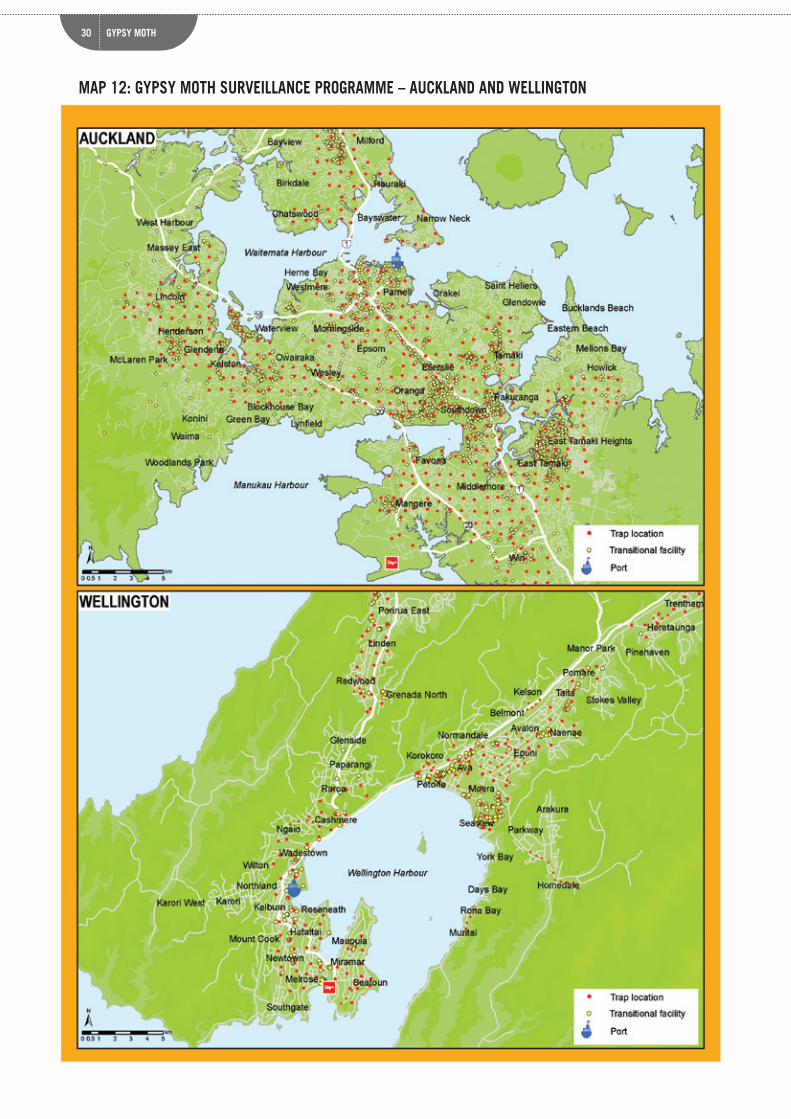
Methodology: Pheromone-lure traps placed in potential host trees and arranged in a grid pattern designed to cover those areas identified as likely points of entry for gypsy moth.
Sampling: September-June each year. The programme uses more than 1500 traps across the country (Maps 11–13).
STATUSNew Zealand is considered free from gypsy moths.
INCURSIONSThere has been only one incursion, in Hamilton in 2003. After an intensive eradication programme (including aerial treatment) the moth was declared eradicated in 2005.
29 GYPSY MOTH
MAP 11: GYPSY MOTH SURVEILLANCE PROGRAMME
30 GYPSY MOTH
MAP 12: GYPSY MOTH SURVEILLANCE PROGRAMME – AUCKLAND AND WELLINGTON

31 GYPSY MOTH
MAP 13: GYPSY MOTH SURVEILLANCE PROGRAMME – CHRISTCHURCH AND DUNEDIN
32 HIGH RISK SITE
2.7 HIGH RISK SITE SURVEILLANCE PROGRAMME
TARGET ORGANISM/SAll organisms that may pose a threat to exotic plantation forestry, urban and indigenous forest environments and tree fruit crops.
POTENTIAL IMPACTSThe range of potential impacts is species-specific but in general terms the presence of these pests could: • have a devastating impact on the forestry and tree crops industries;• lead to international trade restrictions (even potentially a complete ban) on New Zealand’s forestry exports;• affect vegetation (urban trees, rural trees and native forest);• impose a socio-economic burden associated with control and eradication programmes.
INTRODUCTION MECHANISMS As with the impacts, the introduction mechanisms are species-specific but are all associated with shipping containers, passengers, international mail, aircraft and vessels.
SURVEILLANCE PROGRAMMEObjectives: • to provide effective detections of plant pests;• to provide evidence of pest-free status or area freedom to trade partners;• to monitor pest distribution;• to collect urban tree records to facilitate future host-specific surveys.
Start: 2005
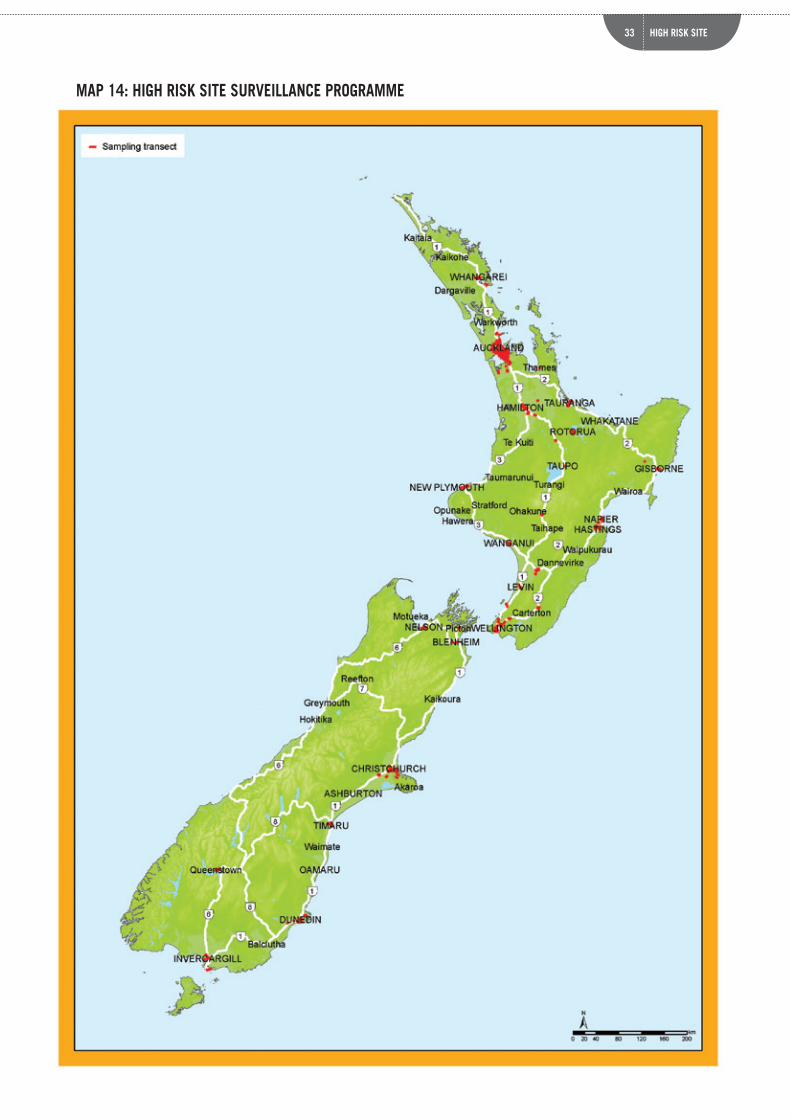
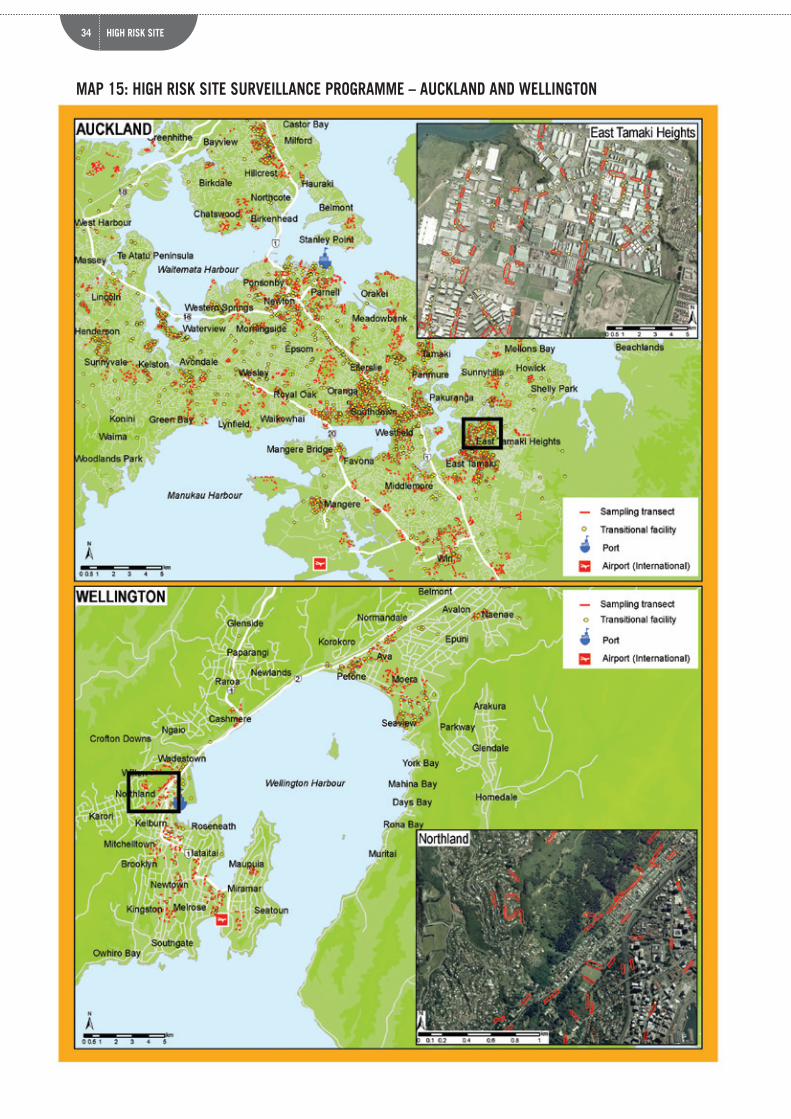
Methodology: A set of transects has been defined around sites regarded as high risk because of their proximity to international airports, commercial seaports, transitional facilities, first-night tourist campsites and areas with a wide range of plants and tree species (Map 14–16). Woody vegetation along these transects is visually inspected for presence and signs of non-indigenous organisms and diseases. Samples of all suspect organisms or vegetation showing signs of disease that could be new are collected and sent to the laboratory for identification.
Sampling: All sites are sampled from September to May each year, as these are the times when new organisms are more likely to be growing and spreading. About 7000 transect inspections are carried out each year.
STATUSNew Zealand is considered free from many diseases and pests of trees and forests that would be found by the programme if they entered the country. These include sudden oak death disease (caused by the fungus Phytophthora ramorum), white-spotted tussock moth (Orgyia thyellina), pine pitch canker (caused by the fungus Fusarium circinatum), western gall rust (caused by the fungus Endocronartium harknessii) and pine wilt nematode (Bursaphelenchus xylophilus).
INCURSIONSEach year at least two organisms new to New Zealand are found by the programme, which has also assisted in monitoring the spread of gum leaf skeletoniser (Uraba lugens) around the country. In addition, hundreds of new host and new bioregion reports on already-established organisms are made annually.
33 HIGH RISK SITE
MAP 14: HIGH RISK SITE SURVEILLANCE PROGRAMME
34 HIGH RISK SITE
MAP 15: HIGH RISK SITE SURVEILLANCE PROGRAMME – AUCKLAND AND WELLINGTON

35 HIGH RISK SITE
MAP 16: HIGH RISK SITE SURVEILLANCE PROGRAMME – CHRISTCHURCH AND DUNEDIN
36 INVASIVE ANT
2.8 NATIONAL INVASIVE ANT SURVEILLANCE PROGRAMME
TARGET ORGANISM/SAll non-native ants, but in particular those known to be invasive such as the:• red imported fire ant (Solenopsis invicta);• tropical fire ant (Solenopsis geminata);• black crazy ant (Paratrechina longicornis);• yellow crazy ant (Anoplolepis gracilipes);• little fire ant (Wasmannia auropunctata);• ghost ant (Tapinoma melanocephalum);• carpenter ant (Camponotus spp.);• Singapore ant (Monomorium destructor).
POTENTIAL IMPACTSA number of ant species are known to be invasive and are environmental, economic and nuisance pests. Impacts are species-specific but include:• ecosystem disruption;• impacts on native fauna;• impacts on horticulture;• damage to electrical wiring and machinery;• house infestation;• bites and stings, especially when nests are disturbed.
INTRODUCTION MECHANISMS Ants are very good “hitch-hiker species” and are often transported on plant products or inanimate objects including machinery, personal effects, used vehicles and shipping containers.
SURVEILLANCE PROGRAMMEObjectives: • to detect newly established nests of invasive ant species at high-risk sites around New Zealand;• to identify changes in distribution of non-indigenous ant species already established in New Zealand, for
reporting purposes.
Start: 2003
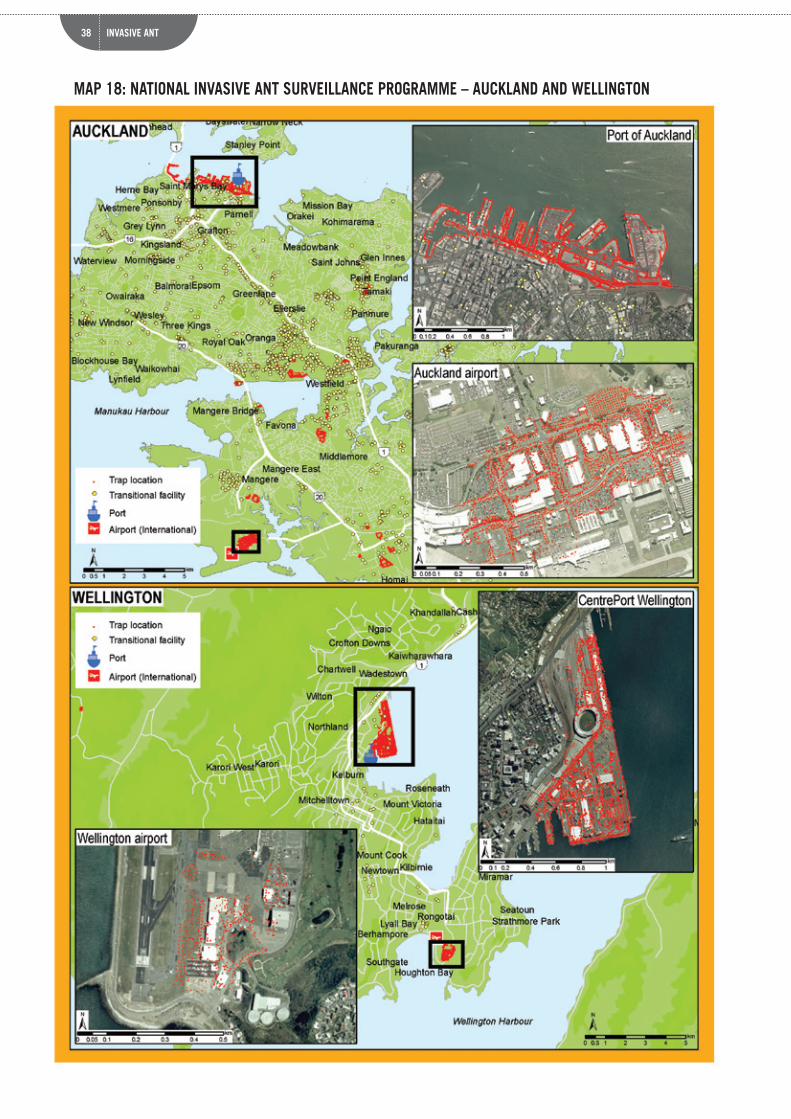
Methodology: Annual targeted surveys are conducted in sites identified as likely points of entry for exotic ant species such as seaports, marinas, international airports and transitional facilities (Maps 17–19). Pottles with attractant baits are laid at sites where ants are likely to be present. Attractant baits contain both a carbohydrate (sugar solution) and protein source (peanut butter and sausage meat). The use of both carbohydrate and protein maximises the chances of catching foraging exotic ants of different species. Ants caught are sent to the laboratory for identification.
Sampling: All sites are sampled during summer, when ants are more likely to be foraging.
STATUSNone of the above targeted organism is present in New Zealand.
INCURSIONSOver seven years of operation, the programme has detected 119 ant incursions at ports and transitional facilities around the country. In each case eradication has been easily achieved without the need for a full-scale response.

37 INVASIVE ANT
MAP 17: NATIONAL INVASIVE ANT SURVEILLANCE PROGRAMME
38 INVASIVE ANT
MAP 18: NATIONAL INVASIVE ANT SURVEILLANCE PROGRAMME – AUCKLAND AND WELLINGTON

39 INVASIVE ANT
MAP 19: NATIONAL INVASIVE ANT SURVEILLANCE PROGRAMME – CHRISTCHURCH AND DUNEDIN

40 MARINE
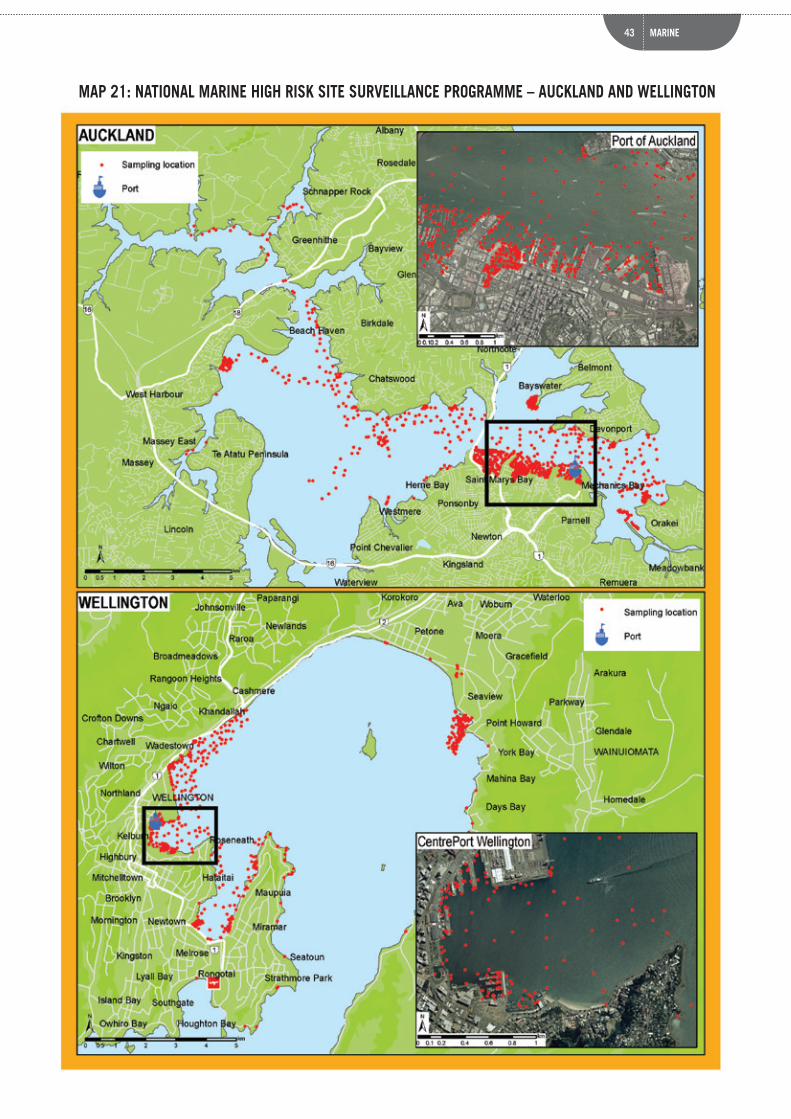
2.9 NATIONAL MARINE HIGH RISK SITE SURVEILLANCE PROGRAMME
TARGET ORGANISM/SUnwanted non-indigenous marine organisms12. The following notifiable organisms13 are in the Unwanted Organisms Register under the Biosecurity Act 1993:• European shore crab (Carcinus maenas); • Chinese mitten crab (Eriocheir sinensis);• Northern Pacific seastar (Asterias amurensis);• Mediterranean fanworm (Sabella spallanzanii);• Asian clam (Potamocorbula amurensis);• A marine aquarium weed (Caulerpa taxifolia).
POTENTIAL IMPACTSThe introduction of Unwanted Organisms to New Zealand has the potential to affect a range of values in coastal and marine environments. The effects are likely to include direct impacts on monetary value derived from natural resources, as well as reduced ecosystem services that contribute to health and wellbeing.
International reports on incursions and impacts of these Unwanted Organisms indicate that fisheries resources (including aquaculture) and environmental amenities would likely be affected by:• increased levels of predation; • increased competition for food, habitat and space;• destabilisation of habitat and nutrient cycling;• introduction of exotic diseases;• reduced endemic biodiversity; • increased susceptibility to subsequent disturbance and introductions.
INTRODUCTION MECHANISMS Typically introductions of unwanted marine organisms are caused by the transfer of ballast water14 and biofouling15 on vessels at ports of first entry. Introductions can also occur through importation of aquaculture equipment, and marine ornamental organisms used in personal and public aquariums.
SURVEILLANCE PROGRAMMEObjectives: • to detect incursions of new to New Zealand non-indigenous organisms listed on the
Unwanted Organisms Register at selected high risk sites throughout New Zealand; • to detect incursions of new to New Zealand non-indigenous or cryptogenic16 organisms not
listed on the Unwanted Organisms Register at selected high risk sites throughout New Zealand;
• to detect range extensions of established non-indigenous or cryptogenic organisms that exhibit characteristics of pests and diseases.
Start: 2000
Methodology: SCUBA-diving transects, shore searches, crab condos, starfish traps and benthic sleds are used to detect suspect organisms at 12 locations throughout New Zealand (Maps 20–22). These locations were selected because they have the most first-point-of-entry traffic and therefore present the highest introduction risk.
12 Under the Biosecurity Act, any unwanted organism has that status throughout New Zealand. 13 Under the Policy Statement on Unwanted Organisms all notifiable organisms are Unwanted Organisms, and limited to those organisms
which cause serious harm to natural and physical resources or human health.14 Fresh or salt water stored in special tanks for stability purposes. Ballast water is usually taken in or released during loading operations at
ports.15 Accumulation of organisms (for example, algae, invertebrates) on wetted structures of vessels (for example, hull, intake pipes).16 Cryptogenic refers to a species whose origin cannot be clearly classified as either indigenous or non-indigenous.

41 MARINE
Sampling: All sites are surveyed using a systematic rotational approach to ensure appropriate spatial and temporal replication. Each site is surveyed twice over a period of 12 months. The sampling includes over 13 000 sampling sites, selected using environmental modelling relevant to target species.
STATUSOne notified organism on the Unwanted Organisms Register has been introduced to New Zealand: the Mediterranean fanworm (Sabella spallanzanii). It was first detected in Lyttelton Harbour and later in the Waitemata Harbour.
INCURSIONSAbout 260 non-indigenous marine species have been identified at ports throughout New Zealand.

42 MARINE
MAP 20: NATIONAL MARINE HIGH RISK SITE SURVEILLANCE PROGRAMME
43 MARINE
MAP 21: NATIONAL MARINE HIGH RISK SITE SURVEILLANCE PROGRAMME – AUCKLAND AND WELLINGTON

44 MARINE
MAP 22: NATIONAL MARINE HIGH RISK SITE SURVEILLANCE PROGRAMME – CHRISTCHURCH AND DUNEDIN

45 RUMINANT PROTEIN
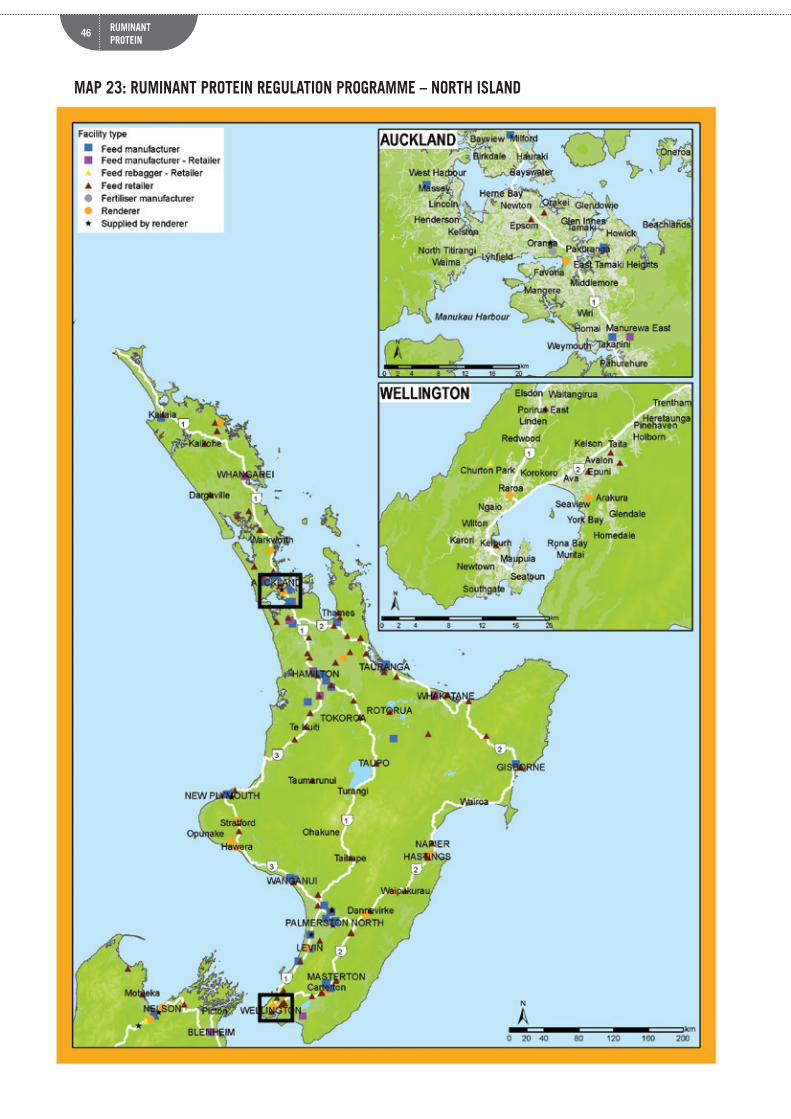
2.10 RUMINANT PROTEIN REGULATION PROGRAMME
TARGET ORGANISM/SThis programme does not target specific organisms but supervises compliance with a management plan that seeks to prevent contamination of ruminant feed with ruminant protein. This is one of the measures that are in place to keep New Zealand with a negligible bovine spongiform encephalopathy (BSE) risk status. BSE is commonly known as mad cow disease.
POTENTIAL IMPACTSBSE affects the central nervous system of cattle, causing loss of control of limbs, trembling, swaying of the head, and erratic behaviour. It also leads to decreased milk production, weight loss and deteriorating body condition. It is believed that the disease can be transmitted to some humans with a particular genetic makeup if they consume products derived from infected animals. The presence of BSE in New Zealand could therefore: • have a devastating effect on the market for ruminants and ruminant products owing to severe international
trade restrictions;• jeopardise the livelihood of cattle farmers;• create a socio-economic burden associated with control and eradication programmes.
INTRODUCTION MECHANISMS BSE could enter New Zealand via imports of live ruminants or ruminant products. It is now known that the disease prions (infectious protein particles) can resist heat, desiccation and disinfectant treatments. Measures preventing contamination of ruminant feed with ruminant protein are therefore essential to prevent the potential spread of the disease.
SURVEILLANCE PROGRAMMEObjectives: • to minimise the risk of contaminating feed intended for ruminants in feed mills that use
ruminant protein for other purposes; • to ensure that premises comply with the Biosecurity (Ruminant Protein) Regulations 1999.
Start: 2000 (Previously, from 1995 to 1999, there was a voluntary control programme in place.)
Methodology: Business premises that trade in, manufacture, store or distribute animal feed (for example, manufacturers, transporters, retailers and re-baggers) are randomly selected and audited to ensure that they comply with the regulations (Maps 23 and 24). Manufacturers of feed for both ruminants and non-ruminants are required to register a Ruminant Protein Control Programme (RPCP).
Sampling: Annual compliance audits are conducted on about 40 non-RPCP premises. All RPCP operators are audited annually by independent auditors.
STATUSIn 2007 the World Organisation for Animal Health (OIE) awarded New Zealand the most favourable status: negligible BSE risk.
INCURSIONSBSE has never been detected in New Zealand.
46
MAP 23: RUMINANT PROTEIN REGULATION PROGRAMME – NORTH ISLAND
RUMINANT PROTEIN

47
MAP 24: RUMINANT PROTEIN REGULATION PROGRAMME – SOUTH ISLAND
RUMINANT PROTEIN

48 DATA SOURCES
DATA SOURCES• Cattle and deer data: AgribaseTM
• Flight and cargo arrivals: Statistics NZ.• Topographic data: Land Information New Zealand.• Aerial photographs: © CNES 2008, Distribution Spot Image S.A., France; © DigitalGlobe Inc. • Roads: CRS, Terralink Roads and TIL Imagery. • Mean annual temperature: Climate grid of average air temperature (1971-2000), NIWA 2008.• Unless stated otherwise, all sampling locations have been obtained from MAF’s providers through each
biosecurity surveillance contract. • Avian influenza sampling locations provided by Dr. Wlodek Stanislawek.

49 REFERENCES
REFERENCES AND FURTHER READINGBissmire, S (2006) Red imported fire ants found at Whirinaki. Surveillance 69: 9.
Kospartov, M; Inglis, G; Seaward, K; van den Brink, A; D’Archino, R; Ahyong, S (2008) Non-indigenous and cryptogenic marine species in New Zealand: Current state of knowledge: interim report (research project BNZ10740). Unpublished report prepared by NIWA for MAF Biosecurity New Zealand, June 2008.
MAF Biosecurity New Zealand (2009) Biosecurity surveillance strategy 2020. MAF Biosecurity New Zealand, Wellington, New Zealand.
MAF Biosecurity New Zealand (2008) Pest risk analysis for six moth species: lessons for the biosecurity system on managing hitchhiker organisms. MAF Biosecurity New Zealand, Wellington, New Zealand.
McIntyre, L; Brangenberg, N (2009) Chronic wasting disease. Surveillance 36(1): 5–7.
Ministry of Agriculture and Forestry. Arbovirus and Culicoides Surveillance Programme. http://www.biosecurity.govt.nz/pests/surv-mgmt/surv/arbovirus-culicoides. Accessed 7 May 2011.
Ministry of Agriculture and Forestry. Biosecurity Surveillance. http://www.biosecurity.govt.nz/pests/surv mgmt/surv. Accessed 7 May 2011.
Ministry of Agriculture and Forestry. Fruit Fly Surveillance Programme. http://www.biosecurity.govt.nz/pests/surv-mgmt/surv/fruit-fly. Accessed 7 May 2011.
Ministry of Agriculture and Forestry. Gypsy Moth Surveillance Programme. http://www.biosecurity.govt.nz/pests/surv-mgmt/surv/gypsy-moth. Accessed 7 May 2011.
Ministry of Agriculture and Forestry. MAF Biosecurity New Zealand – High Risk Site Surveillance. http://www.biosecurity.govt.nz/pests/surv-mgmt/surv/high-risk. Accessed 7 May 2011.
Ministry of Agriculture and Forestry. Ruminant Protein Control Programme. http://www.biosecurity.govt.nz/feedban. Accessed 7 May 2011.
Ministry of Agriculture and Forestry. Marine Biosecurity – Monitoring and Surveillance. http://www.biosecurity.govt.nz/pests/surv-mgmt/surv/marine. Accessed 7 May 2011.
Ministry of Agriculture and Forestry. Transmissible Spongiform Encephalopathies (TSE) Surveillance. http://www.biosecurity.govt.nz/pests/tse/surveillance. Accessed 7 May 2011.
Ministry of Agriculture and Forestry. Unwanted Organisms Register. http://www1.maf.govt.nz/uor/searchframe.htm. Accessed 7 May 2011.
Oakley, L; Kittelberger, R; Green, O (2009) Arbovirus surveillance. Surveillance 37(3): 22.
Poland, R (2002) New Zealand’s surveillance programme for Chronic wasting disease. Surveillance 29(4): 3–5.
Ryan, T J; Frampton, E R; Motha, M X J; Horner, G W (1991) Arbovirus and arbovirus vector surveillance in New Zealand. Surveillance 18(5): 24–26.
Tana, T (2007) Arbovirus surveillance programme. Surveillance 34(2): 10–12.
Tana, T; Frazer, J (2007) Avian influenza surveillance expands. Biosecurity (77): 3.
Wilkins, P (2010) National invasive ant surveillance report July 2010. Contract 1148 – National Invasive Ant Surveillance 2009/2010. Unpublished report prepared by AsureQuality Ltd for MAF Biosecuirty New Zealand, July 2010.