mining error variance and hitting pay …socpsy/papers/miningerror.pdf · mining error variance and...
TRANSCRIPT

MINING ERROR VARIANCE AND HITTING PAY-DIRT: Discovering Systematic Variation in Social Sentiments
Lisa Thomas David R. Heise Indiana University
According to traditional error theory, sentiment measurements vary unsystematicallyfrom individual to individual. However, we find some patterned deviation in sentimentsthat characterize subsets of respondents within a seemingly homogeneous population.After demonstrating the existence of such patterns, we report an exploratory studyaimed at identifying social characteristics of people with different patterns ofsentiments. People embedded in multiple social networks have exaggerated sentimentsthat contour cultural patterns, and people with few social associations have attenuatedsentiments conveying cultural detachment. In addition, people with disciplinary parentsand romantic privation have some distinctive sentiments, depending on their gender.
Culture strongly constrains sentiments about conventional roles, behaviors, and personal attributes. Indeed, sentiments that are attached to social categories can be viewed as part of culture; we thereby expect little variation in sentiments among competent bearers of the culture (Romney, Weller, and Batchelder 1986). David Heise (1966) provided empirical support for this view, finding that navy enlistees from the whole nation yielded about the same average sentiment measurements as did college students from the Midwest, and he concluded that “the attitudinal association or connotation of a word. ..is generally uniform across groups” (p. 238). Heise discussed individual rating variance as idiosyncratic deviance and as random measurement error, a view that encouraged the development of affect control theory (Heise 1979), which predicts social events and emotions by processing culturally defined sentiments that arise during symbolic interaction.
While conceding that culture strongly determines feelings about different social entities, this article reexamines the matter of individual variation in sentiments around cultural norms. Is such variation really idiosyncratic and random, or is there patterned variation, with some deviations in sentiments being shared by different people even in a seemingly homogeneous population? If patterned deviations exist, what characterizes people who deviate from cultural norms in the same way? We addressed these questions with two studies. The first study, using an existing data set, identified major patterns of deviation in sentiment measurements. The second study, utilizing in-depth interviewing, uncovered some uniformities in social relation-
Direct all correspondence to David R. Heise, Department of Sociology, Indiana University, Bloomington, IN 47405.
The Sociological Quarterly, Volume 36, Number 2, pages 425-439. Copyright @ 1995 by The Midwest Sociological Society. All rights of reproduction In any form requested. ISSN: 0038-0253.

426 THE SOCIOLOGICAL QUARTERLY Vol. 36/No. 2/1995
ships among people who share a given pattern of sentiment deviations. Both studies use semantic differentials to measure sentiments, so we turn first to a discussion of the instrument and to the customary framework for viewing deviations in measurements.
MEASUREMENT OF SENTIMENTS
An empirical research program that spanned more than three decades and more than thirty cultures worldwide derived, through factor analysis, three dimensions of affective meaning that differentiate all kinds of stimuli (Osgood, Suci, and Tannenbaum 1957; Snider and Os-good 1969; Osgood, May and Miron 1975). The evaluation (E) dimension involves judgments of things as being relatively good or bad, the potency (P) dimension involves judgments of strength as opposed to weakness, and the activity (A) dimension involves appraisals of liveli-ness versus quietness.
Measurements on these dimensions are made with semantic differentials. The stimulus ap-pears above the scale, and the opposite poles of the scale are defined by opposing adjectives. For example, in our work, we used a scale defined by “good, nice” at one end and “bad, awful” at the other end to measure evaluation; a scale defined by “big, powerful” versus “little, powerless” to measure potency; and a scale defined by “fast, lively, young” versus “slow, quiet, old” to measure activity. Intervening points on each scale are defined by ad-verbs: “neutral” at the middle, ordinarily coded1 as 0.0; “slightly,” coded as 1.0; “quite,” 2.0; “extremely,” 3.0; and “infinitely,” 4.3. In contemporary research (e.g., Heise and Thomas 1989; Britt and Heise 1992), the stimulus and scale often are presented on a computer screen, and the respondent rates the stimulus by moving a pointer along the scale.
Other dimensions of affective meaning have been identified within specific populations of raters and for certain categories of stimuli, but the EPA dimensions are cross-cultural univer-sals (Osgood, May, and Miron 1975), and they capture much of the variation of ratings on bipolar semantically defined rating scales. An early study (Osgood, Suci and Tannenbaum 1957, p. 37) found that the three factors accounted for 49 percent of the total variance in judgments, with evaluation representing 69 percent of the common factor variance; this kind of finding was replicated in scores of later studies.
Semantic differential ratings of multiple respondents from a culture are averaged to yield EPA profiles that reflect shared affective meanings, referred to as sentiments (Heise 1979). Averaged EPA profiles vary in significant ways from one culture to another, even for seem-ingly objective concepts like “water” (Osgood, May, and Miron 1975). As Charles E. Osgood (1962, p. 13) noted, “the fact that the factorial system stays constant does not imply that these groups necessarily shared the same meanings for specific concepts—in many cases they did not.”
Within-Population Variations
Daniel Kahneman (1963) presented a model of semantic differential ratings, suggesting that rating variance reflects: (1) differences in interpreting adjectives that define the scales, (2) unique individual differences in sentiments, and biases in scale-checking—for example, a preference for using end points (exaggeration), or a tendency to use middle points and avoid end points (attenuation), (3) temporal variation associated with recent experiences, and (4) random error. Heise (1969) roughly estimated the contribution of each factor to individuals' variance around mean scores as follows:

427 Mining Error Variance and Hitting Pay-Dirt
1/10 due to people's differences in interpretation of the scales; 1/4 due to people's differences in sentiments and scale-checking biases; 1/4 due to temporal deviations from respondent's own true scores; 2/5 due to random error.
In other words, slightly less than half of the variation in responses was believed to be associated with random measurement errors, the rest with idiosyncratic characteristics of raters.
Figure 1 • Ninety-five percent Confidence Limits for Drug Evaluations by Students with Varying Experiences
Later studies have shown that members of subcultures give very different EPA ratings for stimuli that are centrally relevant to the subculture, even though their sentiments about other

428 THE SOCIOLOGICAL QUARTERLY Vol. 36/No. 2/1995
concepts are the same as in the larger culture (Heise 1979; Smith-Lovin and Douglas 1992). For example, American college students have relatively homogeneous sentiments about most concepts, but, as shown in Figure 1 (based on unpublished data), students who never use recreational drugs rate marijuana and cocaine as extremely bad, while students who have experienced a variety of drugs rate marijuana and cocaine as good. Studies also have suggested that some variations in EPA ratings relate to social characteristics. For example, Neil J. MacKinnon and Leo Keating (1989) found that women rate negative emotions as less active than do men, and Peter Burke (1977; 1980) found gender variation in semantic differential ratings of selected role-identity concepts. I. M. Marks (1965, 1966) demonstrated that individuals with the same diagnosed mental illness rated certain family and intimacy concepts similarly, and rating profiles differentiated one psychiatric group from another. Neil MacKinnon and Gene Summers (1976) tested a hypothesis of Neal Gross, W. S. Mason, and A. W. McEachern (1958) who posited that social homogeneity implies consensus in role expectations; MacKinnon and Summers found that sex, age, and social position correlate with small but systematic variations in approval of role behaviors.
STUDY 1: IDENTIFYING SENTIMENT PATTERNS
New technology makes the time ripe for reexamining variation in semantic differential ratings. Computer-based measurement provides unprecedented precision in semantic differential ratings, and statistical packages for personal computers offer easy access to novel forms of graphical and statistical analysis that can be used to search for patterning in measurements.
We examined a set of EPA ratings (Heise and Thomas 1989) obtained with ATTITUDE (Heise and Lewis 1988), a program for personal computers that collects semantic differential data with exceptional precision. Ratings could range from -4.33 through 0 to +4.33, with a total of 79 positions discriminated along the scale. The measuring instrument offered enough precision to discriminate patterns that might be lost in measurement with cruder instruments. Moreover, the 326 respondents (162 males and 164 females) from an American university's psychology subject pool were predominately young, white, and middle-class—exactly the kind of homogeneous sample that ordinarily is presumed to be without systematic internal variation with regard to affective meanings. The sample of stimuli—224 emotion words, social identities, and combinations of emotions and identities—offered good opportunities for finding individual variation if it exists.
Parallel graphs displaying respondents' EPA ratings were obtained for every emotion and every social identity. Exemplars of the results are shown in Figure 2. Most of the graphs revealed some dispersion and a few deviant ratings, while showing a generally strong central tendency as with the ratings of “judge” shown in Figure 2. However, distinguishable patterns were visually apparent in ratings of other stimuli as with the case of “mad,” also shown in Figure 2.
About a fifth of the 44 emotions and 64 identities yielded graphs that suggested that all individuals in the population do not share a similar affective response to the concept. In the cases where subgroups were visually apparent, the graphs suggested that there were two or three distinct subsets of respondents, as in the case of “mad.” Thus, the graphical analyses suggested that the homogeneity assumption of no systematic variation across respondents may be right for most stimuli but is wrong for a few stimuli.
We used K-Means cluster analysis to determine if formal statistical analysis could confirm what the eye perceived. K-Means analysis detects natural groupings in multimeasures data

429 Mining Error Variance and Hitting Pay-Dirt
Figure 2 • Parallel Plots of Ratings (top) and Cluster Means (bottom)
from a sample of respondents by maximizing between-group variation and minimizing within-group variation for a specified number of subgroups. These analyses, computed for the same stimuli as were graphed, indicated that significant patterns of variation occur for most stimuli—even those where the eye detects no violation of the homogeneity assumption.
For example, results from K-Means cluster analysis on all three rating dimensions for the “judge” data indicate that the respondents can be divided into at least five subgroups, each of which is relatively homogeneous compared to differences between subgroups. The subgroup means are plotted below the “judge” ratings in Figure 2. In the first subgroup a judge was rated as good, powerful, and active whereas in the second subgroup a judge was rated as good, strong, and inactive. Meanwhile another large subgroup of respondents rated a judge as evaluatively neutral, strong, and inactive. The fourth subgroup consisted of respondents who rated a judge as somewhat bad, strong, and very inactive. The fifth subgroup consists of two respondents who rated a judge as distinctly bad and weak.2 Actually, other analyses indicated that the judge ratings could be partitioned into at least nine distinguishable groups, though the

430 THE SOCIOLOGICAL QUARTERLY Vol. 36/No. 2/1995
differences among the nine groups are too small for us to describe effectively or to discern in Figure 2.
Moreover, the statistical analyses indicated that the eye may detect too few subgroups even when subgroups are visually obvious. For example, the K-Means clustering results for the “mad” data suggested that at least nine different groups could be extracted. A partitioning into five groups is presented at the bottom of Figure 2, below the ratings data. One subgroup is simply a deviant individual who rated being mad as very good: the average evaluation of the emotion is quite negative in other subgroups. Two subgroups. consisted of individuals who rated being mad as bad and weak, with one subgroup seeing the emotion as somewhat quiet while the other subgroup rated the emotion as quite lively. Two other subgroups consisted of people who think being mad is bad and strong—some say with extreme activation, those in the other subgroup say with neither activation nor quiescence.
The statistical analyses might detect more patterning than is sensible to recognize since the graph of “judge” ratings in Figure 2 shows the kind of distribution that many social science researchers recognize as typical “random error” when sampling from a population. Nevertheless, the graphical and statistical results together do indicate that mean EPA ratings may provide an overly simplified representation of sentiments in a population. Rather, it may be more meaningful to conceptualize even a culturally homogeneous population as composed of distinct subsets of respondents with regard to some sentiments.
Our next question was: Are subsets composed differently for each stimulus, or do some respondents have distinctive sentiments for a variety of concepts? We addressed this question by computing component analyses in which EPA ratings for all of the emotions or for all of the identities rated by a person were combined into a battery of variables. The David Heise and Lisa Thomas (1989) study obtained ratings with two different forms from two subsamples of respondents; we computed four analyses: “Emotions—Form 1” dealt with 22 emotions measured on evaluation, potency, and activity (66 variables) rated by 165 respondents; “Emotions—Form 2” dealt with a different 22 emotions rated by a sample of 161 respondents; “Identities—Form 1” dealt with 32 identities rated by the 165 respondents; and “Identities-Form 2” dealt with a different set of 32 identities rated by the 161 respondents.
In three of the four analyses, the size of extracted components diminished after the second component in a way that is typical of random variation; in the fourth analysis, the random-components pattern appeared after the fourth component. A reasonable conclusion is that the first two components are meaningful. This result indicates that individual variations in sentiments are somewhat predictable from one concept to another and that there are two main ways that individuals vary in sentiments.
We postpone interpretation of the first two components to our discussion of Study 2. For now, we note that the components were defined by perplexing combinations of EPA ratings on different stimuli. For example, the first component in the Identities-Form 2 analysis was defined by high potency ratings for “judge,” “disciplinarian,” and “gunman”; by low potency and activity ratings for “hobo” and “bum”; by high activity ratings for “youngster”; and by high evaluation of “grandparent” and low evaluation of “delinquent.”
STUDY 2: IDENTIFYING CORRELATES OF PATTERNS
In our second study, we administered a screening questionnaire, selected a few respondents who represented major patterns of semantic differential response, and interviewed those respondents in hopes of discovering why distinctive sentiment patterns exist.

431 Mining Error Variance and Hitting Pay-Dirt
Subject Screening and Selection
Using the component analyses in Study 1 to select concepts that maximally discriminate subsets of respondents, we developed a short questionnaire focusing on 13 identities and 7 emotions. Paper and pencil ratings of these stimuli on nine-point EPA scales were gathered from 55 students attending a midlevel social psychology course at an American university.
Using principal component analysis and the same analytic design as in Study 1, two components were extracted from respondents' EPA ratings. Loadings on the components essentially replicated the results in Study 1. However, because identities and emotions now were analyzed together, it became clear that one component is defined largely in terms of ratings of identities, while the other is composed mainly from ratings of emotions.
Figure 3 • Subjects' Positions on Component Dimensions
We computed component scores for respondents, and respondents at the extremes on either component were considered for interviews. Of the initial 55 subjects, 22 had an extreme position on one or the other component. Choosing the most extreme cases from each quadrant in a two-dimensional graph of the component scores, ten respondents were contacted for in-depth,

432 THE SOC1OLOG1CAL QUARTERLY Vol. 36/No. 2/1995
open-ended interviews. The nine subjects who consented to an interview are plotted in terms of their scores on component 1 (horizontal) and component 2 (vertical) in Figure 3. This graph shows that subjects are distributed continuously along one dimension of variation, whereas the second dimension mostly contrasts a subgroup of males with all other subjects.
T able 1 • Ratings of Subjects in Quadrants A, B, C, D
A B C D A B C D Bouncer Parent e 1 3 1 0 0 0 0 0 -4 e 3 4 3 4 3 0 0 3 3 p 4 3 2 3 0 1 2 4 3 p 3 4 3 3 -3 0 2 3 3 a 2 3 3 4 2 1 2 4 4 a 0 4 3 0 0 0 0 -1 0
Bully Principal e -4 -3 -3 3 -2 -1 -1 -4 -4 e 3 2 3 0 2 0 1 -3 0 p -4 3 2 3 -3 0 2 4 4 p 2 2 3 3 2 1 2 4 0 a 2 1 2 3 2 0 0 4 4 a 0 -1 -1 0 0 0 1 3 0
Bum Youngster e 1 -4 -1 -3 0 0 -1 0 -3 e 3 4 2 3 0 0 0 0 -1 p -4 -4 -1 -3 -2 -1 -1 -3 -4 p -3 -4 1 0 -1 -1 1 -4 -1 a -3 -4 -1 0 0 0 -1 -4 -4 a 3 4 1 3 1 1 1 4 3
Child Calm e 1 4 2 4 0 2 3 0 3 e 2 4 3 4 2 1 1 2 4 p -3 -4 -1 0 -2 -2 1 -4 0 p 1 2 3 4 3 0 1 0 -4 a 2 4 2 2 3 2 2 4 4 a -2 -1 1 -1 0 0 -1 -3 -4
Grandchild Grateful e 3 4 2 4 0 1 0 4 3 e 2 3 2 2 1 1 1 4 3 p -4 -4 1 0 -2 0 1 -4 -3 p 1 -1 -1 -3 -2 0 1 3 3 a 2 4 2 0 0 0 1 4 2 a -1 0 0 0 0 0 0 0 -2
Granny Happy e 3 4 3 4 3 0 0 4 -2 e 4 4 4 4 3 3 2 3 4 p -3 -4 -1 0 0 0 1 -4 -4 p 3 4 4 0 2 1 0 3 3 a -3 -4 -3 -2 -1 -1 -1 -4 -4 a 0 4 3 0 3 0 1 0 3
Gunman Humble e -2 -4 0 0 0 -3 -1 -4 -4 e 1 1 -1 0 -2 0 1 4 2 p -2 2 0 0 0 2 3 4 4 p -1 1 -1 0 2 -1 -1 -4 -3 a 1 0 0 0 0 0 1 4 4 a -1 1 -1 0 0 0 -1 -4 -2
Hero Lonely e 4 4 3 4 2 3 3 4 -3 e -4 -4 -4 -4 -3 -1 0 -4 -3 p 4 3 2 -2 3 0 3 4 2 p -4 -4 -3 -4 -3 -1 0 4 -3 a 0 1 1 0 3 0 2 4 -2 a -4 -4 -2 -3 -2 0 0 -4 -3
Judge Miserable e 3 4 2 0 0 0 1 -3 0 e -4 -4 -4 -4 -3 -3 0 -3 -4 p 4 4 2 3 2 1 2 3 4 p -3 -3 -3 -4 -3 -1 2 3 3 a -1 -2 2 0 0 0 0 -3 -4 a -2 3 -3 -4 -3 0 1 -3 -3
Old maid Unhappy e 3 3 0 0 0 0 0 -1 -3 e -4 -4 -3 -4 -2 -2 -1 -3 -4 p -4 -3 -2 0 0 0 0 -4 -3 p -4 -4 1 -4 -3 -2 2 3 4 a -3 -4 -2 -2 -1 -1 -1 -4 -4 a -4 0 -1 -4 -1 0 1 0 3
Note: Negative numbers correspond to bad (e), powerless (p), or quiet (a); positive numbers correspond to good (e), powerful (p), or lively (a). Values can be read as: +-4, infinitely; +-3, extremely; +-, quite; +- 1, slightly; 0, neutral.
Table 1 shows the EPA ratings of all 20 stimuli, by each interviewed subject, with subjectsclustered according to their quadrants in Figure 3. Ratings from a particular subject run downward inTable 1. Underlining [italic] highlights rows where all of the ratings from subjects in one

433 Mining Error Variance and Hitting Pay-Dirt
quadrant are at least as high (or at least as low) as the rating of any other subject. Studying Table 1 yields several observations.
The Quadrant A subjects rated order-maintaining authority figures (bouncer, hero, judge, parent, principal) as potent and good. They rated marginal participants in society (bum) as weak, but those of humble station who are tied into families (child, grandchild, granny, old maid, youngster) were seen as good as well as weak. Depressive emotions (lonely, miserable, unhappy) were rated as bad and weak.
Quadrant B subjects viewed legitimate administrators of force (bouncer, judge) as nonquiescent. These three subjects rated gunman as neutral on every affective dimension. The subjects also rated calmness as especially potent and humility as a bit bad and being miserable as especially weak and quiescent. They rated feeling grateful as impotent.
The ratings of Quadrant C subjects are distinctive for a variety of concepts and scales, but a single underlying pattern distinguishes all of the differences: these subjects neutralized affective meanings—their ratings were depolarized even when other subjects' ratings were far from zero. The Quadrant C subjects gave moderately intense ratings at most and only for a few of the concepts: child, gunman, hero, happy, and unhappy. Recognizing this pattern enlightens the peculiar patterns of component loadings mentioned at the end of our discussion of Study 1: the first component in the component analyses is defined mainly by contrasts between the neutral ratings of people in Quadrant C as opposed to the nonneutral ratings of other respondents, and the .items that best define the component are simply those where ratings of other respondents are most extreme.
Quadrant D subjects rated users of violence (bouncer, bully, gunman) as especially bad, potent, and active; they devalued legitimate maintainers of order (bouncer, judge, principal) relative to other subjects. These subjects exaggerated activation aspects of age: youths (child, grandchild, youngster) were rated very lively, whereas the elderly (granny, old maid; perhaps bum, judge, and parent also fit) were seen as quiescent. The subjects rated misery (miserable, unhappy) as potent. They rated calmness and humility as good but as unusually weak and quiet. They rated gratefulness as good and potent.
Interviews
The selected subjects were interviewed in one-hour sessions that were tape-recorded and later transcribed. Each subject was paid for participation. The interview schedule elicited information about subjects' parents, siblings, and friends, as well as personal information about the subjects themselves, their experiences, and their values.
Subjects were typical college students in appearance, and they all were performing successfully in a midlevel college psychology class. The interviews revealed that they shared a number of qualities—for example, almost everyone mentioned that they valued honesty in others and that they themselves were very honest. 1n the following paragraphs we summarize characteristics that subjects in a quadrant shared, usually to the exclusion of all other subjects interviewed.
Both subjects in the upper right of [Figure] 3, Quadrant A, were family-oriented and lived with or near grandparents while they were growing up. Both the male and the female reported participating in far more extracurricular activities than did other subjects (eight or more, as opposed to the usual three or four). These subjects were the only members of the Panhellenic system in the study; the woman had been the president of her sorority.

434 THE SOC1OLOG1CAL QUARTERLY Vol. 36/No. 2/1995
The Quadrant B subjects were all females who reported some kind of psychological distress related to their first intense love relationship. One had become anorexic after a love relationship broke up and later developed an ulcer. Another attempted suicide after her mother discovered her use of contraceptives and began to “treat her like a tramp.” She is still fighting chronic depression. Both of these subjects have received treatment in a therapeutic setting. The third subject had to immediately terminate all contact with her boyfriend, at her parents' insistence, when they became aware of a possible pregnancy. Her relationship with her parents suffered after this, and she has not dated since. She reported that her friends worry about her because she does not want to date.
The subjects in Quadrant C showed signs of distress (e.g., closely bitten nails). The female reported that she changed friends often, every few years. She said that security was very important to her and that she wanted to achieve it through independence, by being self-sup-porting. She wanted to have an established career so that, if she married, she could get a divorce if she needed to (her parents were practicing Catholics and not divorced). She said she had few close friends, and she participated in no extracurricular activities. 1n high school her only extracurricular activity was the German club. The male was the son of an engineer. His father's alcoholism led to his parents' divorce. Since he did not have a warm relationship with his family, he dreaded going home for the holidays. He said he was depressed since his girlfriend broke up with him after an abortion. He reported that he had no close friends; the friends he did have would tell him he was strange and did not think his jokes were funny; he did not understand what they meant. He was not involved in extracurricular activities, and participation in band was his only high school extracurricular activity.
The two Quadrant D subjects were both male, the sons of engineers. One of the subjects mentioned that he did not enjoy eating, could not eat for days before a test, and was primarily vegetarian. The other said he often does not feel like eating, and many days he does not eat more than a few bites. Both of these men, at various times in the interview, expressed confu-sion about what kinds of things the researcher wanted and hoped they were giving the right kind of answers. They both volunteered that their parents were authoritative and disciplina-rian, although they both reported that the discipline was not extreme or unwarranted. They both claimed they were shy and wished they were not.
Extracting Hypotheses
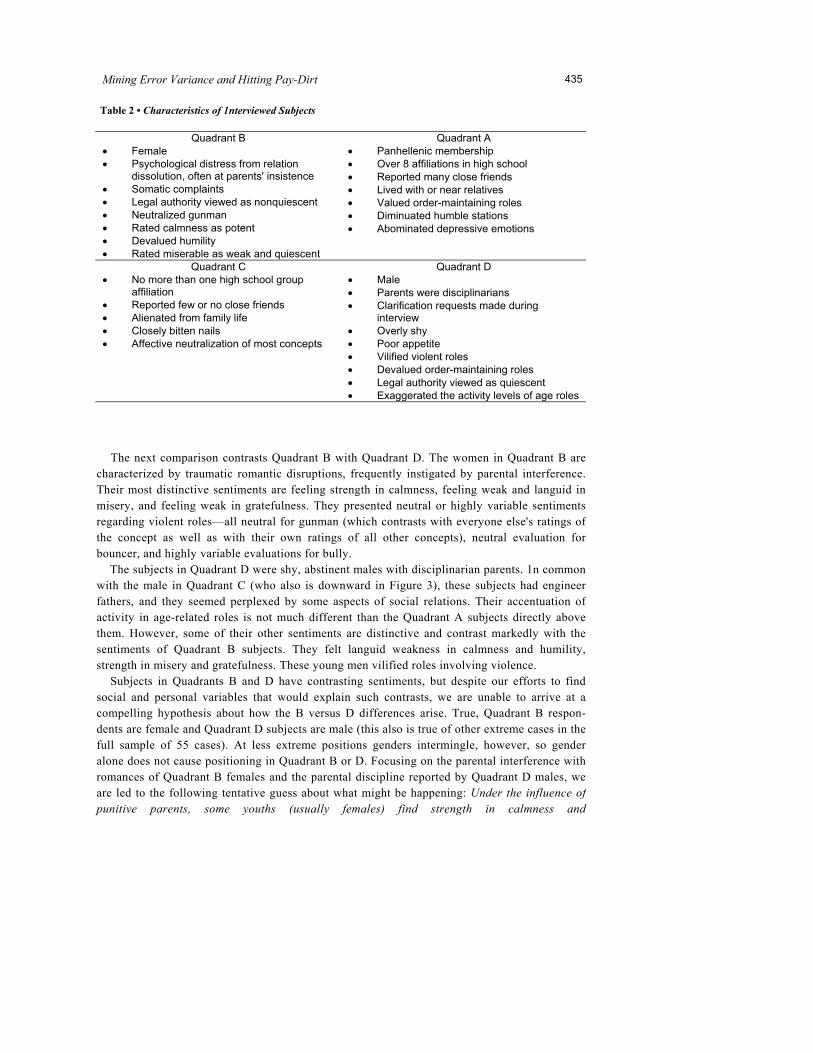
Table 2 summarizes information that differentiates subjects in each quadrant. We first discuss the table by contrasting Quadrant A versus Quadrant C, which provides a dimension of variation that seems suited to the substantive findings.
People in Quadrant A are socially connected in multiple ways: in organizations, with close friends, with family. They value order-maintaining roles, and they accentuate the impotency of the weak. Overall, their sentiments are conventional, and indeed their EPA ratings heavily define culturally based affective meanings because their ratings often are extreme relative to those of others'. People in Quadrant C are socially isolated: they are not members in organiza-tions, do not have close friends, and are not devoted to family life. Their EPA ratings are almost all close to zero—a striking pattern of attenuated sentiments regarding nearly every concept that was presented. These findings lead us to the following hypothesis: A person with few and unstable social ties has bland sentiments about many social entities. A person with extensive and non-redundant social networks has intense sentiments that support social order and social differentiation.
Mining Error Variance and Hitting Pay-Dirt 435
Table 2 • Characteristics of 1nterviewed Subjects
Quadrant B • Female • Psychological distress from relation
dissolution, often at parents' insistence • Somatic complaints • Legal authority viewed as nonquiescent • Neutralized gunman • Rated calmness as potent • Devalued humility • Rated miserable as weak and quiescent
Quadrant A • Panhellenic membership • Over 8 affiliations in high school • Reported many close friends • Lived with or near relatives • Valued order-maintaining roles • Diminuated humble stations • Abominated depressive emotions
Quadrant C • No more than one high school group
affiliation • Reported few or no close friends • Alienated from family life • Closely bitten nails • Affective neutralization of most concepts
Quadrant D • Male • Parents were disciplinarians • Clarification requests made during
interview • Overly shy • Poor appetite • Vilified violent roles • Devalued order-maintaining roles • Legal authority viewed as quiescent • Exaggerated the activity levels of age roles
The next comparison contrasts Quadrant B with Quadrant D. The women in Quadrant B are characterized by traumatic romantic disruptions, frequently instigated by parental interference. Their most distinctive sentiments are feeling strength in calmness, feeling weak and languid in misery, and feeling weak in gratefulness. They presented neutral or highly variable sentiments regarding violent roles—all neutral for gunman (which contrasts with everyone else's ratings of the concept as well as with their own ratings of all other concepts), neutral evaluation for bouncer, and highly variable evaluations for bully.
The subjects in Quadrant D were shy, abstinent males with disciplinarian parents. 1n common with the male in Quadrant C (who also is downward in Figure 3), these subjects had engineer fathers, and they seemed perplexed by some aspects of social relations. Their accentuation of activity in age-related roles is not much different than the Quadrant A subjects directly above them. However, some of their other sentiments are distinctive and contrast markedly with the sentiments of Quadrant B subjects. They felt languid weakness in calmness and humility, strength in misery and gratefulness. These young men vilified roles involving violence.
Subjects in Quadrants B and D have contrasting sentiments, but despite our efforts to find social and personal variables that would explain such contrasts, we are unable to arrive at a compelling hypothesis about how the B versus D differences arise. True, Quadrant B respon-dents are female and Quadrant D subjects are male (this also is true of other extreme cases in the full sample of 55 cases). At less extreme positions genders intermingle, however, so gender alone does not cause positioning in Quadrant B or D. Focusing on the parental interference with romances of Quadrant B females and the parental discipline reported by Quadrant D males, we are led to the following tentative guess about what might be happening: Under the influence of punitive parents, some youths (usually females) find strength in calmness and

436 THE SOC1OLOG1CAL QUARTERLY Vol. 36/No. 2/1995
humility, and they neutralize roles of violence; whereas others (usually males) find ascetic strength in misery and in being grateful, and they vilify roles of violence.
On the other hand, perhaps the contrasting sentiments are explained by reference to the disruption of intense romantic involvements among the Quadrant B subjects, in comparison to the Quadrant D subjects' absence of any intense romantic relationships (though they did report female friends and possible romantic partners). Focusing on this would lead to an alternative guess: People who are torn from romantic involvements (usually females) find strength in calmness and humility, and they neutralize roles of violence, whereas those who abstain from romantic involvements (usually males) find strength in misery and in being grateful, and they vilify roles of violence.
CONCLUS1ONS
Some of the variation that usually is treated as error variance in sentiment studies within homogeneous populations is not error at all; rather it is generated by subgroups of people who share divergent sentiments and other social characteristics.
Our first study found two major patterns of sentiment variation. Our second study sought reasons for why the patterns of sentiment variations occur. Having no initial clues about why such patterns should exist, we employed in-depth interviewing in Study 2 to scan for all kinds of possible factors. The subjects were selected rigorously, and we focused only on dramatic contrasts, so the reasons that we proposed do constitute reasonable hypotheses. On the other hand, the sample of interviewed subjects was small, so our conclusions are tentative. Future research will have to determine whether our findings can be replicated in a larger, more structured interview or questionnaire study.
Many of the variations that we found are less than the average differences in sentiments about different concepts. This accords with earlier studies (e.g., Gordon, Short, Cartwright, and Strodtbeck 1963; MacKinnon and Summers 1976) that found gradations of affect distin-guishing different categories of people who otherwise share an overall qualitative structure of feelings. (The dramatic contrasts, like those in Figure 1, may arise only when messages and experiences with regard to a cultural domain are highly segregated.) A recent study (Heise and Calhan forthcoming) indicates that this phenomenon applies to emotions as well as to sentiments: males and females do not differ in what emotions they expect of others, though they do differ somewhat in how intensely they expect others to feel about certain things. One implication is that we must refine our assessments of feelings in future research on the sociology of emotions (Thoits 1989 ; Kemper 1990; Smith-Lovin, 1994) in order to detect the kinds of differences that often differentiate people within a culture.
We found that the more socially isolated a person is, the less intense are the person’s sentiments about many issues. Assuming this is confirmed, there still are further questions. Do tattered social networks create affective neutrality, or do “washed out” sentiments cause a person to become socially isolated? Even more fundamental: Do social isolates really have attenuated sentiments, or have they simply learned to “play it safe” in disclosures and not reveal sentiments they truly hold? The socially disengaged subjects reported difficulties in symbolic interaction (e.g., making jokes that aren't funny), indicating that they do indeed have deviant sentiments about many things, but the nature of those sentiments needs investigation.
Granting that our results are sketchy, they still can be interpreted as showing a linkage between social structure, personality, and culture. We found that those with the broadest and deepest social ties express the strongest sentiments in surveys and display the most self-assur-

437 Mining Error Variance and Hitting Pay-Dirt
ance in interpersonal discourse; far from being compromised by their divergent multiple as-sociations, these people project intense, confident, convergent opinions, and thereby they contribute most to the public sense of culturally appropriate sentiments. People with extensive family and social relations are the most proficient promulgators of culture, so theirs are the views that culture defines as conventional. Those whose social connections are few and tattered are the ones who are more likely to bear nebulous opinions and to be irresolute in discourse. Their social disconnection correlates with an ethos that has little impact on the common culture. Thus, culture emerges from society's most integrated groups, not merely because of their effective communication networks but also because the people in those groups are forceful communicators. As a result of these processes, individuals with extensive social ties are triply blessed. They have multiple sources of social support, their socialization has given them strong characters that are comfortable with agency, and the culture formed by them approves of them. Conversely, those who are outside the integrated sectors of society are thrice impaired by reduced social support, weak egos, and cultural repudiation. Their levels of psychological distress reflect their predicament (Thoits 1986).
We also found that some patterned variations in sentiments about violence and in meanings of emotions relate to gender, though they cannot be identified simply as male and female patterns of response, since most males and females do not display the patterns. Even with our in-depth interviews, we were not able to get to the bottom of this phenomenon. Our best guess is that males and females respond differently to punitive parents, but an alternative idea is that males and females respond differently to romantic estrangement. While we are not sure why the contrasting sentiments occur, the pattern of contrasts itself is robust, arising in the large sample of Study 1 as well as in Study 2.
The finding that a subset of males and females have some contrasting sentiments about emotions encourages speculation about how the “lived experience” of emotion (Denzin 1984; 1990) contributes to the meaning of emotion. The relevant respondents of both sexes seem to have had more than usual unhappiness in their relations with intimates, yet the males rated “miserable” and “unhappy” as potent, whereas the females rated these emotions as impotent. The contrast seems accountable by remembering that, even when agonized by relations with intimates, the males were operating in a gender stratification system where they are relatively powerful; the females, though, had to operate in a system where they are relatively powerless. Evidently all subjects incorporated memories of their structural positions into their impressions of how the emotions feel. One result would be confusion when such people encounter their cross-sex counterparts in future relationships. A woman says to a man that she is miserable (calling for compassion), and he assumes she is claiming a threatening potency! A man says to a woman that he is miserable (intending it as a warning), and she thinks he is shrinking away! Such circumstances offer the potential for boundless escalations in gender conflict that might be resolvable only with counseling.

THE SOC1OLOG1CAL QUARTERLY Vol. 36/No. 2/1995 438
NOTES
1. Scaling studies show that the usual codings are reasonable approximations of the metric provided by the adverbs, though some studies (e.g., Heise 1978) have used a more refined metric based on the method of successive intervals.
2. A recent courtroom experience might cause temporary deviations in rating “judge” like those of the two respondents on the left of Figure 3.
REFERENCES Britt, L., and Heise, D. 1992. “1mpressions of Self-directed Action.” Social Psychology Quarterly, 55:335-350. Burke, P. J. 1977. “The Measurement of Role 1dentity.” Social Forces 55:881-897. ___ 1980. “The Self: Measurement Requirements from an 1nteractionist Perspective.” Social Psychology Quarterly 43:18-29. Denzin, N. K. 1984. On Understanding Emotion. San Francisco: Jossey-Bass. ____ 1990. “On Understanding Emotion: The 1nterpretive-Cultural Agenda.” pp. 85-116 in Research Agendas in the Sociology of Emotions, edited by T. D. Kemper. Albany: State University of New York Press. Gordon, R. A., J. F. Short, Jr., D. S. Cartwright, and F. L. Strodtbeck. 1963. “Values and Gang Delin-
quency: A Study of Street Corner Groups.” American Journal of Sociology 69:109-128. Gross, N., W. S. Mason, and A. W. McEachern. 1958. Explorations in Role Analysis. New York:
Wiley. Heise, D. R. 1966. “Social Status, Attitudes, and Word Connotations. Sociological 1nquiry 36:227-
239. ____ 1969. “Some Methodological 1ssues in Semantic Differential Research.” Psychological Bulletin 72:406-22. ____ 1978. Computer-Assisted Analysis of Social Action: Use of Program iNTERACT and SUR VEY: UNC75. Chapel Hill, NC: 1nstitute for Research in the Social Sciences. ____ 1979. Understanding Events. New York: Cambridge University Press.
Heise, D. R., and C. Calhan. Forthcoming. “Emotion Norms in 1nterpersonal Events. Social Psychology Quarterly.
Heise, D. R., and E. M. Lewis. 1988. 1ntroduction to 1NTERACT. Documentation for Programs 1NTERACT and ATT1TUDE. Raleigh, NC: National Collegiate Software Clearinghouse. Heise, D. R., and L. Thomas. 1989. “Predicting 1mpressions Created by Combinations of Emotion and Social 1dentity.” Social Psychology Quarterly 52:141-148. Kahneman, D. 1963. “The Semantic Differential and the Structure of 1nferences among Attributes.” American Journal of Psychology 76:554-567. Kemper, T. D., Ed. 1990. Research Agendas in the Sociology of Emotions. Albany: State University of New York Press. Marks, 1. M. 1965. Patterns of Meaning in Psychiatric Patients:Semantic Differential Responses in Obsessives and Psychopaths. London: Oxford University Press. ____ 1966. “Semantic Differential Uses in Psychiatric Patients. British Journal of Psychiatry 112:945-951. MacKinnon, N. J. and L. J. Keating. 1989. “The Structure of Emotions: Canada-United States Comparisons.” Social Psychology Quarterly 52:70-83. MacKinnon, N. J. and G. F. Summers. 1976. “Homogenity and Role Consensus: A Multivariate Exploration in Role Analysis.” Canadian Journal ofSociology 1 :439-462. Osgood, C. E. 1962. “Studies on the Generality of Affective Meaning Systems.” American Psychologist 17:10-28. Osgood, C. E., W. H. May, and M. S. Miron. 1975. Cross-Cultural Universals of Affective Meaning. Urbana: University of 1llinois Press.

439 Mining Error Variance and Hitting Pay-Dirt
Osgood, C. E., G. J. Suci, and P. H. Tannenbaum, 1957. The Measurementof Meaning. Urbana: University of 1llinois Press. Romney, A. K., S. C. Weller, and W. H. Batchelder. 1986. “Culture as Consensus: A Theory of Culture and 1nformant Accuracy.” American Anthropologisl 88:313-338. Smith-Lovin, L. 1994. “The Sociology of Affect and Emotion.” 1n Sociological Perspectives on Social Psychology edited by K. Cook, G. Fine, and J. House. New York: Allyn and Bacon. Smith-Lovin, L., and W. Douglas. 1992. “An Affect Control Analysis of Two Religious Subcultures.”Pp. 217-248 in Social Perspective in Emotions, Vol. 1, ed. V. Gecas and D. Franks. Greenwich, CT: JA1 Press,. Snider, J. G., and C. E. Osgood, eds, 1969. Semantic Differential Technique: A Sourcebook. Chicago: Aldine. Thoits, P. A. 1986. “Multiple 1dentities: Examining Gender and Marital Status Differences in Distress.” American Sociological Review 51 :259-72. ______1989. “The Sociology ofEmotions.” Annual Review of Sociology 15:317-342.