minilit - education.nsw.gov.au
TRANSCRIPT

Independent Evaluators
Jon Quach, Sharon Goldfeld, Janet Clinton, Tanya Serry, Libby Smith, Anneke Grobler
MiniLit
Learning Impact Fund
Evaluation Report
An early literacy intervention delivered to improve student reading outcomes
Evaluation Report and Executive Summary
August 2019

Evaluation Report | MiniLit 2
About the evaluators
This report of the evaluation of the randomised controlled trial (RCT) of MiniLit is a joint collaboration
between the Centre for Program Evaluation at the Melbourne Graduate School of Education and the
Centre for Community Child Health and the Policy, Equity and Translation group at the Murdoch
Children’s Research Institute, both in Melbourne, Australia. The conduct of the evaluation was jointly
shared between the two centres.
Centre for Community Child Health (CCCH)
CCCH is a department of The Royal Children’s Hospital Melbourne, a research group of the Murdoch
Children’s Research Institute (MCRI), and an academic centre of the University of Melbourne. This
relationship allows CCCH to work closely with leaders in child development, health research and
practice. This enriches the Centre’s own expertise in clinical practice, research, evaluation, training
and knowledge translation, enabling a focus on the application of knowledge to improve the health,
development and wellbeing of children.
CCCH provides internationally recognised leadership in early childhood health and development and
offers over 20 years’ experience working with Australian families, service providers, philanthropy and
governments to enhance outcomes for children and families. The multidisciplinary team has a
comprehensive knowledge of social policy and service systems and is connected with stakeholders
and peers nationally and internationally via extensive research, policy and practice networks. The
Centre sits within the Population Health theme of MCRI and has a strong interest in considering how
best to deliver services in partnership with parents, families, schools and communities. Staff have
extensive experience in supporting a diverse range of stakeholders – government, early learning,
schools, family and health services, and funders – to deliver high quality projects on time and
within budgets.
Centre for Program Evaluation (CPE), Melbourne Graduate School of Education, The
University of Melbourne
CPE has a high national and international profile for excellence in program evaluation. CPE is situated
within the Melbourne Graduate School of Education (MGSE) based at the University of Melbourne,
which is ranked number five in the world in the discipline of education (QS World University Rankings
by Subject, 2017).
CPE is committed to community-based evaluation and research. CPE believes that all evaluation
should not only reflect current best practice in the field of evaluation, but also aim to add value to the
initiative or program evaluated. Projects range from a small project to assist a local neighbourhood
house, to larger educational programs for government. In all projects, CPE places an emphasis on
capacity building in the sponsoring organisation, so that a process of mutual learning and
understanding is embedded within the program design. Core academic and research staff at CPE
make major written contributions to journals and present regularly at national and international
conferences and seminars. CPE has strong capability and considerable relevant expertise to apply to
the work detailed in this proposal, including RCT experience in health and educational research.

Evaluation Report | MiniLit 3
This evaluation was commissioned and funded by Evidence for Learning. The report should be
referenced as:
Quach, J, Goldfeld, S, Clinton, J, Serry, T, Smith, L, & Grobler, A 2019, MiniLit: Learning Impact Fund
Evaluation Report. Independent report prepared by the Murdoch Children’s Research Institute and the
University of Melbourne for Evidence for Learning. Available from:
<https://evidenceforlearning.org.au/lif/our-projects/minilit>.
This evaluation report is licensed under a Creative Commons licence as outlined below. Permission
may be granted for derivatives, please contact Evidence for Learning for more information.
This work is licensed under a Creative Commons Attribution-NonCommercial-NoDerivatives 4.0
International License.
Evaluation Report | MiniLit 4
Executive Summary
The project
This evaluation examined the efficacy of the MiniLit intervention (Chapters 2 and 3), the costs of
delivering the program (Chapter 4) and the implementation factors which influenced outcomes
(Chapters 5 and 6). In Chapter 7, conclusions are drawn together by discussing how this trial
contributes to the current evidence base on how to support Year 1 students with reading difficulties.
The trial began in January 2017 with recruitment of schools and concluded in July 2018 with
completion of 12-month post-randomisation follow-up assessments.
The MiniLit intervention
MiniLit was developed by the MultiLit team, a research initiative of Macquarie University, to support
Year 1 students struggling to learn to read. Specifically, MiniLit targets students whose word reading
ability is in the bottom 25th percentile of readers. These students are typically identified using the
Wheldall Assessment of Reading Lists (WARL), which was also developed by the MultiLit team and
has validated cut points. The MiniLit intervention is delivered in small groups, typically in an intensive
format (i.e. daily on school days). Therefore, it is considered a Tier 2 intervention, based on the
Response To Intervention Framework. Within developer-led research studies, MiniLit has shown
promising findings.
Before implementing MiniLit, potential MiniLit tutors attend a two-day professional development course
to learn about the program's theoretical foundations as well as how to deliver it.
MiniLit is a prescriptive systematic synthetic phonics intervention program that consists of 80 unique
lessons that focus on improving children’s word reading. The program is positioned within the “big five”
elements known to be required for comprehensive reading instruction: phonemic awareness, phonics,
fluency, comprehension and vocabulary, but focuses most specifically on the first two elements.(1)
Students are withdrawn from class each school day during school hours and receive the lessons in
groups of up to four students of similar reading ability. Within the program, there are fortnightly student
progress assessments, providing MiniLit tutors with guidance as to whether students need to repeat
lessons to achieve mastery before proceeding to the next lesson block. Students are typically deemed
to have completed the program once they have completed the 80 unique lessons, which previous
research suggests can take up to three school terms, depending on how many lessons students need
to revise.
Within this study, the following implementation criteria were used:
• MiniLit tutors were nominated teachers or paraprofessionals employed by each school. All tutors
had not previously been trained in delivering MiniLit.
• Each MiniLit tutor had up to three coaching observation sessions with feedback reports from the
developer throughout the trial.
• Schools had 20 weeks to deliver the program (i.e. over two school terms).
• Schools were advised to deliver MiniLit five days per week.

Evaluation Report | MiniLit 5
Due to funding constraints of this evaluation, the 20-week criterion for the intervention was decided at
the initial stakeholder meeting. This meant that schools had a possible 100 days (i.e. 20 weeks) to
deliver the MiniLit program. However, it was also proposed that limiting the intervention to the 20-week
period would enable schools to run the intervention twice per year, which would reduce the program
costs per student by enabling MiniLit tutors to support more groups of children to complete
the intervention.
The overall design
The overarching aim of this trial was to determine whether the MiniLit intervention, offered to Year 1
students identified as being in the bottom 25 per cent of readers, improved their reading more than
Usual Learning Support [or the control group],12 months after randomisation.
The trial evaluated students’ reading using three primary outcomes of accuracy, rate and
comprehension as measured by the York Assessment for Reading Comprehension – Passage
Reading (YARC – PR) at 12 months after randomisation. In addition, the trial also included secondary
outcomes of early reading abilities as measured by the York Assessment for Reading Comprehension
– Early Reading (YARC – ER) and Castles and Coltheart-2 Test of Word Reading Ability (CC-2), both
at six and 12 months post-randomisation. This trial also sought to evaluate process indicators such as
lesson frequency and intervention fidelity that could predict the outcomes of the intervention.
Additionally, a cost-benefit analysis of the intervention was conducted.
Schools located in the greater Sydney/Newcastle area with socio-economic status in the top two
quartiles1 (i.e. most disadvantaged) were invited to participate. All Year 1 students at the participating
schools undertook a screening test; those who were in the bottom quartile of the screening test, based
on standardised cut points, were eligible for inclusion in the randomised controlled trial (RCT). A total
of 237 students from nine schools participated of which, 119 students were allocated to the MiniLit
group and 118 students to the control group.
Students in the control group (henceforth ‘Usual Learning Support’) were allowed to be provided with
any learning support that the school was already implementing. This could include whole-class
approaches and/or support programs (e,g. Reading Recovery). In addition, schools were also asked to
use their usual processes in identifying which students outside the intervention group needed support,
such as teacher observations, parent concerns, or formal assessments.
1 Based on NSW Family Occupation and Education Index (FOEI) scores, schools with high FOEI scores in Quarters 1 and 2 are identified relatively disadvantaged (around 91 per cent of students on average for schools with FOEI scores close to 200). https://www.cese.nsw.gov.au//images/stories/PDF/FOEI_Technical_Paper_final_v2.pdf

Evaluation Report | MiniLit 6
Key Conclusions
1. For the intention to treat analysis (which includes all students enrolled in the study irrespective
by their assigned groups), there was no strong statistical evidence that MiniLit led to better
student reading at 12 months compared to students receiving Usual Learning Support, as
measured by YARC – PR Reading Accuracy (effect size = 0.13, [-0.08 to 0.33, p=0.23]),
Reading Rate (effect size = 0.06, [-0.19 to 0.32, p=0.62]) and YARC – PR Reading
Comprehension (effect size -0.04, 0.28 to 0.21, p=0.76]). These were measured using the York
Assessment of Reading Comprehension – Passage Reading. However, a large number of
intervention and control students performed at the floor for the measure at the outcome time
point, with nearly all not being able to complete the measure at baseline. Therefore, the findings
should be considered with caution
2. On the secondary outcomes which measured early reading skills, there was statistical evidence
that, compared to the Usual Learning Support group, students in the MiniLit group made
positive gains in Letter Sound Knowledge, which is a foundational reading skill for reading. At
six months, there was strong statistical evidence that the MiniLit group scored higher on tests of
Letter Sound Knowledge, Phoneme Awareness, Regular Word Reading, Nonword Reading and
Accuracy as measured by the YARC - Early Reading and the Castles & Coltheart-2
assessments. At 12 months, the differences between groups were smaller, with only Letter
Sound Knowledge having strong statistical evidence of being higher in the MiniLit group.
3. Compliance was defined as students receiving the intervention for at least four days per week
over the 20-week intervention period, as defined by the program developers. When considering
the students who did meet the recommended number of lessons (i.e. 80 lessons out of a
possible 100 school days, 4 days per week) there was strong statistical evidence that MiniLit
students scored higher on tests of Letter Sound Knowledge, Phoneme Awareness, Regular
Word Reading and Nonword Reading at both six and 12 months, as well as Accuracy at
six months.
However, it is important to note that nearly half of the students did not receive the intervention
for at least 4 days per week. Of the 119 students involved, 65 (54.6%) had minimum 80 per
cent or more (4 or more days per week), 38 (31.9%) between 60 – 80 per cent (e.g. 3 days per
week), and 16 (12.6%) had 40 per cent or less (e.g less than 2 days) during the 20-week
period. It is unknown whether this was due to available resources (i.e. staff not working full-
time) or if schools perceived the intervention cannot be delivered for at least 4 days per week.
4. Implementation fidelity is critical to the effectiveness of a program. Strong statistical evidence
showed that when there was high implementation fidelity, student outcomes were better in
Letter Sound Knowledge, Phoneme Awareness and Nonword Reading. In particular, there was
strong statistical evidence that higher fidelity was associated with higher secondary outcomes
at six months and with higher Reading Accuracy at 12 months.

Evaluation Report | MiniLit 7
Key Conclusions
5. MiniLit teachers valued the initial coaching provided by MultiLit in providing feedback to improve
specific activity. However, they reported difficulties completing the three MiniLit activities
(Sounds and Words, Text Reading, Storybook Reading), within the recommended one-hour
MiniLit lesson. More access to the Text Reading and Storybook Reading activities may
contribute to better student results on the primary outcomes.
6. The process evaluation highlighted some key considerations. Schools should allow enough
time for students (i.e. three school terms) to complete all MiniLit lessons, especially given that
some schools may find it difficult to implement MiniLit for four or five days a week due to school
resource constraints and student absences. Schools should also allow for adequate time each
day for students to complete all three of MiniLit activities, which may require more than the
recommended hour.
7. Future research could examine whether a longer intervention time that enables students to
complete the whole MiniLit intervention will lead to more positive student outcomes. In addition,
it should aim to follow children for a longer period of time, enabling an understanding as to
whether benefits in the early reading skills can be consolidated as students become more
skilled readers.

Evaluation Report | MiniLit 8
Primary outcome measure findings
Summary of impact on primary outcome, measured at 12 months post-randomisation
Outcome Effect size [95% CI]
Estimated months
progress*
E4L security rating**
Number of students
(Intervention, control)
P value+ E4L cost rating^
Accuracy 0.13
[-0.08, 0.33] 217
(108, 109) 0.23
Rate 0.06
[-0.19, 0.32] 217
(108, 109) 0.62
Comprehension -0.04
[-0.28,0.21] 217
(108, 109) 0.76
* Refer to Appendix A of Report used to translate effect size into estimated months progress. ** Refer to Appendix B of Report for E4L independent assessment of the security rating. + E4L has developed a plain English commentary on statistical significance to support readers in interpreting statistical results in our reports. ^ The E4L cost rating is an average of the cumulative cost of implementing the program over three years. The significant cost is incurred in the first year and once established, the recurrent cost of MiniLit in terms of consumables per student is $72 for student books and testing and record books.
Overall, there was no evidence of a difference between the MiniLit and Using Learning Support group
at 12 months post-randomisation, as measured by YARC – PR Reading Accuracy, Reading Rate and
Reading Comprehension. However, it is important to note that the majority of children were not able to
complete the primary outcome measure at baseline and at the follow-up time points, despite the
measure being validated for this age group. Therefore, it may not be sensitive enough to detect
differences among children with very low reading skills, which is the target population for
the intervention.
MiniLit intervention had a strong positive effect on the primary outcome of Reading Accuracy at 6
months, and on secondary outcomes of Letter Sound Knowledge, Phoneme Awareness, Regular
Word Reading and Nonword Reading. The early gains observed are promising of students’
improvements in some skills that are typically seen as foundational to improved reading. These
differences however were not sustained by 12 months post-randomisation, with the exception of a
strong statistical difference in the Letter Sound Knowledge of students who received MiniLit.
In this trial, schools had a possible 100 days (i.e. 20 weeks) to deliver the MiniLit program between the
intervention period of May to November 2018. The program developers recommend students receive
the program at least 4 days per week, otherwise defined as 80 lessons during the 20-week
intervention period. Of the 119 students involved, 65 (54.6%) had minimum 80 per cent or more (i.e. at
least 4 days per week), 38 (31.9%) at least 60 per cent (i.e 3 days per week), and 16 (12.6%) had 40
per cent or less (less than 2 days per week) of MiniLit lessons. The number of expected days
excluded student free days, holidays and scheduled student events (i.e. school sports days, class
excursions) which prevented the intervention from being delivered. Hence, all the outcomes above
need to take in to account that 54 per cent of students received the intervention at least 4 days per
week over the 20-week intervention period.
Process evaluation provides some possible explanations for why early gains did not lead to
improvements in reading at 12 months post-randomisation. MiniLit tutors generally valued the program
and its three activities in supporting students with reading difficulties in this study. Schools however
reported difficulties delivering a small-group reading intervention for at least four days a week over 20

Evaluation Report | MiniLit 9
weeks, reporting that a longer duration of time may be required to enable all students to reach the end
of the intervention (i.e. the 80 unique lessons). MiniLit tutors valued the Sounds and Words activity
and acknowledged that it is as an important component in supporting students in this study with
reading difficulties. This activity is likely have contributed to the positive outcomes as measured by the
YARC – ER Letter Sound Knowledge. Tutors however reported timing issues in delivering the other
two components of Text Reading and Storybook Reading within the one-hour lesson. However, MiniLit
tutors were all observed to be able to deliver all three components during each lesson. Tutors were
positive about MiniLit’s coaching support and specific feedback to each of the three MiniLit activities.
More time to complete each lesson, particularly Text Reading and Storybook Reading (following
MiniLit’s scripts in reading and eliciting comprehension questions) may help achieve better and/or
sustain student outcomes. Importantly, a longer intervention period than two school terms (i.e. 20
weeks) is required for schools to be able to complete the MiniLit program with students. However, this
will require further evaluation to determine whether this will lead to more positive student outcomes.
Evidence for Learning’s security rating – How secure is this finding?
This was an efficacy trial, designed to test whether MiniLit works under developer-led conditions in
nine schools. It was a well-designed randomised controlled trial. Attrition in the primary outcome was
low at 8.4%. The Minimum Detectible Effect Size (MDES) at randomisation was 0.37 which set a limit
on the initial padlock scores.
Findings for the primary outcomes were individually rated. The YARC-Passage Reading’s (YARC-PR)
Accuracy and Rate have a low security rating of 2 padlocks, and the findings for Comprehension have
a very low security rating of 1 padlock (see Appendix B).
The main reason for the low security ratings is a level of uncertainty with the YARC-PR measure. A
majority of children in this study were not able to complete the primary outcome measure at baseline
and at the follow-up time points, despite the measure being validated for this age group. At baseline
over 97 per cent of students performed at the floor level which resulted in considerable imbalance at
baseline for the YARC-PR measure. The floor effects found in the baseline measure reduced the
security of the findings of each of the primary outcome from its initial score by one padlock. We cannot
therefore confidently conclude that the observed effect is real, and these findings need to be treated
with caution.
Floor effects were not evident in the YARC-PR Accuracy post-tests. However, floor effects were
observed for the YARC PR Rate post-test with over 30% of the students scoring at floor. Floor effects
were also observed for the YARC-PR Comprehension post-test with over 12% of the students scoring
at floor, which combined with other threats and the large imbalance observed (0.2) reduced the
findings of the primary outcome of the YARC-PR Comprehension by an additional padlock.
Although a number of analyses were presented in this study, additional analysis was not conducted for
multiple testing. However, this was not deemed to be a severe threat to the validity of the results.

Evaluation Report | MiniLit 10
How much does it cost?
The MiniLit intervention initial costs are $11,210.20, which includes training, materials and staff time to
deliver the intervention for up to four children.
Without staff time included, the 2-day training costs $1055 per teacher and the materials to deliver the
intervention costs $8234. Once established, the recurrent cost of MiniLit in terms of consumables per
student is $72 per student.
Once established, the recurrent cost of MiniLit in terms of consumables per student is $72 for
the student books and testing and record books (available in sets of five for Level 1 and 2 at $158 per
set for each level) and testing and record books (for the teacher – one required per group at Level 1
and 2 at $28 each) if these are purchased by the school. These costs relates to the student, so the
annual recurrent cost is dependent on how many students are provided with MiniLit by the school
each year. For additional groups of four students with the same teacher, the additional costs would be
$288 per group or $72 per student.
Therefore, for a single group of four students at a school, the initial costs are $3262.20 + $5360 +
$2588 = $11,210.20. This includes all staff time for training and delivery, and all required resources.
Examining the cost per student, this equates to $2,802.55 per student. In this study, the number of
intervention students at each school ranged from four to 24.

Evaluation Report | MiniLit 11
Table of Contents
Executive Summary 4
Table of Contents 11
List of Tables 12
List of Figures 14
1 Introduction 16
2 Impact evaluation methods 22
3 Impact evaluation findings 32
4 Costs associated with MiniLit delivery 54
5 Process evaluation methods 57
6 Process evaluation findings 62
7 Overall summary 74
References 77
Appendix A: Evidence for Learning cost rating 79
Appendix B: Security padlock rating of trial findings 80
Appendix C: Additional figures and tables 86

Evaluation Report | MiniLit 12
List of Tables
Summary of impact on primary outcome, measured at 12 months post-randomisation ......................... 8
Table 1-1: Overview of MiniLit Intervention ........................................................................................... 20
Table 1-2: Overall study timeline and responsibilities ........................................................................... 21
Table 2-1: Project Measures ................................................................................................................. 26
Table 2-2: Minimum detectable effect size at different stages .............................................................. 27
Table 3-1: Baseline Comparison of recruited sample ........................................................................... 35
Table 3-2: Number of students who performed at floor at baseline and their raw scores .................... 37
Table 3-3: Primary outcome analysis at 12 months adjusted for baseline score, account for school cluster. .................................................................................................................................. 41
Table 3-4: Secondary outcome analysis at six months, adjusted for baseline score, taking cluster (school) into account. ................................................................................................................. 43
Table 3-5: Secondary outcome analysis at 12 months, adjusted for baseline score, accounting for cluster (school). ............................................................................................................. 45
Table 3-6: Compliance .......................................................................................................................... 47
Table 3-7: CACE analysis of primary outcomes at 12 months, adjusted for baseline score, taking cluster (school) into account. ...................................................................................................... 48
Table 3-8: CACE analysis of secondary outcomes at six months, adjusted for baseline score, taking cluster (school) into account ............................................................................................ 49
Table 3-9: Sensitivity analysis (CACE analysis) of secondary outcomes at 12 months, adjusted for baseline score, taking cluster (school) into account .......................................................... 51
Table 4-1: Cost breakdown of MiniLit program ..................................................................................... 55
Table 4-2: Cumulative costs over first three years ................................................................................ 56
Table 4-3: Start-up and running costs per student ................................................................................ 56
Table 5-1: Process evaluation domains ................................................................................................ 59
Table 6-1: Quotes from the MiniLit teachers ......................................................................................... 70
Table C1. Baseline comparison of intervention group with and without data at 12 months follow-up ................................................................................................................................................ 87
Table C2: Baseline comparison of control group with and without data at 12 months follow-up ................................................................................................................................................ 88
Table C3: Primary and secondary outcomes at 12 month follow-up and 6 month follow-up adjusted for baseline score, taking cluster (school) into account .......................................................... 89

Evaluation Report | MiniLit 13
Table C4. Primary and Secondary outcomes at 12 months follow-up and six months follow-up adjusting for a priori baseline confounders and taking cluster (school) into account .................................................................................................................................................. 90
Table C5. Complier Average Causal Effect (CACE) analysis of Primary and Secondary outcomes, adjusting for baseline score, taking cluster (school) into account ....................................... 91
Table C6. Complier Average Causal Effect (CACE) analysis of Primary and Secondary outcomes, adjusting for a priori baseline confounders, taking cluster (school) into account ................ 92

Evaluation Report | MiniLit 14
List of Figures
Figure 1-1: MiniLit's activities and alignment with key elements of reading .......................................... 18
Figure 3-1: Participant Flow Chart ......................................................................................................... 33
Figure 3-2: Percentage at each school identified in the bottom 25th percentile ................................... 34
Figure 3-3: YARC-PR Accuracy Raw scores (left) and YARC-PR Comprehension Raw scores (right). ......................................................................................................................................... 38
Figure 3-4: YARC-ER Letter Sound Knowledge (n=237) (left) and Raw scores of those with standard scores of 70 (n=22) (right). ............................................................................................. 38
Figure 3-5: YARC-ER Early Word Recognition Standard scores n=237 (left) and Raw scores of those with standard scores of 70 (n=58) (right). .................................................................... 38
Figure 3-6: Phoneme Awareness Composite scores n=237 (left) and Raw scores of those with standard scores of 70 (n = 22) (right). ........................................................................................... 39
Figure 3-7: Distribution of standard scores for YARC - PR Reading Accuracy at 12 months ................................................................................................................................................... 40
Figure 3-8: Distribution of standard scores for YARC - PR Reading Rate at 12 months ...................... 40
Figure 3-9: Distribution of standard scores for YARC - PR Reading Comprehension at 12 months .............................................................................................................................................. 40
Figure 3-10: Forest plot of primary outcome, YARC-PR effect size, at 12 months............................... 42
Figure 3-11: Sensitivity analysis - Forest plot of primary outcome, YARC-PR effect size, at 12 months. ......................................................................................................................................... 42
Figure 3-12: Forest plot of outcomes at six months .............................................................................. 44
Figure 3-13: Sensitivity analysis: Forest plot of outcomes at six months .............................................. 44
Figure 3-14: Forest plot of secondary outcomes at 12 months ............................................................. 46
Figure 3-15: Sensitivity analysis - Forest plot of secondary outcomes at 12 months. .......................... 46
Figure 3-16: Forest plot of CACE analysis of Primary outcome............................................................ 48
Figure 3-17: Sensitivity analysis - Forest plot of CACE analysis of Primary outcome using the adjusted model ................................................................................................................................ 48
Figure 3-18: Forest plot of CACE Analysis of Secondary outcomes at six months .............................. 50
Figure 3 19: Sensitivity analysis - Forest plot of CACE Analysis of Secondary outcomes at six months using the adjusted model ................................................................................................ 50
Figure 3-20: Forest plot of CACE Analysis of Secondary outcomes at 12 months............................... 52
Figure 3-21: Sensitivity analysis - Forest plot of CACE Analysis of Secondary outcomes at 12 months using the adjusted model ................................................................................................. 52
Evaluation Report | MiniLit 15
Figure 6-1: Direct pathway relationship between implementation fidelity and 12Mth primary outcomes .................................................................................................................................. 62
Figure 6-2: Pathway relationships between implementation fidelity and six-month and 12-month outcomes .................................................................................................................................... 63
Figure 6-3: Classroom teacher literacy practice: Literacy Strategy....................................................... 67
Figure 6-4: Classroom teacher literacy practice: Teacher Behaviour ................................................... 68
Figure 6-5: Classroom teacher literacy practice: Student Activities ...................................................... 68
Figure C1. The correlation matrix for all variables used in the analyses .............................................. 86
Evaluation Report | MiniLit 16
1 Introduction
1.1 Background
It is well established that the first three years of school are a critical period for later academic success
(2). Literacy is fundamental for educational achievement, and, in the longer term, contributes
substantially to a range of essential life skills. Literacy difficulties, which typically arise for students
during the early years of school, are associated with academic failure and school disengagement (3),
elevated risk of facing emotional problems, including anxiety and depression, and problems with peer
relationships (4), such as teasing and bullying (5). Demonstrating the national benefit of improving
reading scores, reports have found that increasing the national reading scores by one per cent in high
income countries is expected to lead to an increase in labour productivity and GDP per capita by two
per cent (6). Therefore, addressing students’ literacy difficulties during the early years of school is
essential in reducing the risk of students progressing onto negative academic, psychosocial,
vocational and economic trajectories.
Learning to read is fundamental to becoming literate. Unlike acquiring spoken language, written
language (literacy) is a biologically secondary skill that must be formally taught to students (7, 8).
Formal reading instruction typically commences when students first start primary school. Reading is a
complex process that involves being able to phonologically decode words as well as extract meaning
from the text (9-11). Decoding is the process of converting written symbols (graphemes or letters) into
their spoken form (phonemes or sounds) and then blending the phonemes together to read a word.
This is the starting point for students to gain competency in all literacy-related tasks such as reading
and understanding text, spelling, and extended writing (12). Not surprisingly, students who struggle
with learning to decode inevitably have difficulty being able to read fluently and automatically. This in
turn negatively impacts their ability to read for meaning (11). It is well established that problems
learning to decode, and the subsequent reading comprehension and related literacy deficits, do not
resolve without assistance and will persist into adulthood (10). One intervention that has early
promising findings in addressing literacy deficits during the early years of primary school is the MiniLit
program. This program fits within the Tier 2 segment of the Response to Intervention (RTI) framework
for providing support for students with additional learning needs (13). Broadly, the RTI framework
consists of general classroom instruction for all students (Tier 1); specialised, out-of-classroom, small
group interventions for students with additional learning needs (Tier 2); and one-to-one specialised
interventions for students who require the greatest support (Tier 3).

Evaluation Report | MiniLit 17
1.2 Background evidence for MiniLit
Based on the RTI framework, MiniLit targets the bottom 25 per cent of readers in Year 1 through 80
intensive and targeted one-hour lessons that are delivered on an intensive basis (i.e. multiple times a
week). The intervention focuses on improving students’ literacy by targeting five key areas; (1)
phonemic awareness; (2) phonics; (3) fluency; (4) vocabulary; and (5) comprehension. Lessons are
typically delivered over 20 weeks to groups of four students who come out of their regular classes for
the lesson. The lessons are delivered by either trained teachers or trained paraprofessionals under
teacher supervision. At present, MiniLit is currently delivered in 277 NSW public primary schools.
MiniLit is a Tier 2 literacy intervention developed by MultiLit, a leading provider of literacy instruction
provider in Australasia. MultiLit began as a research initiative of Macquarie University, and offers
several programs grounded in scientific evidence-based best practice which is continually informed by
an ongoing program of research. The research team is led by Emeritus Professor Kevin Wheldall, AM.
This project received in-kind support from MultiLit and the NSW Department of Education.
Although previous studies investigating MiniLit have shown promising benefits in terms of effect
sizes on children’s reading (d = 1.1 to 1.8), results are derived from differences between pre- and
post-training scores. In addition, there have been limited studies that compare students who
complete MiniLit to those who receive Usual Learning Support classroom teaching or alternative
RTI Tier 2 interventions.
Despite substantial Australian and international research demonstrating the importance of synthetic
phonics for effectively and efficiently teaching students to read, there remains limited research
examining whether directly targeting synthetic phonics can improve the literacy outcomes of Australian
students. Previous systematic reviews of readings interventions which include phonics training (14,
15) have noted the limited number of RCT or quasi-experimental studies in young school-aged
children, which is further compounded by limitations in the quality of studies and uncertainty about the
quality of implementation.
Therefore, we aimed to evaluate these findings in a large-scale efficacy RCT to determine the impact
of the program on student outcomes. In addition, this project sought to evaluate process indicators,
such as exposure and fidelity, that could predict the outcomes of the intervention, as well as the
implementation cost-benefit.

Evaluation Report | MiniLit 18
1.3 MiniLit intervention
The overarching aim of this project was to determine whether the MiniLit intervention, offered to Year
1 students identified as being in the bottom 25 per cent of readers, improved student reading 12
months after randomisation. For this study, the intervention was delivered over 20 weeks as
determined by MultiLit and Evidence for Learning for pragmatic reasons.
1.3.1 MiniLit’s theory of change
The theory of change is based on the well-established Simple View of Reading (8, 16), which identifies
that for students to become competent readers, they need to learn skills required to understand what a
word is, what it means, and then apply this understanding through reading text. The figure below
highlights how the MiniLit areas of instruction align with the key elements of reading.
Figure 1-1: MiniLit's activities and alignment with key elements of reading
It is important to highlight that the intervention primarily focused on improving student phonics and
phonemic awareness as the mechanism to improve student reading competency (i.e. reading speed,
accuracy and comprehension).
1.3.2 MiniLit training and delivery
There are 80 unique lessons which are delivered in one-hour lessons in small groups (up to four
students). The program developers recommend that the intervention is delivered at least four times
per week. The intervention content focuses on improving students’ literacy by targeting the five
key areas known to be fundamental for a comprehensive reading instruction or intervention
program (8-12): (1) Phoneme awareness; (2) phonics; (3) fluency; (4) vocabulary; and
(5) language comprehension.
MiniLit is divided into two levels of forty unique lessons (80 in total) each that students complete
according to a placement test included in the program. The levels are:
• Level 1: Teaching the basics of letter/sound knowledge and decoding skills for
Consonant-Vowel-Consonant (CVC) words.
• Level 2: Extending word attack knowledge by teaching commonly used digraphs and
longer words.

Evaluation Report | MiniLit 19
As each small group of students progress through the intervention, they must demonstrate sufficient
mastery on the intervention’s embedded progress monitoring assessments to progress to the next set
of lessons. If mastery is not demonstrated by all students in the group, the group must repeat
individual lessons until mastery is achieved. In regular practice, schools are expected to continue to
provide the program to students until the students successfully finish the 80 distinct lessons. The time
required varies as it depends on the extent to which students need to repeat lessons, as guided by
their fortnightly progress assessments. Therefore, it was not expected that students will necessarily
complete the 80 lessons in a direct sequence.
At each participating school, leaders identified suitable staff members to be trained to deliver MiniLit.
All MiniLit tutors were either qualified teachers or paraprofessionals under a qualified teacher’s
supervision. The training was conducted by a MiniLit course tutor from MultiLit Pty Ltd. During the two-
day workshop, tutors received professional development in effective reading instruction based on a
combination of theory, live demonstration videos, and small group role-play. The workshops covered
the rationale for the intervention, the reading domains targeted by the intervention, how to deliver the
content during the MiniLit lessons, and how to tailor the intervention to the child’s specific needs. To
support professionals delivering the program after the training, MiniLit tutors received up to two
support visits from a MiniLit Course Tutor during the first 10 weeks of the intervention. These visits
included observation of a lesson and feedback. Support was also available via telephone or email.
The intervention was to be delivered over 20 school weeks, starting from Term 2 (April) in 2017. The
actual start date for each school varied depending on when they attended training and when
appropriate resources were available to commence the intervention. Schools were provided with
teaching materials comprising MiniLit Kits with all required Teacher and Student resources. Working
with the MiniLit tutor, groups of up to four students completed each MiniLit lesson in an appropriate
quiet area in the school. At schools where more than four students were randomised to the MiniLit
group, two or more groups were ran. Students were grouped based on their initial reading ability
determined by pre-testing immediately prior to the intervention commencing, as per the MiniLit
standard protocol. A description of the intervention is shown in Table 1-1.
An important consideration when interpreting the findings from this evaluation is the duration provided
to schools to complete the program. For pragmatic and funding purposes, schools were allocated 20
weeks to complete the intervention, with some adjustments allowed for whole class (e.g. school camp)
or school events (e.g. swimming carnivals). As MiniLit has 80 distinct lessons, students in this study
ideally would complete all lessons without needing to repeat any to complete the full MiniLit program.
However, MiniLit has regular assessments, which provides the MiniLit tutor with guidelines as to
whether students have mastered the required skills to progress to more complex activities. Therefore,
it was expected that students would repeat some lessons as part of developing their reading skills
during the intervention.
For this study, compliance to the MiniLit program was set at 80% of lessons (i.e. delivery at least 4
days per week) during the 20-week intervention period, and that students would receive all three
components of the MiniLit intervention during each lesson.

Evaluation Report | MiniLit 20
Table 1-1: Overview of MiniLit Intervention
Who MiniLit program targets the bottom 25% of readers in Year 1
How The MiniLit program is delivered through a student withdrawal from class.
Rationale of MiniLit and its elements
The MiniLit program is a Tier 2 intervention (13), which aims to increase reading ability of the bottom 25% of readers in Year 1 through 80 intensive 1-hour lessons. The key skills targeted by MiniLit include (i) phonemic awareness; (ii) phonics; (iii) fluency; (iv) vocabulary; and (v) comprehension.
Intervention materials and procedures
MiniLit comprises individual student learning resources for literacy delivered through paper-based materials. The program comprises 80 structured lessons that take around 20 weeks to complete, with four lessons of up to 60 minutes per week. The program includes regular measures to monitor the progress of the students. The intervention is offered in groups, with a maximum of four students in each group.
The MiniLit program is divided into two levels of forty lessons each that students complete according to a placement test included in the program. As a consequence, some students do not complete all 80 lessons depending on where they place in the program.
Level 1: Teaching the basics of letter/sound knowledge and decoding skills for Consonant-Vowel-Consonant (CVC) words
Level 2: Extending word attack knowledge by teaching commonly used digraphs and longer words
Training to facilitate the MiniLit program requires a two-day MiniLit professional development workshop. During the workshop, either qualified teachers or paraprofessionals will receive professional development in the area of effective reading instruction by MiniLit Course Tutors. It is based on a combination of theory, live demonstration videos, and small group role-play.
1.4 Overall evaluation objectives
The primary research objective of this project is:
• To determine, for Year 1 students in the bottom 25 per cent of readers, whether students who
receive MiniLit have better reading outcomes at 12 months post-randomisation, compared to
those who have Usual Learning Support (the ‘control’ group). The trial evaluated students’ reading
with three primary outcomes of YARC – PR Reading Accuracy, YARC – PR Reading Rate and
YARC – PR Reading Comprehension.
The secondary research objectives are:
• To determine student reading outcomes in both intervention and control groups six months (short-
term) post-randomisation.
• To determine the implementation enablers and barriers that are predictive of program success and
sustainability.
• To determine the cost per student and cost-effectiveness of the intervention.
1.5 Ethical review and trial registration
Ethics approval was obtained from The Royal Children’s Hospital (HREC 36301) in Melbourne,
Australia and the New South Wales Department of Education (SERAP 2016576) in Sydney, Australia.
The study is registered with the Australian New Zealand Clinical Trials Registry
(ACTRN12617000179336).

Evaluation Report | MiniLit 21
1.6 Overall timeline
Table 1-2: Overall study timeline and responsibilities
Date Activity Responsible
Nov 2016 Ethics approval from Human Research Ethics Committee at The Royal Children’s Hospital.
MCRI / MGSE
Nov 2016 Research approval from the NSW Department of Education. MCRI / MGSE
Dec 2016 Expression of Interest for school participation and selection of participating schools for Phase 1 of the process evaluation.
MGSE
Dec 2016 Expression of Interest for school participation and selection of participating schools for the efficacy RCT.
DET / MCRI
Jan 2017 Send implied consent form to all students at participating schools. DET / MCRI
Feb to Mar 2017 (School Term 1)
Screening of reading ability of all Year 1 students at participating schools who have not opted out of project.
MCRI
Mar to May 2017 Teachers and paraprofessionals trained to be MiniLit teachers at one of four two-day training courses.
MiniLit / DET
Mar and Apr 2017 Baseline assessments conducted with all students in the RCT. MCRI
Apr 2017 CEBU statistician randomised eligible students into an intervention group and a control group. This information was sent to the schools during the first week of April 2017 (end of Term 1).
MCRI
Apr 2017 MultiLit provided materials to the schools in preparation for delivery of the program in Term 2.
MiniLit
Apr 2017 Parent Letters were distributed to schools to give to students during the first week of term 2. The letters informed parents which group their child is in (intervention or control).
MCRI
May to Jul 2017 The delivery of the MiniLit program over 20-weeks began in the schools. DET
May to Jul 2017 MultiLit conducted support visits to schools. MultiLit
May to Jul 2017 The University of Melbourne team, based at the Melbourne Graduate School of Education Centre for Program Evaluation, conducted the first round of observations of the intervention in progress, collecting quality and fidelity measures and surveying students and teachers.
MGSE
Aug to Nov 2017 A second round of process evaluation observation visits. MGSE
Oct to Dec 2017 MiniLit intervention concluded at each school after 20 consecutive weeks of intervention delivery.
DET
Oct to Dec 2017 Outcome Assessments were completed immediately post-intervention (~six months post-randomisation) with all available students in the study (n=214).
MCRI
Mar to Jun 2018 Final Outcome Assessments were completed six months post-intervention (~12 months post-randomisation) at each school (n=217). This included students who had moved to nearby schools and were available for assessment.
MCRI

Evaluation Report | MiniLit 22
2 Impact evaluation methods
2.1 Trial design
The trial protocol has previously been reported (see http://evidenceforlearning.org.au/lif/our-
projects/minilit/). This was an efficacy RCT of a reading intervention, the MiniLit program
(see Section 1.4), compared to Usual Learning Support for Year 1 students with a reading ability
in the bottom quartile. Results are reported according to CONSORT guidelines for non-pharmacologic
interventions (17).
This is a parallel two-arm randomised controlled trial of the MiniLit intervention. Students eligible for
the trial were identified via a screening procedure of all students in Year 1 (see screening section).
Students in the trial were individually randomised to either receive the intervention or to the control
group. Students in the control group (henceforth ‘Usual Learning Support’) were allowed to be
provided with any learning support that the school was already implementing. This could include
whole-class approaches and/or Tier 2 and 3 support programs (e.g. Reading Recovery). In addition,
schools were also asked to use their usual processes in identifying which students outside the
intervention group needed support, such as teacher observations, parent concerns, or
formal assessments.
For more information about the design of the trial and how students were individually randomised,
see randomisation section.
2.1.1 School recruitment
All government primary schools within NSW were eligible to participate if they met the
following criteria:
• Year 1 student population of over 70 students.
• Located within 50 kilometres of the metropolitan centre of Sydney, Newcastle or Wollongong.
• A socio-economic status in the top two quartiles (i.e. most disadvantaged locations). This is
determined by the NSW Department of Education’s 'Family Occupation and Education Index'
(FOEI) – defined using parents’ education level and occupation for each student.
• Not already using the MiniLit or MultiLit program with their Grade 1 students.
Schools were initially emailed by the NSW Department of Education (DoE) to provide an Expression of
Interest (EOI) to participate in the project. The study team followed up via email and telephone to
encourage participation.
From all schools who expressed an interest in participating, an independent statistician not involved in
the project was to select 20 schools using a randomisation sequence stratified by SES category (See
‘Randomisation’ in section 2.4 below). If fewer than 20 expressed an interest, all schools meeting
criteria would be selected to participate in the trial.
As nine schools expressed an interest, all were included in the study. This low recruitment rate may
reflect that schools were not approached until January 2017, which is the start of the school academic
year, and many schools may have already decided on their literacy intervention strategies and
programs for the year.

Evaluation Report | MiniLit 23
2.1.2 Child recruitment using opt-out process
Student recruitment involved an opt-out process, as approved by the NSW Department of Education.
The opt-out process covered the initial screening for reading difficulties, and for students eligible to
take part in the RCT, included randomisation and data collection.
Three weeks before the screening process, participating schools provided parents of all Year 1
students who met the eligibility criteria with a recruitment pack, which included a cover letter, parent
information statement (PIS) and opt-out consent form. Information included the project’s aims, time
requirements and expectations. Parents were able to contact the research team via a provided phone
number or email if they had any questions or did not want their child to participate.
To increase the likelihood that parents received the information before the study commenced, a
notification was placed in the school newsletter to inform parents of Year 1 students that their school
was involved in the study and that the PIS had been sent home with all Year 1 students. Teachers
were also encouraged to inform parents about the PIS in their general interactions with families. In
addition, all parents were sent a second parent information statement two weeks after the initial letter
was sent home.
2.1.3 Exclusion criteria
The exclusion criteria were based on teacher report. Students in the following categories were
excluded from the screening and trial stage:
• Students with disabilities (e.g. cerebral palsy, vision/hearing impairments) that would not allow
them to participate in the intervention.
• Students with Language Background Other Than English (LBOTE) whose English Language
abilities would not allow them to participate in the intervention. Although this may affect the
generalisability of the findings to such students, the aim of the project was to establish efficacy
and the intervention can only be delivered in English.
• Students who were not able to complete the screening test due to extended absences from
school, or the screening test was attempted but not completed due to one of the reasons above.
Further, students were excluded prior to randomisation if they had already been allocated to any other
reading intervention program within their school that involved regular withdrawal from class.
2.1.4 Screening for reading difficulties
The first measurement point was screening to determine eligibility for the RCT. The subsequent three
measurement points involved reading assessment with all students participating in the RCT. These
assessments took place at baseline, immediately post-intervention, and at six months post-
intervention (approximately 12 months post-randomisation). See Outcomes section below for
more detail.
All students in Year 1 at participating schools were screened for reading difficulties to identify students
in the bottom 25th percentile of readers in Year 1. The original protocol approved by the RCH HREC
and the NSW Department of Education in November 2016 included use of the YARC – PR as a
screening measure. After discussion with all stakeholders in December 2016, prior to the study
commencing, the screening measure was changed from YARC – PR to the developers’ Wheldall
Assessment of Reading Lists (WARL) (18). This aligns the study to the screening process which the
intervention uses to identify students who should be offered the intervention.

Evaluation Report | MiniLit 24
The initial assessments were conducted by the classroom teacher in one-to-one testing conditions
with each child. The test took five minutes per child to complete and requires the child to read three
lists of 100 words for 60 seconds each. The teacher was provided with training and simple guidelines
about how to determine words read correctly and in-error for each list, but not to calculate the overall
raw score or convert the raw scores to the standardised scores that were used to identify the
target population.
Teachers provided the research team with the completed assessment sheets for each student. The
research team scored each assessment to identify students who fell into the bottom 25th centile of
readers according to the measure’s published standardised data. These students were eligible for the
trial and underwent a 30-minute face-to-face assessment with a trained research assistant before
randomisation occurred.
2.2 Measures
As reading is a complex and multi-component set of skills, secondary outcomes that measure
foundational skills for reading (such as decoding, phonemic awareness and letter knowledge) were
measured (8). This enabled a more detailed understanding of the intervention’s efficacy in changing
the underlying literacy skills that lead to improved reading as measured by the primary outcomes of
Accuracy, Rate and Comprehension.
2.2.1 Primary outcome measure for this trial
The primary outcome was measured using the York Assessment of Reading for Comprehension –
Passage Reading (YARC – PR) (19) at 12 months post-randomisation. The YARC – PR is an
individually administered paper-based assessment of early reading skills that is used to identify
reading difficulties in children aged 4 to 7 or older. The YARC – PR provides three subtest scores: (i)
Accuracy, (ii) Reading Rate and (iii) Comprehension. The test provides raw scores for each subtest in
the early reading component which can be converted to a standard score (Mean = 100, Standard
Deviation = 15), percentile rank, and age equivalents. The assessment is conducted individually by a
trained research assistant and takes about 10 to 20 minutes per student.
2.2.2 Secondary outcome measures for this trial
In addition, the secondary outcome measured at six and 12 months post-randomisation were:
• The YARC – Early Reading (YARC – ER) (20) assesses phonological skills, alphabetic
knowledge and individual word reading. It yields four subtests, which are (i) Letter Sound
Knowledge, (ii) Early Word Recognition, (iii) Sound Deletion and (iv) Sound Isolation. The
measure is individually administered and takes approximately 15 minutes to complete per child.
The test provides raw scores for each subtest in the early reading component which can be
converted to a standard score (mean =100, SD=15), percentile rank and age equivalents.
Subtests (iii) and (iv) are combined to create (v) Phoneme Awareness composite score.
• Castles and Coltheart Test 2 (CC2) (21) assesses the ability to read single words in isolation.
The full test consists of three subscales; 40 regular words, 40 irregular words and 40 nonwords,
which are presented one at a time, in mixed order, and with gradually increasing difficulty. The
measure has been validated in six to 11.5-year-old children. Both raw scores and standardised
scores are available for each subscale.

Evaluation Report | MiniLit 25
The Castles and Coltheart Test 2 (CC2) was included in the protocol as a secondary outcome
measure in December 2016, subsequent to approval of the original protocol (November 2016) after
discussion with the stakeholder group. The addition of the CC2 to the study allowed us to examine
students’ ability to decode single words, which is a key short-term outcome of the intervention’s theory
of change. In this model, students build on phonemic awareness skills to develop single syllable word
decoding skills and then on to more complex reading skills. The CC2 allowed measurement of this
intermediate step between the basic and skilled literacy tasks.
2.2.3 Confounders measured at baseline
The following measures were collected only at baseline and were investigated as confounders in the
primary and secondary outcome analysis.
• Children's Test of Nonword Repetition (CN Rep) (22) assesses students’ ability to retain
unfamiliar phonological information in their working memory for immediate recall. Working memory
is closely linked to students’ oral language abilities. The ability to read for meaning relies greatly
on students’ capacity to hold verbal information for processing and comprehension. The CNRep
takes approximately three minutes to administer per child and has been standardised and
validated for children between four and eight years old who are attending mainstream schools
(mean 100, SD 15).
• Rapid Automatized Naming and Rapid Alternating Stimulus tests (RAN/RAS) (23) assesses
the child's ability to retrieve lexical and phonological information rapidly and efficiently. Retrieval
speed has been shown to be a factor that influences students’ ability to read fluently and with
automaticity. Neurological processing speed is a well-established key biological factor which
influences students’ reading ability, and may confound a child’s response to a reading
intervention. Only the Rapid Automatized Naming component of this test was administered,
comprising Object Naming, Colour Naming, Letter Naming and Number Naming subtests. The
RAN/RAS has been normed for children from five to 18 years (mean 100, SD 15).
The Rapid Automatized Naming test was included in the protocol in December 2016 as a baseline
measure after discussion with the stakeholder group, subsequent to approval of the original protocol
(November 2016). Demonstrating equivalence at baseline for processing speed is a stated limitation in
previous reading intervention studies.

Evaluation Report | MiniLit 26
The time points for administering each measure are shown in Table 2-1 below.
Table 2-1: Project Measures
Measure Construct Time (mins)
Timepoint
Baseline 6-mths 12-mths
Screening measure
Wheldall Assessment of Reading Lists Reading 5 ♦1 ♦
Primary outcome
York Assessment of Reading for Comprehension – Passage Reading
Reading ability 15 ♦ ♦ ♦
Secondary outcomes
York Assessment of Reading for Comprehension – Early Reading
Reading skills 10 ♦ ♦ ♦
Castles and Coltheart Test 2 Single word reading 3 ♦ ♦ ♦
Confounders
Children's Test of Nonword Repetition Phonological memory 2 ♦
Rapid Automatized Naming Processing speed 3 ♦
1 Conducted by classroom teacher
2.3 Sample size
When calculating the sample size prior to the commencement of the research, the capacity of the
MiniLit developers with regards to training and resource requirements was taken into account.
A sample size calculation was performed based on the assumption of 1300 students enrolled across
20 participating schools (an average of 65 students per school). It was anticipated that five per cent of
students (N=65) would be ineligible for the project based on the inclusion criteria. It was estimated that
25 per cent of students would be identified as ‘low readers’ (N = 308) and thus eligible for the project.
With an estimated attrition rate of 10 per cent over the 1 year of the project, it was expected to have a
final sample of 278 students (N = 139 per group) with analysable data.
A sample size of 278 students would be able to detect an effect size of 0.34 in scores on the primary
outcome, with 80 per cent power at a 5 per cent level of significance.
This sample size calculation did not consider the effect of clustering for SES category at the school
level (which would decrease power and increase detectable effect size) or the correlation of the
pre- and post-test scores (which would increase power and decrease detectable effect size).
Both of these data were not available at the point of study design and the effect size should be
considered conservative.
The final analytical sample of 217 students showed 80 per cent power at 5 per cent level of
significance to detect an effect size of 0.38 between the groups.

Evaluation Report | MiniLit 27
Table 2-2: Minimum detectable effect size at different stages
Stage N [schools/students]
(n=intervention; n=control)
ICC Blocking/ stratification or pair matching
Power Alpha Minimum detectable effect
size (MDES)
Protocol 278 (139; 139) 0.1 Stratification 80% 0.05 0.34
Randomisation 237 (119; 118) 0.1 Stratification 80% 0.05 0.37
ITT analysis 217 (108; 109) 0.1 Stratification 80% 0.05 0.38
The correlation matrix for all variables used in the analyses is presented in the Appendix (Figure C1).
2.4 Randomisation and masking
The unit of randomisation was the individual student. Eligible students within each school were
randomised to the MiniLit (intervention) or Usual Learning Support (control) group. The randomisation
was conducted by a statistician independent of the study team using Stata 14. Randomisation was
performed in block sizes of two or four students, stratified by school. Random block sizes of two or
four were used to enable a balance of numbers at each school being allocated to each arm, with
larger block sizes not possible given the expected low number of students at each school. Block sizes
of two were used for most schools, and block sizes of four were used for two of the larger schools to
ensure total number of intervention students would be divisible equally into intervention groups (group
size of four students) as these schools were not practically able to run further groups with smaller
numbers of students, which may have eventuated with a smaller block size. In addition, this approach
limits allocation bias, which may inadvertently occur if the person conducting the randomisation is able
to identify the next allocation in the sequence. The statistician was provided with a list of eligible
students in random order (student ID and school) to allocate students based on the randomisation
sequence. The randomisation status data was stored in a restricted REDCap data collection tool that
could only be accessed by the project manager and not the field assistants or investigator team to
minimize the risk of unblinding. All caregivers were informed of their child’s randomisation status via a
letter. Parents were able to contact the research team to discuss any concerns they might have had
about their child’s assessment or allocation. However, it is important to note that no changes in
allocation were permitted.
Randomisation was performed immediately after baseline assessments were complete wherever
possible, however, in one school, baseline assessments were delayed due to factors outside the
research team’s control, so randomisation took place prior to completion of baseline assessments.
119 students were randomised to the intervention group and 118 to the control group.
Allocation was concealed from members of the research team involved in outcome assessments for
the duration of the project. School staff, teachers and students were asked not to disclose student
randomisation status during the assessments.
Evaluation Report | MiniLit 28
2.5 Usual Learning Support
Students allocated to the ‘usual learning support’ (control) were allowed to be provided with any
learning support that the school was already implementing. This could include whole-class approach
and/or Tier 2 and 3 support. The type of support provided to the students was at the discretion of the
school. The only restriction for these students was that they could not be offered the MiniLit
intervention, which could only be provided to the students randomised to that group. In addition,
schools were also asked to use their usual processes in identifying which students outside the
intervention group needed support, such as teacher observations, parent concerns, and
formal assessments.
2.6 Data collection
Data collection involved face-to-face direct child assessments immediately post-intervention (~six
months post-randomisation), and six months post-intervention (~12 month post-randomisation). Some
schools were delayed in commencing the intervention, leading to variability in the length of time
between the randomisation date and the intervention start date. The decision to link the timing of
follow-up data collection to the intervention dates rather than the randomisation date was made to
ensure a consistent time from the end of the intervention at each school to the follow up assessments
for all children.
Trained research assistants conducted the student assessments during school hours in a room
allocated by the school. All requirements for assessment for child safety as required by the NSW
Department of Education were adhered to. Letters were sent home with each child in the RCT 1-2
weeks prior to the assessment period at each school informing parents that their child would soon
have a follow-up assessment for the project. Contact details of the research team were provided in
case parents had any questions or concerns.
For the 12-month follow-up assessments, students who had moved schools during the course of the
trial were tracked down where possible. The original school provided the name of the school the child
moved to if known, and permission was sought from the principal of the student’s new school to visit to
assess the child. Students were only followed up if their new school was within one hour’s travel
distance of other participating schools due to practicality and funding constraints. When permission
was given by the principal or his/her representative, and a date for the visit arranged, a letter for the
parent was sent home with the child informing the parents that the child would soon have the final
follow-up visit for the project at their new school.

Evaluation Report | MiniLit 29
2.7 Analysis
All analyses were conducted in Stata 15.0 and used an ‘intention to treat’ approach. This approach
analysed students based on which group they were allocated to at randomisation, and did not take
into account the amount of intervention students received. Although the study had multiple primary
and outcome measures, adjustment for multiple testing was not conducted. Although adjustments for
multiple testing are common when conducting exploratory analyses, all the outcomes measured in this
RCT are based on previous research as to the theory of change in supporting children’s reading
development. It is more important to interpret the mean point differences between groups, confidence
intervals and p-values in their entirety.(24)
The primary analysis used a multivariate hierarchical linear regression at the level of the individual
child to examine the YARC-PR standard scores at 12 months post-randomisation between the
treatment arms. The model for primary analysis used was the Adjusted for baseline reading score
(including treatment arm and clustered by school). The treatment arm is a fixed effect and all other
variables are random effects. Findings between groups are presented as mean differences with 95 per
cent confidence intervals, p-values and Cohen’s d effect sizes.
The equation for Model 1 is: 𝒀𝑖 = 𝑿𝑖𝛽 + 𝒁𝑖𝑏𝑖 + 𝜀𝑖
Where 𝑌𝑖 is the vector of responses (YARC standard score) in group i
𝑋𝑖 is the matrix of the p predictor variables for each observation in group i with corresponding p-length
fixed effects regression coefficient vector β
𝑏𝑖 is the m length vector of random effects (school)
𝑍𝑖 is the random effects design matrix for group i
𝜀𝑖 is the vector of errors
'School' was included as a clustering variable using an unstructured covariance matrix to allow for the
intraclass correlation within school. Differences between groups were analysed in an adjusted model
which included baseline score as a predictor variable. Findings between groups are presented as
mean differences with 95 per cent confidence intervals, p-values and Cohen’s d and Hedges’ g effect
sizes. All secondary outcomes were analysed in the same way as the primary outcome variables.

Evaluation Report | MiniLit 30
2.8 Additional analysis
In addition to the primary analysis described above, two sensitivity analyses (see below) were
conducted also using multivariate hierarchical linear regression at the level of the individual child to
examine the primary and secondary outcome measures at six and 12 months post-randomisation
between the treatment and control arms. ‘School’ was included as a clustering variable using an
unstructured covariance matrix to allow for the intraclass correlation within school. The first sensitivity
analysis was unadjusted (see dot points below). The second was adjusted for baseline variables
predicted to explain variance in the main outcome measure; baseline score as well as a priori
confounders of student age, sex, family SES, Rapid Automatised Naming test and Children’s Test of
Non-word Repetition all measured at baseline.
Sensitivity analysis models:
• Unadjusted (including treatment arm and clustered by school).
• Adjusted for baseline measures; reading score, student age, sex, family SES variables, Rapid
Automatised Naming test and Children’s Test of Non-word Repetition (including treatment arm
and clustered by school).
Analyses were conducted using Stata Version 15 using the same equation as the primary analysis.
The treatment arm is a fixed effect and all other variables are random effects. Findings between
groups were presented as mean differences with 95 per cent confidence intervals, p-values and
Cohen’s d effect sizes.
The results of the unadjusted model (first dot point) are not included in this report as they did not add
any additional information beyond the results of the primary analysis and the sensitivity model
adjusted for a priori confounder at baseline (second dot point). In the results section below, only two
sets of results are presented:
1. the results of the primary analysis, and
2. the results of the second sensitivity analysis – the model adjusted for baseline measures; reading
score, student age, sex, family SES variables, Rapid Automatised Naming test and Children’s
Test of Non-word Repetition (including treatment arm and clustered by school).
2.9 Missing data
Statistical analysis approaches and imputation techniques can never compensate for or exactly
reproduce missing data. Therefore, no analytical strategy exists that can minimise all bias potentially
introduced by missing data. However, consistencies or inconsistencies in the results based on
different strategies to handle missing data can provide support for the interpretation of the study
findings and either strengthen or attenuate the study conclusions.
The frequency and patterns of missing data were examined. In order to reduce potential bias due to
participant drop out over time, multiple imputation methodology was considered to accommodate
missing outcome data, if appropriate. There is no agreed upon acceptable level of missing data,
however, >10 per cent missing data was regarded as a threshold to initiate analysis using multiple
imputation. For the primary outcome variables, if more than 10 per cent of data was missing for any
reason, an analysis using multiple imputation was done.
Assuming validity of the missing-at-random (MAR) assumption, fully-conditional modelling was used to
impute missing values based on variable-specific prediction models. In particular, multivariate
imputation chained equations (MICE) was used to perform imputation of missing values. Depending

Evaluation Report | MiniLit 31
on the type of outcome, different link functions and model specifications was employed to utilise the
built-in imputation: predictive mean matching under a Gaussian model for continuous data, logistic
regression for binary data, polytomous logistic regression for unordered categorical data and
proportional odds models for ordered categorical data.
A total of 20 imputed data sets were generated based on the MICE algorithm. For each of the
respective data sets, the outcome-specific effect estimate and standard error was computed and
pooled using Rubin’s rules (Van Buuren, 2007). If MICE models did not converge, missing values
were filled in using multivariate normal regression (MVN). These two methods have been shown to
give equivalent results. The following auxiliary variables were included in the imputation model: sex,
age, SES, WARL, RAN, CNRep, CC2, YARC-ER and YARC-PR at baseline as well as YARC
measurements at six months.
2.10 Compliance
Compliance was defined as attending at least 80 per cent of the MiniLit lessons during the 20-week
intervention period, as defined by the developer of MiniLit. Those attending at least 80 per cent of
lessons (i.e. receive the intervention at least 4 days per week) were expected to receive the maximum
benefit from the intervention. The intensive delivery of MiniLit set for compliance aligns with
expectations of a Tier 2 RTI intervention, where intervention is delivered in an intensive manner in
small groups of students. Number of students completing the full 80 unique lessons was not used in
the compliance because the frequency of intervention during the 20 week period was deemed to be
more important than students completing all of the 80 unique lessons. This was because of the
likelihood that students will need to repeat lessons when mastery is not achieved.
We analysed the efficacy of the intervention in the presence of non-compliance using the Complier
Average Causal Effect (CACE).
While RCTs have long been the gold standard for allowing causal inferences to be made about the
efficacy of an intervention, traditional RCT data analysis methodology does not take sub-optimal
participant compliance into account. Recent advances in maximum likelihood parameter estimation
and mixture modeling methodology have resulted in the development of the Complier Average Causal
Effect (CACE) structural equation mixture model (25), which allows us to estimate treatment effects
even when participant compliance is poor. Thus, it is an appropriate sensitivity analysis to use for this
study where there is a reasonable expectation of non-perfect compliance in a school setting.
CACE compares the average outcome of the compliers in the treatment arm with the would-be
compliers in the control arm. This estimate relies on the exclusion restriction (that there is no effect of
randomisation on the outcome, except through the treatment received). Compliance was defined as
attending at least 80 per cent of the MiniLit lessons (i.e. receive at least 4 days per week) during the
20-week intervention period, as defined by the developer of MiniLit. Because there was no possibility
of participants assigned to the control arm of receiving the intervention, the CACE analysis was done
by adjusting the ITT estimate by the proportion of participants who complied with the treatment; i.e.
CACEδ = ITTδ*p where p= the proportion of compliant participants. Confidence intervals for the
CACE estimate of effectiveness was calculated using bootstrapping.
The compliance threshold was set at 80 per cent as the developers believed this was the minimum
amount of exposure required to affect the primary outcomes. However, it is quite possible that a
positive effect could be expected on secondary outcomes with lower exposure. If this is true, the
CACE analysis would over-estimate the effect sizes for those secondary outcomes.

Evaluation Report | MiniLit 32
3 Impact evaluation findings
3.1 Participant flow including losses and exclusions
3.1.1 At recruitment
A total of 755 Year 1 students across nine schools were invited to participate (see Figure 3-1 below).
Two students opted out. Of the remaining 753 students eligible for screening, 740 (98.3 per cent)
were screened using the Wheldall Assessment of Reading Lists, eight were absent during the
screening period, four screening tests were incomplete and one student had missing data. Of the 740
students who completed the screen, 284 (38.4 per cent) scored below the 25th percentile and were
eligible for the RCT. It is worth noting that the percentage of students who scored below the 25th
percentile on the standardised screening measure was well above 25 per cent, as may be expected in
this cohort from schools with a socio-economic status in the top two quartiles (i.e. most disadvantaged
locations). Of those 284 students, 46 (16.2 per cent) were excluded because they had already
commenced another Tier 2 or Tier 3 literacy program involving withdrawal from class, and the
stakeholders agreed that it was not practical or desirable to potentially involve these students in MiniLit
simultaneously. One further child was excluded because they moved schools prior to baseline data
collection. Of the 237 students who remained eligible for the RCT, baseline assessments were
completed with 236 students (99.6 per cent). One student was absent and not able to be assessed. Of
the 237 students in the RCT, 119 (50.2 per cent) were allocated to the MiniLit group and 118 (49.8 per
cent) to the control group, as described above in section 2.5.
3.1.2 Missing data at follow-up
There was minimal missing data at the follow-up time points, with the primary reason for loss of follow-
up being students moving schools and not leaving details about the school which they were moving to.
As the missing data was minimal, and all missing data appeared to be random, this did not meet the
criteria to use multiple imputation.
The threshold for conducting multiple imputation methodology to reduce potential bias due to student
drop out over time was >10 per cent missing data (see Statistical Analysis Plan page 16). There were
no variables with >10 per cent missing data, thus, missing data techniques were not used.
The main reason for loss to follow up was students having changed schools (between 4 per cent and
9 per cent at each time point), or extended student absence (1-2 per cent). One student in the control
group withdrew from the study before the first follow-up, and one student in the intervention group was
taken into another Tier 2 intervention after randomisation but prior to the intervention commencing into
that school, so did not commence the intervention. According to ITT protocol, this student was
included in the analysis.
At six months follow-up, 107 students in the MiniLit group (89.9 per cent) and 107 students (90.7 per
cent) in the control group completed follow-up assessments (see Figure 3-1 below). At 12 months
post-randomisation, retention remained at a similar level. Although additional students had changed
schools by this time point, effort was made to track down students who had changed schools since the
study commenced. All students who moved to a nearby school, where the school was known, were
assessed (n=13). However, a further 19 students (11 in the MiniLit group and eight in the control
group) moved interstate/overseas or the location was not known and were not able to be assessed. In
total, 108 students (90.8 per cent) in the MiniLit group and 109 students (92.4 per cent) in the control
group completed assessments at 12 months post-randomisation and provided primary outcomes data.
All students available for follow-up assessments at the 6 month and the 12 month time points
completed all measures and subtests. Thus, the total rate of attrition was 8.4 per cent.

Evaluation Report | MiniLit 33
Figure 3-1: Participant Flow Chart
The total student attrition between randomisation and analysis of primary outcomes at 12 months
follow-up was 8.4 per cent (91.6 per cent of students had outcomes data).

Evaluation Report | MiniLit 34
3.2 Percentage of students identified at each school
As MiniLit uses a standardised assessment to identify children in the 25th percentile of reading for
their age, it is possible to examine the variations across schools. From the Figure 3-2, it can be seen
that the range was between 16 per cent to 52 per cent of children at each school being identified as
having a reading ability which indicates the child may benefit from a Tier 2 intervention given they are
in the bottom 25th percentile of readers for their age. This also highlights the variations between
schools of children who may require additional support.
Figure 3-2: Percentage at each school identified in the bottom 25th percentile
3.3 Baseline characteristics
3.3.1 Recruited sample
Nine primary schools agreed to participate. There were 753 students who underwent the reading
ability assessment, of whom 237 students were included in the RCT. Table 3-1 (below) shows the
baseline trial sample characteristics. There were roughly even numbers of boys and girls, and there
was equivalence in the primary and secondary outcomes, as well as the confounders.
Variables were well balanced between the intervention group and the control group. We can assume
comparability at baseline. This assumption is valid because students were randomly allocated, the
sample size is large and the allocation was concealed. Nonetheless, baseline variables were
compared using the two sample t-test assuming equal variance. Scores were not adjusted for multiple
comparisons. No significant differences between groups were found. The difference between the
intervention group and the control group approached significance (p=.052) for the Children’s Test of
Non-word repetition standard score.

Evaluation Report | MiniLit 35
3.3.2 Imbalance at baseline for analysed groups
A cross tabulation is reported for baseline variables summarised by treatment arm (See Appendix C).
In all cases, the means of each group are similar and are well within one standard deviation of each
other. The mean score for Control participants without data at 12 months on the Children’s Test of
Non-word Repetition approached one standard deviation below the other scores; however, there were
only nine participants in that group and the scores on this test were highly variable.
Imbalance at baseline was investigated by comparing baseline variables within groups. Students with
and without data at the 12-month follow up time point were compared for the intervention group and
the control group using the two sample t-test, assuming equal variance.
There were 11 children (9.3%) in the intervention and 9 children (7.6%) in the control groups who did
not have data at follow up. No statistically significant differences between groups were found.
Table 3-1: Baseline Comparison of recruited sample
Intervention group (n=119) Control group (n=118)
N (missing)
Mean or n (%)
SD IQR N (missing)
Mean or n (%)
SD IQR Mean diff.
p-value
Effect size
Screening measure
WARL screen 119 (0)
11.11 4.46 7.67 to 15.00
118 (0)
10.75 4.97 8.00 to 14.67
0.35 .57 0.07
Demographics
Sex – n male (%)
119 (0)
60 (50.4)
118 (0) 57 (48.3)
.75 (chi2)
Age at baseline 119 (0)
6.44 0.38 6.20 to 6.70
117 (1)
6.41 0.38 6.10 to 6.70
0.03 .54 0.00
SES – Student SEA
119 (0)
7.17 1.99 5.90 to 8.50
118 (0)
7.01 2.42 5.00 to 9.00
0.16 .57 0.07
Primary Outcomes
YARC-PR Accuracy raw score
119 (0)
6.77 4.07 4 to 9 117 (1)
6.25 4.45 2 to 10 0.53 .34 .12
YARC-PR comprehension raw score
119 (0)
3.52 2.27 2 to 5 117 (0)
3.08 2.18 2 to 5 0.45 .13 0.20
YARC-PR Reading Rate*
3 (116)
- - - 2 (115)
- - -
Secondary Outcomes
YARC-ER Letter Sound Knowledge standard score
119 (0)
89.73 11.54 83 to 97 117 (1)
88.13 11.66 78 to 95 1.60 .29 0.14
YARC-ER Early Word Reading standard score
119 (0)
84.55 12.38 70 to 95 117 (1)
84.25 12.64 71 to 95 0.31 .85 0.02

Evaluation Report | MiniLit 36
Intervention group (n=119) Control group (n=118)
N (missing)
Mean or n (%)
SD IQR N (missing)
Mean or n (%)
SD IQR Mean diff.
p-value
Effect size
YARC-ER Phoneme Awareness Composite standard score
119 (0)
89.53 12.01 81 to 98 117 (1)
88.72 10.97 81 to 95 0.81 .59 0.07
Castles and Coltheart 2 Regular Word Reading z-score
119 (0)
-1.08 0.54 -1.56 to -0.74
117 (1)
-1.13 0.47 -1.58 to -0.92
0.05 .45 .51
Castles and Coltheart 2 Irregular Word Reading z-score
119 (0)
-1.12 0.57 -1.58 to -0.85
117 (1)
-1.16 0.49 -1.58 to -0.85
0.04 .59 .07
Castles and Coltheart 2 Non-word Reading z-score
119 (0)
-0.62 0.56 -1.21 to -0.26
117 (1)
-0.72 0.51 -1.21 to -0.41
0.10 .16 0.18
Confounders
RAN-Object Naming standard score
119 (0)
94.23 14.62 86 to 103
116 (2)
92.49 16.43 81.5 to 105
1.74 .39 .11
RAN-Colour Naming standard score
119 (0)
92.86 16.73 83 to 102
116 (2)
91.03 14.97 79.5 to 101
1.82 .38 .11
RAN-Number naming standard score
115 (4)
94.96 15.76 87 to 107
111 (7)
94.89 15.01 83 to 106
0.07 .97 .00
RAN- Letter naming standard score
116 (3)
97.39 14.16 88 to 107.5
112 (6)
96.48 15.41 84 to 106
0.91 .64 .06
Children’s Test of Non-word Repetition standard score
119 (0)
101.72 18.46 89 to 117
117 (1)
96.43 22.93 80 to 114
5.30 .05 .25
*Reading rate data was not available for the majority of students at baseline.

Evaluation Report | MiniLit 37
3.4 Floor effects of measures
3.4.1 At baseline
Table 3-2: Number of students who performed at floor at baseline and their raw scores
Test at baseline Total N N (%) at floor Raw score range for students at floor
Primary Outcome
YARC-PR Accuracy 236 230 (97.5) 0 to 15 correct
YARC-PR Rate 236 230 (97.5) Not able to be scored
YARC-PR Comprehension 236 230 (97.5) 0 to 7 correct
Secondary Outcomes
YARC-ER Letter 236 22 (9.3) 0 to 18 correct
YARC-ER Word 236 58 (24.6) 0 to 18 correct
YARC-ER Phoneme Awareness 236 22 (9.3) 0 to 8 correct
CC2 Regular Word 236 5 (2.1) 0 correct
CC2 Irregular Word 236 4 (1.7) 0 correct
CC2 Non-Word 236 6 (2.5) 0 correct
Confounders
RAN Objects 235 6 (2.6) 106 to 140 seconds
RAN Colours 235 9 (3.8) 124 to 270 seconds
RAN Numbers 226 4 (1.8) 106 to 195 seconds
RAN Letters 228 2 (0.9) 137 to 157 seconds
CNRep (raw) 236 1 (0.4) 0 correct
For the YARC Passage Reading subscales at baseline, only six (2.5 per cent) of the students were
able to complete the minimum number of passages (two) required to calculate a standard score,
meaning 97.5 per cent of students performed at floor level. In order to ensure a reliable estimate of a
student’s reading ability, the measure requires students to complete two passages. If a student is not
able to complete the two passages if starting from the Beginner Passage, the measure’s regular
protocol is to then adminster the YARC – Early Reading if the objective is to understand a child’s
specific reading ability.
Since standard scores were not available, raw scores were used for YARC – PR Reading Accuracy
and YARC – PR Reading Comprehension at Baseline in order to include these scores in the analyses
(see Figure 3-3). The raw scores demonstrate a reasonable spread of scores; however, they also
show a floor effect with a concentration of participants scoring zero. For YARC – PR Reading Rate,
raw scores were not reported due to insufficient data. Only the second passage is timed, and only six
children were able to complete the second passage and produce a score for rate.

Evaluation Report | MiniLit 38
Figure 3-3: YARC-PR Accuracy Raw scores (left) and YARC-PR Comprehension Raw scores
(right).
Figure 3-4: YARC-ER Letter Sound Knowledge (n=237) (left) and Raw scores of those with
standard scores of 70 (n=22) (right).
Figure 3-5: YARC-ER Early Word Recognition Standard scores n=237 (left) and Raw scores of
those with standard scores of 70 (n=58) (right).
010
20
30
40
Fre
qu
en
cy
0 5 10 15 20YARC-PR Accuracy Raw Score
010
20
30
40
Fre
qu
en
cy
0 5 10 15YARC-PR Comprehension Raw Score
05
10
15
20
Fre
qu
en
cy
70 80 90 100 110 120Standard Score
01
23
Fre
qu
en
cy
0 5 10 15 20Raw score
020
40
60
Fre
qu
en
cy
70 80 90 100 110Standard Score
02
46
810
Fre
qu
en
cy
0 5 10 15 20Raw Score

Evaluation Report | MiniLit 39
Figure 3-6: Phoneme Awareness Composite scores n=237 (left) and Raw scores of those with
standard scores of 70 (n = 22) (right).
In hindsight, it seems the YARC Passage Reading measure was not an appropriate measure for the
cohort of poor readers at baseline, due to the young age of the cohort and the level of difficulty of the
task. For example, assuming a student completed the two required passages with the minimum
possible score for the Accuracy subscale, the youngest students (5.7 years) in the cohort would need
to achieve a standard score of 86 in order for a score to be calculated, and the students of mean age
(6.4 years) would need to achieve a standard score of 79. Since this cohort comprises the bottom 25
per cent of readers in Year 1, the whole cohort would be expected to score below 90, so it is not
surprising that not all students were able to complete the task. However, despite this, there was a
reasonable spread of raw scores which justified using these variables as covariates in the regression
models to calculate mean difference between the intervention and control groups at six months and 12
months.
Floor effects were apparent for the YARC Early Reading subtests with a concentration of students
achieving the minimum standard score of 70: Letter Sound Knowledge (9.3 per cent), Early Word
Recognition (24.6 per cent) and Phoneme Awareness (9.3 per cent). Raw scores for those students at
floor ranged from 0 to 18 for Letter Sound Knowledge and Early Word Recognition and from 0 to 8 for
the Phoneme Awareness composite (see Figure 3-4, 3-5 and 3-6 above). The floor effect on this
measure is not surprising given the cohort were young and poor readers for their age.
For the Rapid Automatised Naming tasks, the Children’s Test of Non-word Repetition, the Castles and
Coltheart Regular, Irregular and Non-word Reading subscales, standard scores were normally
distributed and less than 5 per cent of children performed at floor level.
3.4.2 YARC – Passage Reading at 12 months (primary outcome)
In examining the distribution of the primary outcome at 12 months, a similar pattern in terms of
Flooring effects was also shown. However, the extent to the flooring was not as large as it was at
baseline. Based on feedback from the authors of the measure, all students completed the minimum
two passages regardless of whether the met the stopping rule to enable a score to be calculated for
Reading Accuracy and Reading Comprehension.
In terms of the YARC – PR Accuracy Standard Score, there were 15 students (6.9% of cohort) who
performed at the floor, whilst the figure was 66 students (30.4% of cohort) for Reading Rate and 27
students (12.4% of cohort) for Reading Comprehension (See Figures below). These flooring effects
raise similar concerns as those present at baseline, and therefore reinforces the caveats around the
reliability of the findings.
05
10
15
20
Fre
qu
en
cy
60 80 100 120 140Standard Score
02
46
8F
req
ue
ncy
0 2 4 6 8 10Raw Score

Evaluation Report | MiniLit 40
Figure 3-7: Distribution of standard scores for YARC - PR Reading Accuracy at 12 months
Figure 3-8: Distribution of standard scores for YARC - PR Reading Rate at 12 months
Figure 3-9: Distribution of standard scores for YARC - PR Reading Comprehension at
12 months

Evaluation Report | MiniLit 41
3.5 Differences in primary outcome
3.5.1 Differences in students’ reading outcomes at 12 months (primary outcome)
At 12 months, 109 Usual Learning Support students completed the primary outcome and 108 students
in the intervention group. The analyses found that there was no evidence for a significant positive
effect between the intervention and control students on the primary outcomes of YARC – PR Reading
Accuracy, YARC – PR Reading Rate or YARC – PR Reading Comprehension, as measured at 12
months. Compared to the control students, those who received MiniLit had a standard score on
reading comprehension which was 0.48 points lower (95 per cent CI -3.51 to 2.58), equating to an
effect size of -0.04. Compared to the control students, those who received MiniLit had a standard
score on reading accuracy which was 1.36 points higher (95 per cent CI -.85 to 3.56), equating to an
effect size of .13. Compared to the control students, those who received MiniLit had a standard score
on reading rate which was .72 points higher (95 per cent CI -2.12 to 3.56), equating to an effect size of
.06 (see Table 3-3 below). These findings were consistent in the sensitivity analyses (see Figure 3-11
below and Appendix Table C2), which included adjusting for age, SES, gender, baseline score,
CNREP and RAN performance at baseline. No significant difference was found between the
intervention group and the control group in the primary outcome variables in either the primary
analysis or the sensitivity analysis.
Table 3-3: Primary outcome analysis at 12 months adjusted for baseline score, account for
school cluster.
Intervention n = 108
Mean (SD)
Control n = 109
Mean (SD)
Mean difference
(I – C)
95% CI p-value
Effect size
Effect size
95% CI
YARC - Passage Reading
Reading Accuracy 89.08 (10.54)
89.45 (12.62)
1.36 -0.85 to 3.56
0.23 0.13 -0.08 to 0.33
Reading Rate 81.31 (11.02)
87.2 (10.42)
0.72 -2.12 to 3.56
0.62 0.06 -0.19 to 0.32
Reading Comprehension 90.1 (12.4)
89.5 (12.6)
-0.47 -3.51 to 2.58
0.76 -0.04 -0.28 to 0.21

Evaluation Report | MiniLit 42
Figure 3-10: Forest plot of primary outcome, YARC-PR effect size, at 12 months.
Figure 3-11: Sensitivity analysis - Forest plot of primary outcome, YARC-PR effect size,
at 12 months.

Evaluation Report | MiniLit 43
3.6 Differences in secondary outcomes
3.6.1 Secondary outcomes at six months
At six months, 107 Usual Learning Support students completed the secondary outcomes and 107
intervention students. Compared to the Usual Learning Support group, there was evidence that the
intervention group performed better on reading Accuracy (as measured by the YARC – PR) (see
Table 3-4). Compared to the control group, the intervention group scored 2.12 points higher (95 per
cent CI 0.05 to 4.4) on Accuracy, equating to an effect size of 0.2. Compared to the control group, the
intervention group also performed better on decoding non-words and regular words (as measured by
the CC2) and Phoneme Awareness and Letter Sound Knowledge (as measured by the YARC – ER)
(Figure 3-12). In these outcomes, the effect size ranged from 0.33 for regular word reading to 0.81 for
Letter sound Knowledge. There was no evidence of a difference between the two groups in the other
secondary outcomes measured at six months. Similar patterns of evidence were also seen in the
sensitivity analyses (Figure 3-13).
Table 3-4: Secondary outcome analysis at six months, adjusted for baseline score, taking
cluster (school) into account.
Intervention n = 108
Mean (SD)
Control n = 109
Mean (SD)
Mean difference
(I – C)
95% CI
p-value
Effect size
Effect size
95% CI
YARC - Passage Reading
Reading Accuracy 89.94 (11.42)
87.07 (10.29)
2.12 0.05 to 4.4
0.045 0.20 0.00 to 0.40
Reading Rate 78.76 (8.91)
78.42 (9.61)
0.27 -2.06 to 2.60
0.82 0.03 -0.22 to 0.28
Reading Comprehension 85.05 (13.62)
83.7 (12.76)
0.02 -3.12 to 3.17
0.99 0.00 -0.24 to 0.24
YARC – Early Reading
Letter Sound Knowledge 109.47 (15.16)
95.93 (14.24)
13.03 9.75 to 16.31
<0.001 0.81 0.60 to 1.01
Early Word Recognition 84.94 (11.85)
84.4 (13.23)
0.56 -1.42 to 2.54
0.58 0.05 -0.11 to 0.20
Phoneme Awareness 96.23 (12.47)
91.59 (12.58)
4.59 1.89 to 7.30
0.001 0.37 0.15 to 0.58
Castles & Coltheart - 2
Regular Word Reading -0.36 (0.97)
-0.7 (0.84)
0.30 0.10 to 0.50
0.003 0.33 0.11 to 0.55
Irregular Word Reading -0.77 (0.8)
-0.71 (0.9)
-0.08 -0.28 to 0.12
0.45 -0.09 -0.32 to 0.14
Non-word Reading 0.01 (0.94)
-0.52 (0.76)
0.47 0.26 to 0.68
<0.001 0.52 0.29 to 0.75
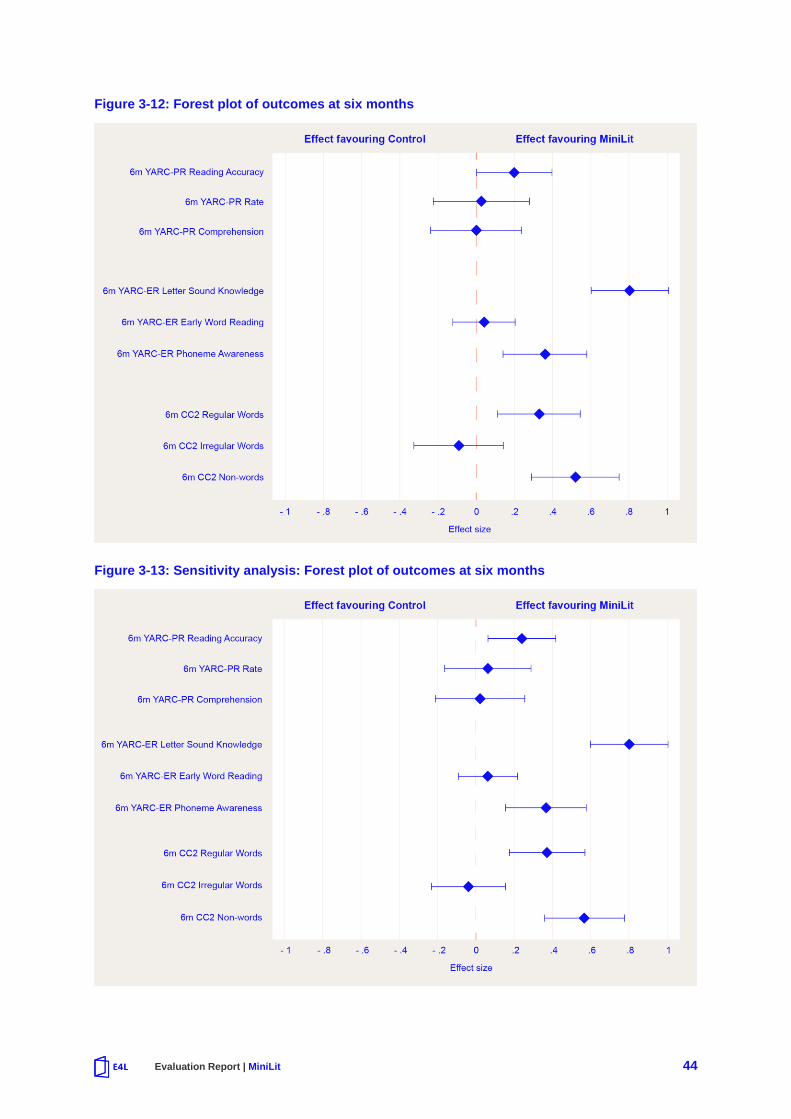
Evaluation Report | MiniLit 44
Figure 3-12: Forest plot of outcomes at six months
Figure 3-13: Sensitivity analysis: Forest plot of outcomes at six months

Evaluation Report | MiniLit 45
3.6.2 Secondary outcomes at 12 months
At 12 months, the effect sizes observed at six months attenuated (see Table 3-5). Although four of the
six secondary outcomes were positive, there was only evidence for better Letter Sound Knowledge in
the intervention students when compared to Usual Learning Support (Figure 3-14 below). Compared
to the Usual Learning Support group, the intervention group scored 7.4 points higher (95 per cent CI
4.1 – 10.8, p=0.01) on Letter Sound Knowledge, equating to an effect size of 0.51, or six months'
additional progress. There were no differences in other secondary outcomes at 12 months. In
sensitivity analyses, there was additional evidence that intervention students performed better on non-
word decoding (Figure 3-15).
Table 3-5: Secondary outcome analysis at 12 months, adjusted for baseline score, accounting
for cluster (school).
Intervention n = 108
Mean (SD)
Control n = 109
Mean (SD)
Mean difference
(I – C)
95% CI
p-value
Effect size
Effect size
95% CI
YARC – Early Reading
Letter Sound Knowledge 101.91 (14.62)
80.57 (11.41)
7.43 4.08 to 10.78
<0.001 0.51 0.28 to 0.73
Early Word Recognition 82.34 (11.04)
93.85 (13.74)
-0.97 -3.26 to 1.33
0.41 -0.08 -0.27 to 0.11
Phoneme Awareness 94.6 (13.33)
83.32 (13.07)
2.67 -0.13 to 0.47
0.06 0.21 -0.01 to 0.44
Castles & Coltheart - 2
Regular Word Reading -0.66 (0.9)
91.65 (11.51)
0.16 -0.06 to 0.37
0.15 0.17 -0.06 to 0.40
Irregular Word Reading -0.89 (0.81)
-0.85 (0.92)
-0.11 -0.33 to 0.10
0.30 -0.12 -0.35 to 0.11
Non-word Reading -0.49 (0.97)
-0.79 (1.05)
0.21 -0.02 to 0.43
0.06 0.22 -0.02 to 0.46

Evaluation Report | MiniLit 46
Figure 3-14: Forest plot of secondary outcomes at 12 months
Figure 3-15: Sensitivity analysis - Forest plot of secondary outcomes at 12 months.

Evaluation Report | MiniLit 47
3.7 Compliance
Overall, the compliance to the criteria of students attending at least 80 per cent of MiniLit lessons over
the 20-week intervention period is shown below (see Table 3-6). This equates to the intervention being
delivered at least 4 days per week, which is the recommended frequency proposed by MultiLit.
Overall, 54.6 per cent of students met this threshold for compliance, where it was proposed they would
receive the maximum benefit from MiniLit. It is important to note that the mean attendance was 79
lessons and standard deviation of 1.5 lessons. This equates to an average weekly attendance of 3.95
lessons. The influence of compliance on student outcomes are presented in the following sections.
Therefore, a large number of students did not meet the compliance threshold because they missed 1-
2 days of the intervention out of the possible 100 days. The influence of compliance threshold on
student outcomes are presented in the following sections.
Table 3-6: Compliance
Percentage lessons received
Average number of weekly lessons of the 20-week
intervention period
Compliance
Intervention group Control group
N % N %
>80% At least 4 days 65 54.6 --
60-80% At least 3 days 38 31.9 -
40-60% At least 2 days 2 1.7 -
20-40% At least 1 day 8 6.7 -
<20% Less than 1 day 6 4.2 -
Total 119 100 118 100
3.7.1 Primary outcomes at 12 months
The Complier Average Causal Effect (CACE) analyses, which compared the average outcome of the
compliers in the treatment arm with the would-be compliers in the control arm, found no evidence of a
difference between groups in the three primary outcomes (see Table 3-7 and Figure 3-16). Compared
to the would-be compliers in the control arm, those compliers who received MiniLit had a standard
score on reading comprehension which was -0.83 points lower (95 per cent CI -5.48 to 3.81), equating
to an effect size of -0.07. Compared to the control students, those who received MiniLit had a
standard score on reading accuracy which was 2.42 points higher (95 per cent CI -.21 to 5.05),
equating to an effect size of 0.23. Compared to the control students, those who received MiniLit had a
standard score on reading rate which was 1.29 points higher (95 per cent CI -1.64 to 4.21), equating
to an effect size of 0.12.
In the adjusted model with baseline confounders taken into account, the MiniLit group had better
reading accuracy scores (Figure 3-17). Compared to the control students, those who received MiniLit
had a standard score on reading accuracy which was 3.28 points higher (95 per cent CI 0.27 to 6.30)
with an effect size of 0.31. This overall pattern aligns with the intention-to-treat analyses, with the
exception of the finding of a difference in reading accuracy scores in the adjusted analysis. This
difference provides weak support for a difference between groups on reading Accuracy, given no
differences were found in the main CACE analysis. It is important to note again here the significant
limitations in the interpretation of the YARC-PR measure in this study.
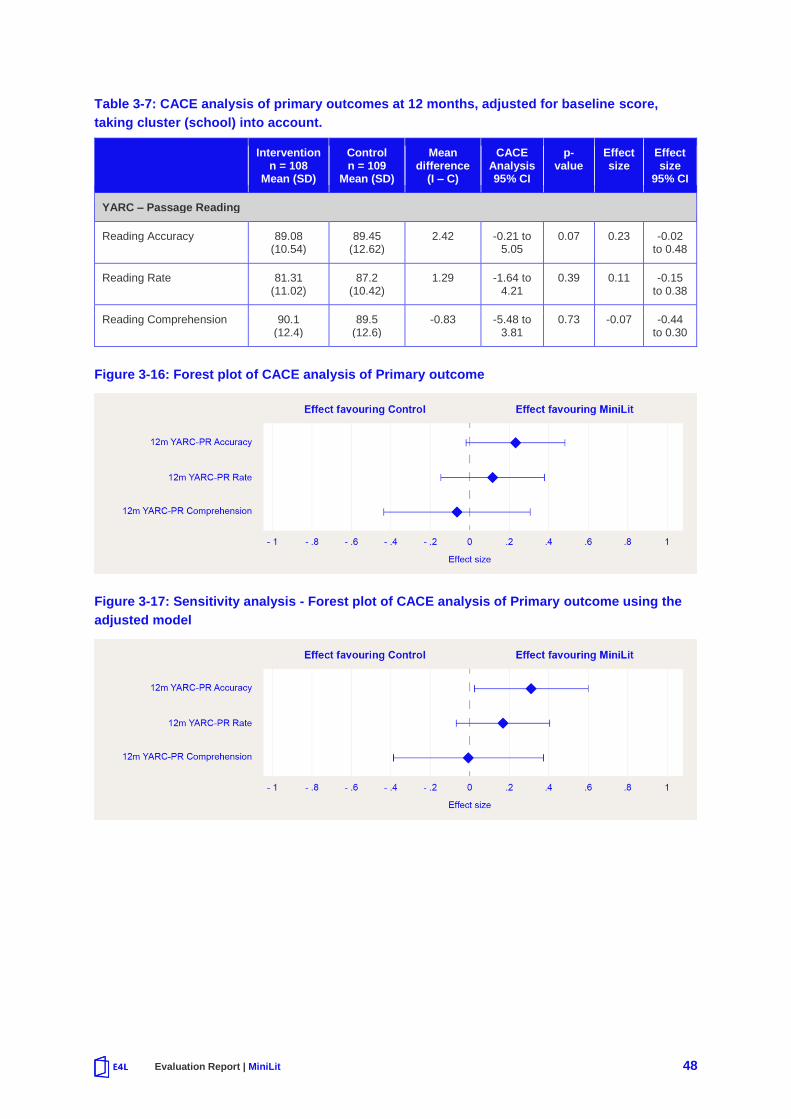
Evaluation Report | MiniLit 48
Table 3-7: CACE analysis of primary outcomes at 12 months, adjusted for baseline score,
taking cluster (school) into account.
Intervention n = 108
Mean (SD)
Control n = 109
Mean (SD)
Mean difference
(I – C)
CACE Analysis 95% CI
p-value
Effect size
Effect size
95% CI
YARC – Passage Reading
Reading Accuracy 89.08 (10.54)
89.45 (12.62)
2.42 -0.21 to 5.05
0.07 0.23 -0.02 to 0.48
Reading Rate 81.31 (11.02)
87.2 (10.42)
1.29 -1.64 to 4.21
0.39 0.11 -0.15 to 0.38
Reading Comprehension 90.1 (12.4)
89.5 (12.6)
-0.83 -5.48 to 3.81
0.73 -0.07 -0.44 to 0.30
Figure 3-16: Forest plot of CACE analysis of Primary outcome
Figure 3-17: Sensitivity analysis - Forest plot of CACE analysis of Primary outcome using the
adjusted model

Evaluation Report | MiniLit 49
3.7.2 Secondary outcomes
In terms of secondary outcomes at six months, CACE analysis found better scores in the intervention
group, compared to the control group, in Reading Accuracy (measured by the YARC – PR), Non-word
and Regular Word decoding (measured by CC2) and Phoneme Awareness and Letter sound
Knowledge (measured by YARC – ER) (see Table 3-8 below). The effect sizes range from 0.36 for
Reading Accuracy to 1.44 for Letter Sound Knowledge (Figure 3-18 below). In further sensitivity
analysis which adjusts for confounders, the same pattern was found (Figure 3-19 below) with similar
effect sizes.
Table 3-8: CACE analysis of secondary outcomes at six months, adjusted for baseline score,
taking cluster (school) into account
Six-month outcomes Intervention n = 107
Mean (SD)
Control n = 107
Mean (SD)
Mean difference
(I – C)
CACE Analysis 95% CI
p-value
Effect size
Effect size
95% CI
YARC – Passage Reading
Reading Accuracy 89.94 (11.42)
87.07 (10.29)
3.93 1.98 to 5.87
0.00 0.36 0.18 to 0.54
Reading Rate 78.76 (8.91)
78.42 (9.61)
0.49 -1.85 to 2.83
0.68 0.05 -0.20 to 0.31
Reading Comprehension 85.05 (13.62)
83.7 (12.76)
0.04 -8.11 to 8.20
0.99 0.00 -0.62 to 0.62
YARC – Early Reading
Letter Sound Knowledge 109.47 (15.16)
95.93 (14.24)
23.27 18.52 to 28.01
0.00 1.44 1.15 to 1.73
Early Word Recognition 84.94 (11.85)
84.4 (13.23)
1.00 -1.46 to 3.46
0.43 0.08 -0.12 to 0.28
Phoneme Awareness 96.23 (12.47)
91.59 (12.58)
8.20 2.41 to 13.99
0.01 0.65 0.19 to 1.10
Castles & Coltheart - 2
Regular Word Reading -0.36 (0.97)
-0.7 (0.84)
0.54 0.30 to 0.79
0.00 0.59 0.33 to 0.85
Irregular Word Reading -0.77 (0.8)
-0.71 (0.9)
-0.14 -0.45 to 0.17
0.39 -0.16 -0.52 to 0.20
Non-word Reading 0.01 (0.94)
-0.52 (0.76)
0.84 0.66 to 1.02
0.00 0.93 0.73 to 1.13

Evaluation Report | MiniLit 50
Figure 3-18: Forest plot of CACE Analysis of Secondary outcomes at six months
Figure 3 19: Sensitivity analysis - Forest plot of CACE Analysis of Secondary outcomes at six
months using the adjusted model

Evaluation Report | MiniLit 51
In terms of secondary outcomes at 12 months, CACE analyses found better scores in the intervention
group, compared to the control group, in Non-word and Regular Word decoding (measured by CC2)
and Phoneme Awareness and Letter Sound Knowledge (measured by the CC2) (see Table 3-9). The
effect sizes ranged from 0.31 for Regular Word decoding to 0.90 for Letter Sound Knowledge (Figure
3-20. In further sensitivity analyses adjusting for confounders, a similar pattern of evidence was
evident (Figure 3-21). Tables for both these sensitivity analyses are available in Appendix C5 and C6.
Table 3-9: Sensitivity analysis (CACE analysis) of secondary outcomes at 12 months, adjusted
for baseline score, taking cluster (school) into account
12-months outcomes Intervention n = 108
Mean (SD)
Control n = 109
Mean (SD)
Mean difference
(I – C)
CACE Analysis 95% CI
p-value
Effect size
Effect size
95% CI
YARC – Early Reading
Letter Sound Knowledge 101.91 (14.62)
80.57 (11.41)
13.27 6.10 to 20.43
0.00 0.90 0.41 to 1.39
Early Word Recognition 82.34 (11.04)
93.85 (13.74)
-1.72 -6.05 to 2.60
0.44 -0.14 -0.50 to 0.22
Phoneme Awareness 94.6 (13.33)
83.32 (13.07)
4.77 1.25 to 8.29
0.01 0.38 0.10 to 0.66
Castles & Coltheart - 2
Regular Word Reading -0.66 (0.9)
91.65 (11.51)
0.28 0.11 to 0.45
0.00 0.31 0.12 to 0.49
Irregular Word Reading -0.89 (0.81)
-0.85 (0.92)
-0.20 -0.43 to 0.02
0.08 -0.22 -0.46 to 0.02
Non-word Reading -0.49 (0.97)
-0.79 (1.05)
0.37 0.20 to 0.54
0.00 0.40 0.22 to 0.58

Evaluation Report | MiniLit 52
Figure 3-20: Forest plot of CACE Analysis of Secondary outcomes at 12 months
Figure 3-21: Sensitivity analysis - Forest plot of CACE Analysis of Secondary outcomes at 12
months using the adjusted model

Evaluation Report | MiniLit 53
3.8 Summary of impact evaluation findings
Overall, findings did not show strong statistical evidence that students who received the MiniLit
program performed better on the YARC – PR subscales of Accuracy, Rate and Comprehension at 12
months post-randomisation compared to those who received usual practice. However, the trial also
revealed that this measure is not appropriate for this cohort of students and therefore these results
must be considered with caution.
On the secondary outcomes focused on early reading skills, there was statistical evidence of
improvements in outcomes at six months post-randomisation, with some sustaining to 12 months.
Compliance Analyses suggest that students who attended 80 per cent of lessons throughout the
intervention had better secondary outcomes as well as on the primary outcome of YARC – PR
Reading Accuracy, especially when considering baseline confounders.

Evaluation Report | MiniLit 54
4 Costs associated with MiniLit delivery
A cost-effectiveness analysis was not conducted as there were no differences in the
primary outcome at 12 months post-randomisation. Only the costs of delivering the
intervention are presented.
Overall, the following figures were used to calculate the costs of the intervention. The following costs
relate to a school wishing to set MiniLit up ‘from scratch’. They relate to:
• The initial costs (not the recurrent ones) which includes one teacher being trained and assumed
coaching support (for about two people) for an initial two-term period.
• The prices for the professional development workshop and the MiniLit kit, consumables and
MiniLit readers related to 2019 prices.
• The consumables in the costing below are sufficient for 10 students (at least two groups).
• Staff costs for teaching time delivering the intervention.
Additional training, kits and consumables (student books and testing and record forms for the teacher)
can be added.
The costs for the training and materials are listed here:
https://multilit.com/wp-content/uploads/Product-Order-Form-Australia.pdf
The costs for staff time are listed here:
http://www.ircgazette.justice.nsw.gov.au/irc/ircgazette.nsf/webviewdate/C8477

Evaluation Report | MiniLit 55
4.1 Cost of purchasing the MiniLit program
The estimate is based on the intervention continuing at a school over a three-year period to reflect the
typical training and delivery for the MiniLit program. The estimated breakdown of costs for MiniLit
tutor training and delivery was:
Table 4-1: Cost breakdown of MiniLit program
Items Costs
MiniLit training and Kit
Two day profession development training per teacher $1055
One MiniLit kit (includes one set of student books and record form) $1720
MiniLit story book cards $99
Staff time to attend training was $25.88 per hour (15hrs total), assuming they have 2 years’ experience $388.20
Total core costs $3262.20
Supporting MiniLit materials (essential)
Initialit Readers (Level 1 – 16, Foundation and Year 1) $3060
Other decodables and books for the text reading (schools may already have these in the school library) $1800
Storybooks (about 30, schools may already have some of these) $500
Total cost of support materials $5360
Staff time for delivery
Estimated at 1 hour per day delivery, 15 minutes preparation. At the hourly rate of $25.88, this equates to $32.35 per day. Since students are withdrawn from class into a small group lesson with another teacher, the staff time is additional to usual teaching costs.
$2588 per group of
4 students
Once established, the recurrent cost of MiniLit in terms of consumables per student is $72 for
the student books and testing and record books (available in sets of five for Level 1 and 2 at $158 per
set for each level) and testing and record books (for the teacher – one required per group at Level 1
and 2 at $28 each) if these are purchased by the school. These costs relates to the student, so the
annual recurrent cost is dependent on how many students are provided with MiniLit by the school
each year. For additional groups of four students with the same teacher, the additional costs would be
$288 per group or $72 per student.
Therefore, for a single group of four students at a school, the initial costs are $3262.20 + $5360 +
$2588 = $11,210.20. This includes all staff time for training and delivery, and all required resources.
Examining the cost per student, this equates to $2,802.55 per student. In this study, the number of
intervention students at each school ranged from four to 24.
However, the costs per student depends on the number of groups run at the school and the number of
teachers required to deliver the MiniLit (i.e. two teachers for one group each or one teacher running
two groups). These variations are likely to change the costs, but it should be noted that initial costs will
decrease over time as trained MiniLit tutors do not require additional training once they have been
trained to deliver MiniLit. Therefore, the presented estimated costs are the maximum cost, and
represent the initial cost incurred by schools for delivering MiniLit to 4 students for two terms. The
marginal cost for additional students will be lower. Most schools already employ staff to deliver
additional reading support, and their time could be directed to delivering this intervention.

Evaluation Report | MiniLit 56
As an option, schools implementing MiniLit outside of this trial can opt for additional coaching support
to enable MiniLit tutors to reach implementation fidelity. This coaching component is $3600 + GST,
which equates to $94.74 per hour for 38 hours of support per school. This involves observations,
feedback, email communications, and phone support. This includes travel within Sydney metropolitan
area. (For other capital cities, regional and country locations additional travel costs/arrangements may
be applicable.)
Table 4-2: Cumulative costs over first three years
Year 1 Year 2 Year 3
MiniLit $11,210.20 $72 per student, depending on number of students
$72 per student, depending on number of students
Table 4-3: Start-up and running costs per student
Cost Cost per student ($)
Start-up cost $2155.55
Running costs per year $647, assuming 1 group of 4 students
Total cost in first year $2802.55

Evaluation Report | MiniLit 57
5 Process evaluation methods
This process evaluation was embedded within the efficacy randomised controlled trial
(RCT) of the MiniLit intervention in nine primary schools in New South Wales. The
recruitment process for the RCT has been previously described.
5.1 Development of the program logic and measurement framework workshop
Following a development process with MiniLit developers and participating schools, the process
evaluation made use of existing program data, standardised instruments, and specially developed
tools to determine the impact of implementation factors on the outcomes observed in the MiniLit
students.
To determine the types of data required for the process evaluation, a workshop was held with MiniLit
program developers prior to the study. This workshop, conducted in January 2017, focused on the
program’s theory of change and the stakeholders’ perceptions of key implementation factors, some of
which could influence MiniLit’s effectiveness. Case studies of exemplar schools also informed the
types and methods of data collection to be used. Following the workshop discussions, a measurement
framework was established, which informed the development of the measurement tools used in the
process evaluation.
In February 2017, two members of the process evaluation team visited four exemplar schools to
further refine the data collection tools and the measurement framework. These schools were
purposively sampled and nominated by MultiLit staff as 'exemplars' in terms of program
implementation and student outcomes. The aim of the visits to the exemplar schools was to better
understand how different schools implemented the MiniLit program and to inform the design of the
process evaluation and its data collection instruments. Visits comprised of: (i) semi-structured
interviews with staff directly involved in the program’s delivery (e.g. MiniLit Tutors) and those involved
in the program’s implementation less directly (e.g. Principals), and (ii) observations of MiniLit sessions.
The interviews, which lasted approximately 30 minutes each, captured participant perceptions of (i)
the MiniLit program, (ii) student outcomes and engagement, (iii) program implementation, and (iv)
program fidelity.
At least one entire MiniLit session at each school was observed to further understand the
implementation of the intervention. The measures developed by the evaluation team were piloted
during these exemplar school visits to enable further adaptations before the primary process
evaluation was conducted. Neither the data from the January 2017 workshop or the participant
interviews are presented in this report, as the primary purpose of these activities was to refine the
program logic and develop standardised assessment tools for use in the process evaluation.

Evaluation Report | MiniLit 58
5.2 Process evaluation participants and data collection
5.2.1 MiniLit students’ data collection
Student data was collected for the 119 students participating in the MiniLit intervention at three time
points. These time points occurred at initial implementation, mid-implementation and end
implementation. At each time point, a trained research assistant observed the students participating in
a MiniLit lesson and completed a survey with each student. The survey aimed to understand each
student’s experience with the MiniLit program, as well as their enjoyment of reading.
5.2.2 MiniLit tutors’ data collection
Across the nine schools, a total of 34 tutors delivered the program. Tutor data was collected via
observations of MiniLit lessons, provision of program data (i.e. student attendance), and two surveys.
The first survey was undertaken within the first fortnight of program implementation, while the second
was undertaken in the final fortnight of implementation.
Based on participant feedback regarding the first survey, the second round of surveys was shortened
and mailed to participants. The number of items in these surveys was also reduced, so while the initial
survey took approximately 30 minutes for participants to complete, the second survey took
approximately five minutes. Survey data obtained from 23 MiniLit tutors was included in the analysis
(67 per cent). Of these, 17 (73 per cent) had completed the initial survey, 20 (87 per cent) had
completed the second survey and 14 (60 per cent) had completed both. Only one of the respondents
was male.
In addition, all MiniLit tutors received coaching support from MiniLit to assist them to implement the
intervention. This involved initial feedback, three MiniLit class observations, and detailed coaching
reports over the first 12 weeks of the MiniLit delivery period. Overall, 21 coaching reports were
provided to the MiniLit tutors, with most tutors receiving two incidences of coaching support. Only
coaching reports for the initial observation are available to be used for this evaluation. Therefore, all
feedback should be considered as initial support required for teachers new to implementing MiniLit.
5.2.3 Usual Year 1 classroom teachers data collection
All 35 classroom teachers were invited to participate in a short questionnaire and in classroom
observations so that the evaluation team could better understand ‘practice as usual’. These ‘standard-
practice’ classes were observed as a way to understand the experiences and activities of the control
group, as well as the experiences of the MiniLit students when they were not involved in program
activities. These observations were quantified using a standardised checklist containing 35 items.
Observations lasted about 30 minutes per class. The collected data related to:
• The theoretical approach used to teach reading (e.g. ‘phonics-based approach’, ‘Look and Say’
approach).
• Whether a particular instructional program was used.
• What teaching resources were utilized.
• A description of the classroom environment in relation to behavioural management approach and
organization.
• Student engagement, and
• Teacher engagement.

Evaluation Report | MiniLit 59
To contextualise these observations, teachers were asked to comment on whether the observed
lesson reflected a typical literacy lesson and, importantly, whether this was reflective of the approach
to literacy instruction within their school more generally. Eighteen classroom teachers (52 per cent)
were observed giving standard literacy instruction, and six completed a short survey on their
teaching practices.
5.2.4 Implementation measurement domains
The process evaluation used data collected from a number of sources including (i) MiniLit student
progress tracking data; (ii) MiniLit coaching reports to MiniLit tutors, (iii) surveys of students, MiniLit
tutors, and classroom teachers, and (iv) objective standardised primary and secondary measures from
the impact evaluation. These data were collected during the process evaluation at three time-points:
start of program, mid-point, and end of program. By directly integrating the process evaluation and
objective standardised measures from the impact evaluation, the study was uniquely able to identify
the direct link between changes in implementation with observed changes in outcome measures. The
measures were specifically chosen to enable a detailed understanding of the intervention’s ability to
influence the theory of change, but also to identify the implementation and contextual factors which
are associated with the intervention’s outcomes. The overall domains measured for the process
evaluation are presented in Table 5-1.
Table 5-1: Process evaluation domains
Start of program Mid-point End of program
Intervention
Implementation fidelity O O O
MiniLit Class Quality O O O
Dosage P P P
Usual Learning Support group
Coaching support P
Classroom teacher literacy practice O O O
O = MiniLit Observation, M = MiniLit Tutor, P = Program Data
For each domain, the average scores across multiple items were used to establish the construct. This
approach helps to achieve optimal reliability, reduce the requirements on sample sizes, avoid violation
of normality assumptions, and obtain better model-data fit. The variables used for each of the
implementation variables created below aligned with the proposed model of implementation, which
was developed before any data was collected.

Evaluation Report | MiniLit 60
5.2.5 Implementation fidelity
MiniLit implementation fidelity, which can also be referred to as program fidelity, was measured via 60-
minute observations of MiniLit lessons by a trained research assistant. Observations occurred at three
separate time points across the program’s implementation: (i) at program commencement (first two
weeks), (ii) at midpoint (about week 10), and (iii) at the end (about week 20). A standardised
observation sheet was used for each observation to ensure consistency. To ensure inter-rater
reliability, each of the researchers undertook a minimum two-hour training session with the checklist
and observed their first session with a more experienced team member.
MiniLit lesson observations sheets were modelled on observation checklists used by MultiLit, with
other items added to address the evaluation questions and aims. In total there were 80 items in the
instrument. Five of the items were open-ended long answer responses, while the remaining items
used a Likert scale or numerical scale.
Overall, implementation fidelity was measured using observation items which examined (i)
implementation of story reading, (ii) sounds and words reading, (iii) text reading, and (iv) the degree to
which the MiniLit tutors followed the program’s scripts and instructions.
5.2.6 MiniLit group quality
MiniLit group quality was defined as the conditions in which the MiniLit group was conducted within the
schools. This was also assessed during the three observations at the time points detailed above.
MiniLit group quality was measured by observation items which examined (i) student engagement
during the lesson, (ii) quality of the classroom environment, (iii) use of positive behaviour strategies by
the MiniLit teacher, and (iv) class quality.
5.2.7 Degree of implementation (dosage)
Dosage was measured using attendance data collected by the tutors. The number of lessons received
was reported as a percentage based on the number of days attended by each student compared to
the total possible days of attendance. The number of expected days excluded student free days,
holidays and scheduled student events which prevented the intervention from being delivered (i.e.
school sports days, class excursions).
In addition, for each lesson, MiniLit tutors recorded the specific aspects delivered. This included the (i)
specific lesson number, (ii) if students passed the lesson, (iii) sight words used as part of the sounds
and words activities, (iv) reader used for text reading, (v) book used in story book reading, (vi) the
session number, and (vii) overall lesson comments.
Evaluation Report | MiniLit 61
5.3 Data analysis
5.3.1 Path analysis
The purpose of the process evaluation was to examine the extent to which implementation factors
were associated with the outcomes observed for students in the MiniLit group. Path Analysis was used
to explore the relationship between the implementation factors with the outcomes which had
significant differences between the intervention and controls. Model fit was assessed with RMSEA and
CFI scores and interpreted using common thresholds of good fit (RMSEA,<0.05; CFI>0.95). All
required assumptions were checked and withheld.
Where required, descriptive analyses are presented using means and SD and proportions.
5.3.2 Qualitative analysis
For the qualitative analyses, a coding framework, taking an ontological approach, was established to
understand the themes within the defined areas related to MiniLit’s implementation and sustainability.
This drew upon the open-ended responses within the MiniLit tutor surveys and the coaching reports
provided to MiniLit tutors by the MiniLit coach.

Evaluation Report | MiniLit 62
6 Process evaluation findings
6.1 The association between process evaluation factors with the outcomes at six and 12 months
The primary process evaluation model is presented in Figure 6.1.
Both MiniLit class quality and degree of implementation were removed from the final model to improve
model fit (Figure 6-1). The final model fit was χ2(6) = 127.95, CFI = 1, TLI = 1, RMSEA = 0.00, SRMR
= 0.00. Quality of MiniLit implementation was removed as it had a high correlation with implementation
fidelity (0.55) but was not associated with any unique pathways (both <0.05). Degree of
implementation (i.e. dosage) was removed because it had low level of variance between the students,
as the majority of students received over 75 per cent of their possible lessons. The mean number of
lessons received was 79 lessons, out of a possible 100. However, according to the compliance
criteria, 54 per cent met minimum 80 per cent attendance threshold (i.e. at least 4 days per week) out
of the possible 100 school days during the 20 weeks. It is important to note that the compliance criteria
also included that all students will be delivered all three components of the MiniLit program each day,
which was met for all students. This suggests that it is possible to deliver all components of the
program, but the frequency of classes schools implementing the intervention needs careful
consideration.
The path analyses found strong statistical evidence that higher implementation fidelity was associated
with better scores on the YARC – PR Reading Rate (standardised coefficient 0.20, p<0.05), but not for
Accuracy or Comprehension. That is, students who received all three components of the MiniLit
program each lesson were associated with better reading rate scores at 12 months. This finding has
the aforementioned caveats about the security of the YARC-PR data in this study.
Figure 6-1: Direct pathway relationship between implementation fidelity and 12Mth
primary outcomes
Further analyses examined whether implementation fidelity was associated with the YARC – Passage
Reading outcomes through changes in the secondary outcomes measured at six months. This
approach aligns with MiniLit’s theory of change, whereby the intervention directly aims to improve
students’ early reading skills to enable them to progress as readers by exhibiting skills in their
accuracy, speed and comprehension. Therefore, it was expected that changes in the secondary
outcomes would be associated with changes in the primary outcome.

Evaluation Report | MiniLit 63
In this model, only six-month outcomes that had strong statistical evidence of being different between
the MiniLit and Usual Learning Support groups were included. This was done to improve the model’s
power, but also to examine whether changes in the secondary outcomes are associated with better
outcomes at 12 months. Therefore, irregular word reading was also removed from the secondary
outcomes at six months as MiniLit does not aim to improve irregular word decoding. However,
sensitivity analyses that included irregular words did not change the overall model and did not present
any new pathways with statistical significance.
The model fit statistics were χ2(45) = 776.263, CFI = .997, TLI = .959, RMSEA = 0.075, SRMR =
0.018. As implementation fidelity increased, there was strong evidence of an association with better
Letter Sound Knowledge and Phoneme Awareness at six months post randomisation as measured by
the YARC – Early Reading and Non-Word Reading as measured by the CC-2. There was no
association with Regular Word Reading as measured by the CC2. In turn, higher Phoneme
Awareness scores and Regular Word Reading at six months were both associated with better reading
accuracy at 12 months. Increased Non-word Reading at six months had strong evidence for being
associated with better reading Rate and Comprehension scores at 12 months. Interestingly, reading
Accuracy and Rate at 12 months were associated with each other, but both were not associated with
reading comprehension scores.
These findings demonstrate that higher implementation fidelity was associated with higher scores on
student Letter sound Knowledge, Phoneme Awareness and Non-word Reading scores at six months.
It also has strong statistical evidence that higher scores in Phoneme Awareness and Non-word
Reading at six months are related to better student reading Accuracy, Rate and Comprehension at 12
months.
Figure 6-2: Pathway relationships between implementation fidelity and six-month and
12-month outcomes
Overall, these path analyses highlight that better implementation of the MiniLit program is associated
with better scores on domains related to the intervention’s theory of change over time. The following
sections will examine the enablers and barriers to MiniLit’s implementation, as well as the key
considerations for schools when implementing MiniLit.

Evaluation Report | MiniLit 64
6.2 Enablers and barriers to implementation fidelity of each specific MiniLit activity
Overall, the observations indicated that the MiniLit tutors were implementing the program with a high
degree of fidelity across the three observations. Fidelity was measured in relation to the three program
components (sounds and words activities, text reading and storybook reading) and how frequently the
tutors followed the program’s scripts and instructions as intended. However, the coaching reports
suggested that MiniLit teachers needed support at the start of the program’s implementation to deliver
specific attributes. This was expected, as the MiniLit tutors were implementing MiniLit for the first time,
and most had implemented a different literacy intervention before the commencement of this study.
Therefore, the feedback provided to the MiniLit teachers reflects the early stages of implementation.
The findings from the coaching reports are described in more detail in the section below.
The themes of the coaching reports focused on each of the three distinct lesson areas, with thematic
codes examining the general overview of the activity and areas of improvement. These themes
highlight the areas of support which new teachers implementing MiniLit may need to ensure they can
deliver the intervention to a high fidelity.
6.2.1 Sounds and Words activities
For Sounds and Words, error correction was a key attribute for which MiniLit tutors needed coaching.
The error correction method prescribed in the MiniLit intervention is the Model/Lead/Test approach. In
this approach, the teacher models or demonstrates the targeted skill, then the teacher and student
perform the skill together, and finally, the student performs the skill independently. Given the
importance of effective, immediate and corrective feedback to enable students to learn and
consolidate new skills, MiniLit tutors need to be able to correctly provide feedback to students when
they make an error, but also to learn how the correct response can be achieved to avoid the student
guessing the correct responses. Quotes from coaching feedback are presented below.
“always stick to the scripted procedure – using Model/Lead/Test; this not only takes out the
guesswork for the students, but also helps to avoid the practising of errors; it also is the most
efficient way to correct errors”
“correcting errors using the Model/Lead/Test procedure, as it is the quickest way of correcting and
prevents learning of errors – always refer to the scripted error correction procedure at the bottom
of every activity if student/s make an error or sight words – simply provide the correct word, don’t
encourage sounding out/guessing”
It is also important to note that all the MiniLit tutors perceived that the Sounds and Words activities
were the component of MiniLit which had the most impact on their students’ reading out of all three
MiniLit activities.
“This is the most important component as it teaches the child to identify the sound, orally blend it
and they hear and see the word built there and then also segmenting, practicing writing words and
sentences, etc.”
“Children need to understand letter/sounds + encourages automatic recognition which assist with
text/reading”
This highlights the tutors’ awareness that segmenting, blending and decoding words is an important
foundational skill, and that students with reading difficulties require specific support to develop this
skill. This is further supported in the impact findings, in which the MiniLit group demonstrated better

Evaluation Report | MiniLit 65
decoding, Phoneme Awareness, and Letter Sound Knowledge scores than the Usual Learning
Support group.
6.2.2 Text Reading
For Text Reading, the most common feedback was related to (i) how the MiniLit tutor modelled
reading, and (ii) ensuring students were asked to read sentences in a random order, thus encouraging
other students to follow along. In terms of modelling reading, the most common feedback was that
MiniLit tutors were not modelling sufficiently fluent and expressive reading for the students. This is
particularly important as appropriate modelling of fluent reading is a known factor that supports
students to build their own reading fluency.(26) By modelling this behaviour, students learn how to
express these attributes themselves.
“modelling fluent and expressive reading every few pages (or perhaps by re-reading the book at
the end, after the students have read it, and while they follow along”
Another important aspect is asking students in a random order to read out loud which encourages
them to follow the text, even when they are not the one being asked to read out loud. This promotes
students to follow the text.
“ensuring students read in a random order (i.e. they won’t know when it will be their turn so they
always need to be following along)”
“ensuring students read a few sentences each, in a random order, so that they won’t know when it
is their turn to read (helps to keep everyone on task for the whole text)”
As this activity focuses on improving reading fluency, it is important that students are able to follow
along with the text, but to also be engaged in the text itself. Therefore, if students are not reading in a
random order, nor encouraged to follow along with the reading, the benefit for their development of
reading fluency may decrease.
6.2.3 Story Book Reading
For Story Book Reading, the most common feedback from the coaches to MiniLit tutors was about
adhering to the story card and instructions. This activity enables students to apply their learnings from
the Sounds and Words activities to increase their vocabulary and to comprehend written text.
However, the MiniLit tutors were often not asking students all the questions provided.
“try to ask all the scripted comprehension and vocabulary questions on the Story Card (these have
been carefully chosen to make sure they include a range of literal, inferential, evaluative and
vocabulary-focused questions, so it is important to try to ask all the questions)”
“ensuring all the students at least say the target vocabulary word, if you don’t have time for them
to all do a sentence – hearing the word in their own voice will help with later word recall”
This component enables students to develop and consolidate their reading accuracy and
comprehension skills and curtailing it is likely to lessen the intervention’s impact on comprehension.

Evaluation Report | MiniLit 66
6.3 Enablers and barriers to overall implementation of MiniLit
6.3.1 Pacing of the intervention activities
When MiniLit tutors were asked if they had changed the program to better suit their students or school
context, eight of the 34 tutors reported that they had done so. These adaptions were most often
motivated by the tutors feeling that they did not have enough time to complete all the activities. The
recommended time suggested by the MiniLit developers is 30 to 40 minutes for Sounds and Words
Activities, seven to 10 minutes for Text Reading, and seven to 10 minutes for Story Book Reading.
Overall, 38 per cent tutors reported that they did not have enough time to complete all the activities as
intended within the recommended one-hour lesson duration.
“Because of the length of time it takes to implement Sounds and Words, [Text Reading] is
sometimes rushed”
This theme also aligns with the MiniLit coaching reports, that also documented timing as the most
commonly noted theme. For each of the three MiniLit lesson activities, coaches frequently suggested
that the MiniLit tutor sought to allow sufficient time to complete the activities, while simultaneously
ensuring that the activities were well-paced within the one-hour lesson. The pacing in MiniLit is
considered to be particularly important in order to keep students well-engaged. For instance, regarding
the Sounds and Words activities:
“keeping the pace up and keeping to the recommended timeframe for this component (30 mins):
try to move through the activities a little bit faster in general, as well as keeping the transitions
between activities nice and quick; this will help to keep the students engaged; going over 40 mins
for this component can see the students get tired and disengaged, so increasing the pace will help
to avoid this”
Timing and pace were also frequent feedback themes for Book Reading and Text Reading.
However, the pacing for these activities was directly impacted by the time tutors allowed for the
previous activities.
“This component not delivered due to time restrictions. As mentioned above, ensure that you keep
the other two components (primarily Sounds and Words) to the recommended timeframe so that
you have enough time to do story book reading.”
Therefore, the length of time spent on each activity was important to ensuring the full lesson could be
delivered within an hour timeframe. However, given the difficulties that some MiniLit tutors had, more
time for each lesson may be required each day to ensure all activities are implemented to the
required quality.
6.3.2 Positive behaviour management
Positive behavior management was also a common area raised by tutors as impeding their ability to
implement the intervention. Tutors reported that the time spent managing student behavior limited
their capacity to deliver MiniLit to the required level.
“[I do not cover all activities because I] spend a bit of time with behaviour. One student is quite
slow to progress. I have had to halve the lessons”
From the coaching report, the most common feedback provided was about reinforcing positive
behaviour within the MiniLit lesson for all three activities.

Evaluation Report | MiniLit 67
“Instead of giving attention to the off-task behaviours (which can be reinforcing in itself), try to
focus on giving more attention to the on-task behaviours – e.g. rather than saying “you’ll be going
back to class if you can’t be sensible”, ignore the misbehaviour and instead catch another student
who is on task and praise them for appropriate behaviour”
“remember, if students are on task and doing all the right things, ‘catch’ them and praise explicitly;
try to ignore any trivial misbehaviours and instead give attention (i.e. praise) to the behaviours you
want to see more of”
Therefore, one challenge of implementing MiniLit was positively managing student behaviour without
disrupting the delivery of the MiniLit components. In addition, as tutors who received feedback about
behaviour management were also more likely to receive feedback on pacing, it is likely that increased
time managing student behaviour may have contributed to challenges in adhering to the
recommended pacing of the intervention.
6.4 Alignment between MiniLit and usual classroom literacy practice
Alignment between the MiniLit and usual classroom literacy practice is a critical factor for optimizing
successful intervention. Classroom literacy practice that uses a different pedagogical approach may
detract MiniLit’s outcomes. In the practice as usual literacy lessons, none of the classroom teachers
observed were implementing a standardised literacy program. While there was some commonality in
content between classroom literacy lessons and MiniLit, there was less of an emphasis on phonic
decoding and phonemic awareness and more focus on whole word reading and reading for meaning.
The details of the usual classroom practices are shown in Figure 6.3 – 6.5.
Figure 6-3: Classroom teacher literacy practice: Literacy Strategy
In terms of instructional pedagogy, just over half of the teachers in the Usual Classroom setting
oriented their students to the current lesson by referring back to previously taught content. This
practice is aligned with an explicit instruction pedagogy which takes a bottom-up, layering approach by
overtly activating prior knowledge prior to teaching new content. Students in the remaining, nearly fifty
per cent of classrooms, whose teachers did not explicitly refer back to previously taught content, are at
risk of being poorly primed for the task demands of the current lesson.

Evaluation Report | MiniLit 68
Classroom teachers were most commonly observed providing the following response challenges and
request during literacy lessons: prompts to read fluently (78 per cent of teachers); and asking students
what a written passage was about (67 per cent). However, the capacity to read fluently and to read for
meaning are both highly dependent on the foundational skills of (i) being able to efficiently and
accurately decode and read words and (ii) strong oral language comprehension. Students who have
not developed sufficient competence in word decoding and/or oral language comprehension will
inevitably have difficulty reading fluently (with appropriate pace, accuracy and intonation) and reading
for meaning. Literacy teaching practices observed in the usual classroom setting did not target these
foundational areas to the extent that would ensure that most, if not all, students would be able to read
fluently and for meaning.
Figure 6-4: Classroom teacher literacy practice: Teacher Behaviour
Figure 6-5: Classroom teacher literacy practice: Student Activities

Evaluation Report | MiniLit 69
In terms of instruction that did target word decoding and/or oral language comprehension, just over
half of the teachers (56 per cent) were observed focusing on letter sound knowledge, which is aligned
with helping students build their word decoding skills. Only one-third of teachers explicitly targeted
vocabulary instruction, which can be considered a proxy for oral language comprehension. Taken
together, it appears that literacy teaching practices in the Usual Classroom settings were highly
variable between teachers, and importantly, their practices did not consistently provide enough
attention to the critical foundation skills needed to ensure successful reading fluency and reading
comprehension. Without explicit instruction in word decoding and oral language comprehension,
asking students to read at a suitable pace and to process what the text means is likely to result in
some students failing to do so, as they have not been explicitly taught the necessary underlying skills.
The evidence is clear that high-quality, evidence-based reading instruction must adopt a multi-
component approach comprising phonemic awareness, phonics (synthetic), reading fluency,
vocabulary and language comprehension (1, 27). This was not consistently displayed among teachers
in the Usual Classroom settings.
As noted above, just over half of the teachers targeted Letter Sound Knowledge, which is aligned with
a synthetic phonics instructional approach and has a substantial evidence base. However, two-thirds
of teachers focused on whole-word recognition, which is aligned with an analytic phonics approach. In
analytic phonics, students are asked to ‘work out’ what the word is first by any means possible (such
as using picture cues, context cues, word box shapes, etc.) and then attend to the intra-word elements
such as phonemes and digraphs. A whole-word approach to reading instruction means that attention
to phonemes, the smallest unit of linguistic meaning, are not prioritised, which in turn, means that
students are not explicitly taught to segment and blend intra-word elements to decode and read
words.(28-30) Without a high level of mastery in decoding, too many students are left vulnerable to
never fully developing a self-extending capacity to read increasingly complex text. Based on the
observation of literacy instruction practices in the Usual Classroom, teachers are not explicitly
teaching it. This may in fact be a product of many pre-service education courses, which typically
privilege constructive principles in relation to reading instruction (31-34) are not explicitly teaching.

Evaluation Report | MiniLit 70
6.5 MiniLit tutor perception of the barriers and enablers to implementation
MiniLit tutors provided insights as to the barriers and enablers of embedding the intervention within
their schools. Overall, the two themes reported by the MiniLit tutors were the importance of (i) having
enough resources and staff to deliver MiniLit, and (ii) the support of the school. The direct quotes from
the MiniLit tutors are presented below.
Table 6-1: Quotes from the MiniLit teachers
Direct quotes from teachers
Resources
To continue to purchase program resources. To employ staff (teachers/SLSO's) to deliver program.
Funding for catch up lessons one on one. Funding for more time on top of one hour to deliver program effectively.
Putting on extra staff to tutor MiniLit without taking time away from other needy students.
Funding, employing SLSO to teach the program.
I think it would be used to purchase resources and materials. The learning support teacher knows more about this as I am a teacher's aide.
funding for the purchase of books and texts.
Funding to be used for SLSO time to deliver MiniLit program.
School support
School being on board with program, especially the support of classroom teachers involved and other staff (learning support).
Teachers becoming more aware of the program and outcomes.
Careful planning of timetable to avoid students missing important lessons e.g. Library, technology.
Curriculum change to slot Minilit in so as students don't miss out on other sessions. This would also motivate involvement of classroom teacher.

Evaluation Report | MiniLit 71
6.6 Key implementation considerations for schools
From the process evaluation, the key factor associated with improvement on selected secondary reading outcomes at six months was implementation fidelity. Therefore, improving how MiniLit is implemented may lead to more positive outcomes; however, this requires further evaluation to determine. Based on the process evaluation findings reported here, the following key considerations are raised as potential ways to enhance the implementation of MiniLit.
6.6.1 Ensuring initial coaching support is provided to enable MiniLit tutors to gain
required skills
The coaching reports highlighted that tutors new to implementing MiniLit required feedback on a range
of implementation factors specific to the three broad activities. In particular, the feedback focused on
specific MiniLit tutor actions (i.e. error correction approach, behaviour management), which underpin
the broad activities. These actions can be nuanced in nature and, for some tutors, they may be a new
way of providing learning support. Furthermore, all the MiniLit tutors reported that the coaching
feedback they received was valuable in ensuring they could implement the program, and that it
increased their confidence in delivering MiniLit.
“Feedback was really valuable + reassured me we were doing things well. She gave good insights
into how to deal with the student who was struggling to keep up.”
“Very thorough reports - positive feedback as well as areas to work on”
Therefore, ongoing coaching should be part of the training provided to new tutors implementing the
intervention for the first time within their schools. Although coaching for this study was provided by
MiniLit, coaching could also be provided by an experienced MiniLit tutor who has successfully
delivered MiniLit to the required fidelity and quality. The degree of adaptation that is possible within the
program also needs careful consideration. It would also be important to consider whether the amount
of coaching provided in this study was appropriate for all MiniLit tutors.
6.6.2 Ensure schools allocate sufficient time for students to complete the
MiniLit program
It is recommended that schools ensure that there is sufficient time for students to complete the MiniLit
intervention, and that it can be implemented to the required frequency.
Within this study, 52 per cent of MiniLit teachers were able to deliver MiniLit at the required dosage of
80 per cent of lessons over the 20-week intervention period (i.e. four times per week). Furthermore, it
was found that MiniLit tutors were able to implement all three activities during each MiniLit lesson.
However, it is important to note that when considering compliance in the impact evaluation analyses,
providing students with the intervention to the required frequency was associated with better outcomes
at six and 12 months (see Chapter 3).
In addition, consideration should be given to the amount of time schools allocate for students to
complete the intervention. Within this study, only five students were able to reach the end of all 80
distinct MiniLit lessons within the 20-week period. These students had a higher starting lesson level
due to their initial assessment. Therefore, it is expected that a time period of greater than 20 weeks is
required to ensure students can complete the full MiniLit intervention. This will require consideration
regarding the frequency of MiniLit delivery (i.e. number of days per week) and the duration of
implementation (i.e. number of weeks or school terms suggested for delivery). However, this may
reflect the parameters of the trial, whereby schools in this study were restricted to the 20-week
intervention period due to funding and other pragmatic reasons.
Evaluation Report | MiniLit 72
6.6.3 Review time allowance for the different components to enable effective delivery
Another common concern for MiniLit teachers, which was reflected in the coaching feedback and
teacher feedback, was the amount of time suggested to complete all three of the MiniLit activities.
Most MiniLit teachers who had feedback about pacing also had feedback about implementing positive
classroom behaviour management. Given the importance of both pacing and positive classroom
behaviour management for ensuring student engagement, adapting the pacing suggestions may be
required to allow MiniLit teachers to manage the behaviour appropriately without being limited by the
overall delivery time. This is especially important given that research has consistently shown that
students with reading difficulties may have increased classroom behaviour difficulties. This may
require a time allocation of greater than one hour for some groups. Allowing for this time may be at the
discretion of schools as it has implications for resourcing and funding. As MiniLit tutors found the
pacing of MiniLit challenging, they were more likely to adapt the program by reducing certain activities
(i.e. not ask the comprehension questions) to complete the intervention within the one-hour timeframe.
6.6.4 Ensure sufficient support for the intervention within schools
Not surprisingly, having enough resources and staff to deliver an intervention is widely known to be a
key factor in ensuring an intervention can be provided in a sustainable way within schools.
Specifically, for school support, MiniLit tutors highlighted the importance of having classroom teachers
support the intervention. Given the potential differences between the classroom teachers’ literacy
practices and the theory of change inherent to the MiniLit intervention, the support of the classroom
teacher may be a strong indicator of whether their classroom literacy instruction aligns with the
domains in which MiniLit is targeting (i.e. systematic synthetic phonics). Furthermore, the MiniLit tutors
also highlighted that schools should deliver MiniLit in a schedule which does not lead to students
missing out on important lessons, and that this approach may also lead to greater classroom
teacher engagement.

Evaluation Report | MiniLit 73
6.7 Summary of key findings from process evaluation
Overall, the process evaluation found that increased program fidelity was associated with higher
reading rate scores at 12 months, as measured by the YARC-Passage Reading. In further analysis, it
was found that increased program fidelity was associated with higher secondary outcome scores
related to decoding, letter sound knowledge and phoneme awareness at six months. These higher
scores align with MiniLit’s program logic, whereby the initial focus is on improving student’s ability to
improve their letter sound knowledge and decoding ability as a pathway to more complex reading
skills, such as reading rate, accuracy and comprehension. The importance of letter sound knowledge
was acknowledged by the MiniLit tutors as an important component in supporting student’s in this
study with reading difficulties.
There was one key theme which emerged and was associated with the feasibility of the MiniLit
intervention for the participating schools. This was the overall pacing of the intervention on a daily
basis. MiniLit recommends that the intervention be completed within an hour block each day, with
distinct guidelines as to how long each of the three distinct activities is to take. However, MiniLit tutors
commonly received coaching feedback about their pacing of each component. This may have
contributed to a high proportion of MiniLit teachers reporting they had adapted the intervention through
reducing what is done in the second two activities and spending a larger amount of time in the first
activity. In addition, teachers received feedback on their class behaviour management strategies,
which teachers indicated also led to increased class time.

Evaluation Report | MiniLit 74
7 Overall summary
7.1 Overall interpretation
There was no statistical evidence for a difference in primary outcomes at 12 months post-
randomisation, as measured by YARC – PR Reading Accuracy (effect size = 0.13, [-0.08 to 0.33]),
YARC – PR Reading Rate (effect size = 0.06, [-0.19 to 0.32]) and YARC – PR Reading
Comprehension (effect size -0.04, 95 per cent CI [-0.28 to 0.21]). This was predominantly consistent
across all analysis models, including compliance analyses. However, a large proportion of students
were not able to complete the measure at baseline and there were a large number of students who
performed at the floor at the follow-up time points. Therefore, these findings should be treated with
caution.
In the secondary outcomes which focused on early reading skills, there was evidence that compared
to the control group at six months, the students who received MiniLit demonstrated improved (i)
Phoneme Awareness, (ii) Letter Sound Knowledge, and (iii) decoding ability for both regularly spelled
real words and phonologically legal non-words and reading accuracy. Benefits in these specific
domains aligns with the main focus areas of the MiniLit intervention. The differences between groups
decreased at 12 months, with only evidence for improved Letter Sound Knowledge at 12 months.
However, when accounting for compliance to the intervention (i.e., children who attended at least 80%
of lessons, otherwise stated as attended at least 4 days per week), results revealed that students in
the intervention group had performed significantly better on word and non-word decoding skills,
Phonemic Awareness and Letter Sound Knowledge at 12 months. Therefore, children who met the
minimum attendance threshold had significantly higher scores on the specific reading skills targeted
by MiniLit.
In addition to these findings, the process evaluation also yielded valuable findings. Firstly, the
outcomes in relation to the intervention group needs to take into account that only 54 per cent of
students received at least 80 per cent of the possible lessons (i.e. 4 days per week) over the 20-week
intervention period. Although all students received all the components of the MiniLit lessons during
observations, close to half of these students received less than 80 per cent (i.e. 4 days per week) of
the possible lessons. This may reflect the time required to implement the intervention. A small group
reading intervention delivered for at least four days per week over 20 weeks may not be pragmatic for
all schools, and a longer duration of time may be required to enable all students to reach the end of
the intervention. MiniLit implementation fidelity, as measured by the standardised MiniLit lesson
observations, was consistently associated with better student outcomes. Therefore, teachers
implementing MiniLit for the first time will require support to enable them to build the skills and
knowledge required to Implement MiniLit to the required fidelity to achieve positive student outcomes.
Although the primary outcome measures, namely reading YARC – PR Reading Rate, Accuracy and
Comprehension, were not significantly different between the MiniLit and control groups after 12
months, the significant gains made by the MiniLit group in the foundational building blocks of Letter
Sound Knowledge, Phoneme Awareness, Regular Word Reading and Non-word Reading, and the
trend towards improved reading accuracy, suggests that the students have the foundational skills
required to transition to reading outcomes. However, this will require a longer follow-up period to
determine whether these benefits are sustained when they return to a usual practice classroom
setting.

Evaluation Report | MiniLit 75
7.2 Strengths
As far as is known, this is the first Australian efficacy randomised controlled trial of a synthetic
phonics-based intervention aimed at improving reading outcomes for Year 1 students with reading
ability in the bottom quartile. A smaller trial was conducted by Buckingham et al, which showed
positive benefits of the intervention after three terms of implementation (35). Conducted according to
the CONSORT requirements, this trial included randomisation of participants after initial screening,
use of objective measures commonly used in school and clinical settings to measure student reading
abilities, and the known blinding of outcome assessors to a child’s intervention to reduce bias.
Importantly, the control group were students who received Usual Learning Support. Therefore, schools
were able to provide learning support for these students, both at the whole class level and at Tier 2.
The only restriction was that they could not use the MiniLit intervention and that the usual support
should align with their current approaches in identifying which students were eligible for the
interventions (i.e. not use the WARL data). It was not possible, nor desirable, to prevent schools from
providing available support to students in the control group after the study began. Therefore, the
findings represent the value of the MiniLit intervention over current learning support approaches, such
as Reading Recovery, which were provided to students in the control group in the nine schools.
Another strength of this study is the integration of the process evaluation measures and cost analyses.
Understanding changes in implementation, using data from observations, students, and MiniLit and
classroom teachers, enabled a detailed understanding of the implementation factors which are
associated with the observed outcomes. In addition, the process evaluation included measurement of
the classroom teachers’ literacy teaching practices to understand the extent to which the MiniLit
pedagogy differs from the whole-class pedagogy, as well as any small-group interventions provided to
students. Integrated robust impact and process evaluations enabled a strong understanding of
whether the intervention works, for whom, and under what circumstances.
7.3 Limitations
The main limitation of the study is the psychometric properties of the primary outcome measure, the
YARC – Passage Reading. Overall, a large proportion of students were unable to complete the
primary outcome at baseline or at follow-up. This may reflect the psychometric properties of the
measure, which may not be suitable for students who are struggling to read as demonstrated by the
high number of students achieving at the measure’s floor. In addition, it is widely acknowledged that
reading comprehension is a complex multi-component skill that, unlike word recognition, cannot be
taught as a defined set of knowledge and skills. The complexity of reading comprehension is further
highlighted by Tunmer and Hoover’s (2019) Cognitive Foundations of Reading model which, although
derived from their Simple View of Reading, posits that reading comprehension requires a
conglomerate of oral language skills including linguistic knowledge (phonological, syntactic and
semantic); inferencing skills and well-developed background knowledge.(36) Therefore, students may
need to first develop and become competent in linguistic skills, before enabling them to be able to
apply this knowledge to text inferencing.
Another limitation was the dosage received by the intervention group. Only 55 per cent of students in
the intervention group who were available for follow-up received the number of lessons recommended
by the developers. This low adherence to the protocol is a function of the variability of school
environments, with student absence, teacher absence, and special events causing interruptions. It is
reasonable to suggest that these interruptions would have not only affected the individual students
who missed the lessons, but also the small groups of which they were part, consequently impacting
the progress of that group through the program. The dosage was also limited by the constraints placed
upon the schools. Schools were limited to 20 weeks' duration, and in many cases, this length was not
sufficient to complete the program for all groups.

Evaluation Report | MiniLit 76
7.4 Conclusion
Overall, the findings showed there is no evidence of a difference between the MiniLit and Usual
Learning Support groups at 12 months post-randomisation, as measured by the YARC – PR Reading
Accuracy, Reading Rate and Reading Comprehension. However, there was evidence for significant
better scores for the MiniLit group in foundational skills related to reading development at six months,
with some sustained benefits at 12 months. However, compliance analyses demonstrated that, once
accounting for students who received the intervention as intended, there were sustained benefits in
more domains related to reading development as well as student reading accuracy. However, findings
were dependent on the quality of the MiniLit lessons which were provided to students.

Evaluation Report | MiniLit 77
References
1. National Reading Panel. Report of the national reading panel: Teaching children to read: An evidence-based assessment of the scientific research literature on reading and its implications for reading instruction: Reports of the subgroups: National Institute of Child Health and Human Development, National …; 2000.
2. Cohen A, Syme S. Education: a missed opportunity for public health intervention. American journal of public health. 2013;103(6):997-1001.
3. O’Hare A. Dyslexia: what do paediatricians need to know? Paediatrics and Child Health. 2010;20(7):338-43.
4. Conway L, Levickis P, Mensah F, McKean C, Smith K, Reilly S. Associations between expressive and receptive language and internalizing and externalizing behaviours in a community‐based prospective study of slow‐to‐talk toddlers. International journal of language & communication disorders. 2017;52(6):839-53.
5. Bryan T, Burstein K, Ergul C. The social-emotional side of learning disabilities: A science-based presentation of the state of the art. Learning Disability Quarterly. 2004;27(1):45-51.
6. Coulombe S, Tremblay J-F. Literacy and growth. Topics in macroeconomics. 2006;6(2).
7. Geary D. An evolutionarily informed education science. Educational Psychologist. 2008;43(4): 179-95.
8. Castles A, Rastle K, Nation K. Reading acquisition from novice to expert. Psychological Science in the Public Interest. 2018;19(1):5-51.
9. Gough P, Tunmer W. Decoding, reading, and reading disability. Remedial and special education. 1986;7(1):6-10.
10. Foorman B, Francis D, Fletcher J, Schatschneider C, Mehta P. The role of instruction in learning to read: Preventing reading failure in at-risk children. Journal of Educational Psychology. 1998;90(1):37.
11. Shaywitz S, Shaywitz B. Dyslexia (Specific Reading Disability). Biological psychiatry. 2005;57(11):1301-9.
12. Scarborough H. Connecting early language and literacy to later reading (disabilities: Evidence, theory, and practice. In S. Neuman & D. Dickinson (eds.), Handbook for research in early literacy (pp. 97-110). New York: Guilford. 2001.
13. Fuchs D, Fuchs LS. Introduction to response to intervention: What, why, and how valid is it? Reading research quarterly. 2006;41(1):93-9.
14. McArthur G, Castles A, Kohnen S, Larsen L, Jones K, Anandakumar T, et al. Phonics training for English-speaking poor readers. Cochrane Database Syst Rev. 2011;12.
15. Suggate SP. A meta-analysis of the long-term effects of phonemic awareness, phonics, fluency, and reading comprehension interventions. Journal of learning disabilities. 2016;49(1):77-96.
16. Teaching Reading: Report and Recommendations 2005 [Available from: http://www.dest.gov.au/nitl/documents/report_recommendations.
17. Moher D, Schulz K, Altman D. The CONSORT statement: revised recommendations for improving the quality of reports of parallel group randomized trials. BMC Medical Research Methodology. 2001;1(1):2.
18. Wheldall K. Wheldall Assessment of Reading Lists (WARL) Presentation Book: Multilit Pty Limited; 2015.

Evaluation Report | MiniLit 78
19. Snowling M, Stothard S, Clarke P, Bowyer-Crane C, Harrington A, Truelove E, et al. YARC York Assessment of Reading for Comprehension Passage Reading. GL Publishers; 2009.
20. Hulme C, Stothard S, Clarke P, Bowyer-Crane C, Harrington A, Truelove E, et al. York Assessment for Reading Comprehension Early Reading. GL Publishers; 2009.
21. Castles A, Coltheart M, Larsen L, Jones P, Saunders S, McArthur G. Assessing the basic components of reading: A revision of the Castles and Coltheart test with new norms. Australian Journal of Learning Difficulties. 2009;14(1):67-88.
22. Gathercole S, Baddeley A. Children's Test of Nonword Repetition. Harcourt, Brace & Company; 1996.
23. Wolf M, Bridge Denckla M. Rapid Automatized Naming and Rapid Alternating Stimulus Tests (RAN/RAS). Pro-Ed; 2005.
24. Greenland S, Senn SJ, Rothman KJ, Carlin JB, Poole C, Goodman SN, et al. Statistical tests, P values, confidence intervals, and power: a guide to misinterpretations. European journal of epidemiology. 2016;31(4):337-50.
25. Peugh JL, Strotman D, McGrady M, Rausch J, Kashikar-Zuck S. Beyond intent to treat (ITT): A complier average causal effect (CACE) estimation primer. Journal of School Psychology. 2017;60: 7-24.
26. Stevens EA, Walker MA, Vaughn S. The effects of reading fluency interventions on the reading fluency and reading comprehension performance of elementary students with learning disabilities: A synthesis of the research from 2001 to 2014. Journal of learning disabilities. 2017;50(5):576-90.
27. Rose J. Independent review of the teaching of early reading 2006 [Available from: http://dera.ioe.ac.uk/5551/2/report.pdf.
28. Konza D. Responding to the evidence: Synthetic phonics in action. Perth, WA: Fogarty Learning Centre. Available at http://www.ecu.edu.au; 2013.
29. Johnston RS, McGeown S, Watson JE. Long-term effects of synthetic versus analytic phonics teaching on the reading and spelling ability of 10 year old boys and girls. Reading and Writing. 2012;25(6):1365-84.
30. Johnston R, Watson J. The effects of synthetic phonics teaching on reading and spelling attainment: a seven year longitudinal study. 2005.
31. Bos C, Mather N, Dickson S, Podhajski B, Chard D. Perceptions and knowledge of preservice and inservice educators about early reading instruction. Annals of Dyslexia. 2001;51(1):97-120.
32. Washburn EK, Joshi RM, Cantrell EB. Are preservice teachers prepared to teach struggling readers? Annals of dyslexia. 2011;61(1):21-43.
33. Stark HL, Snow PC, Eadie PA, Goldfeld SR. Language and reading instruction in early years’ classrooms: The knowledge and self-rated ability of Australian teachers. Annals of dyslexia. 2016;66(1):28-54.
34. Rowe K. Teaching reading: Report and recommendations. Australian Government Department of Education, Science, and Training: National Inquiry into the Teaching of Literacy. 2005.
35. Buckingham J, Wheldall K, Beaman R. A randomised control trial of a Tier-2 small-group intervention (‘MiniLit’) for young struggling readers. Australian Journal of Learning Difficulties. 2012;17(2):79-99.
36. Tunmer WE, Hoover WA. The cognitive foundations of learning to read: a framework for preventing and remediating reading difficulties. Australian Journal of Learning Difficulties. 2019;24(1):75-93.

Evaluation Report | MiniLit 79
Appendix A: Evidence for Learning cost rating
Cost ratings are based on the approximate cost per student per year of implementing the intervention
over three years. Cost ratings are awarded as follows:
Cost rating
Description
Very low: up to about $4000 per year per class of 25 students, or less than $160 per student per year.
Low: $4001 to $8000 per year per class of 25 students, or up to about $320 per student per year.
Moderate: $8001 to $30000 per year per class of 25 students, or up to about $1200 per student per year.
High: $30001 to $50000 per year per class of 25 students, or up to $2000 per student per year.
Very high: over $50000 per year per class of 25 students, or over $2000 per student per year.
The following table of effect size to months progress was provided and used in accordance with
Evidence for Learnings’ requirements, and is based on that used by the Education Endowment Fund,
recently revised from the original table established by the EEF (Higgins et al., 2013). Source:
educationendowmentfoundation.org.uk/help/projects/the-eefs-months-progress-measure. Also note
that it differs from the conversion table used in the Toolkit: see evidenceforlearning.org.au/the-
toolkit/about/#months-impact
Effective size: from to Months impact Description
-0.04 0.04 0 Very small or no effect
0.05 0.09 1 Small
0.10 0.18 2 Small
0.19 0.26 3 Moderate
0.27 0.35 4 Moderate
0.36 0.44 5 Moderate
0.45 0.52 6 Large
0.53 0.61 7 Large
0.62 0.69 8 Large
0.70 0.78 9 Very large
0.79 0.87 10 Very large
0.88 0.95 11 Very large

Evaluation Report | MiniLit 80
Appendix B: Security padlock rating of trial findings
YARC-PR Accuracy
1. Criteria for rating: In each column highlight the relevant cell in green
2. Initial score: Write how many padlocks the trial has received based on the first 3 columns (“x ”)
and highlight in green (initial score is the lowest rating from the first three columns – see guidance
on security classification for more detail)
3. Adjust: record adjustment for balance and threats for validity in the adjust column.
4. Final score: Write the number of padlocks (“x ”) in the relevant cell and highlight green
5. Provide a brief summary of your classification, following the bullet point prompts below.
Rating Criteria for rating Initial score
Adjust
Final score
Design Power* Attrition2
Well conducted experimental design with appropriate analysis
MDES <0.2
0-10%
Adjustment
for Balance [ -1 ]
Adjustment for threats to internal
validity [ 0 ]
Fair and clear quasi-experimental (e.g. RDD) with appropriate analysis, or experimental design with minor concerns about validity
MDES <0.3
11-20%
Well-matched comparison (using propensity score matching, or similar) or experimental design with moderate concerns about validity
MDES <0.4
21-30% 3
Weakly matched comparison or experimental design with major flaws
MDES <0.5
31-40% 2
Comparison group with poor or no matching (e.g. volunteer versus others)
MDES <0.6
41-50%
0 No comparator MDES
<0.6 Over 50%
2 Attrition should be measured at the student level (even for clustered trials) and from the point of randomisation to the point of analysis.

Evaluation Report | MiniLit 81
• Initial padlock score: lowest of the three ratings for design, power and attrition = [3] padlocks.
This was a well-randomized RCT with randomization at the pupil level. Attrition in the primary
outcome was low at 8.4% with MDES at randomization of 0.37. Thus, this can achieve a maximum
of 3 padlocks.
• Reason for adjustment for balance (-1): There is evidence of considerable imbalance at
baseline for the YARC-PR Accuracy measure (0.12). This grants the reduction of one padlock.
• Reason for adjustment for threats to validity (No adjustment made): The IPE suggests that
schools struggle to deliver 4 sessions per week so a longer period could be considered to allow
pupils to receive the suggested dosage. Also, note that the schools were using similar approaches
as part of the business as usual and thus these results should be interpreted as the effects of
Minilit above those of Business as Usual provision. Floor effects were found in the baseline
measure, especially when using the standardized scores. However, floor effects were not evident
in the post-test. Multiple testing was not accounted for in the different analyses even when a large
number of analyses are presented. However, none of these flaws are deemed severe threats to
the validity of the results as to further reduce the padlock rating.
• Final padlock score: initial score adjusted for balance and internal validity = [2] padlocks

Evaluation Report | MiniLit 82
YARC-PR Reading Rate
1. Criteria for rating: In each column highlight the relevant cell in green
2. Initial score: Write how many padlocks the trial has received based on the first 3 columns (“x ”)
and highlight in green (initial score is the lowest rating from the first three columns – see guidance
on security classification for more detail)
3. Adjust: record adjustment for balance and threats for validity in the adjust column.
4. Final score: Write the number of padlocks (“x ”) in the relevant cell and highlight green
5. Provide a brief summary of your classification, following the bullet point prompts below.
Rating Criteria for rating Initial score
Adjust
Final score
Design Power Attrition3
Well conducted experimental design with appropriate analysis
MDES <0.2
0-10%
Adjustment
for Balance [ 0 ]
Adjustment for threats to internal
validity [ -1 ]
Fair and clear quasi-experimental (e.g. RDD) with appropriate analysis, or experimental design with minor concerns about validity
MDES <0.3
11-20%
Well-matched comparison (using propensity score matching, or similar) or experimental design with moderate concerns about validity
MDES <0.4
21-30% 3
Weakly matched comparison or experimental design with major flaws
MDES <0.5
31-40% 2
Comparison group with poor or no matching (e.g. volunteer versus others)
MDES <0.6
41-50%
0 No comparator MDES
<0.6 Over 50%
3 Attrition should be measured at the student level (even for clustered trials) and from the point of randomisation to the point of analysis.

Evaluation Report | MiniLit 83
• Initial padlock score: lowest of the three ratings for design, power and attrition = [3] padlocks. This
was a well-randomized RCT with randomization at the pupil level. Attrition in the primary outcome
was low at 8.4% with MDES at randomization of 0.37. Thus, this can achieve a maximum of 3
padlocks.
• Reason for adjustment for balance (0): Imbalance at baseline could not be estimated for YARC-
PR Rate.
• Reason for adjustment for threats to validity (-1): The IPE suggests that schools struggle to
deliver 4 sessions per week so a longer period could be considered to allow pupils to receive the
suggested dosage. Also, note that the schools were using similar approaches as part of the
business as usual and thus these results should be interpreted as the effects of Minilit above
those of Business as Usual provision. Multiple testing was not accounted for in the different
analyses even when a large number of analyses are presented. Extreme floor effects were found
in the baseline measures which deemed the data unusable. Floor effects were also observed for
the YARC PR Rate post-test with over 30% of the pupils scoring at floor, which combined with
other threats grant the reduction of one padlock.
• Final padlock score: initial score adjusted for balance and internal validity = [2] padlocks

Evaluation Report | MiniLit 84
YARC-PR Comprehension
1. Criteria for rating: In each column highlight the relevant cell in green
2. Initial score: Write how many padlocks the trial has received based on the first 3 columns (“x ”)
and highlight in green (initial score is the lowest rating from the first three columns – see guidance
on security classification for more detail)
3. Adjust: record adjustment for balance and threats for validity in the adjust column.
4. Final score: Write the number of padlocks (“x ”) in the relevant cell and highlight green
5. Provide a brief summary of your classification, following the bullet point prompts below.
Rating Criteria for rating Initial score
Adjust
Final score
Design Power* Attrition4
Well conducted experimental design with appropriate analysis
MDES <0.2
0-10%
Adjustment
for Balance [ -1 ]
Adjustment for threats to internal
validity [ -1 ]
Fair and clear quasi-experimental (e.g. RDD) with appropriate analysis, or experimental design with minor concerns about validity
MDES <0.3
11-20%
Well-matched comparison (using propensity score matching, or similar) or experimental design with moderate concerns about validity
MDES <0.4
21-30% 3
Weakly matched comparison or experimental design with major flaws
MDES <0.5
41-50%
Comparison group with poor or no matching (e.g. volunteer versus others)
MDES <0.6
31-40% 1
0 No comparator MDES
<0.6 Over 50%
4 Attrition should be measured at the student level (even for clustered trials) and from the point of randomisation to the point of analysis.

Evaluation Report | MiniLit 85
• Initial padlock score: lowest of the three ratings for design, power and attrition = [3] padlocks.
This was a well-randomized RCT with randomization at the pupil level. Attrition in the primary
outcome was low at 8.4% with MDES at randomization of 0.37. Thus, this can achieve a maximum
of 3 padlocks.
• Reason for adjustment for balance (-1): There is evidence of considerable imbalance at
baseline for the YARC-PR Comprehension measure (0.2). This grants the reduction of at least
one padlock.
• Reason for adjustment for threats to validity (-1): The IPE suggests that schools struggle to
deliver 4 sessions per week so a longer period could be considered to allow pupils to receive the
suggested dosage. Also, note that the schools were using similar approaches as part of the
business as usual and thus these results should be interpreted as the effects of Minilit above
those of Business as Usual provision. Multiple testing was not accounted for in the different
analyses even when a large number of analyses are presented. Floor effects were found in the
baseline measures of attainment using the standardized scores. Floor effects were also observed
for the YARC PR Comprehension post-test with over 12% of the pupils scoring at floor, which
combined with other threats and the large imbalance observed (0.2) grant the reduction of an
additional padlock.
• Final padlock score: initial score adjusted for balance and internal validity = [1] padlock

Evaluation Report | MiniLit 86
Appendix C: Additional figures and tables
Figure C1. The correlation matrix for all variables used in the analyses
1
2m
-Y
AR
C-P
R-A
ccu
racy
12
m-Y
AR
C-P
R-R
ate
12-Y
AR
C-P
R-C
om
p
6m
-Y
AR
C-P
R-A
ccura
cy
6m
-YA
RC
-PR
-Ra
te
6-Y
AR
C-P
R-C
om
p
12
m-Y
AR
C-E
R-L
ette
r
12
m-Y
AR
C-E
R-W
ord
12
m-Y
AR
C-E
R-P
hon
6m
_Y
AR
C-E
R-L
etter
6m
-YA
RC
-ER
-Word
6m
-YA
RC
-ER
-Pho
n
12
m-C
C2
-Re
gu
lar
12
m-C
C2
-Irr
eg
ula
r
12
m-C
C2
-No
n-w
ord
6m
-CC
2-R
eg
ula
r
6m
-CC
2-I
rregu
lar
6m
-CC
2-N
on
-wo
rd
WA
RL
-sre
en
WA
RL
-FU
12m -YARC-PR-Accuracy
1.00
12m-YARC-PR-Rate
0.86 1.00
12-YARC-PR-Comp
0.37 0.18 1.00
6m -YARC-PR-Accuracy
0.88 0.83 0.33 1.00
6m-YARC-PR-Rate
0.83 0.86 0.25 0.87 1.00
6-YARC-PR-Comp
0.44 0.41 0.44 0.45 0.43 1.00
12m-YARC-ER-Letter
0.35 0.27 0.18 0.37 0.24 0.14 1.00
12m-YARC-ER-Word
0.82 0.81 0.20 0.77 0.81 0.35 0.25 1.00
12m-YARC-ER-Phon
0.57 0.44 0.27 0.59 0.42 0.29 0.46 0.50 1.00
6m_YARC-ER-Letter
0.40 0.25 0.17 0.36 0.21 0.19 0.67 0.29 0.37 1.00
6m-YARC-ER-Word
0.79 0.70 0.31 0.78 0.74 0.42 0.23 0.78 0.45 0.34 1.00
6m-YARC-ER-Phon
0.59 0.41 0.30 0.56 0.47 0.26 0.42 0.50 0.59 0.45 0.48 1.00
12m-CC2-Regular
0.83 0.72 0.27 0.75 0.72 0.31 0.43 0.73 0.61 0.35 0.63 0.59 1.00
12m-CC2-Irregular
0.80 0.72 0.29 0.70 0.67 0.31 0.22 0.73 0.44 0.33 0.66 0.43 0.74 1.00
12m-CC2-Non-word
0.78 0.62 0.28 0.72 0.64 0.24 0.51 0.65 0.60 0.40 0.62 0.60 0.88 0.66 1.00
6m-CC2-Regular
0.80 0.65 0.32 0.80 0.71 0.35 0.47 0.66 0.60 0.46 0.75 0.60 0.77 0.56 0.80 1.00
6m-CC2-Irregular
0.76 0.67 0.24 0.75 0.73 0.32 0.31 0.71 0.49 0.33 0.77 0.46 0.63 0.62 0.62 0.76 1.00
6m-CC2-Non-word
0.77 0.63 0.34 0.76 0.65 0.29 0.52 0.63 0.59 0.46 0.68 0.60 0.78 0.55 0.80 0.90 0.75 1.00
WARL-sreen 0.52 0.50 0.35 0.53 0.51 0.29 0.40 0.40 0.22 0.35 0.35 0.39 0.39 0.39 0.42 0.41 0.31 0.36 1.00
WARL-FU 0.73 0.76 0.21 0.69 0.68 0.35 0.27 0.63 0.35 0.24 0.45 0.41 0.61 0.66 0.53 0.41 0.46 0.40 0.58 1.00

Evaluation Report | MiniLit 87
Table C1. Baseline comparison of intervention group with and without data at 12 months
follow-up
Data at 12 months N = 108
No data at 12 months N = 11
Mean or n (%)
SD IQR Mean or n (%)
SD IQR Mean diff.
p-value
Effect size
Screening measure
WARL – raw score 11.09 4.57 7.33 to 15.17
11.24 3.3 8.33 to 12.67
-0.15 .92 -0.03
Demographics
Sex – n male (%)
55 (46.2)
5 (4.0)
.73 (chi2)
Age (years)
6.45 0.38 6.15 to 6.8
6.36 0.29 6.20 to 6.6
0.09 .48 0.24
SES (SEA score)
7.12 1.98 5.85 to 8.50
7.69 2.15 7.50 to 9.00
-0.57 .37 -0.29
Primary outcome
YARC-PR Accuracy raw score
6.73 4.12 4.00 to 9.00
7.18 3.63 4.00 to 3.55
-0.45 .73 -0.11
YARC-PR Comprehension raw score
3.55 2.3 2.00 to 5.00
3.27 2.1 1.00 to 5.00
0.28 .71 0.12
YARC-PR Reading Rate*
231 67.7 - 399.5 174.7 - -168.5
Secondary outcomes
YARC-ER Letter Sound Knowledge standard score
89.36 11.48 82.50 to 97.00
94.64 11.83 84.00 to 106.00
-5.28 .14 -0.46
YARC-ER Early Word Reading standard score
84.7 11.48 82.50 to 97.00
85.27 11.83 84.00 to 106.00
-0.57 .84 -0.05
YARC-ER Phoneme Awareness Composite standard score
89.31 11.48 82.50 to 97.00
92.73 11.83 84.00 to 106.00
-3.42 .3 -0.28
Castles and Coltheart 2 Regular Word Reading z-score
-1.1 0.53 -1.56 to -0.74
-0.93 0.6 -1.32 to -0.12
-0.17 .33 -0.32
Castles and Coltheart 2 Irregular Word Reading z-score
-1.1 0.58 -1.56 to -0.85
-1.30 0.51 -1.58 to -1.14
0.2 .29 0.35
Castles and Coltheart 2 Non-word Reading z-score
-0.62 0.55 -1.00 to -0.26
-0.64 0.69 -1.21 to 0.10
0.02 .92 0.04
Confounders
RAN Object Naming standard score
94.42 14.84 86.00 to 102.00
92.36 12.73 76.00 to 103.00
2.06 .66 0.14
RAN Colour Naming standard score
92.98 17.02 82.50 to 102.00
91.64 14.26 84.00 to 97.00
1.34 .8 0.08
RAN Number naming standard score
95.11 15.74 87.00 to 107.00
93.55 16.6 85.00 to 101.00
1.56 .76 0.10
RAN Letter naming standard score
97.1 14.34 87.00 to 108.00
100.09 12.68 97.00 to 103.00
-2.99 .51 -0.21
Children’s Test of Non-word Repetition standard score
101.9 18.38 89.00 to 117.00
100 20.12 93.00 to 117.00
1.9 .75 0.10

Evaluation Report | MiniLit 88
Table C2: Baseline comparison of control group with and without data at 12 months follow-up
Data at 12 months N = 109
No data at 12 months N = 9
Mean or n (%)
SD IQR Mean or n (%)
SD IQR Mean diff.
p-value
Effect size
Screening measure
WARL raw score 10.73 4.99 8.00 to 15.00
11.04 5 11.33 to 14.67
-0.31 .86 -0.06
Demographics
Sex – n male (%)
51 (43.2) 6 (5.1)
.25 (chi2)
Age (years)
6.4 0.39 6.10 to 6.60
6.5 0.34 6.2 to 6.7
-0.1 .46 -0.26
SES (SEA score)
6.99 2.43 5.00 to 9.00
7.23 2.36 5.00 to 9.50
-0.24 .77 -0.10
Primary Outcome
YARC-PR Accuracy raw score
6.36 4.51 2.00 to 10.00
4.89 3.55 1.00 to 7.00
1.47 .34 0.33
YARC-PR Comprehension raw score
3.06 2.18 2.0 to 5.00
3.22 2.39 2.00 to 5.00
-0.16 .83 -0.07
YARC-PR Reading Rate*
- - - - - -
Secondary Outcomes
YARC-ER Letter Sound Knowledge standard score
88.17 11.58 80.00 to 95.00
87.5 13.55 75.50 to 98.50
0.67 .88 0.06
YARC-ER Early Word Reading standard score
84.55 11.58 80.00 to 95.00
80.13 11.83 75.50 to 98.50
4.42 .34 0.35
YARC-ER Phoneme Awareness Composite standard score
88.72 11.58 80.00 to 95.00
88.75 13.55 75.50 to 98.50
-0.03 .99 0.00
Castles and Coltheart 2 Regular Word Reading z-score
-1.13 0.47 -1.58 to -0.92
-1.09 0.5 -1.56 to -0.61
-0.04 .8 -0.09
Castles and Coltheart 2 Irregular Word Reading z-score
-1.14 0.5 -1.58 to -0.85
-1.48 0.31 -1.58 to -1.56
0.34 .05 0.69
Castles and Coltheart 2 Non-word Reading z-score
-0.72 0.5 -1.2 to -0.41
-0.74 0.59 -1.09 to -0.63
0.02 .88 0.04
Confounders
RAN-Object Naming standard score
92.12 16.59 81.00 to 104.50
97.5 13.95 87.00 to 109.5
-5.38 .37 -0.33
RAN-Colour Naming standard score
90.67 15.24 78.50 to 101.00
96 9.96 88.50 to 104.00
-5.33 .33 -0.36
RAN-Number naming standard score
94.74 15.17 83.50 to 106.00
97.14 13.28 81.00 to 108.00
-2.4 .68 -0.16
RAN- Letter naming standard score
96.73 15.64 84.00 to 106.00
93.25 12.27 84.50 to 102.00
3.48 .54 0.23
Children’s Test of Non-word Repetition standard score
97.47 22.78 80.00 to 114.00
82.25 21.45 68.50 to 81.50
15.22 .07 0.66

Evaluation Report | MiniLit 89
Table C3: Primary and secondary outcomes at 12 month follow-up and 6 month follow-up
adjusted for baseline score, taking cluster (school) into account
Intervention n = 108
Mean (SD)
Control n = 109
Mean (SD)
Mean diff.
(I – C)
95% CI
p- value
Effect size
Effect size
95% CI
Six-month outcomes n = 107 n = 107
YARC – Passage Reading
Reading Accuracy
89.94 (11.42)
87.07 (10.29)
2.12 0.05 to 4.4
0.04 0.201 0.00 to 0.40
Reading Rate
78.76 (8.91)
78.42 (9.61)
0.27 -2.06 to 2.60
0.82 0.030 -0.22 to 0.28
Reading Comprehension
85.05 (13.62)
83.7 (12.76) 0.02 -3.12 to 3.17
0.99 0.00 -0.24 to 0.24
YARC – Early Reading
Letter Sound Knowledge
109.47 (15.16)
95.93 (14.24)
13.03 9.75 to 16.31
<0.001 0.806 0.60 to 1.01
Early Word Recognition
84.94 (11.85)
84.4 (13.23)
0.56 -1.42 to 2.54
0.58 0.045 -0.11 to 0.20
Phoneme Awareness
96.23 (12.47)
91.59 (12.58)
4.59 1.89 to 7.30
0.001 0.361 0.15 to 0.58
Castles & Coltheart - 2
Regular Word Reading
-0.36 (0.97)
-0.7 (0.84)
0.30 0.10 to 0.50
0.003 0.330 0.11 to 0.55
Irregular Word Reading
-0.77 (0.8)
-0.71 (0.9)
-0.08 -0.28 to 0.12
0.45 -0.090 -0.32 to 0.14
Non-word Reading
0.01 (0.94)
-0.52 (0.76)
0.47 0.26 to 0.68
<0.001 0.521 0.29 to 0.75
12-month outcomes n = 108 n = 109
YARC – Passage Reading (Primary Outcome)
Reading Accuracy
89.08 (10.54)
89.45 (12.62)
1.36 -0.85 to 3.56
0.23 0.13 -0.08 to 0.33
Reading Rate
81.31 (11.02)
87.2 (10.42)
0.72 -2.12 to 3.56
0.62 0.06 -0.19 to 0.32
Reading Comprehension
90.1 (12.4)
89.5 (12.6)
-0.47 -3.51 to 2.58
0.76 -0.04 -0.28 to 0.21
YARC – Early Reading
Letter Sound Knowledge
101.91 (14.62)
80.57 (11.41)
7.43 4.08 to 10.78
<0.001 0.51 0.28 to 0.73
Early Word Recognition
82.34 (11.04)
93.85 (13.74)
-0.97 -3.26 to 1.33
0.41 -0.08 -0.27 to 0.11
Phoneme Awareness
94.6 (13.33)
83.32 (13.07)
2.67 -0.13 to 0.47
0.06 0.21 -0.01 to 0.44
Castles & Coltheart - 2
Regular Word Reading
-0.66 (0.9)
91.65 (11.51)
0.16 -0.06 to 0.37
0.15 0.17 -0.06 to 0.40
Irregular Word Reading
-0.89 (0.81)
-0.85 (0.92)
-0.11 -0.33 to 0.10
0.30 -0.12 -0.35 to 0.11
Non-word Reading
-0.49 (0.97)
-0.79 (1.05)
0.21 -0.02 to 0.43
0.06 0.22 -0.02 to 0.46

Evaluation Report | MiniLit 90
Table C4. Primary and Secondary outcomes at 12 months follow-up and six months follow-up
adjusting for a priori baseline confounders and taking cluster (school) into account
Intervention Mean (SD)
Control Mean (SD)
Mean diff.
(I – C)
CACE Analysis 95% CI
p- value
Effect size
Effect size
95% CI
Six-month outcomes n = 107 n = 107
YARC – Passage Reading
Accuracy 89.94 (11.42)
87.07 (10.29)
2.61 0.68 to 4.54
<0.01 0.24 0.06 to 0.42
Rate 78.76 (8.91)
78.42 (9.61)
0.66 -1.45 to 2.77
0.54 0.06 -0.17 to - 0.29
Reading Comprehension
85.05 (13.62)
83.7 (12.76)
0.34 -2.74 to 3.42
0.83 0.02 -0.21 to 0.26
YARC – Early Reading
Letter Sound Knowledge
109.47 (15.16)
95.93 (14.24)
13.01 9.71 to 16.30
<0.001 0.80 0.60 to - 1.01
Early Word Recognition
84.94 (11.85)
84.4 (13.23)
0.79 -1.15 to 2.73
0.43 0.06 -0.09 to 0.22
Phoneme Awareness
96.23 (12.47)
91.59 (12.58)
4.62 1.94 to 7.30
<0.001 0.37 0.16 to 0.58
Castles & Coltheart - 2
Regular word Reading
-0.36 (0.97)
-0.7 (0.84)
0.34 0.16 to 0.52
<0.001 0.37 0.17 to 0.57
Irregular Word Reading
-0.77 (0.8)
-0.71 (0.9)
-0.03 -0.20 to 0.13
0.70 -0.04 -0.23 to 0.15
Non-word Reading
0.01 (0.94)
-0.52 (0.76)
0.51 0.32 to 0.70
<0.001 0.57 0.36 to 0.78
12-month outcomes n = 108 n = 109
YARC – Passage Reading (Primary outcome)
Accuracy 89.08 (10.54)
87.2 (10.42)
1.82 -0.10 to 3.75
0.06 0.18 -0.01 to 0.36
Rate 81.31 (11.02)
80.57 (11.41)
1.17 -1.46 to 3.81
0.38 0.10 -0.14 to 0.33
Comprehension 90.09 (12.44)
89.45 (12.62)
-0.02 -2.93 to 2.89
0.99 -0.00 -0.24 to 0.23
YARC – Early Reading
Letter Sound Knowledge
101.91 (14.62)
93.85 (13.74)
7.11 3.79 to 10.44
<0.001 0.47 0.25 to 0.70
Early Word Recognition
82.34 (11.04)
83.32 (13.07)
-0.88 -3.17 to 1.42
0.46 0.07 -0.26 to 0.12
Phoneme Awareness
94.6 (13.33)
91.65 (11.51)
2.82 0.02 to 5.61
<0.05 0.23 0.01 to 0.45
Castles & Coltheart - 2
Regular Word Reading
-0.66 (0.9)
-0.85 (0.92)
0.19 -0.02 to 0.39
0.07 0.20 -0.02 to 0.42
Irregular Word Reading
-0.89 (0.81)
-0.79 (1.05)
0.07 -0.27 to 0.12
0.47 -0.08 -0.29 to 0.13
Non-word Reading
-0.49 (0.97)
-0.77 (0.88)
0.26 0.05 to 0.47
0.02 0.27 0.05 to 0.50
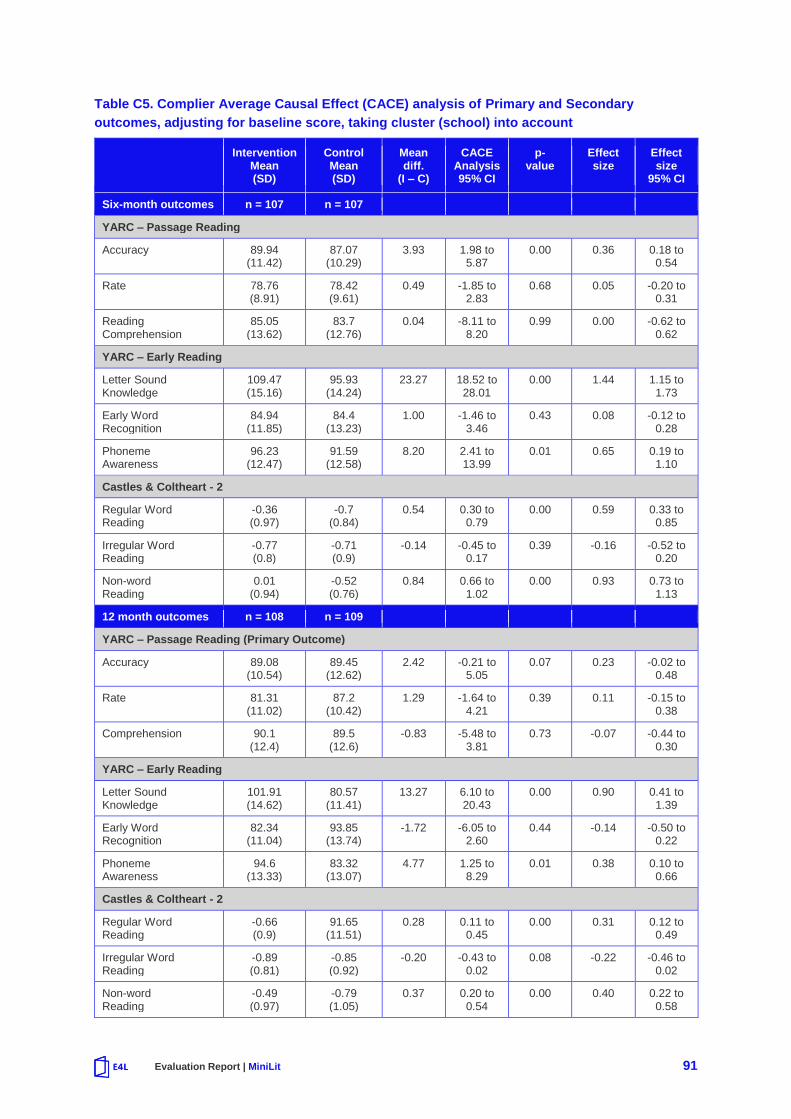
Evaluation Report | MiniLit 91
Table C5. Complier Average Causal Effect (CACE) analysis of Primary and Secondary
outcomes, adjusting for baseline score, taking cluster (school) into account
Intervention Mean (SD)
Control Mean (SD)
Mean diff.
(I – C)
CACE Analysis 95% CI
p- value
Effect size
Effect size
95% CI
Six-month outcomes n = 107 n = 107
YARC – Passage Reading
Accuracy 89.94 (11.42)
87.07 (10.29)
3.93 1.98 to 5.87
0.00 0.36 0.18 to 0.54
Rate 78.76 (8.91)
78.42 (9.61)
0.49 -1.85 to 2.83
0.68 0.05 -0.20 to 0.31
Reading Comprehension
85.05 (13.62)
83.7 (12.76)
0.04 -8.11 to 8.20
0.99 0.00 -0.62 to 0.62
YARC – Early Reading
Letter Sound Knowledge
109.47 (15.16)
95.93 (14.24)
23.27 18.52 to 28.01
0.00 1.44 1.15 to 1.73
Early Word Recognition
84.94 (11.85)
84.4 (13.23)
1.00 -1.46 to 3.46
0.43 0.08 -0.12 to 0.28
Phoneme Awareness
96.23 (12.47)
91.59 (12.58)
8.20 2.41 to 13.99
0.01 0.65 0.19 to 1.10
Castles & Coltheart - 2
Regular Word Reading
-0.36 (0.97)
-0.7 (0.84)
0.54 0.30 to 0.79
0.00 0.59 0.33 to 0.85
Irregular Word Reading
-0.77 (0.8)
-0.71 (0.9)
-0.14 -0.45 to 0.17
0.39 -0.16 -0.52 to 0.20
Non-word Reading
0.01 (0.94)
-0.52 (0.76)
0.84 0.66 to 1.02
0.00 0.93 0.73 to 1.13
12 month outcomes n = 108 n = 109
YARC – Passage Reading (Primary Outcome)
Accuracy 89.08 (10.54)
89.45 (12.62)
2.42 -0.21 to 5.05
0.07 0.23 -0.02 to 0.48
Rate 81.31 (11.02)
87.2 (10.42)
1.29 -1.64 to 4.21
0.39 0.11 -0.15 to 0.38
Comprehension 90.1 (12.4)
89.5 (12.6)
-0.83 -5.48 to 3.81
0.73 -0.07 -0.44 to 0.30
YARC – Early Reading
Letter Sound Knowledge
101.91 (14.62)
80.57 (11.41)
13.27 6.10 to 20.43
0.00 0.90 0.41 to 1.39
Early Word Recognition
82.34 (11.04)
93.85 (13.74)
-1.72 -6.05 to 2.60
0.44 -0.14 -0.50 to 0.22
Phoneme Awareness
94.6 (13.33)
83.32 (13.07)
4.77 1.25 to 8.29
0.01 0.38 0.10 to 0.66
Castles & Coltheart - 2
Regular Word Reading
-0.66 (0.9)
91.65 (11.51)
0.28 0.11 to 0.45
0.00 0.31 0.12 to 0.49
Irregular Word Reading
-0.89 (0.81)
-0.85 (0.92)
-0.20 -0.43 to 0.02
0.08 -0.22 -0.46 to 0.02
Non-word Reading
-0.49 (0.97)
-0.79 (1.05)
0.37 0.20 to 0.54
0.00 0.40 0.22 to 0.58

Evaluation Report | MiniLit 92
Table C6. Complier Average Causal Effect (CACE) analysis of Primary and Secondary
outcomes, adjusting for a priori baseline confounders, taking cluster (school) into account
Intervention Mean (SD)
Control Mean (SD)
Mean diff.
(I – C)
CACE Analysis 95% CI
p- value
Effect size
Effect size
95% CI
Six-month outcomes n = 107 n = 107
YARC – Passage Reading
Accuracy 89.94 (11.42)
87.07 (10.29)
4.68 2.41 to 6.94
<0.001 0.43 0.22 to 0.63
Rate 78.76 (8.91)
78.42 (9.61)
1.02 -0.91 to 2.94
0.30 0.11 -0.10 to 0.32
Reading Comprehension
85.05 (13.62)
83.7 (12.76)
0.53 -8.05 to 9.10
0.90 0.04 -0.61 to 0.69
YARC – Early Reading
Letter Sound Knowledge
109.47 (15.16)
95.93 (14.24)
23.18 18.64 to 27.72
<0.001 1.43 1.15 to 1.71
Early Word Recognition
84.94 (11.85)
84.4 (13.23)
1.41 -1.11 to 3.93
0.27 0.11 -0.09 to 0.31
Phoneme Awareness
96.23 (12.47)
91.59 (12.58)
8.31 2.27 to 13.36
0.01 0.65 0.18 to 1.05
Castles & Coltheart - 2
Regular Word Reading
-0.36 (0.97)
-0.7 (0.84)
0.61 0.37 to 0.85
<0.001 0.66 0.40 to 0.93
Irregular Word Reading
-0.77 (0.8)
-0.71 (0.9)
-0.06 -0.37 to 0.25
0.71 -0.07 -0.43 to 0.29
Non-word Reading
0.01 (0.94)
-0.52 (0.76)
0.91 0.71 to 1.12
<0.001 1.01 0.79 to 1.24
12 month outcomes n = 108 n = 109
YARC – Passage Reading (Primary Outcome)
Accuracy 89.08 (10.54)
87.2 (10.42)
3.28 0.27 to 6.30
0.03 0.31 0.03 to 0.60
Rate 81.31 (11.02)
80.57 (11.41)
1.92 -0.74 to 4.56
0.16 0.17 -0.07 to 0.41
Comprehension 90.09 (12.44)
89.45 (12.62)
-0.06 -4.80 to 4.68
0.98 0.00 -0.38 to 0.37
YARC – Early Reading
Letter Sound Knowledge
101.91 (14.62)
93.85 (13.74)
12.46 5.46 to 19.46
<0.001 0.85 0.37 to 1.32
Early Word Recognition
82.34 (11.04)
83.32 (13.07)
-1.56 -6.09 to 2.96
0.50 -0.13 -0.50 to 0.25
Phoneme Awareness
94.6 (13.33)
91.65 (11.51)
5.03 1.72 to 8.34
<0.01 0.40 0.14 to 0.67
Castles & Coltheart - 2
Regular Word Reading
-0.66 (0.9)
-0.85 (0.92)
0.33 0.13 to 0.53
<0.001 0.36 0.14 to 0.58
Irregular Word Reading
-0.89 (0.81)
-0.79 (1.05)
-0.14 -0.40 to 0.12
0.29 -0.15 -0.42 to 0.13
Non-word Reading
-0.49 (0.97)
-0.77 (0.88)
0.45 0.28 to 0.62
<0.001 0.49 0.31 to 0.67