mini-project report production of optimised metal foams...
TRANSCRIPT

Mini-project report
Production of Optimised Metal Foams for Stirling Engine Regenerators
Mr Krys Bangert
Jan – March 2010

1) Abstract: This report provides a summary of the experimental work carried out in the creation and testing of porous metal foam samples for use in a Stirling cycle engine. The aim of this study is to find the effects that different metal foam micro structures have upon the working fluid within a Stirling engine. A thermal flow test rig was constructed for the purpose of the study. Metal foam samples of a standardised size were created and tested using this apparatus. The flow test results obtained were compared to existing research data using the Dupuit-Forchheimer modification of Darcy‟s law. The thermal test data was compiled to compare the performance of the different porosity samples. Results from the study show that the wire samples produce the best overall thermal and flow performance. However, the metal foams can give very similar performance and be optimised to give particular properties. Keywords: Stirling engine; Regenerator; Metal Foam.
2) Introduction: The Stirling engine is a heat engine based upon the Stirling thermodynamic cycle. The engine produces a mechanical output when the enclosed working fluid (typically Air, He or H) is heated by an external energy source. The temperature gradients induced in the hot and cold regions of the engine cause the working fluid to expand and contract, moving a series of pistons and linkages to create the mechanical work. The engine was invented by Dr Robert Stirling in 1816, as a further development of the basic hot-air engines that were around at the time. One of the key modifications that Stirling made, which differentiated his design from the previous ones, was the addition of the „economiser‟ (or as it later became known, the regenerator) [3]. The regenerator allows the Stirling engine to achieve much higher thermal efficiencies by acting as a temporary heat store (or cooler) between the hot and cold regions of the engine. This effect enhances the cyclic heat flow within the working fluid and increases the overall efficiency. 65-70% of the Carnot cycle efficiency has been claimed to be achievable with modern technologies [4], but the typical values demonstrated are around 30-40% [2]. Due to the design improvements made by Stirling, the heat engine had a period of considerable success. In many cases, out-competing the steam engine, because of its much safer and quieter operation. However, due to the limited selection of materials available at the time, the engine was unable to fulfil its full design potential. This led to it being superseded by the internal combustion engine and the electric motor in the early 20
th century. Further development work wasn‟t carried out again on the design until 1937, when the
Dutch company Phillips started to look into the potential improvements that could be made by using modern engineering materials. Since that time many further improvements have been made upon Phillips‟s work. Research in the field has also intensified, driven by the need to find high efficiency prime movers that can operate using varying fuel sources (to help address the issue of climate change). However, there is still a lot improvement that needs to be made, in terms of reduced production costs and easier manufacturability, if the engine is going to be commercially adopted for energy applications. The Stirling regenerator is one of the parts that could benefit the most from redesign, due to its large cost and impact on the engine efficiency [5]. The current designs are highly efficient in simulation and tests (compared to traditional wire and fibre meshes) but they are still too complicated and expensive to mass-produce effectively [6, 7]. Metal foams could potentially offer a solution is this problem, due to their excellent fluid flow and thermal properties, coupled with cheap manufacturability. The foams can be manufactured using various different methods, but one of the most cost effective and easily adaptable is the replication process. In this process, salt grains of different sizes are used as a preform, which is subsequently infiltrated with a liquid metal. Once the metal cools, the salt is leached away from the structure (using water), leaving a porous foam. The overall porosity and permeability of the structure can be easily adapted using different variations of the preform design [8]. This mini project looks at the potential use of porous metal foams within the Stirling engine regenerator. Analysis is conducted into how variations of the foam structure (including material, porosity and permeability) affect the overall performance of the regenerator using experimental evidence. 3) Experiments/methodology The Stirling cycle: The ideal Stirling thermodynamic cycle operates in four distinct phases [2] (fig 1):
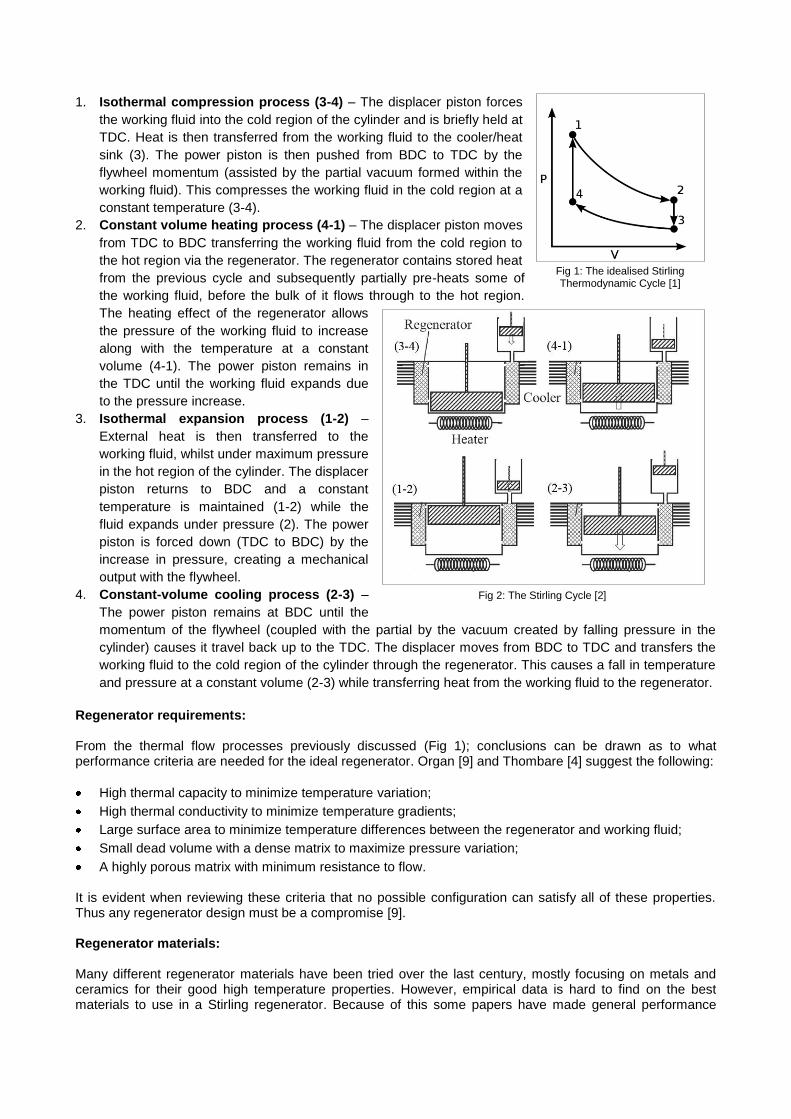
1. Isothermal compression process (3-4) – The displacer piston forces
the working fluid into the cold region of the cylinder and is briefly held at
TDC. Heat is then transferred from the working fluid to the cooler/heat
sink (3). The power piston is then pushed from BDC to TDC by the
flywheel momentum (assisted by the partial vacuum formed within the
working fluid). This compresses the working fluid in the cold region at a
constant temperature (3-4).
2. Constant volume heating process (4-1) – The displacer piston moves
from TDC to BDC transferring the working fluid from the cold region to
the hot region via the regenerator. The regenerator contains stored heat
from the previous cycle and subsequently partially pre-heats some of
the working fluid, before the bulk of it flows through to the hot region.
The heating effect of the regenerator allows
the pressure of the working fluid to increase
along with the temperature at a constant
volume (4-1). The power piston remains in
the TDC until the working fluid expands due
to the pressure increase.
3. Isothermal expansion process (1-2) –
External heat is then transferred to the
working fluid, whilst under maximum pressure
in the hot region of the cylinder. The displacer
piston returns to BDC and a constant
temperature is maintained (1-2) while the
fluid expands under pressure (2). The power
piston is forced down (TDC to BDC) by the
increase in pressure, creating a mechanical
output with the flywheel.
4. Constant-volume cooling process (2-3) –
The power piston remains at BDC until the
momentum of the flywheel (coupled with the partial by the vacuum created by falling pressure in the
cylinder) causes it travel back up to the TDC. The displacer moves from BDC to TDC and transfers the
working fluid to the cold region of the cylinder through the regenerator. This causes a fall in temperature
and pressure at a constant volume (2-3) while transferring heat from the working fluid to the regenerator.
Regenerator requirements: From the thermal flow processes previously discussed (Fig 1); conclusions can be drawn as to what performance criteria are needed for the ideal regenerator. Organ [9] and Thombare [4] suggest the following:
High thermal capacity to minimize temperature variation;
High thermal conductivity to minimize temperature gradients;
Large surface area to minimize temperature differences between the regenerator and working fluid;
Small dead volume with a dense matrix to maximize pressure variation;
A highly porous matrix with minimum resistance to flow.
It is evident when reviewing these criteria that no possible configuration can satisfy all of these properties. Thus any regenerator design must be a compromise [9]. Regenerator materials: Many different regenerator materials have been tried over the last century, mostly focusing on metals and ceramics for their good high temperature properties. However, empirical data is hard to find on the best materials to use in a Stirling regenerator. Because of this some papers have made general performance
Fig 1: The idealised Stirling Thermodynamic Cycle [1]
Fig 2: The Stirling Cycle [2]

conclusions based upon the different material properties when entered into experimental models [10] (Table 1).
Regenerator matrix metal
Volumetric capacity heat
(J/m3K)
Conductivity (W/m K)
Engine power (W)
Engine effectiveness
(%)
Exchanged energy in the
regenerator (J)
Steel 3.8465 x 10⁶ 46 4258 38.84 441.25
Stainless steel 3.545 x 10⁶ 15 4273 39.29 448.72
Copper 3.3972 x 10⁶ 389 - - -
Brass 3.145 x 10⁶ 100 4080 34.6 415.67
Aluminum 2.322 x 10⁶ 200 3812 29.16 378.03
Granite 2.262 x 10⁶ 2.5 4091 34.51 430.75
Glass 2.1252 x 10⁶ 1.2 4062 33.85 427.8
Table 1: Effect of nature of the regenerator metal on the engine performance [10]
Stainless steel is shown to be material with the greatest potential due to its high heat capacity and thermal exchange rate, but this data set is too small for firm conclusions to be made. The CES edupack software was used to see if any other materials correlated with similar thermal properties. The following selection limit criteria were applied:
A minimum melting point of 600°C – Based upon the maximum temperature achieved in the expansion
end of the Phillips MP1002CA Stirling engine [9].
A maximum thermal conductivity of 50 W/m.K – Based on the typical value of steel.
A minimum specific heat capacity of 500 J/kg.K – To ensure high heat retention.
The two plots made (Appendix 1&2) show that the main materials to pass are the Steels, Titanium alloys, Ceramics and foams. If processing and machining is taken into consideration most of the ceramics and oxides are not fit for purpose. This leaves steel, titanium and metal (aluminium)/ceramic foam (magnesium alloy are also on the borderline in temperature). These results show that there are other materials with similar or better properties to the Steels for use in a regenerator matrix. Aluminium is one of the most cheaply available metals and easy to manufacture into foam, so it will be used to create the samples. Stainless steel will also be used as a benchmark material. Regenerator geometry and flow requirements: The flow requirements of the regenerator have to be a compromise between porosity and maximum surface area. Therefore the geometry is crucial due to the subsequent effects it has on the engine performance. The hydraulic diameter, dead volume, velocity of the gas, regenerator heat transfer surface and regenerator effectiveness are all heavily influenced. Many different approaches have been tried to create a regenerator matrix, using differing geometries, including using wools, wire meshes, fine pipes, spring meshes, packed balls, foils and plates [4, 5, 7, 9, 11, 12], but the porosity value is seldom over 0.8. This value corresponds with Organ‟s work on the Phillips MP1002CA (which has a regenerator with same porosity). For the purpose of this study samples over this porosity will be not created, due to the poor regenerator performance inherent at such high levels. The geometry of the regenerator test samples will be treated as a series of perfectly spherical pores, to avoid complications in the analysis and make the results comparable with the paper by Despois and Mortensen [13]. Note: When the porosity increases beyond a critical point the engine performance decreases, due to increased external conduction and lack of thermal transfer with the working fluid (effectively the same as if there is no regenerator present)[9, 10]. Sample production: The foam samples were produced using a two different preform variations of the replication method, as described by Banhart [8]. All of the samples were manufactured to the same cylindrical dimensions of a 0.02m (Ø) x 0.012m (L) (wire sample included). Salt grain replication technique: Two different samples (1&2) were manufactured using this method [8]. The space holder, NaCl (Table salt) was characterised into two grain sizes using selective wire sieves. The two sizes selected were 0.85-1mm (sample 2) and >1mm (sample 1). Both sample preforms were weighted in the ratio of 22g Al (99.9% pure) to

18g of NaCl. Each preform was assembled in a standard laboratory glass crucible with a 1mm hole machined into the bottom to allow for gas flow. The NaCl was compacted into the crucible first, followed by the Al (cut into 15mm
3 with the oxide removed) (see fig 3).
The crucible was then fixed into a sealed clamping mechanism and heated by an induction heating coil. Pressurised Boron gas (at 1 bar) was passed through the apparatus and out of the crucible simultaneously (appendix 3). The pressure of the gas causes the Al to infiltrate the NaCl preform when it has reached its melting point. When the Al has propagates to the end of the crucible, the heater and the gas supply is switched off and the sample is allowed to cool. The sample is then machined to the standard size and left in water to leach out the NaCl. Dough replication technique: This process uses the same method as described by Goodall and Mortensen in their paper [14]. The preform spheres were manufactured to a diameter of 5mm, with a ratio of 34.2g NaCl to 8.4g Flour. The preform was again assembled in the same way, with the spheres at the bottom of the crucible and the Al on top. The infiltration and leaching was also carried using the same method as mentioned previously (appendix 3) Wire sample manufacture: This sample was created from a solid stainless steel cylindrical core of 0.008m (Ø) x 0.012m (L) and 12.25m of 99.9% stainless steel wire, with a Ø 0.00025m. The Wire was tightly coiled around the steel core to form a cylindrical shape with the same standardised volume as the other samples. The sample was designed to have a porosity of 0.8. Reference sample: To give a reference point for the tests, a sample was manufactured out of solid Al (99.9%) using the same standard dimensions. To allow minimum fluid flow a 0.6mm hole was drilled through the centre. Sample characterisation: The samples were characterised using a combination of techniques. The first was using the weight, volume and density to calculate the porosity of each sample using the following equation:
Porosity
The average pore sizes were then characterised using two methods: 1. Scanning the samples with a scale axis using a computer scanner (see appendix 4). Each visible pore
was then measured to get an average diameter. This diameter was then multiplied by 3/2 to account for
the average 3d spherical pore size within the sample.
2. The second method used optical microscopy to perform the same function, after the sample was infiltrated with resin.
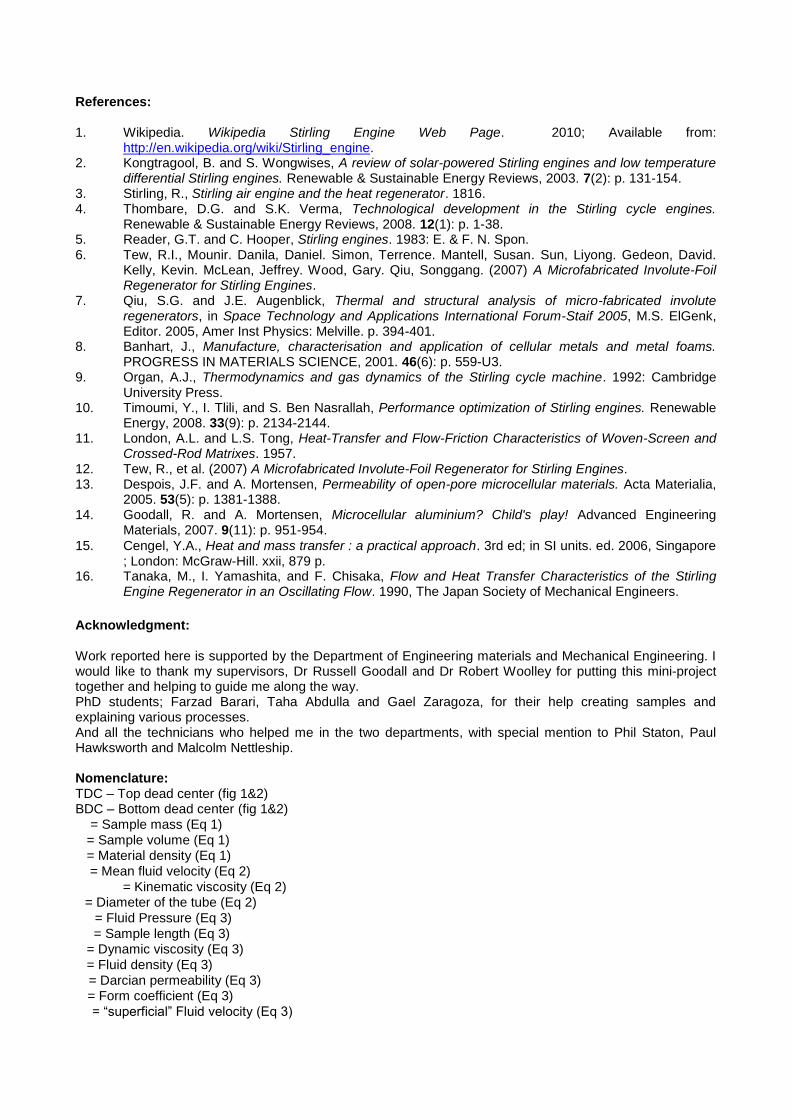
The porosity data for each sample is included in appendix 5. Sample test rig: A thermal flow test rig was constructed to test the samples performance with heat transfer and fluid flow (appendix 6). The samples were mounted and held in place by the brass compression fitting linking the two sections of copper pipe together. Workshop compressed air was regulated by a rotometer and blown through the pipe work and sample. Heating was provided by a rope heater coiled around the first section of pipe, the heater was regulated by a programmable digital controller unit. Pressure readings were taken using a manometer connected before and after the sample, similarly temperature readings were taken before and after the sample using stripped type K thermocouples. The thermal readings were taken using a computer data logger and the pressure readings were taken manually.
Fig 3: Replication preform

Experimental method: Test 1 – Sample air flow The first test carried out was to calculate the average pressure drop across the samples under different flow rates. The shop air was calibrated to run at 2 bar pressure and the each sample in turn was mounted in the compression fitting. Eight pressure readings were taken per sample at flow rates ranging from 10 to 45 L/min (in 5 L/min intervals). The test procedure was repeated 3 times and the average flow reading per sample was calculated. Test 2 – Sample thermal performance The second test was to calculate the thermal absorption across the samples under constant flow rates. The shop air was calibrated to run at 2 bar pressure and the rotometer was set to run at 30 L/min when the air
flow was activated. The heater regulator was set to 200°C and allowed to heat up for 10 minutes prior to the
experiment taking place. The samples were again mounted in the compression fitting but the two sections of pipe were not connected until the 10 minute heating period was complete (to avoid thermal conduction through the sample). The pipes were then connected, air supply turned on and the thermal readings taken for a period of 30 seconds per sample. In between each test the pipes were left disconnected and the air turned off, to allow the temperature of the post sample thermocouple to return to ambient. 4) Results: The results for the two tests were compiled into Microsoft excel to produce graphs (see appendix 7 & 8). Two extra sets of results were plotted on the thermal graph, showing the average ambient air and before sample temperatures for reference. The pressure readings after the samples (Test 1) were discounted from the results due to the readings been too small to read on the apparatus used. For the purpose of the study the pressure drop will be calculated against atmospheric pressure.
5) Conclusions and further work. Test 1: The results from test 1 (appendix 7) show a correlation between the sample porosity and pressure. This is to be expected, as the porosity value increases there is less material in the sample to interfere with the fluid flow. However this does not take into account the flow characteristics of the fluid, permeability of the samples or the surface area for heat transfer. Due to the contradictory set of required for a Stirling regenerator all of these factors must be taken into account, to prove which sample would be the most effective regenerator. Firstly the fluid flow through the pipe needs to be characterised, so an appropriate analysis can be conducted. This is done by calculating the Reynolds number with the following equation [15]:
The Reynolds numbers for the fluid flow used in the experiment are between 702 and 3160 (see appendix 9). This indicates a laminar fluid flow up to 30 L/min and transitional flow beyond that [15]. Because of this, the Dupuit-Forchheimer modification of Darcy‟s Law (below) can be used to find the permeability of the samples. This variation of Darcy‟s law is needed because in some of the lower readings, the fluid could possibly be in a region of transition from viscosity to inertia dominated flow. This value of Re typically around 0.1 but can vary by several orders of magnitude depending on the pore diameter [13].
The equation was rearranged to give:
A graph was subsequently plotted using the following arrangement to find the value of and for each sample (see appendix 10):
→ → → →
Where: and

When the permeability values were normalised (by the average pore size squared ) and plotted against the volume fraction solid ( ), the results were compared with other porous foams tested in the paper by Despois [13] (see appendix 11,12). Unfortunately, not all the sample results correlate with these findings; this could be due to the differing flow rates and a number for factors (see „future work‟ below). However, the results do show that the samples perform with a similar correlation to the porosity/ flow rate measurements mentioned previously. One exception been the dough process (sample 3) having a larger permeability than sample 2. The wire sample (5) has the best overall fluid flow performance due to having the highest porosity and permeability. This could be attributed to its larger pore diameter as a result of the loose winding process. Sample 1, also showed good performance, even with a much lower porosity than the wire sample the permeability is almost the same. This could be could be a result of the large pore size and good „window‟ connectivity facilitation large inertial flow [13]. The sample 2 could have lower permeability due to smaller „windows‟ interconnections and have a greater proportion of viscous flow within the matrix. Sample 3 could have outperformed sample 2 also for this reason, even with a smaller porosity, the larger but fewer pore „windows‟ could be compensating by allowing greater inertial flow through the sample. Test 2: The results in appendix 8 show that the solid sample (4) absorbs the largest amount of heat, which was expected due to the extremely small porosity (effectively 0) and restriction of flow through to the second thermocouple. The wire sample (5) again performs better than the foams, absorbing nearly as much heat as the solid sample. The medium porosity foam sample (2) performs the best of the foams, followed by the sample 3 (dough process) then sample 1. These results can be explained by differences in pore surface area, the wire and medium porosity samples (5,2) both have the largest so will have a greater ability to absorb heat via surface conduction. The dough process sample (3) outperforms sample 1 in this test, even though it has a smaller surface area. This can be explained by the lower permeability value of sample 3, it takes the fluid longer to propagate through the sample, allowing more time for surface conduction. Conclusions: The results from the two tests clearly show that the steel wire mesh sample (5) has the best overall thermal and flow properties. This sample was expected to perform well due to its widespread use in Stirling engine designs [5, 9]. The tests have also shown that the metal foams can produce a very similar performance compared to the established wire design. The tests also prove that variations in the foam structure can lead to different levels of thermal and flow performance, suggesting that the metal foams could be well utilised in a Stirling engine regenerator and optimised to work with the engine design. Future work: There are many improvements that can be made to the experimental method and apparatus, the following issues need to be addressed in later work. The test rig is currently only capable of producing steady flow scenarios, in a Stirling engine the regenerator is under constant cyclic turbulent flow, so a direct comparison of performance cannot be made. The fluid pressure and temperature inside most Stirling engines are also much higher, so the sample performance will not be representative. A modification of an existing Stirling engine to accept samples or a redesign of the test rig to incorporate some of the features suggested in the paper by Tanaka et all [16], could possibly remedy this problem. The material selection also does not take into account the temperature fluctuations in the hot region of the engine; some papers suggest that the regenerator should be able to handle 4-5 times the load of the heater [4], this would mean that Aluminium‟s melting point is too low for effective use. The pressure and temperature measurements also need to be improved with higher frequency of measurements and greater accuracy. Control of the air flow also needs to be improved; the shop air used for the experiments was inconsistent. The copper tubing and method of heating the air in the test rig can also give false readings due to conduction losses and thermal lag. This could be addressed by using a pipe work with a lower thermal conductivity and an in pipe heating element. The compression fitting holding the samples also was not airtight, allowing air past the samples. This could be improved by using a rubber seal around the samples. The wire sample dimensions were slightly different to the other standard samples, due to difficulties in the winding process; this could have skewed the data slightly. Another way of creating the wire sample needs to be investigated. A greater selection of samples with different materials and porosities would help to expand the data set.
References:
1. Wikipedia. Wikipedia Stirling Engine Web Page. 2010; Available from: http://en.wikipedia.org/wiki/Stirling_engine.
2. Kongtragool, B. and S. Wongwises, A review of solar-powered Stirling engines and low temperature differential Stirling engines. Renewable & Sustainable Energy Reviews, 2003. 7(2): p. 131-154.
3. Stirling, R., Stirling air engine and the heat regenerator. 1816. 4. Thombare, D.G. and S.K. Verma, Technological development in the Stirling cycle engines.
Renewable & Sustainable Energy Reviews, 2008. 12(1): p. 1-38. 5. Reader, G.T. and C. Hooper, Stirling engines. 1983: E. & F. N. Spon. 6. Tew, R.I., Mounir. Danila, Daniel. Simon, Terrence. Mantell, Susan. Sun, Liyong. Gedeon, David.
Kelly, Kevin. McLean, Jeffrey. Wood, Gary. Qiu, Songgang. (2007) A Microfabricated Involute-Foil Regenerator for Stirling Engines.
7. Qiu, S.G. and J.E. Augenblick, Thermal and structural analysis of micro-fabricated involute regenerators, in Space Technology and Applications International Forum-Staif 2005, M.S. ElGenk, Editor. 2005, Amer Inst Physics: Melville. p. 394-401.
8. Banhart, J., Manufacture, characterisation and application of cellular metals and metal foams. PROGRESS IN MATERIALS SCIENCE, 2001. 46(6): p. 559-U3.
9. Organ, A.J., Thermodynamics and gas dynamics of the Stirling cycle machine. 1992: Cambridge University Press.
10. Timoumi, Y., I. Tlili, and S. Ben Nasrallah, Performance optimization of Stirling engines. Renewable Energy, 2008. 33(9): p. 2134-2144.
11. London, A.L. and L.S. Tong, Heat-Transfer and Flow-Friction Characteristics of Woven-Screen and Crossed-Rod Matrixes. 1957.
12. Tew, R., et al. (2007) A Microfabricated Involute-Foil Regenerator for Stirling Engines. 13. Despois, J.F. and A. Mortensen, Permeability of open-pore microcellular materials. Acta Materialia,
2005. 53(5): p. 1381-1388. 14. Goodall, R. and A. Mortensen, Microcellular aluminium? Child's play! Advanced Engineering
Materials, 2007. 9(11): p. 951-954.
15. Cengel, Y.A., Heat and mass transfer : a practical approach. 3rd ed; in SI units. ed. 2006, Singapore ; London: McGraw-Hill. xxii, 879 p.
16. Tanaka, M., I. Yamashita, and F. Chisaka, Flow and Heat Transfer Characteristics of the Stirling Engine Regenerator in an Oscillating Flow. 1990, The Japan Society of Mechanical Engineers.
Acknowledgment: Work reported here is supported by the Department of Engineering materials and Mechanical Engineering. I would like to thank my supervisors, Dr Russell Goodall and Dr Robert Woolley for putting this mini-project together and helping to guide me along the way. PhD students; Farzad Barari, Taha Abdulla and Gael Zaragoza, for their help creating samples and explaining various processes. And all the technicians who helped me in the two departments, with special mention to Phil Staton, Paul Hawksworth and Malcolm Nettleship. Nomenclature: TDC – Top dead center (fig 1&2) BDC – Bottom dead center (fig 1&2)
= Sample mass (Eq 1)
= Sample volume (Eq 1) = Material density (Eq 1)
= Mean fluid velocity (Eq 2)
= Kinematic viscosity (Eq 2) = Diameter of the tube (Eq 2)
= Fluid Pressure (Eq 3)
= Sample length (Eq 3) = Dynamic viscosity (Eq 3)
= Fluid density (Eq 3)
= Darcian permeability (Eq 3) = Form coefficient (Eq 3)
= “superficial” Fluid velocity (Eq 3)

Appendix 1: CES Material selection graph 1 – Specific heat capacity compared to melting point.
Appendix 2: CES Material selection graph 2 – Specific heat capacity compared to thermal conductivity

Appendix 3: Foam infiltration apparatus Appendix 4: Test samples
6
3
2
1
4
5
1) Boron Gas canisters (x2) 2) Sealed clamping mechanism 3) Coil heater 4) Actuator control switch 5) Connecting pipe work 6) Induction heater
Miniature foam test rig
Top left: Sample 2 – Medium porosity foam. Top right: Sample 3 – Dough process foam. Bottom left: Sample 1 – Taha‟s High porosity foam. Bottom right: Sample 5 – Wire sample.
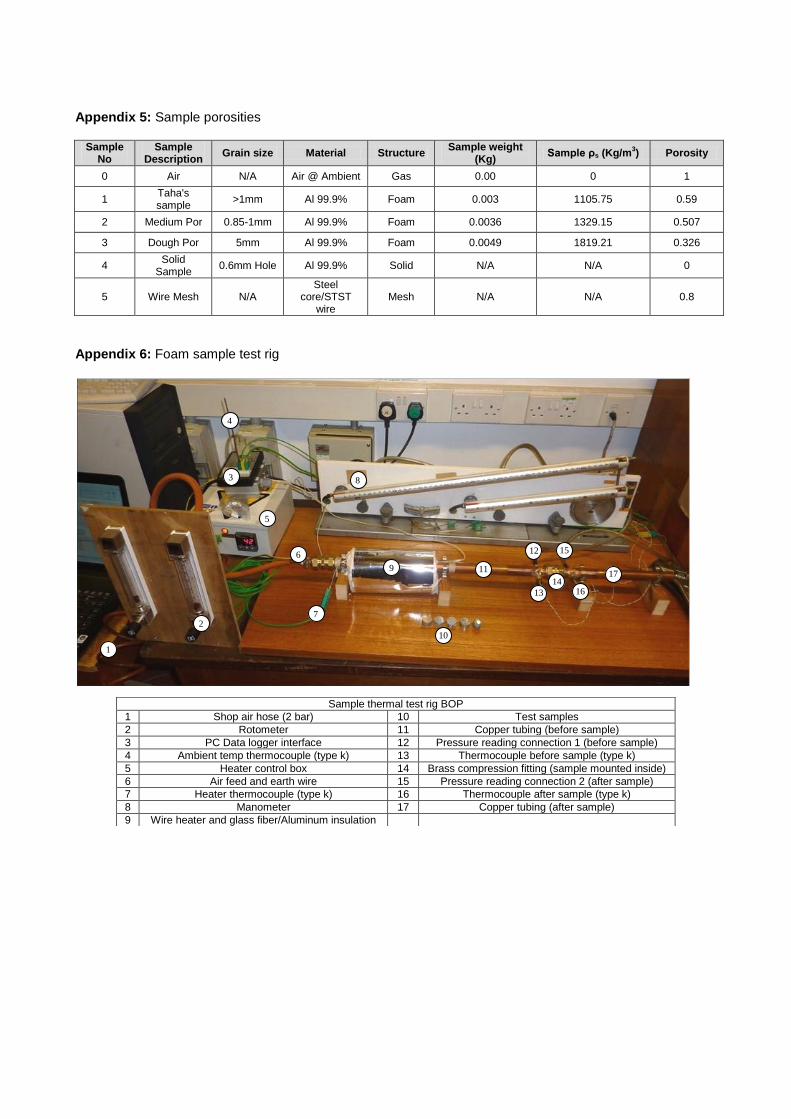
Appendix 5: Sample porosities
Sample No
Sample Description
Grain size Material Structure Sample weight
(Kg) Sample ρs (Kg/m
3) Porosity
0 Air N/A Air @ Ambient Gas 0.00 0 1
1 Taha's sample
>1mm Al 99.9% Foam 0.003 1105.75 0.59
2 Medium Por 0.85-1mm Al 99.9% Foam 0.0036 1329.15 0.507
3 Dough Por 5mm Al 99.9% Foam 0.0049 1819.21 0.326
4 Solid
Sample 0.6mm Hole Al 99.9% Solid N/A N/A 0
5 Wire Mesh N/A Steel
core/STST wire
Mesh N/A N/A 0.8
Appendix 6: Foam sample test rig
Sample thermal test rig BOP
1 Shop air hose (2 bar) 10 Test samples
2 Rotometer 11 Copper tubing (before sample)
3 PC Data logger interface 12 Pressure reading connection 1 (before sample)
4 Ambient temp thermocouple (type k) 13 Thermocouple before sample (type k)
5 Heater control box 14 Brass compression fitting (sample mounted inside)
6 Air feed and earth wire 15 Pressure reading connection 2 (after sample)
7 Heater thermocouple (type k) 16 Thermocouple after sample (type k)
8 Manometer 17 Copper tubing (after sample)
9 Wire heater and glass fiber/Aluminum insulation
1
2
5
3
4
6
8
7
9
10
0
12
0
13
0
15
0
16
0
14
0
11
0 17
0

Appendix 7: Test 1 – Sample air flow results
Appendix 8: Test 2 – Sample thermal performance results
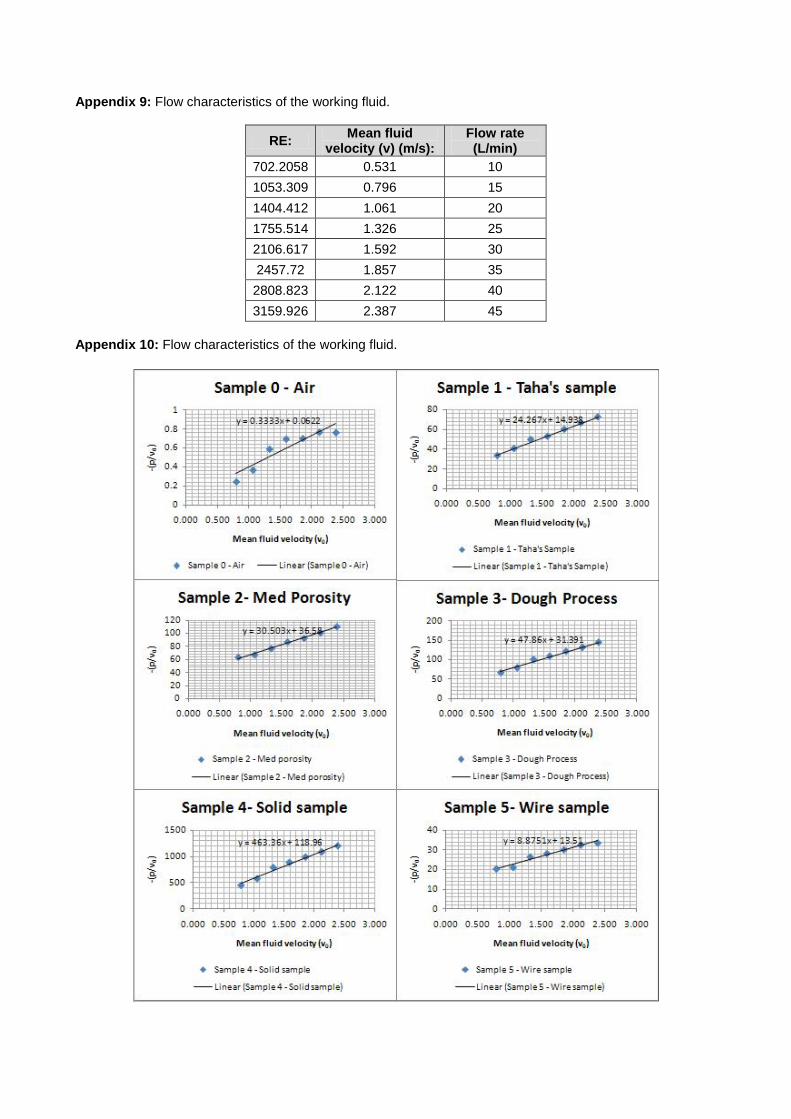
Appendix 9: Flow characteristics of the working fluid.
RE: Mean fluid
velocity (v) (m/s): Flow rate (L/min)
702.2058 0.531 10
1053.309 0.796 15
1404.412 1.061 20
1755.514 1.326 25
2106.617 1.592 30
2457.72 1.857 35
2808.823 2.122 40
3159.926 2.387 45
Appendix 10: Flow characteristics of the working fluid.
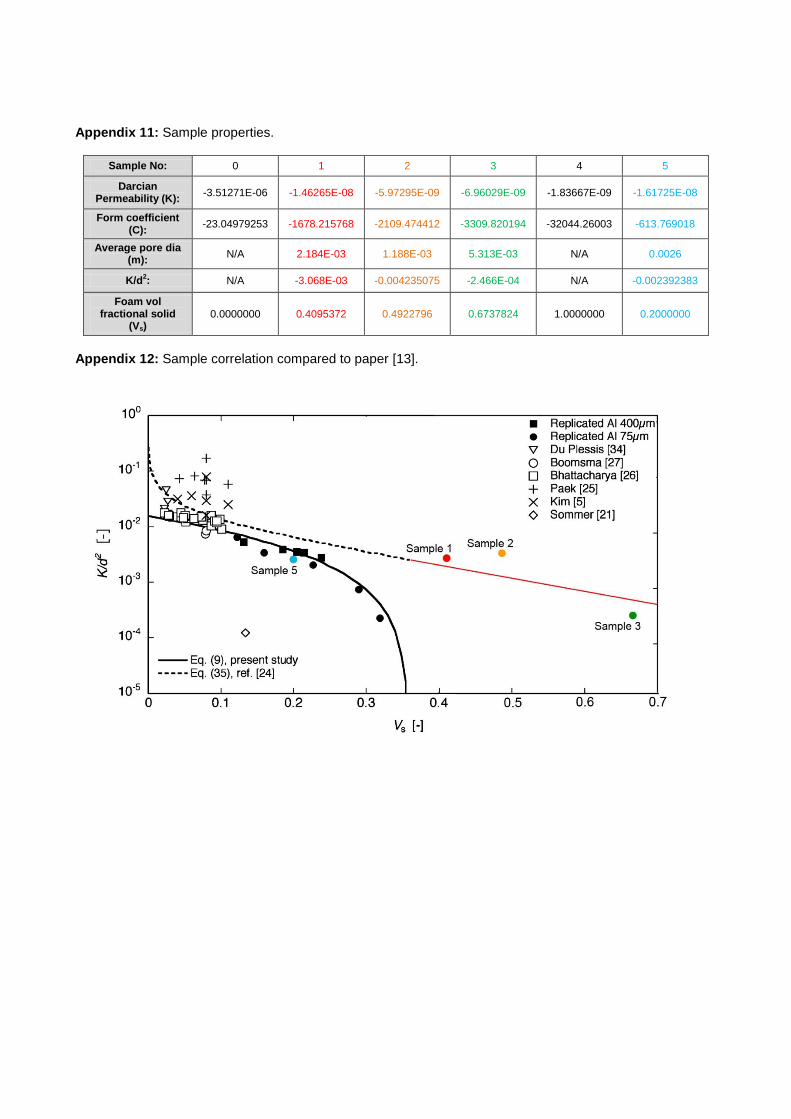
Appendix 11: Sample properties.
Sample No: 0 1 2 3 4 5
Darcian Permeability (K):
-3.51271E-06 -1.46265E-08 -5.97295E-09 -6.96029E-09 -1.83667E-09 -1.61725E-08
Form coefficient (C):
-23.04979253 -1678.215768 -2109.474412 -3309.820194 -32044.26003 -613.769018
Average pore dia (m):
N/A 2.184E-03 1.188E-03 5.313E-03 N/A 0.0026
K/d2: N/A -3.068E-03 -0.004235075 -2.466E-04 N/A -0.002392383
Foam vol fractional solid
(Vs) 0.0000000 0.4095372 0.4922796 0.6737824 1.0000000 0.2000000
Appendix 12: Sample correlation compared to paper [13].