mini course ihi national quality...
TRANSCRIPT

12/10/2012
1
M24: Enhancing Primary Care Value in Managing
Care
Faculty Team:
Brenda Reiss-Brennan
Karen Boudreau
These presenters have
Nothing to disclose
Mini Course IHI National Quality Forum
Course Objectives:
1) To create a set of values and outcomes that make the most difference in the lives of individuals and communities
2) To build a framework for enhancing the quality of primary care through designing relational networks
3) To define how to measure whether a health system delivers on these values and desired outcomes

12/10/2012
2
Agenda: Enhancing Primary Care Value at an Affordable Cost to the Community
I. Introduction & Value Stories
a. Social Context of Healthy Communities
b. Value Exercise: What matters most?
c. Social Context Community Value Examples: Intermountain MHI and IHI Triple Aim Sustainable Lessons
d. Consensus Principles: Value Consumer & Family Defined
II. “We build it, We will come” : Health Center Social Network Design Experience
a. Monitoring value “gaps”: Reciprocity Science & Quality Banks
b. Health Center Site Visits & Value Measures Presentations
III. Occupy Health through our Neighborhoods
a. How do we make this happen?
b. What exchanges do we need to empower social responsibility and community stewardship?
Americans Don’t Feel As Healthy As We Used To
DDB Needham Life Style survey archive, 1975-1999. Putnam, R. Bowling Alone,2000
Is this necessarily the result of declining social capital ?

12/10/2012
3
In 2009 Doctors Wrote More Psychiatric Scripts Than There Were People in this Country
Good Life Style. May 11, 2010.
Rise of Chronic Disease
Milken Institute Chronic Disease Index

12/10/2012
4
Multiple Conditions Increase Complexity
Milken Institute Chronic Disease Index
Mrs. WatsonProblem List:
• Diabetes• Hypertension• Mild congestive heart failure• Arthritis• MCI
Reasons for visit (with her husband): Hip and knee pain, no energy,
questions about medicines, dizziness, low blood sugar and a
recent fall.
The rest of the story:
Not leaving houseNot sleeping
CrankyHusband exhausted

12/10/2012
5
9
In 2009 doctors wrote more psychiatric scripts than there were people in this country
Good Life Style. May 11, 2010.

12/10/2012
6
Declining Perceptions of Honesty and Morality, 1952-1998
Putnam, R. Bowling Alone, 2000, pg 139. Ben Gaffin and Associates 1965-1976, Washington Post Gallop Survey, 1998.

12/10/2012
7
TV Watchers Don’t Keep in TouchDDB Needham Life Style survey archive, 1975-1999. Putnam, R. Bowling Alone,2000
Americans Don’t Feel As Healthy As We Used ToDDB Needham Life Style survey archive, 1975-1999. Putnam, R. Bowling Alone,2000
Is this necessarily the result of declining social capital ?

12/10/2012
8
Is there NO Magic Pill ?
Milken Institute, 2010
Whose Morale Obligation is it to care about the quality of our life, our resources?
Do these chronic diseases have a message for us?
“The body communicates to the world and the world becomes expressed through the body. The body feels and expresses social problems”
(M Merleau-Ponty 1963; A Kleinman, 1985)

12/10/2012
9
Social Capital in America
Connections within and between social networks
Value of social relations
Role of cooperation and confidence to
attain collective economic results
Health Is Better in High-Social-Capital States
Kawachi, I. et al (1997). “Social Capital, Income Inequality and Mortality” American JOUrnal of public Health 87: 1997, 1491-1495. Putnam, R. Bowling Alone, 2000
“As a rule of thumb, if you belong to no
groups but decide to join one, you cut your risk of dying over the next year in half. If
you smoke and belong to no groups, it’s a toss-up statistically whether you should
stop smoking or start joining..its easier to join a group than to
loose weight, exercise regularly or quit
smoking (pg 331).

12/10/2012
10
Social Capital and Tolerance Go TogetherGeneral Social Survey archive, 1974-1998. Putnam, R. Bowling Alone,2000
Social Capital and Economic Equality Go TogetherKawachi, I. et al (1997). “Social Capital, Income Inequality and Mortality” American Journal of public Health 87: 1997, 1491-1495. Putnam, R. Bowling Alone, 2000

12/10/2012
11
Having a good life?Brim OG, C.D. Ryff, and R.C. Kessler, Editors. (2004) How Healthy are We?: A National Study of Well-Being at
Midlife, University of Chicago Press: Chicago.
“Adult Americans rate the development of
relationships with others as the most
important factor in having a good life,
followed by health, then family.”
The Mobile Phone has become the new garden fence: The Joy of Texting
Social Grooming relieves Stress & Boosts Immune System
Dunbar, R. (1996) Grooming, Gossip and the Evolution of Language . Faber and Faber.

12/10/2012
12
A Blue Zone is a region of the world where people commonly live active lives past the age of 100 years. Scientists and demographers have classified these longevity hot-spots by having common healthy traits and life practices that result in higher-than-normal longevity. The name Blue Zone seems to have been first employed in a scientific article by a team of demographers working on centenarians in Sardinia in 2004. Buettner, D. 2010. The Blue Zone: Lessons for Living Longer. National Geographic Society.
The Value of Social Context
Long Enduring CPR Institutions
Careful assessment of the condition of resources & boundary definition
Method of allocating resources: Collective choice
Reciprocal monitoring results and relationships
Local participants have say in modifying methods, sanctions and incentives
Governing the Commons: The Evolution of
Institutions for Collective Action
Elinor Ostrom, 2009 Nobel
12/10/2012
13
Relationships Have a Cost
Transaction Costs: (North, D. 1999. Institutions, Institutional Change & Economic Performance. Cambridge University Press)
Knowledge transfer local values and norms
Incomplete information
Limited mental capacity
Measuring the value of the exchange
Enforcing agreements
Performance of economies over time
Today a “good doctor”
Emotionally intelligent
Team player
Obtain information from colleagues and technology
Embrace quality improvement
Use guidelines with compassion
Swensen, et al . 2011 NEJM
“The Revolution in Health Care Delivery”

12/10/2012
14
Quality and Safety + Healing for Life =Relational Health & Relational Economics
Do No Harm
Listen to the Patient
Include the Family
Manage the Process
Nurture your Teams
Reduce Costs & Waste
Community Stewardship
“Obstacles can boost flexibility and performance” WSJ November 26, 2011 Chains That Set us Free.

12/10/2012
15
Is Exchange the Key to delivering Value
for the Consumer ?
Created by the combined efforts of providers and staff over the full cycle of care
Any one intervention depends on the effectiveness of the other intervention (Porter, 2010 NEJM)
Effective and fulfilling relationships are the key to efficiency and happiness (aka) quality of life
Who will measure what matters most?
Valuing Our Voices
“When you are caring for your physical and mental health, what do we need to know that matters most to you and your family? .....What do we need to understand? “

12/10/2012
16
The Quality and Cost Impact of Intermountain’Mental Health Integration (MHI)
• To share our implementation science journey
• To describe Intermountains’ clinical integration high value delivery structure: Primary Care Clinical Program (PCCP)
• To demonstrate results of Mental Health Integration (MHI) team intervention impact on the quality, experience, and cost of chronic disease
Intermountain’ s High PerformanceHealth and Cost Comparison by State
Source: Healthiness – United Health Foundation; Total Health Cost – Kaiser Family Foundation
Worst Health Best HealthMost
Affordable
LeastAffordable
Utah
MAMN
VT
ND
LA
TN
SC
MSAR
HI
NH
GA
CT
WI
ME
RI
SD
NJNE
IA
CO
ID
OR
VA
CA
AZWY
TXOK
NM
NC
NV
AL
WV
FLKY
MO
DE
NYAK
PA
OH
MD
IN
IL
MI
MT
WA
KA

12/10/2012
17
Intermountain’ s Strategy:Clinical Integration
Focus on the Six Dimensions of Extraordinary Care:
• Clinical Excellence
• Operational Excellence
• Service Excellence
• Physician Engagement
• Employee Engagement
• Community Stewardship
“…high-quality care at costs below average.”
Barack Obama
“Getting to the root of the problem”
Four Habits of High-Value Health Care Organizations
Bohmer, R. NEJM, December, 2011
Specification and Planning
Infrastructure Design
Measurement and Oversight
Self-Study

12/10/2012
18
Make it easy to do it right:
• Standard line of clinical thought (CPM)
• Be willing to function in a group
• Align clinical data to work process
• Reduce variation & waste
Facilitating, encouraging, supporting patient/family self management (MHI)
Build sustainable community relationships (MHI)
Clinical Program Organizational Culture
Integration & Co-Production Integration Defined
To form, coordinate, or blend into
a functioning or organized whole: Unite
Functioning in a group with standard clinical line of thought (CPM)

12/10/2012
19
Intermountain Medical Group
Diverse group of clinics and services
•152 primary and secondary care clinic sites
•32 urgent care locations
•9 occupational health locations
•2 on-site employer clinics
•5 community/school clinics
•17 retail pharmacies
4633 employees
•913 physicians
•211 advance practice clinicians
Clinical Integration: Management of Complex Chronic Disease Primary Care Clinical Program
2/3 – cared for routinely in primary care 1/6 1/6
Diabetes, Asthma, Heart Disease, Depression, Obesity, Chronic Pain, SA, etc.
Patient & Family, PCP, and Care Manager (CM) as needed
PCP, CM +mental health
as needed
PCP with MHI Specialist
Consult
*Primary Care Physician (PCP) includes: General Internist, Family Practitioner, Pediatrician
Mental Health Integration Infrastructure

12/10/2012
20
Healing for LifeHealth Care is Delivered Through
Relationships
Brent James, 2011
What is Mental Health Integration clinical program at Intermountain?
A standardized clinical and operational
team relational process that
incorporates mental health as a
complementary component of
wellness & healing for life
* Mental Health includes Substance Abuse Recovery

12/10/2012
21
What is Mental Health Integration ?Enhancing Primary Care Value
Sustaining Outcomes
To support Primary Care Providers and MHI Team members with best practices in an effort to:
• Reach as many families as possible
• Improve quality of life
• Increase satisfaction
• Reduce practice burden
• Decrease costs to the system
• Engage community resources
Primary Care ClinicSecondary Care Clinic
Hospital Campus Clinic Multispecialty Clinic
Clinical
Quality
Patient Experience Cost of Care
RNC, Care Manager OD, AOD, Clinic Manager
Medical Directors
Primary Care Clinical Program
The Triple Aim and Shared Accountability

12/10/2012
22
0
10
20
30
40
50
60
70
80
90
1998 1999 2000 2001 2002 2003 2004 2005 2006 2007 2008 2009 2010 2011
Routine
Adoption
Planning
79 clinics461,550 patients79 clinics461,550 patients
1 clinic26,265 patients1 clinic26,265 patients
MHI Team Growth 1998-2011
* Includes 6 community based school clinics low income
Mental Health Integration
5 Key Components
Primary Care Clinical Program

12/10/2012
23
I. Leadership & Cultural Integration
Quality Investment
Local Champions
Practice Teams
Accountability
Co-production
• Train all
• Treat all
• Connect all
Care Manager
Health Advocates
Psychiatrist or Psychiatric NP
Therapist (Psychologist, LCSW, EAP)
Peer Mentor
Community Resources:
CHADD
NAMI
Community Therapists
Physical Therapists
Nutritionist
Pharmacists
Clinic Staff:RN, MA, Reception, Billing
Personalized Primary Care
Our Patients and their Families
Information Technology / EMR / Data / TelehealthClinic Manager
II. Work Flow: MHI Team Roles

12/10/2012
24
ROUTINE CAREMild Complexity
PCP and Care ManagerResponsive
Family SupportGS=1-3
COLLABORATIVE MHI TEAM
Moderate ComplexityComplex Co-morbidities
Family Isolated or ChaoticGS=4-5
MENTAL HEALTH TEAMHigh Complexity
Psychiatric Co-morbiditiesFamily Support Variable
High Social Burden Danger Risk
GS=6-7
Case IdentificationShared Decision Making
MHI Packets
II. Work Flow: MHI Treatment Cascade
“Isolated”Disconnected/Avoidant
“Burnt out”Confused/Chaotic
“Available in use”
Balanced/Secure
Family Engagement Patterns“Who do you most commonly go to or talk to when you are
distressed or don’t feel well?”
Can we understand our patients better if we know where they
are coming from?

12/10/2012
25
Your Risk Data
Your Current Status
Your Diagnosis
Your Team Treatment Choices
II. Patient and Family Care Planning Worksheet
III. Information System Integration to support monitoring clinical improvement communication, and operation needs
Information for population based quality
improvement
Financing and clinicoperation needs
Information Systems

12/10/2012
26
•
Clinical Decision Use of EMR
Team feedback and reporting Registry (EDW) – 1999 to 2011
Depression registry n = 339,413 (1999 – 2011)
120,000 currently active (in the last 12 months)
71,571 unique patients with PHQ9 and 50,335 patients with PHQ2
148,005 PHQ9 and 91,689 PHQ2 (~ 2 PHQ9 or 2 by patient)
70% female
46% private insurance (in 2011)
III. Flow of Information

12/10/2012
27
IV. Operations & Financing IntegrationValue Incentives and Sanctions
• Achieve a sustainable MHI program all regions
• Saving to System ( ACO,SAO, Community)
• Value Foundation for ‘Medical/Health Home’
• Routinized MHI sites establish-baseline best practice
• TEAM FTE
• Identify operational barriers and plan operational resources for 2013-2014 budgets
• Disseminate evidence to communities
.74 1.0 .27 .73 .78 .70 .14Team FTE
12/10/2012
28
Vary by location and system
• NAMI
• CHADD
• Local clinicians
• EAP
Important partners and trained patient advocates
Family support
Consumers as leaders and developers of high value care
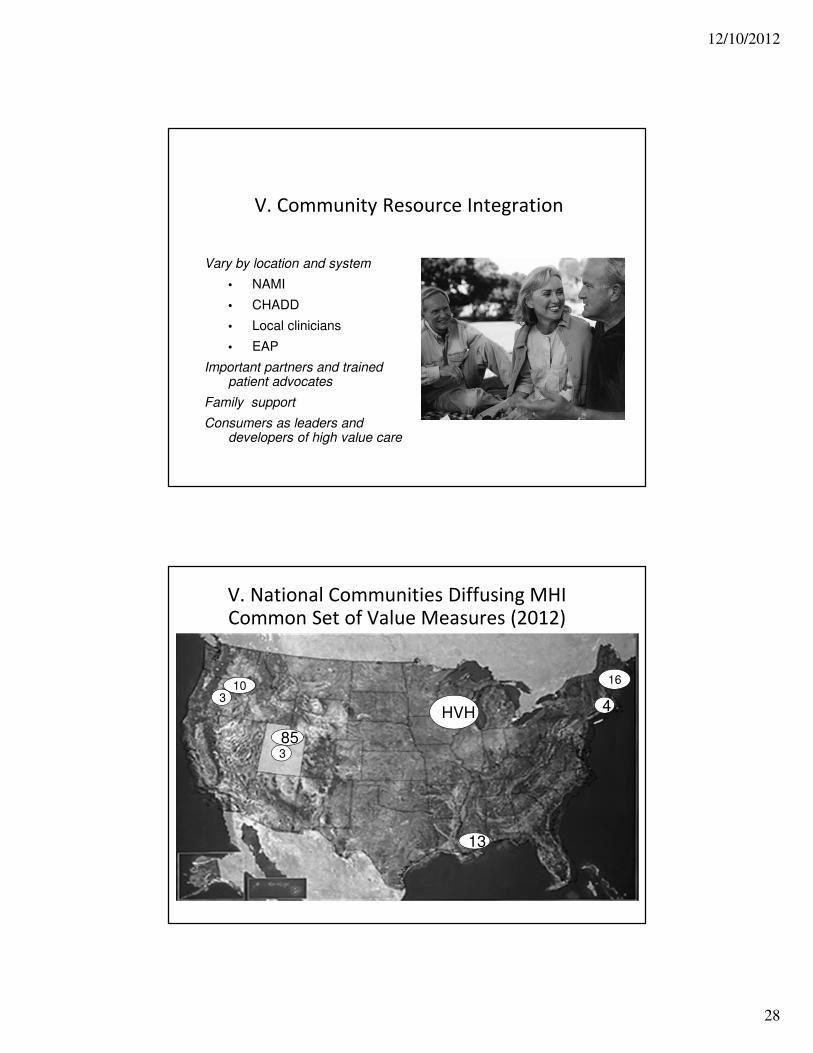
V. Community Resource Integration
16
13
10
85
4
3
V. National Communities Diffusing MHICommon Set of Value Measures (2012)
3
HVH

12/10/2012
29
Key Components Beginning Score Current Score
Patient Outcomes 3 6
1.Leadership and Culture 7 15
2.Workflow Integration 8 17
3.Information Systems 4 9
4.Finance/Cost of Care 1 4
5.Community Resource 0 1
Total 23 52
Implementation Scorecard:MHI at Salt Lake Clinic
Planning
Score: 25
Adoption
Score: 50
Routine
Score: 75
Scoring

12/10/2012
30
Value: Impact on Chronic Disease
• Patient experience
• Clinician experience
• Cost outcomes
• Quality outcomes
Value : Outcomes that matter to patients & the cost to achieve them
High Valued Care = Quality ResultsImpact on building value for results vs. volumes
Urban
Rural
Uninsured School Based
Primary Care Clinics by Stage of MHI Implementation
Rogers, E. Diffusion of Innovations, 1995—discussion of stages
Intermountain Clinics

12/10/2012
31
Patient Satisfaction
Physician Satisfaction

12/10/2012
32
Savings to the Insurance Plan For Service Lines Directly Affected by MHI
$406Savings
Quality Measures
54 % Decrease ER Utilization
$667Savings
Remaining service lines includes:Inpatient Services: Obstetrical and Surgical;
Outpatient Services: Urgent care, Specialty care;
Ancillary Services: Pharmacy for other drugs, Lab, Outpatient Radiology and Testing,
Outpatient other, Chemo and radiotherapy, and Other miscellaneous.
Savings to Commercial Insurance

12/10/2012
33
Change in PHQ-9 Score of ≥5 Points frombaseline to 3 Months (2012)
Initial Score
Patients with
follow up
Increase of
>=5 points
Change of
<=4 points
Decrease of
>=5 points
20-27 points 2,278 19 644 1,615*
15-19 points 2,524 107 774 1,643*
10-14 points 2,111 172 910 1,029*
Initial Score
Patients with
follow up
Increase of
>=5 points
Change of
<=4 points
Decrease of
>=5 points
20-27 points 31.0% 0.8% 28.3% 70.9%
15-19 points 28.9% 4.2% 30.7% 65.1%
10-14 points 23.8% 8.1% 43.1% 48.7%
* Difference between significant improvement and no significant change is <=0.001
Distribution of patients treated at MHI and non-MHI clinicsBy diabetes control and comorbidity
Patient who have depression have their diabetes in better control when treated at an MHI clinic (p < 0.01)
47.50% 45.90%
6.60%
53.10%
42.60%
4.30%
0.00%
10.00%
20.00%
30.00%
40.00%
50.00%
60.00%
Good Control Moderate Control Poor Control
For patients with diabetes and depression and with 4 or less
comorbidities
NON-MHI CLINICS (N = 442) MHI CLINICS (N = 698)
53.00%
42.50%
4.50%
58.70%
37.60%
3.70%
-10.00%
0.00%
10.00%
20.00%
30.00%
40.00%
50.00%
60.00%
Good Control Moderate Control Poor Control
For patients with diabetes and depression and with 5 or more
comorbidities
NON-MHI CLINIC (N = 448) MHI CLINIC (N = 745)
P < 0.01 P < 0.01

12/10/2012
34
Patients with diabetes and depression (5 or more comorbidity)
Hospitalization and ER from 2006 to 2011
Place of treatment / Phq9 control N
Avg. # Visits for those with
ER
Inpatient Visits for those with Admissions
LOS for those with admissions Significance
MHI clinic 745 3.62 * 2.34 10.14 * P < .05
Non-MHI clinic 448 3.98 2.26 10.37
MHI clinic and Phq9 decrease by 5 pts (sustained) 129 2.41 ** 1.96 * 9.23 *
* P < 0.05** P < 0.01
These are preliminary results not to be published
Adherence to diabetes bundle

12/10/2012
35
The Quality Challenge
Transitioning From Volumes to Value
The RightCare
For The Right Person
At TheRight Time
The Value Challenge
What Is Value?
Defined around patient experience
Costmeasured
Outcomes achieved