mineralization rates of peat from eroding peat islands in reservoirs
TRANSCRIPT

Mineralization rates of peat from eroding peat islandsin reservoirs
VINCENT L. ST. LOUIS1,*, AMY D. PARTRIDGE2, CAROL A. KELLY3 andJOHN W.M. RUDD3
1Department of Biological Sciences, University of Alberta, Edmonton, Alberta T6G 2E9, Canada; 2De-partment of Zoology, University of Manitoba, Winnipeg, Manitoba R3T 2N2, Canada; 3Freshwater In-stitute, 501 University Crescent, Winnipeg, Manitoba R3T 2N6, Canada; *Author for correspondence(e-mail: [email protected]; phone: (780) 492–9386; fax: (780) 492–9234)
Received 7 September 2001; accepted in revised form 18 April 2002
Key words: Floating peat islands, Greenhouse gas emissions, Peat decomposition, Reservoirs
Abstract. Reservoirs are sources of greenhouses gases to the atmosphere, primarily due to organic car-bon mineralization in flooded plants and soils to carbon dioxide (CO2) and methane (CH4). Floatingpeat islands are common in reservoirs that inundated peatlands. These islands can decompose on mass,or small pieces of peat can erode from islands to decompose in the water column or on the bottom ofreservoirs. Here we used large 450 liter sealed enclosures to measure mineralization rates of small peatpieces and larger peat blocks collected from floating peat islands. Mineralization rates were calculatedby quantifying dissolved inorganic carbon (DIC), CO2 and CH4 accumulation within the water andheadspace of the enclosures over time. We found that peat did decompose under water, but rates ofmineralization of peat pieces were not different than rates of mineralization of larger peat blocks. Min-eralization rates ranged between 59 and l40 �g C g−1 d−1. Peat pieces acidified the water, shifting thebicarbonate equilibrium to almost exclusively dissolved CO2, which was then readily able to flux to theatmosphere. We estimated that 2.4–5.6% of peat carbon was mineralized annually, suggesting that fluxesof CO2 and CH4 from reservoirs that flood peatlands could last at minimum 18–42 years from this car-bon source alone.
Introduction
Reservoirs are known to be sources of the greenhouse gases (GHGs) carbon diox-ide (CO2) and methane (CH4) to the atmosphere primarily due to the decomposi-tion (mineralization) of flooded organic matter found in soils and vegetation (e.g.,Rudd et al. (1993), Kelly et al. (1993), Duchemin et al. (1995)). The net impact ofreservoir creation on GHG emissions to the atmosphere also includes the loss ofnet primary production following the death of flooded vegetation. It has been esti-mated that globally there are more than 1.5 million km2 of reservoir surface areaemitting 7.4 GT C yr−1, or 4% of other anthropogenic emissions (St.Louis et al.2000). Because many of the preferred steep-walled canyon sites have already beendeveloped, vast areas of land are now being flooded to create new reservoirs. Innorthern reaches of Canada, Scandinavia and Russia, for example, low-lying peat-lands are the first part of the landscape to be inundated. Peatlands are thought to be
Biogeochemistry 64: 97–100, 2003.© 2003 Kluwer Academic Publishers. Printed in the Netherlands.

the worst-case scenario for flooding due to the large stores of organic carbon inpeat available for mineralization to CO2 and CH4, and the elimination of net pri-mary production. Reducing the amount of organic carbon flooded should reducethe amount of GHGs emitted from reservoirs on the long-term (Kelly et al. 1997).
A common feature in flooded peatlands is floating peat islands (Ronka andUusinoka 1976) (Figure 1). When peatlands are inundated, rates of CH4 releaseincrease because methanogenic bacteria favour anoxic environments and floodingreduces or removes the zone of oxidation that usually is present in undisturbedpeatlands (Scott et al. 1999). Also, elevated temperatures that occur within inun-dated peat, due to greater heat conductance in water than air, enhances rates of mi-crobial activity (Kelly et al. 1997). The relatively insoluble CH4 accumulates asbubbles in the peat and eventually causes sections of the peatland to float to thesurface forming peat islands (Koskenniemi 1987). Once peat is floating, the surfacemay become a large emitter of CH4 because the zone of production is in directcontact with the atmosphere, not allowing for microbial CH4 oxidation (Scott et al.1999).
A boreal wetland was experimentally flooded at the Experimental Lakes Area(ELA) in northwestern Ontario in 1993 to quantify net GHG emissions from res-ervoirs (Kelly et al. 1997). Before flooding, the wetland was composed of a 2.4 hacentral pond surrounded by a 14.4 ha peatland. The organic peat layer was on av-erage 1.7 m thick. The wetland was flooded to a depth of 1.3 m above the previouspond level by damming the outflow. The flooding increased the surface area of thepond by a factor of three and the water volume by a factor of six. The ELA Res-ervoir Project (ELARP) showed that the wetland went from being a natural carbonsink of 6.6 g C m−2 yr−1 to a large source of 130 g C m−2 yr−1 to the atmosphere
Figure 1. Floating peat islands in a northern Canadian reservoir.
98
(Kelly et al. 1997). Based on rates of decomposition measured in litterbags, most,but not all, of the gas flux produced in the first two years after flooding resultedfrom the decomposition of flooded vegetation (Kelly et al. 1997). We therefore hy-pothesized that some portion of the gas flux was likely derived from microbial ac-tivity in the peat matrix. Over 33% of the flooded peatland area was covered byfloating peat up to one meter thick by the second year of flooding (Kelly et al.1997), whereas by the fifth year there was floating peat in almost all areas of theinundated peatland. While we know that these floating peat island surfaces contrib-ute to CH4 fluxes to the atmosphere (Scott et al. 1999), the contribution of the sub-merged portions of these islands to buildup of CO2 and CH4 in the reservoir waterhas not been measured. Peat in general is considered to be fairly refractory carbonbecause on average it is composed of about 50% lignin or phenolics (Williams etal. 1998; Turetsky et al. 2000). It has been shown to decompose under water at thebottom of naturally forming shallow ponds on the Hudson Bay Lowland (Hamiltonet al. 1994). The study on natural peat ponds hypothesized that photosynthetic ni-trogen-fixing mats may have played a role in the peat decomposition. In the studypresented here, we ask whether peat decomposes at a significant rate under water,in the dark, as occurs during reservoir creation and disturbance of peatlands.
When large sections of peat float to surfaces of reservoirs, two things happenthat may enhance their rates of decomposition. First, small pieces of peat erodefrom the main peat body due to wind and wave action and become exposed to anaerobic decomposition environment in the open water, whereas the interiors of peatislands remain largely anoxic (McKenzie et al. 1998). Second, heat conductanceinto the floating peat is increased because the underside of peat islands are exposedto water (Kelly et al. 1997). Here we report on an experiment to determine if (1)peat decomposes under dark, submerged conditions, and (2) small peat pieces de-compose at different rates than intact blocks of peat.
Methods
General experimental design
Organic carbon mineralization was quantified in sealed, dark enclosures containingwater and a headspace, and either (1) a large peat block, (2) an equivalent quantityof small pieces of peat, or (3) no peat as a control to quantify net dark respirationin the water column. Each treatment was duplicated. Dissolved inorganic carbon(DIC), CO2 and CH4 production were quantified in the water and headspace of eachenclosure. The experiment was replicated three times between 14–19 July (Run 1),31 July–5 August (Run 2) and 17–21 August 1998 (Run 3), using freshly collectedpeat for each run.
99

Peat collection
Saturated peat was cut the day we began each experimental run from a five-yr-oldfloating peat mat in the ELARP experimental reservoir at the ELA. Live Sphagnumspp. was removed from the surface of the peat. For each experimental run, fourblocks of peat (approximately 30×30×15 cm) ranging in dry weight from 450 to640 g (Table 1) were transported waterlogged back to the laboratory. Two intactblocks were wrapped in fine-mesh netting while two blocks were broken into in-dividual peat pieces. Total wet weight of pieces added to enclosures was adjustedto match that of paired blocks.
Experimental apparatus
Six rigid plastic enclosures were placed in a raft anchored in the sheltered south-east basin of Lake 239 at the ELA where they could be filled with oxygenated wa-ter (Figure 2). Treatments were randomly distributed amongst enclosures. Pieces ofpeat were dispersed into the water of enclosures. Wrapped blocks of peat were ini-tially lowered just below the water surface. Samples for internal porewater DICand dissolved CH4 analyses were taken by inserting a long needle to various depthsin blocks to withdraw porewater into a 5 ml glass syringe before blocks were thenanchored to the bottom of enclosure with a small granite rock. Porewater sampleswere injected into evacuated 13 ml bottles backfilled with 10 mls of UHP nitrogenand 0.1 ml of 10% HCl.
Table 1. Dry weight of peat pieces and blocks added to enclosures, and mean final temperature, pH andO2 concentrations in the enclosures. Values for replicate enclosures are in parentheses.
Dry Wt. Peat1 Water Temperature Final pH Final O2
(g) (°C)2 (mg l−1)
Run 1 (14–19 July)
Peat pieces 487 (520, 454) 22.7 ± 0.7 – 5.1 (5.1, 5.1)
Peat blocks 487 (520, 454) 22.7 ± 0.6 – 6.3 (6.5, 6.0)
Water – 22.8 ± 0.6 – 6.7 (6.7, –)
Run 2 (31 July–5 August)
Peat pieces 525 (592, 457) 21.8 ± 1.3 5.1 (5.1, 5.2) 4.9 (4.8, 4.9)
Peat blocks 525 (592, 457) 21.7 ± 1.3 6.3 (6.4, 6.3) 6.7 (6.2, 7.1)
Water – 21.6 ± 1.3 6.7 (6.7, 6.8) 9.4 (9.2, 9.5)
Run 3 (17–21 August)
Peat pieces 553 (640, 466) 19.0 ± 0.7 5.4 (5.5, 5.3) 5.4 (5.5, 5.3)
Peat blocks 553 (640, 466) 19.3 ± 0.5 6.3 (6.2, 6.4) 6.3 (6.6, 5.9)
Water – 19.2 ± 0.4 6.7 (6.8, 6.6) 7.7 (7.5, 7.9)
1Each run had four treatment enclosures, with groups of two containing comparable weights of piecesand blocks.2Mean average temperature and mean SD for replicate enclosures.
100

Sampling protocol and gas measurements
Enclosure headspace samples were collected into evacuated 60 ml Wheaton bottlesthrough a septum in the lid using double-ended needles. Dissolved gas samples
Figure 2. Cross-section of enclosure containing a peat block. Each enclosure was 75 cm wide and 117cm deep, and impregnated during fabrication with black dye to inhibit light penetration. This preventedCO2 assimilation through photosynthesis. Each enclosure was filled with 91 cm of water ( � 360 liters),leaving a 26 cm headspace ( � 103 liters). Lids for each enclosure contained a septum port for head-space gas collection, a Tygon tube with a mesh filter on the end through which water was extracted forDIC, dissolved CO2, CH4 and O2, and pH analyses, and a copper-constance thermocouple rod attachedto a Campbell Scientific datalogger for monitoring water temperature inside the enclosures. Lids weresealed to enclosures using surgical tubing and/or silicone caulking. To prevent chemical gradients fromestablishing within enclosures, headspace gas was circulated into the water column for � 10 minutesevery eight hours using high volume air pumps attached to the underside of the lids (for runs 1 and 2),and a peristaltic pump connected by hoses on the exterior of the enclosures (run 3).
101

were collected into evacuated 160 ml Wheaton bottles containing 8.9 g of KCl andbackfilled with 10 ml of UHP nitrogen to maintain a headspace.
Headspace and dissolved concentrations of CO2 and CH4 were measured on aShimadzu Mini 2 gas chromatograph (GC) equipped with a Heyes Sep D columnfor gas separation and a ruthenium catalyst methanizer (Colket et al. 1974). Samplescontaining dissolved gases were shaken on a wrist-action shaker for 15 minutesprior to analysis. A 0.2 ml headspace sample was injected into the GC using a pres-sure-lok syringe. Peak areas were quantified using a SP4270 Spectra-Physics inte-grator.
To obtain DIC concentrations, two mls of 10% HCl were added to the � 145mls dissolved gas samples to convert dissolved HCO3 (bicarbonate) to gaseousCO2. The bottles were re-shaken prior to injecting gas samples into the GC.
Sample peak areas were converted to concentrations using a regression equationderived from peak areas corresponding with known CO2 and CH4 standard mix-tures (22–19,000 ppm in air). Headspace gas concentrations were then corrected tostandard temperature and pressure and expressed in (�mol of CO2 and CH4 perliter of headspace. Dissolved gas and DIC concentrations were converted to �molof CO2 and CH4 per liter of water incorporating Henry’s Law (Hamilton et al.1994). Barometric pressure and water temperatures were recorded at the time ofsampling and analysis.
Dissolved O2 samples were obtained on the final day of each run to ensure aero-bicity was maintained within the sealed enclosures. Water samples were flushed intoBOD bottles for approximately two minutes using a peristaltic sampling pump.Oxygen samples were analyzed using the Winkler titration method (Stainton et al.1977).
Close-vessel pH samples were collected before peat addition, and on the thirdand final days of the runs. pH was measured with an Orion model 800 pH metercalibrated with pH 8.0, 6.0 and 4.0 buffers.
Whenever gas and water samples were removed, air and Lake 239 water wereinjected back into enclosures to replace the volume removed for headspace andwater samples to maintain neutral pressure within enclosures.
At the end of each run, peat block porewater was again sampled for DIC con-tent. The peat block was then weighed while it was saturated with water and againafter the porewater had been squeezed out of it. The difference between the twoweights was assumed equal to the volume of the internal porewater. This volumewas used to calculate the change in total DIC and dissolved CH4 within the pore-water of the peat blocks. Peat blocks were then oven-dried at 60 °C to obtain dryweights.
Similarly, volumes of water and headspace within each enclosure were used tocalculate the total carbon content within each enclosure. Water volume was keptconstant amongst enclosures at approximately 360 liters. Headspace volume variedbetween enclosures depending on the volume of peat added; headspace volume ineach enclosure was adjusted by the volume of water displaced by the peat.
102

Rates of peat mineralization
For each sampling day, the inorganic carbon pool in each enclosure was calculatedby summing: (1) headspace gases with dissolved CO2 and CH4, and (2) headspacegases with DIC and dissolved CH4. Total inorganic carbon in enclosures containingpeat blocks was corrected for volume changes in DIC or CH4 content in peat pore-water estimated using a linear regression between initial and final measured pore-water content. Linear regressions were then used to calculate best-fit slopes of in-organic carbon accumulation in enclosures over the duration of the runs. Rates ofinorganic carbon production (g C hr−1) calculated for enclosures containing onlywater were subtracted from rates calculated for enclosures containing peat. Theseinorganic carbon production rates were divided by the dry weights of peat in eachenclosure to determine inorganic carbon production per unit mass of dry peat perunit time.
Results
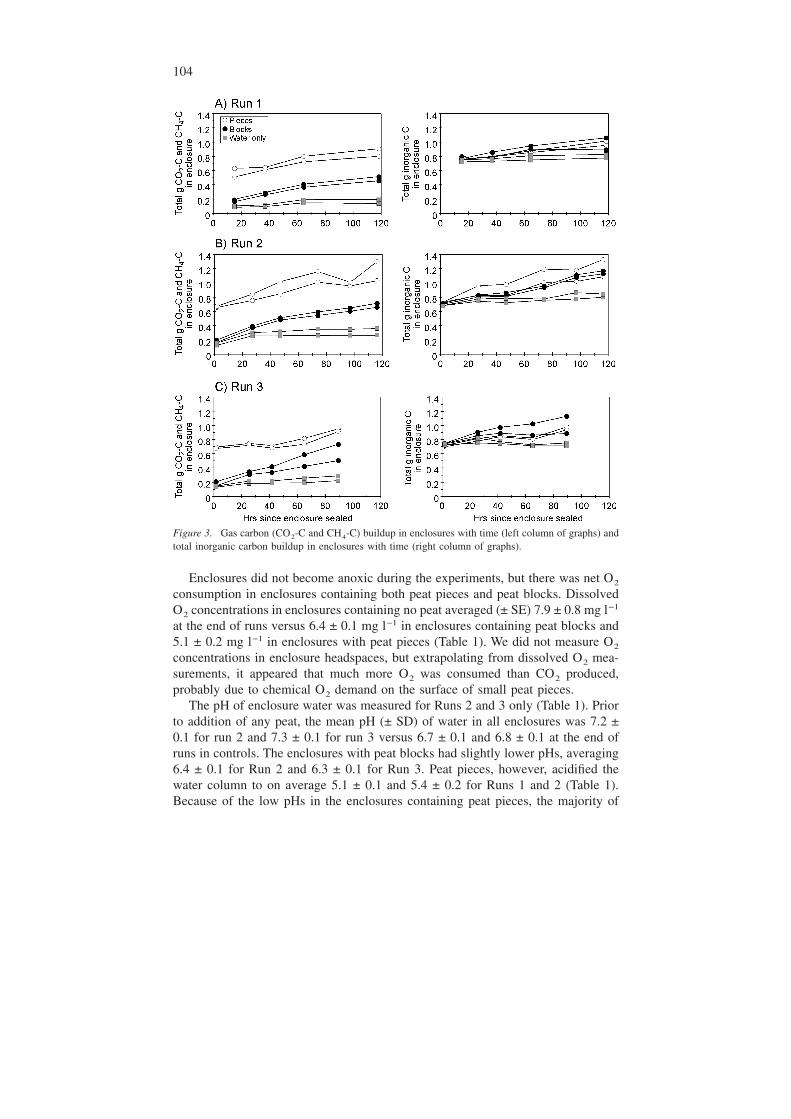
Total inorganic carbon buildup in enclosures (DIC + dissolved CH4 + headspaceCO2 + headspace CH4) generally increased linearly during incubation (Figure 3).Linear regressions used to determine the rate of inorganic carbon production perhour gave R2 values between 0.63 and 0.98 with an average value of 0.94. The R2
values for enclosures with only water ranged between 0.05 and 0.94 with an aver-age value of 0.63. The control enclosures consistently had the lowest total inor-ganic carbon pools. These control enclosures quantified respiration rates in the wa-ter that were on average 36 ± 14%, 26 ± 3% and −12 ± 6% of those measured inenclosures with peat for runs 1 through 3, respectively. When DIC (i.e., dissolvedCO2 and HCO3) and dissolved CH4 were used to calculate total inorganic carbonin the enclosures instead of just dissolved CO2 and CH4, concentrations of totalinorganic carbon were somewhat variable between enclosures containing pieces andblocks of peat (Figure 3). Inorganic carbon stored within peat block porewater overthe duration of each run accounted for on average only 0.8 to 2.2 % of the totalinorganic carbon pool in the enclosures (Table 2).
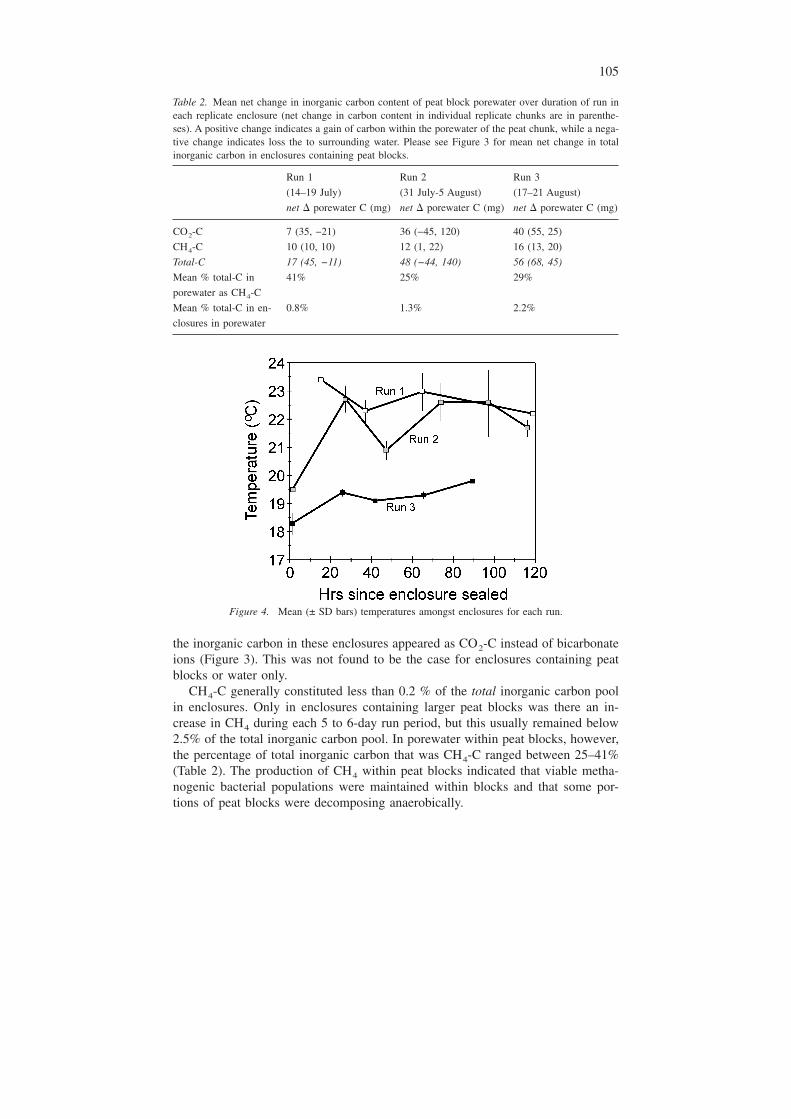
For any given run, mean mineralization rates of peat pieces were on averagesimilar to mineralization rates of peat blocks (Table 3). However, measured rates ofmineralization were quite variable between duplicates, and these rates were morevariable for peat blocks than for peat pieces (Table 3). The overall pattern of min-eralization, ranging from on average 67 ug C g−1 d−1 in mid July, to 141ug C g−1 d−1 in late July/early August, and 123 ug C g−1 d−1 in mid-late August(Table 3) could not be explained by the overall pattern in water temperatures be-cause mean temperatures differed only slightly from one run to another (Table 1).There was little variation in temperatures amongst enclosures throughout each run,except for a few dates during Run 2 (Figure 4).
103
Enclosures did not become anoxic during the experiments, but there was net O2
consumption in enclosures containing both peat pieces and peat blocks. DissolvedO2 concentrations in enclosures containing no peat averaged (± SE) 7.9 ± 0.8 mg l−1
at the end of runs versus 6.4 ± 0.1 mg l−1 in enclosures containing peat blocks and5.1 ± 0.2 mg l−1 in enclosures with peat pieces (Table 1). We did not measure O2
concentrations in enclosure headspaces, but extrapolating from dissolved O2 mea-surements, it appeared that much more O2 was consumed than CO2 produced,probably due to chemical O2 demand on the surface of small peat pieces.
The pH of enclosure water was measured for Runs 2 and 3 only (Table 1). Priorto addition of any peat, the mean pH (± SD) of water in all enclosures was 7.2 ±0.1 for run 2 and 7.3 ± 0.1 for run 3 versus 6.7 ± 0.1 and 6.8 ± 0.1 at the end ofruns in controls. The enclosures with peat blocks had slightly lower pHs, averaging6.4 ± 0.1 for Run 2 and 6.3 ± 0.1 for Run 3. Peat pieces, however, acidified thewater column to on average 5.1 ± 0.1 and 5.4 ± 0.2 for Runs 1 and 2 (Table 1).Because of the low pHs in the enclosures containing peat pieces, the majority of
Figure 3. Gas carbon (CO2-C and CH4-C) buildup in enclosures with time (left column of graphs) andtotal inorganic carbon buildup in enclosures with time (right column of graphs).
104
the inorganic carbon in these enclosures appeared as CO2-C instead of bicarbonateions (Figure 3). This was not found to be the case for enclosures containing peatblocks or water only.
CH4-C generally constituted less than 0.2 % of the total inorganic carbon poolin enclosures. Only in enclosures containing larger peat blocks was there an in-crease in CH4 during each 5 to 6-day run period, but this usually remained below2.5% of the total inorganic carbon pool. In porewater within peat blocks, however,the percentage of total inorganic carbon that was CH4-C ranged between 25–41%(Table 2). The production of CH4 within peat blocks indicated that viable metha-nogenic bacterial populations were maintained within blocks and that some por-tions of peat blocks were decomposing anaerobically.
Table 2. Mean net change in inorganic carbon content of peat block porewater over duration of run ineach replicate enclosure (net change in carbon content in individual replicate chunks are in parenthe-ses). A positive change indicates a gain of carbon within the porewater of the peat chunk, while a nega-tive change indicates loss the to surrounding water. Please see Figure 3 for mean net change in totalinorganic carbon in enclosures containing peat blocks.
Run 1 Run 2 Run 3
(14–19 July) (31 July-5 August) (17–21 August)
net � porewater C (mg) net � porewater C (mg) net � porewater C (mg)
CO2-C 7 (35, −21) 36 (−45, 120) 40 (55, 25)
CH4-C 10 (10, 10) 12 (1, 22) 16 (13, 20)
Total-C 17 (45, −11) 48 (−44, 140) 56 (68, 45)
Mean % total-C in
porewater as CH4-C
41% 25% 29%
Mean % total-C in en-
closures in porewater
0.8% 1.3% 2.2%
Figure 4. Mean (± SD bars) temperatures amongst enclosures for each run.
105

Discussion
Our experiments confirmed the hypothesis that a portion of the high fluxes of CO2
and CH4 to the atmosphere following the experimental flooding of the ELARPwetland could have been derived from peat mineralization in addition to the de-composition of flooded labile vegetation. All enclosures containing peat showed in-creases in CO2-C and CH4-C over time. However, we found no difference in totalinorganic carbon produced by mineralization of peat pieces and blocks, and so es-timating loss of peat carbon over time is simplified. This is helpful because initialmass of carbon in flooded peat is not too difficult to quantify, but it is very hard topredict physical breakup of peat after flooding. However, physical configuration ofthe decomposing peat could be important for predicting the ratio of CO2 to CH4
production. The ratio of CO2 to CH4 emitted to the atmosphere is important be-cause CH4 is approximately 21 times more effective a GHG over a 100 year period(Houghton et al. 1995).
Anoxia is required for CH4 production. McKenzie et al. (1998) measured anaer-obic mineralization rates for peat collected from floating islands on the ELARPreservoir in 1995. They incubated small 10-g (wet weight) saturated chunks of peatin Wheaton bottles evacuated and backfilled with UHP nitrogen, and so their con-ditions were more anoxic than ours. At the in-situ postflood temperature of 20–25°C within floating peat islands, peat mineralization rates ranged between 142–497�g C g−1 d−1, with a mean of 286 �g C g−1 d−1. Approximately 40% of the inor-ganic carbon produced in the McKenzie et al. (1998) incubations came from CH4
production. This percentage of total inorganic carbon as CH4-C was comparable tothe 25–41% we observed within the porewater of our peat blocks (Table 2), butmuch higher than the maximum of 2.5% CH4-C we measure in the enclosuresoverall. Because a portion of the peat in our blocks decomposed anaerobically, thesmall quantity of CH4 measured within enclosures as a whole was likely due to thelarge volume of O2 dissolved in water at the outset of our incubations and CH4
oxidation in the aerobic water column in the enclosures. In fact, the � 13C of CH4
in the water of the ELARP reservoir in the two years after flooding was approxi-mately −38‰ compared to −53 to −70‰ at sites of production in the flooded peat,showing that some of the CH4 had been oxidized in the water column of the ex-perimental reservoir (Kelly et al. 1997). Fluxes of CH4-C from the ELARP experi-
Table 3. Mean mineralization rates of pieces and blocks of peat (decomposition rates in individual rep-licate enclosures are in parentheses).
Treatment Run 1 Run 2 Run 3
(14–19 July) (31 July-5 August) (17–21 August)
�g C g−1 d−1 �g C g−1 d−1 �g C g−1 d−1
Peat pieces 75 (58, 93) 140 (160, 130) 120 (100, 150)
Peat blocks 59 (95, 24) 140 (110, 170) 130 (180, 75)
Average 67 140 123
106
mental reservoir pond surface averaged 7% of the total inorganic carbon flux in thefirst two years of flooding (Kelly et al. 1997). This percentage of total inorganiccarbon as CH4-C was higher than the maximum 2.5% CH4-C in our study, but dis-solved O2 concentrations were often lower in the ELARP reservoir than in our en-closures (C.A. Kelly, unpublished data). Therefore, CH4 diffusing into the watercolumn from submerged portions of peat islands may be oxidized to CO2 prior todiffusion to the atmosphere (Kelly et al. 1997), whereas the peat island surface mayemit high proportions of CH4 because the zone of production is in direct contactwith the atmosphere (Scott et al. 1999).
Anaerobic mineralization rates measured by McKenzie et al. (1998) were over2.5 times higher than rates we measured using peat blocks at similar temperatures(mean of 109 �g C g−1 d−1, ranging between 24–180 �g C g−1 d−1). In fact, ourhighest decomposition rates were similar only to the lowest values measured byMcKenzie et al. (1998). Because our study took place in 1998, whereas theMcKenzie et al. (1998) study was done in 1995, it is possible that our slower min-eralization rates were related to the peat being more aged. Spatial differences be-tween collection sites may have also influenced the peat decomposition rates.
We also observed a seasonal pattern to the rates of mineralization, with greaterrates in late July/early August than in mid August and mid July, suggesting thatmicrobial communities in the peat when it was sampled were more abundant andactive during these times even though mean incubation temperatures declined fromapproximately 23 °C to 19 °C throughout the experimental runs. Because tempera-ture is an important driver of peat mineralization over larger temperature rangesthan those measured in our enclosures (McKenzie et al. 1998), the floating of peatislands is expected to enhance rates of peat mineralization in reservoirs. In the firsttwo summers following creation of the ELARP reservoir, the inundated peat wason average 1–4 °C warmer than the peat in its natural state (Kelly et al. 1997) be-cause water was a better conductor of heat than air. More importantly, though, thesurface of the inundated peat was on average 19 °C, whereas two meters down inthe peat profile the average temperature was only 6 °C. The floating islands allowfor warm surface waters to circulate beneath the islands, regulating temperatures inthe peat islands up to 70 cm from their bases (McKenzie et al. 1998). The remain-der of the inundated peat is often exposed to much lower temperatures at the bot-tom of the reservoir, especially if the reservoir is deep and thermally stratified as isoften the case (Rudd et al. 1993).
We found large differences between treatments in the proportion of the DIC poolthat was dissolved CO2. Enclosures containing peat pieces consistently had higherabsolute values of CO2, followed by enclosures with peat blocks and just water.Naturally occurring organic acids associated with the peat pieces acidified the wa-ter in the enclosures, shifting the bicarbonate equilibrium in favour of dissolvedCO2. The implications of this bicarbonate shift may be large in real reservoirs, de-pending on the ratio of reservoir volume to volume of peat flooded. For example,the pH in the pond of the experimental ELARP reservoir dropped 0.5 units from6.7 in the two years prior to flooding to 6.2 in the three years after (unpublisheddata), a drop similar to that seen in our enclosure with peat blocks. pH induced
107

shifts of bicarbonate to dissolved CO2 may result in higher fluxes of CO2 to theatmosphere than if the pH remained unchanged (Table 1).
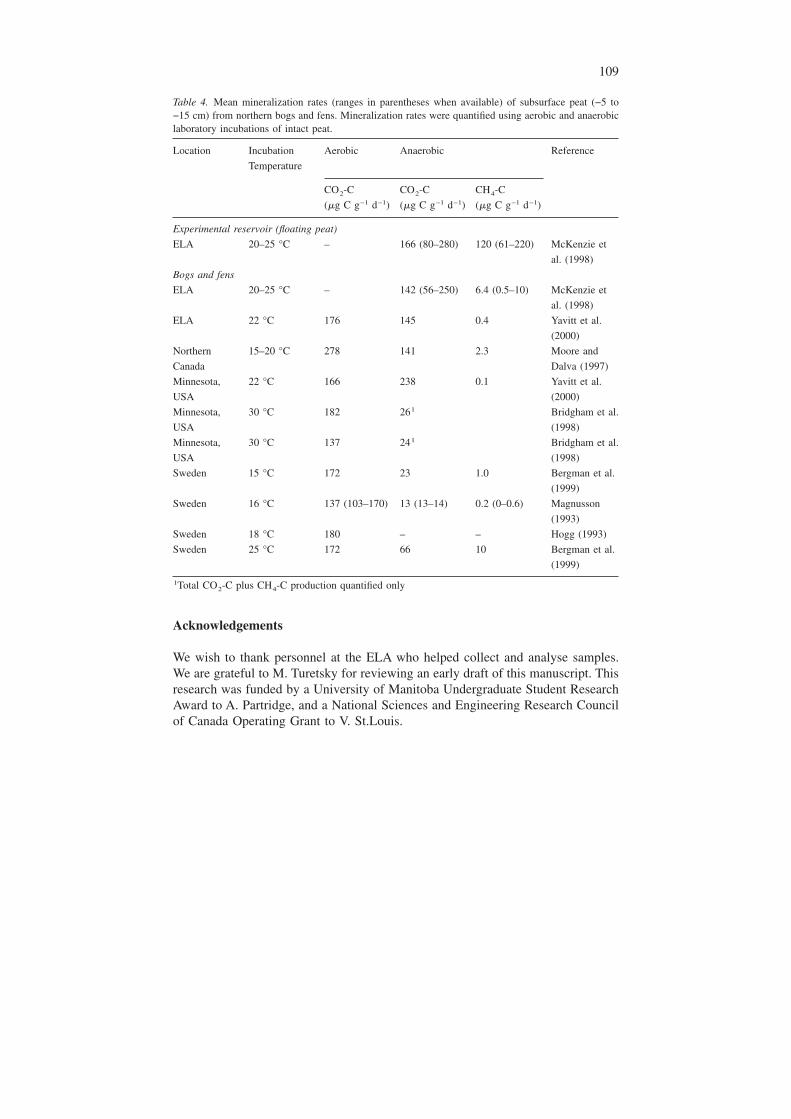
How do decomposition rates of flooded peat compare with decomposition ratesof peat found in its natural state? To make this comparison, we compiled from theliterature a list of mineralization rates of peat, quantified using aerobic and anaero-bic laboratory incubations, from northern bogs and fens (Table 4). There were twogeneral differences in mineralization rates between the flooded peat in our studyand unflooded peat studied in other locations. The first was that decomposition ratesof flooded peat tended to be lower than aerobic rates measured in undisturbed bogsand fens, possibly because five-yr-old flooded peat was more recalcitrant than un-disturbed peat. Second, mineralization rates of flooded peat were higher than some,but not all, anaerobic rates quantified in many of the undisturbed peat studies. Gen-erally, anaerobic decomposition is slower than aerobic decomposition in these stud-ies (Table 4). In the end, it is important to understand that peat does decomposeunder water, outside the natural habitat that it is normally found. It is also impor-tant to note that although peat does decompose in its natural state, peatlands gen-erally tend to be carbon sinks because photosynthetic CO2 uptake exceeds totalcarbon mineralization (Gorham 1991). Following inundation of peatlands, this car-bon sink is lost (e.g., Kelly et al. (1997)).
Assuming that peat decomposes only during the ice-free season (200 days), a %carbon content in peat of � 50% (Turetsky et al. 2000), and a range of mineral-ization rates of 60–140 �g C g−1 d−1, we estimate that only 2.4–5.6% of peat car-bon is mineralized annually. This estimate suggests that fluxes of CO2 and CH4
from reservoirs that flood peatlands are not likely to diminish in the short term,potentially lasting 18–42 years. This duration of mineralization is probably a con-servative estimate, because our rates were measured at the warmest time of the yearusing peat from warm floating peat islands. Furthermore, we expect that rates ofmineralization will slow with time as the more labile carbon stores in peat are firstdepleted, leaving the recalcitrant carbon to decompose more slowly. Certainly astime proceeds following the onset of inundation of peatlands, the mineralization ofpeat will be relatively more important to the flux of CO2 and CH4 to the atmo-sphere than the decomposition of labile plant tissues in reservoirs.
108
Acknowledgements
We wish to thank personnel at the ELA who helped collect and analyse samples.We are grateful to M. Turetsky for reviewing an early draft of this manuscript. Thisresearch was funded by a University of Manitoba Undergraduate Student ResearchAward to A. Partridge, and a National Sciences and Engineering Research Councilof Canada Operating Grant to V. St.Louis.
Table 4. Mean mineralization rates (ranges in parentheses when available) of subsurface peat (−5 to−15 cm) from northern bogs and fens. Mineralization rates were quantified using aerobic and anaerobiclaboratory incubations of intact peat.
Location Incubation
Temperature
Aerobic Anaerobic Reference
CO2-C CO2-C CH4-C
(�g C g−1 d−1) (�g C g−1 d−1) (�g C g−1 d−1)
Experimental reservoir (floating peat)
ELA 20–25 °C – 166 (80–280) 120 (61–220) McKenzie et
al. (1998)
Bogs and fens
ELA 20–25 °C – 142 (56–250) 6.4 (0.5–10) McKenzie et
al. (1998)
ELA 22 °C 176 145 0.4 Yavitt et al.
(2000)
Northern
Canada
15–20 °C 278 141 2.3 Moore and
Dalva (1997)
Minnesota,
USA
22 °C 166 238 0.1 Yavitt et al.
(2000)
Minnesota,
USA
30 °C 182 261 Bridgham et al.
(1998)
Minnesota,
USA
30 °C 137 241 Bridgham et al.
(1998)
Sweden 15 °C 172 23 1.0 Bergman et al.
(1999)
Sweden 16 °C 137 (103–170) 13 (13–14) 0.2 (0–0.6) Magnusson
(1993)
Sweden 18 °C 180 – – Hogg (1993)
Sweden 25 °C 172 66 10 Bergman et al.
(1999)
1Total CO2-C plus CH4-C production quantified only
109
References
Bergman I., Lundberg P. and Nilsson N. 1999. Microbial carbon mineralization in an acid surface peat:effects of environmental factors in laboratory incubations. Soil Biol. Biochem. 31: 1867–1877.
Bridgham S.D., Updegraff K. and Pastor J. 1998. Carbon, nitrogen, and phosphorus mineralization innorthern wetlands. Ecol. 79: 1545–1561.
Colket M.B., Naegeli D.W., Dryer F.L. and Glassman I. 1974. Flame ionization detection of carbonoxides and hydrocarbon oxygenates. Environ. Sci. Technol. 8: 43–46.
Duchemin E., Lucotte M., Canuel R. and Chamberland A. 1995. Production of the greenhouse gasesCH4 and CO2 by hydroelectric reservoirs of the boreal region. Global Biogeochem. Cycles 9: 529–540.
Gorham E. 1991. Northern peatlands: role in the carbon cycle and probable responses to climatic warm-ing. Ecol. Appl. 1: 182–195.
Hamilton J.D., Kelly C.A., Rudd J.W.M., Hesslein R.H. and Roulet N.T. 1994. Flux to the atmosphereof CH4 and CO2 from wetland ponds on the Hudson Bay lowlands (HBLs). J. Geophys. Res. 99:1495–1510.
Hogg E.H. 1993. Decay potential of hummock and hollow Sphagnum peats at different depths in aSwedish raised bog. Oikos 66: 269–278.
Houghton J.T., Meira Filho L.G., Callander B.A., Harris N., Kattenberg A. and Maskell K. (eds) 1995.Climate Change 1995: The Science of Climate Change. Cambridge University Press, Cambridge,UK.
Kelly C.A., Rudd J.W.M., St.Louis V.L. and Moore T. 1994. Turning attention to reservoir surfaces, aneglected area in greenhouse studies. EOS 75: 332–333.
Kelly C.A., Rudd J.W.M., Bodaly R.A., Roulet N.T., St.Louis V.L., Heyes A. et al. 1997. Increases influxes of greenhouse gases and methyl mercury following flooding of an experimental reservoir. En-viron. Sci. Technol. 31: 1334–1344.
Koskenniemi E. 1987. Development of floating peat and macrophyte vegetation in a newly created,polyhumic reservoir, western Finland. Aqua Fennica 17: 165–173.
Magnusson T. 1993. Carbon dioxide and methane formation in forest mineral and peat soils duringaerobic and anaerobic incubations. Soil Biol. Biochem. 25: 877–883.
McKenzie C., Schiff S., Aravena R., Kelly C. and St.Louis V. 1998. Effects of temperature on produc-tion of CH4 and CO2 from peat in a natural and flooded boreal forest wetland. Climate Change 40:247–266.
Moore T.R. and Dalva M. 1997. Methane and carbon dioxide exchange potentials of peat soils in aero-bic and anaerobic laboratory incubations. Soil Biol. Biochem. 8: 1157–1164.
Ronka E. and Uusinoka R. 1976. The problem of peat upheaval in Finnish artificial reservoirs. Bull. Int.Assoc. Engin. Geol. l4: 11–14.
Rudd J.W.M., Harris R., Kelly C.A. and Hecky R.E. 1993. Are hydroelectric reservoirs significantsources of greenhouse gases? Ambio 22: 246–248.
Scott K., Kelly C. and Rudd J.W.M. 1999. The importance of floating peat to methane fluxes fromflooding peatlands. Biogeochem. 47: 187–202.
St.Louis V.L., Kelly C.A., Duchemin E., Rudd J.W.M. and Rosenberg D.M. 2000. Reservoir surfaces assources of greenhouse gases to the atmosphere: a global estimate. BioScience 50: 766–775.
Stainton M.P., Capel M.J. and Armstrong F.A.J. 1977. Chemical analysis of fresh water. 2nd edn. FishMar. Serv. Misc. Spec. Publ. 25, 166 p.
Turetsky M.R., Weider R.K., Williams C.J. and Vitt D.H. 2000. Organic matter accumulation, peatchemistry, and permafrost melting in peatlands of boreal Alberta. Ecoscience 7: 379–392.
Williams C.J., Yavitt J.B., Weider R.K. and Cleavitt N.L. 1998. Cupric oxidation products of northernpeat and peat-forming plants. Can. J. Bot. 76: 51–62.
Yavitt J.B., Williams C.J. and Wieder R.K. 2000. Controls on the microbial production of methane andcarbon dioxide in three Sphagnum-dominated peatland ecosystems as revealed by a reciprocal fieldpeat transplant experiment. Geomicrobiol J. 17: 61–88.
110