peatwise - peat fire characteristics -...
TRANSCRIPT

Laboratory of Geoecology, Division of GeoscienceGraduate School of Environmental Earth Science
Hokkaido University
Peat fire characteristics of tropical peatland in Central Kalimantan,
Indonesia
Aswin Usup
116 August 2006

Problems in tropical peatland
Logging
Settlements
Farmland
Canal
Chapter 1. BackgroundGeneral view of tropical peatland
Kalimantan 8.6 M ha(44% of Indonesian peatland)
Importance of tropical peatland
Stores significantly large amount of carbon
Conservation of natural ecosystem
Climate regulation
Hydrological system
Natural resources
Peat fire 2004 in Palangka Raya2
Burning every year not only in El Nino event

0
50,000
100,000
150,000
200,000
250,000
300,000
1984
1985
1986
1987
1988
1989
1990
1991
1992
1993
1994
1995
1996
1997
1998
1999
2000
2001
Years
Bu
rned
are
a, h
a
Source: Department of Forestry, Indonesia, 2002.
Chapter 1. BackgroundTotal burned area in Indonesia from 1984 to 2001
El NinoOil Palm
Rice plantation
Transmigration
Even in C.Kalimantan
3

Chapter 1. BackgroundBad effects of tropical peatland fire on environment in case 1997
1. Damage on peatland: 0.73 M ha of peatland in Central Kalimantan*
2. Carbon emission from Central Kalimantan: 0.19 – 0.23 Gt of carbon release to the atmosphere through peat combustion*
3. Damage on natural ecosystem: 9 National Parks in Indonesia were damaged
4. Damage on social activity and human health in Southeast Asia
Haze in Palangka RayaCity
Peatland fire
Hotspots distribution 1997
4(*Page et al, 2002)

Boreal peat Tropical peat
1. Fire Behavior: Ignition process, smoldering front, spread rate and peat fire temperature
4. Fire ecology, carbon released, and Social economic
Rieley, (1985), Boemh, (2001), Siegert, (2001) Page, (2002), Muraleeharan, (2002) and many others
Kasischke, (1995)
Christjakov (1983), Wein (1983), Hungerford (1995), Hartford (1989) Miyanishi (2000) and others
No data
2. Fuel composition: Crown, Surface and Ground
Bilgili Esturgul, (2003), Angge, (2002), Carter (2004), Domingus Viegas, (1998), and others
No data
3. Combustion characteristics of fuels: Flammability and calorific value
Ratjh, (2003), Dimitrakopoulus, (2001) Miyanishi, (2000), Nunes Regueira, (1996)Mongomery, (1971), and others
No data
Chapter 1. BackgroundReview of previous study
5

The objectives of this study are:
1.To clarify the peat fire behavior in tropical peatland
2.To examine the fuel composition, and
3.To evaluate combustion characteristic of fuel materials in the laboratory
Objective
6

Peatland fire
Combustion characteristics of peat
Monitoring climate & hydrology
•Preheating •Ignition, flaming & glowing temperature•Volatile matter•Degradation rate•Calorific values
• Front type• Spread rate• Temperature
• Crown • Surface• Ground
• Rainfall• Temperature• Humidity• S. radiation• Wind speed/direction
Peat fire characteristics
Proposal on peat fire control
9 study sites 1 study site
Field ObservationLaboratory Analysis
FuelsIn peatland
Peat fire behavior
Damage level
•Fuel loss•Fire depth• Carbon loss
TG-DTA & Bomb Calorimeter
Framework of the study
7

Chapter-1 IntroductionChapter-2 Study area and methodology
Chapter-3 Peat fire behavior in tropical peatland3.1. Fire regime in tropical peatland3.2. Horizontal and vertical peat fire front 3.3. Peat moisture near smoldering zone 3.4. Spread rate of peat fire3.5. Temperature in peat layer during a fire event 3.6. Peat fire damage 3.7. Concluding remarks
Chapter-4 Fuel materials in tropical peatland4.1. Fuel composition in secondary peatland forest 4.2. Fuels composition in the ground 4.3. Distribution of woody peat in the ground 4.4. Fuel loss by fire and carbon loss4.5. Concluding remarks
Chapter-6 General discussion
Chapter-5 Combustion characteristics of fuel materials5.1. Thermogavimetry (TG) analysis
5.2. Differential thermal analysis (DTA)5.3. Derivate thermogravimetry (DTG) analysis5.4. Calorific value 5.5. Concluding remarks
Contents of thesis
8Chapter-7 Conclusions

2o 20’S
2o 30’S
2o 40’S
2o 50’S
2o 10’S
113o 50’E 114o 0’E 114o 10’E 114o 20’E
Palangka Raya
Pulang Pisau
Garung
Kahayan River
Sebagau River
University plot
Plot-1
P-2P-3P-4
P-6
P-7
P-8
P-9
P-5
N0 20
km
Chapter 2. Study area and methodology
Peatlanddistribution in
Borneo
Peatland distribution in Central Kalimantan
Canal
Basin/domed peatland
Java Sea20 0 20 40 Km
Palangka Raya
Basin/domed peatland
Java Sea20 0 20 40 Km
Palangka Raya
9: Study site

Chapter 3 Peat fire behavior in tropical peatland
10
1. Fire propagation regimes in tropical peatland
2. Horizontal and vertical peat fire front
3. Spread rate of peat fire
4. Peat moisture near smoldering zone
5. Temperature in peat layer during a fire event
6. Peat fire damage

Peat fire
Surface fire
Crown fire
Spotting
Brands
Surface fire
Peat
fire
Peatland fires
Crown fire
3.1. Fire propagation regimes in tropical peatland
11

1. Horizontal fire line
Wind direction
Burn area
Iron sticks
Fire front
Method3m by 3m quadrate75 cm length iron sticks50 cm intervalsPlace: plot 3, 5, and 7Observation:1-14 August 2002
3.2. Horizontal and vertical fire line of peat burning
Burned area
Peat fire line in plot 3Six days observation
8/1
8/6
3m
2
1
0Cross section A
B
12
8/68/5
8/4
8/3
8/2
Active
Active
Extinguished
Extinguished

a. Surface peat fire
Surface peat fire at plot 3
2. Vertical fire line
0
10
50 200 cm100
Peat soil
20
150
Fire frontAsh
Depth (cm)
3.2. Horizontal and vertical fire line of peat burning
13
A B
b. Subsurface peat fire
Subsurface peat fire at plot 5
0 20 40 cm
Depth (cm)
0
15
30
Overhanging
Fire front
Ash

Central KalimantanPeat fires (20 cases)
Surface peat Subsurface peat
42 – 155 12 – 60
Location: Plot 3,5 and 7Date: 1-14 August 2002 (cm/day) (cm/day)
Russian peat 12-240
Canadian peat 72-288
Australian peat 100
Wein, 1983
Case of boreal peat fires
3.3. Spread rate of tropical peat fire
Reference
Chistjakov, 1983
Wein, 1983
14
Spread rate

Smoldering Zone
24%
31%
61%
52%
62%
68%
42%
63%
70%Ash
Peat soil
Plot 3
5 10 100 cm
5
10
15cm
Ash
Smoldering Zone
23%
31%
50%
37%
61%
63%
52%
62%
59%Ash
Peat soil
Plot 5
5 10 100 cm
Peat moisture near smoldering zone at plot 3 and 5
Peat moisture near smoldering zone in Seney NWR Michigan USA
(Hungerford, 1996)
Smoldering zone
5 10cm
5
10
15cm
1 meter
15 cm
5 cm
Organic layerGlowing Zone
79%
61%
82%100%
89%
100%
5 cm
10 cm
Mineral soil
Moisture content near smoldering zone
Burn Hole
0
3.4. Peat moisture near smoldering zone
15

Recorded by Thermal video system (TVS 600) Avio Neo Thermal,
on 15 September 2004.
Temperature Level
600oC200 400
3.5. Temperature in peat layer during a fire event
16
Temperature distribution in a peat fire

3.5. Temperature in peat layer during a fire event

surface
10 cm
0
50
100
150
200
250
300
Temperature (oC) 275oC Fire temperatures measurement
Tool :Chromel alumel thermocouples of 0.5 mm, with stainless steel sheath in a 6 channel data logger (KADEC-US Kona System Co. Ltd. Japan)
Date : 20 – 27 August 2002.
18
(≈ignition temperature)
3.5. Temperature in peat layer during a fire event
Front temperature of surface peat fire
Days of August 2002
20 21 22 23 23 24 25 26 27
275oC
Surface
10 cm0
50
100
150
200
250
300
7:40 8:40 9:40 10:40 11:40 12:40
Time (minute)
Tem
pera
ture
,o C The temperatureabove 250oC persisted about 30 minutes
22 August 2002

0
100
200
300
400
500
600
Temperature, oC
0 5 10 15Peat was not ignited
1-2 minutes heating by high
temperature of surface fire was not enough to
ignite peat layer
Time (Minute)
0 cm1m above surface
Location : University siteDate : 16 September 2002
19
275oC (≈ignition temperature)
3.5. Temperature in peat layer during a fire event
Slash and burn experiment on peat ignition

20
3.5. Temperature in peat layer during a fire event
Woods burning experiment on peat ignition
0
100
200
300
400
500
600
700
800
0 10 20 30 40 50 60 70
Time (Minute)
Temperature, oC
0cm
5cm
20 Min
Peat ignitedAt temperature ≈ 275oC

University site
Peat loss by fire:
Maximum = 80 cm
Averages = 56 cm
Measured at 1 m interval
20
40
60
80Depth (cm) Peat surface
after burning
Peat soil
0
3.6. Fire damage
10 20 30 40m0
Canal
NorthInitial peat
surface
A part of measurement area21
Change of micro topography
Initial peat surface

3.6. Fire damage
22
Burned area and mean depth of peat fire penetration of each plot study
Heavy
Heavy
Heavy
Heavy
Heavy
Heavy
Heavy
Medium
Heavy
Heavy
Heavy
Forest damage level*)
*) ITTO, 1994 Forest damage level: Dead of trees caused by fire (%)Light damage < 20%; medium; heavy > 60%
Burned area
(ha)Depth (cm)
P1 2.0 46
P2 3.0 38
P3 1.2 30
P4 2.6 53
P5 1.4 33
P6 5.0 38
P7 1.2 40
P8 0.9 20
P9 1.2 32
University 3.0 56
Mean 2.15 39
Peat Damage
Plot

Peat fire characteristics in the field:Peat IgnitionSmoldering temperature: 125-500oC Duration of heating >20 minutesDry wood on the peat surface: necessary for long heating Peat moisture < 40 % dbFire in the slash and burn area: rarely ignite peat
Fire ExpansionFlaming temperature: around 300-400oC Type and spread rate of fire front expansion:
Surface :42-155 cm/day Subsurface :12-60 cm/day
Damage LevelMaximum depth of peat loss:80 cmAverage depth of peat loss : 39 cmSubsurface peat fire : heavy forest damage level
Chapter-3 Concluding remarks
23

1. Fuel composition in secondary peatlandforest
2. Fuels composition in the ground
3. Distribution of wood in the ground
4. Fuel loss by fire
5. Carbon loss by fire
Chapter-4 Fuel materials in tropical peatland
24

1. Crown fuelsLocation : University plotSelection : Live and standing dead treesSize : 20m x 20m (4 plots)Weight : 2 trunks of 5, 10 and 20 cm in
diameter (fresh weight) and 5 pcs(each) for oven dry 80oC for 24 hrs
2. Surface fuels
Location : University plot
Selection : Grass, litter, wood debris, and fallen wood
Size : 20m x 20m (4 plots)
Weight : before and after 800C oven dry for 24 hrs
3. Ground fuels
Location : University, plot 3, 5 and 7
Selection : grass root, wood and Coarse peat >2 mm mesh size
PeatFine peat <2 mm mesh size
Size : 1m x 1m x 1m (3 plots each)
Weight : Before and after 1200C oven dry for 24 hrs
4.1. Fuels in secondary peatland forestObservation methods
25

Fuels in another region(In tropical forest of Para Brazil)
Araujo, et al, (1999)
1. Crown fuels(Leafs and trunk)
188.7 ton/ha
2. Surface fuel(Litter and Fallen trunk)
45.0 ton/ha
Total 233.7 ton/ha
The fuel composition about 80% in the
ground
80.4
Fuels in Secondary peatlandforest (This study)
*) Calculated for 1 m in depth
Fuel Components
1. Crown fuels(Leafs and trunk)
2. Surface fuels(Grass, litter, wood
debris, fallen wood)
ton/ha %
29.7 8.0
43.1 11.6
300.0
Total 372.8 ton/ha
3. Ground fuels *)(Grass root, wood,
coarse and fine peat)
4.1. Fuels composition in secondary peatland forest
26

Dry weight (%)
Depth (cm)
0000 10101010 20202020 30303030 40404040 50505050 60606060
30-50
15-30
0-15
Coarse peat
Fine peat
Wood
Grass root
Wood
Grass root
Coarse peat
4.2. Fuels composition in the ground
27
Legend
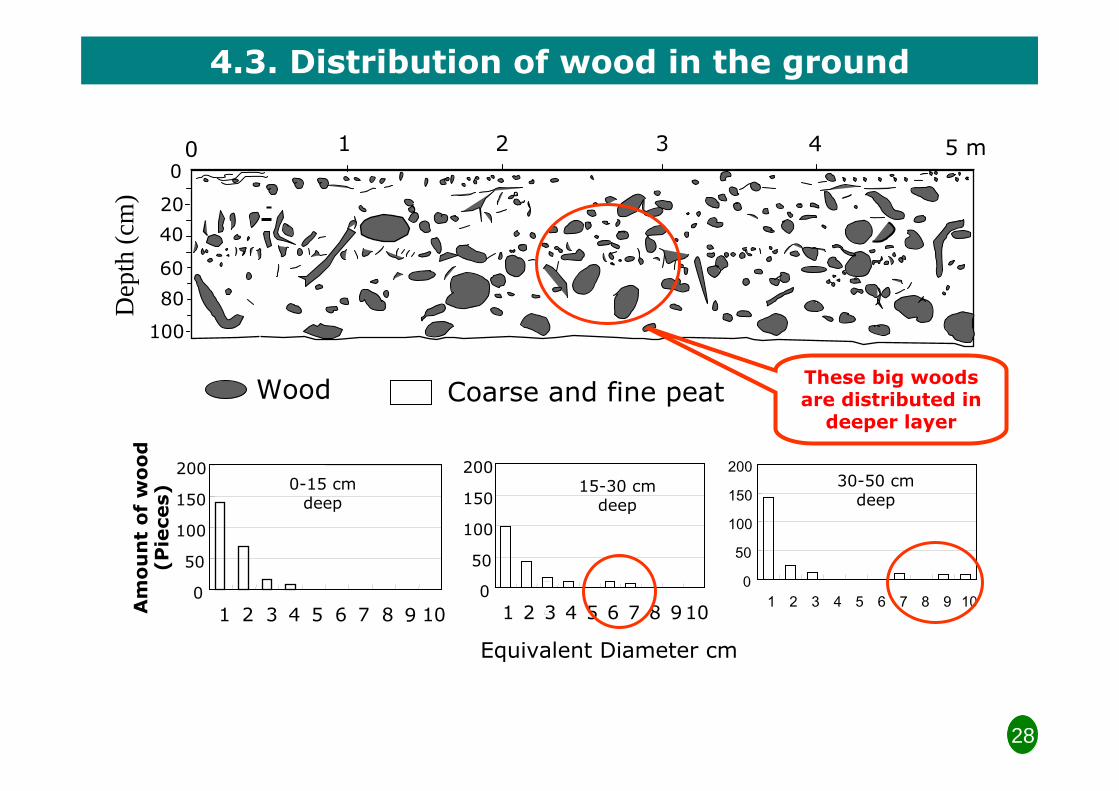
5 m
0-15 cm deep
0
50
100
150
200
1 2 3 4 5 6 7 8 9 10
0
50
100
150
200
1 2 3 4 5 6 7 8 9 10
Equivalent Diameter cm
Amount of wood
(Pieces)
0
50
100
150
200
1 2 3 4 5 6 7 8 910
15-30 cm deep
30-50 cm deep
0
20
40
60
80
100
0 1 2 3 4D
epth
(cm
)
Wood Coarse and fine peat
4.3. Distribution of wood in the ground
28
These big woods are distributed in deeper layer

Unburned area (5 samples)
Burned area (5 samples)
Legends
Method to calculate of fuel loss by fire an example of Plot 5
Mb: Fuel dry weight of unburned area
Ma: Fuel dry weight of burned area
To PulangPisau
100 m
50
0
120 m
1m2
Transect lines
Trans Kalimantan Highway
N
0
1m2
60
To PulangPisau
100 m
50
0
120 m
1m2
N
Burned area
0
1m2
60
4.4. Fuel loss by fireObservation methods
Mass loss caused by fire:
M = Mb - Ma
29
1m2Burned area
Unburned area
Unburned area
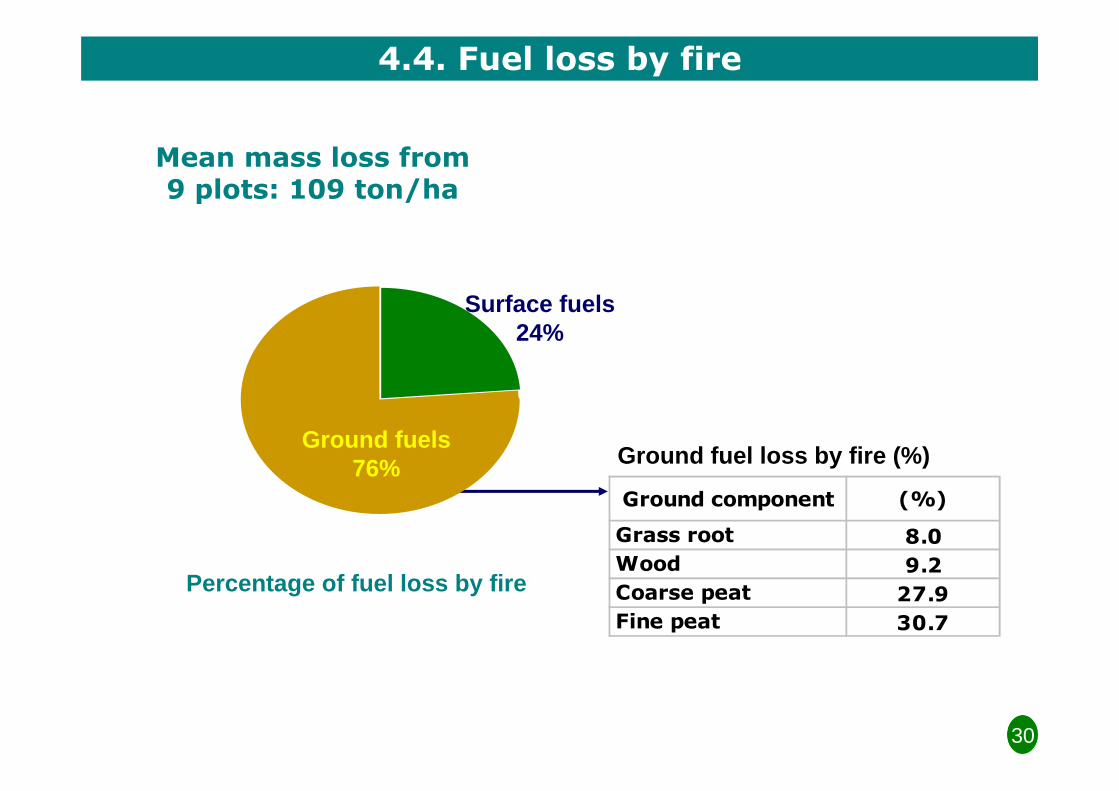
Mean mass loss from 9 plots: 109 ton/ha
Percentage of fuel loss by fire
Ground component (%)
Grass root 8.0
Wood 9.2
Coarse peat 27.9
Fine peat 30.7
Ground fuels 76%
Surface fuels 24%
30
Ground fuel loss by fire (%)
4.4. Fuel loss by fire

Mb= A x B x E (Seiler & Crutzen 1980)
Mb= Biomass loss by fireA = Burned areaB = Biomass loading E = Burning efficiency (%)
Carbon release from peatland fire
Surface fuels10.6 t CO2/ha (25%)
Ground fuels31. 8 ton CO2/ha(75%)
31
4.5. Carbon release
• Biomass � 45% of C, and 90% of CO2 (Seiler & Crutzen, 1980)
• Peat � 50% of C, and 77% of CO2 (Yakelson, et al 1997)
Boreal forestRussian Surface fuel : 8.6 ton CO2/ ha
North America Surface fuel : 7.0 ton CO2/ ha
(Conard et al, 2002)
Total = 42ton CO2/ha
The case of 1997 fires in Indonesia
C. Kalimantan: 350 ton CO2/ha(Page et al, 2002)
Sumatera : 42 ton CO2/ha (Murdiyarso et al, 2002)

Fuel composition of secondary peatland forest
Ground fuels : 80% of total dry weight
Surface and crown fuels : 20% of total dry weight
Ground fuels composition:
Grass root : 8%, decreased with depth
Wood : 9%, increased in deeper layer
Coarse peat : 38%, decreased with depth
Fine peat : 45%, distributed in all layers
Fuel loss and carbon release:Average of fuel loss : 109 ton/haCarbon release : 42.38 ton CO2/ha
(75%) from ground fuels
Chapter-4 Concluding remarks Fuel materials in tropical peatland
32
1. Thermogravimetry (TG) analysis
2. Differential Thermal Analysis (DTA)
3. Derivative Thermogravimetry (DTG) analysis
4. Calorific value of peat combustion
Chapter 5. Combustion characteristics of peat
33

1. TG-DTA: Thermogravimetry and Differential Thermal Analysis
2. Bomb Calorimeter
Chapter 5. Combustion characteristics of peat
34
Bomb Calorimeter, IKA C7000 TG DTA Seiko 3600
Reference (Al2O3)
Apparatus
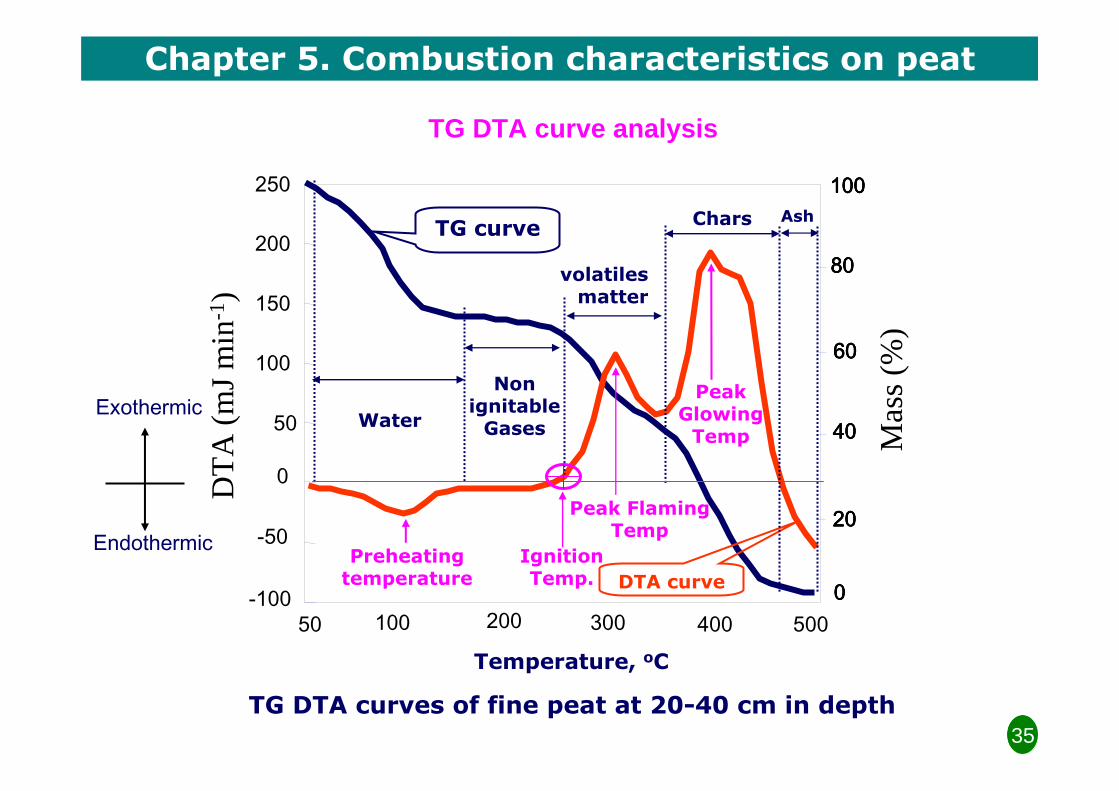
TG DTA curves of fine peat at 20-40 cm in depth
DT
A (
mJ
min
-1)
-100
-50
0
50
100
150
200
250
50 100 200 300 400 5000000
20202020
40404040
60606060
80808080
100100100100
Mas
s (%
)
TG curve
DTA curve
Water
volatiles matter
Chars
Non ignitableGases
Ash
Temperature, oC
Endothermic
Exothermic
Chapter 5. Combustion characteristics on peat
35
Ignition Temp.
Preheatingtemperature
Peak Flaming Temp
Peak Glowing Temp
TG DTA curve analysis

Core0
20
40
60
Depth (cm)
0 - 20 cm
20–40 cm
40-60 cm
Fine peat
Coarse peat
Fine peat
Coarse peat
Fine peat
Coarse peat
Sieve: 2 mm mesh
Sampling : at University plotDate : 18 August 2002
Dried air for 2 weeks
Chapter 5. Combustion characteristics of peatPeat sample and preparation
36

5. 1. Thermogravimetry (TG) analysis
The composition of the basic materials of peat*)
*) From TG curves, in percentage
37
40-60
20-40
0-20
Peat depth, cm
0% 20% 40% 60% 80% 100%
40-60
20-40
0-20
Peat depth, cm
Composition of the basic material, %
water Non Ig. gases Volatile matter Char
Ash
Coarse peat
Fine peat

5. 2. Differential Thermal Analysis (DTA)
Temperature characteristics of peat combustion
Coarse peat
0
100
200
300
400
500
Temp, C
Fine peat
0
100
200
300
400
500
0 - 20 cm 20 - 40 cm 40 – 60 cmPeat depth, cm
Temp, C
Preheating
Ignition
Flaming
Glowing
Legend
Fine peat
Coarse peat
38

Exo
Endo
5.2. DTA curve analysis
39
20-40 cm
0-20 cm
40-60 cm
Coarse peat
20-40 cm
0-20 cm
40-60 cm
Fine peat
Pattern of DTA curves on peat combustion
Flat peak means longerglowing combustion
Meranti (Shorea spp)
Wood
Ignition temperature (oC) 256 259
Flamming temperature (oC) 330 339
Glowing temperature (oC) 432 477
Moisture content (%) 20.44 8.30
Volatile matter (%) 52.43 66.00
Max. degradation rate (mg/min) 3.87 2.22
Calorific value (kJ/g) 18.90 18.87
Wood (Shorea, spp)Parameters Coarse peat 0-20 cm

0
1
2
3
4
0 100 200 300 400 500
Temperature, C
Volatile matter release rate
(mg/min)
Maximum value of volatile matter release rate
DTG curve of coarse peat at 0-20 cm in depth
5.3. Derivative Thermogravimetry (DTG) analysis
Volatile matter release rate =dTG/dt
40
DTG curve

Volatile matter release rate of peat combustion
5.3. Derivative Thermogravimetry (DTG) analysis
41
0
1
2
3
4
0-20 cm 20-40 cm 40-60 cm
Peat depth, cm
dm/dt (mg/min) Coarse peat
Fine peat

5.3. Calorific value Bomb calorimeter analysis
42
Calorific values of peat
17
18
19
20
0-20 cm 20-40 cm 40-60 cm
Peat depth, cm
Calorific value, kJ g-1
Fine peat
Coarse peat
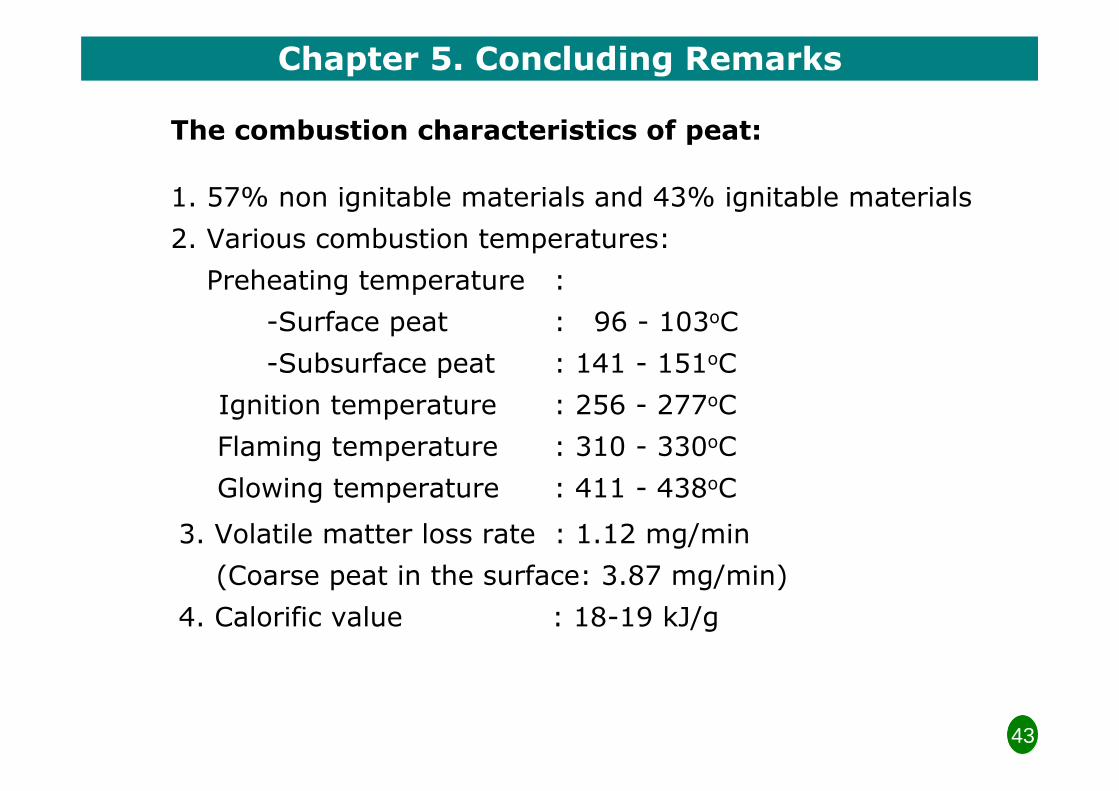
Chapter 5. Concluding Remarks
1. 57% non ignitable materials and 43% ignitable materials
2. Various combustion temperatures:
Preheating temperature :
-Surface peat : 96 - 103oC
-Subsurface peat : 141 - 151oC
Ignition temperature : 256 - 277oC
Flaming temperature : 310 - 330oC
Glowing temperature : 411 - 438oC
The combustion characteristics of peat:
3. Volatile matter loss rate : 1.12 mg/min
(Coarse peat in the surface: 3.87 mg/min)
4. Calorific value : 18-19 kJ/g
43

Surface fireSurface fire
Surface peat fire
Subsurface peat fire
New surface fuels in next fire season
6. General Discussion
Crown, Surface
&Ground
fuels
Crown fire
Light
Fuel types
Me-dium
Heavy
Fire types Damage levels
Schematic diagram of peatland fire dynamics
80%Ground
fuel
CrownSurface
Wood burningLong burning time
Higher temperature >700 oCInitial condition of peat
for ignition• Peat MC ≤40%• Heating duration > 20 min• Ignition temperature 275oC
Ignition Point
Surface peat fireSurface fire
Peat soilSmoldering zone
Peat soil
Surface fire
Subsurface peat fire
Surface peat fire
Peat soil
Surface fire
Overhanging
Smoldering zone
Ignited
Penetrated
Surface peat fire• Moved 3 times faster than subsurface peat fire
• Surface peat contain many coarse peat.
Forest damged by fire in Central Kalimantan

1.Important combustion parameters of tropical peat were clarified and the understanding of fire behavior in the field:
• Smoldering zone temperature
• Fire spread rate on surface and subsurface peat fire
• Peat moisture, duration of heating and forest damage level
• Volatile matter and char content of peat,
• Flaming and glowing temperature
• Volatile matter release rate
• Calorific values of peat
Chapter 7. Conclusions
44

2.Fuel composition of secondary peatland forest: 80% are stored the ground
3.Two types of peat fire expansion: surface peat fire and subsurface peat fire.
4.Dry wood on the ground and coarse peat in the surface layers: important for peat ignition.
5.Subsurface peat fire: heavy damage on peatland forest
Chapter 7. Conclusions
45

Save our peatland from fire
Subsurface peat fire was recognized as a key of tropical peat fire.