mind media bv, nexus white paper series: zscore...
TRANSCRIPT
Mind Media BV, NeXus White Paper series: ZSCORE 2009-09 V1.0 (www.mindmedia.nl)
Page 1 of 22
NeXus: Z-Score for Neurofeedback
This NeXus white paper has been created to educate and inform the reader about the Z-score Neurofeedback functionality offered by the NeXus Instruments with the BioTrace+ software version 2009a and later. Z-score is a software module (DLL) developed by Applied Neuroscience (Robert Thatcher, USA) and a license for it must be purchased separately. The NeXus-4, NeXus-10, NeXus-16 and NeXus-32 members of the NeXus family of physiological monitoring and feedback instruments are multi-modal systems that support a wide range of sensors and applications, including Biofeedback and Neurofeedback . BioTrace+ runs on Windows (XP/Vista/7 ™) based PC’s. The NeXus family of products has medical class IIa certification (EU) and is FDA (USA) registered. Exclusive world wide distribution by Mind Media BV Netherlands:
#1 in Europe for multi-modal, multi-channel physiological monitoring & feedback!
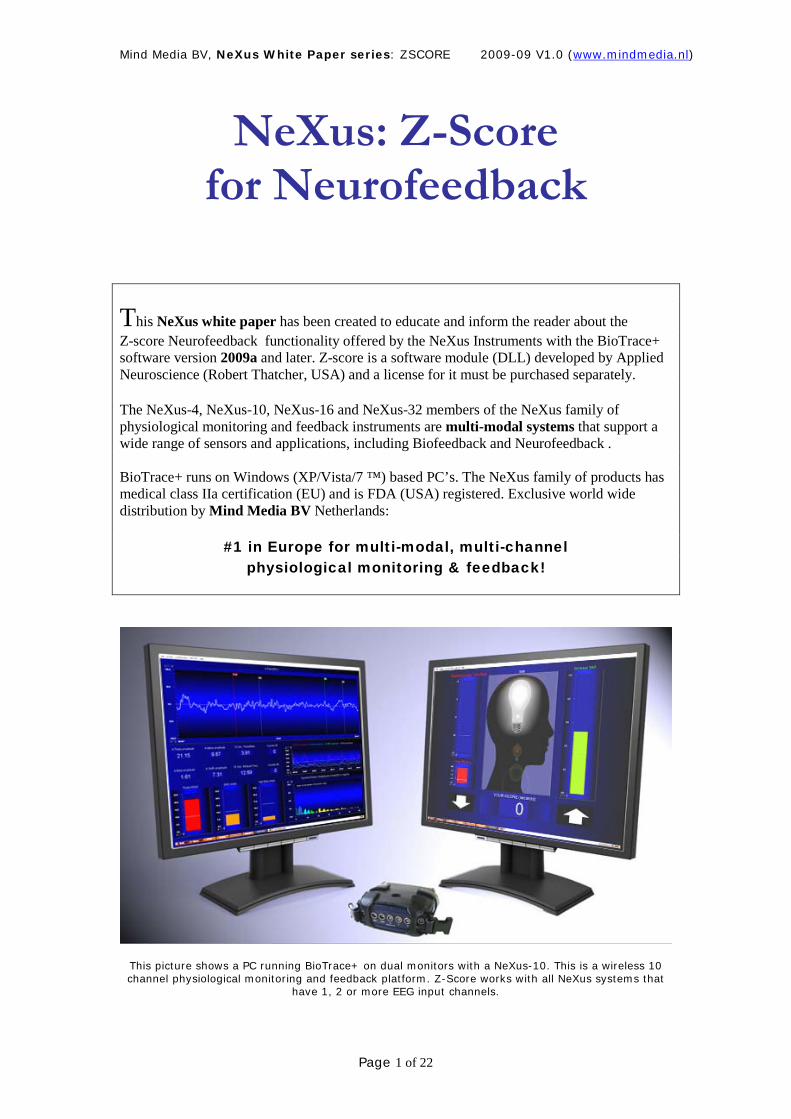
This picture shows a PC running BioTrace+ on dual monitors with a NeXus-10. This is a wireless 10 channel physiological monitoring and feedback platform. Z-Score works with all NeXus systems that
have 1, 2 or more EEG input channels.
Mind Media BV, NeXus White Paper series: ZSCORE 2009-09 V1.0 (www.mindmedia.nl)
Page 2 of 22
Please note: the ZScore functions are supported by and included with version 2009a and newer. Before you can use them however, you first must purchase (buy) a license key
, which activates Zscore. Without activation, the Zscore function will not work. ZScore works on all NeXus systems that have 2 or more channels. (NeXus-4, 10, 16 and 32)
~ Table of contents ~
The classic way to do Frequency based Neurofeedback ............ 3
Training Amplitude versus Power ............................................... 3
What are ‘normal’ EEG values? ................................................. 4
QEEG Databases ....................................................................... 5
Statistics: normal distribution & standard deviation. .................... 6
Definition and computation of Z-Scores ...................................... 8
Advantages of Z-score Neurofeedback on NeXus ...................... 9
Z-Score training strategies ....................................................... 10
Z-Score EEG electrode locations ............................................. 11
The NeXus Linked-Ear cable .................................................... 12
Which EEG parameters can be trained with Z-Score? ............. 14
Using the compounded Z-Scores ............................................. 15
How does Z-Score work on Biotrace+ for NeXus? ................... 17
Examples of Z-Score training screens ...................................... 18
Mind Media BV, NeXus White Paper series: ZSCORE 2009-09 V1.0 (www.mindmedia.nl)
Page 3 of 22
The classic way to do Frequency based Neurofeedback Neurofeedback uses the electrical (physiological) activity of the brain, measured in the EEG, as the source for feedback training and operant conditioning. Neurofeedback is sometimes also called EEG-Biofeedback or Neurotherapy. The ‘classic’ method of frequency based Neurofeedback was discovered and developed in the 1970’s and is based on training of amplitudes (or power) of certain frequency bands in the EEG. For instance the slow wave activity defined as ‘Theta’ takes places in the range of 4-8 Hz, whereas SMR (sensory motor rhythm), also called low Beta or Mu rhythm , is usually defined as activity in the 12-15 Hz range. Some examples: Name: Frequency Band Typical Amplitude Theta Activity 4-8 Hz 5-20 microvolt pk-pk Alpha Activity 8-12 Hz 5-20 microvolt pk-pk SMR Activity 12-15 Hz 2-5 microvolt pk-pk Beta (1) 13-21 Hz 2-10 microvolt pk-pk As you can see in these tables, the typical amplitudes vary. The reason that they vary is because they depend
on a number of parameters, like:
- Location of the electrode on the skull (10-20 EEG system) - Age of the subject - Time of day - State of the eyes: open or closed - Type of electrode placement (mono-polar with reference or bi-polar) - Physiological qualities (skull size and density) - Size of the electrodes - Filters characteristics of the amplifiers - and more….
When we take the ‘classical’ example of down-training slow wave activity (like Theta) and training-up faster activity (like SMR or Beta), we wil base this on the amplitude
(or power) of these frequencies in the EEG. We may then reward the increase of one (e.g. SMR) while we would like to decrease (also called inhibit) another. (e.g. Theta)
Training Amplitude versus Power Frequency based Neurofeedback functions best by making the feedback as quick (near real-time) as possible. Most processes involving operant conditioning, will work better when the feedback is given almost instantly, rather than after a delay of several seconds. This is why for Neurofeedback it is generally not a good idea to use the power of the EEG, computed by a Fast Fourier Transformation (FFT), if fast feedback is desired. The FFT will need at least 1 second of EEG data or more, which means it introduces delays in the order of 500-1000 milliseconds or more, depending on the size of the FFT. For frequency analysis of the EEG, the FFT is fine, but for training, it generally introduces too much delay. The unit of power (as computed by the FFT) is microvolt squared. (µV²)
Because of the limitations of the FFT, a modern Neurofeedback system (like the NeXus with BioTrace+ software) will use digital filters on the EEG, and use the amplitude of the small portions of the filtered signals, for quick feedback. For instance when SMR is being trained,
Mind Media BV, NeXus White Paper series: ZSCORE 2009-09 V1.0 (www.mindmedia.nl)
Page 4 of 22
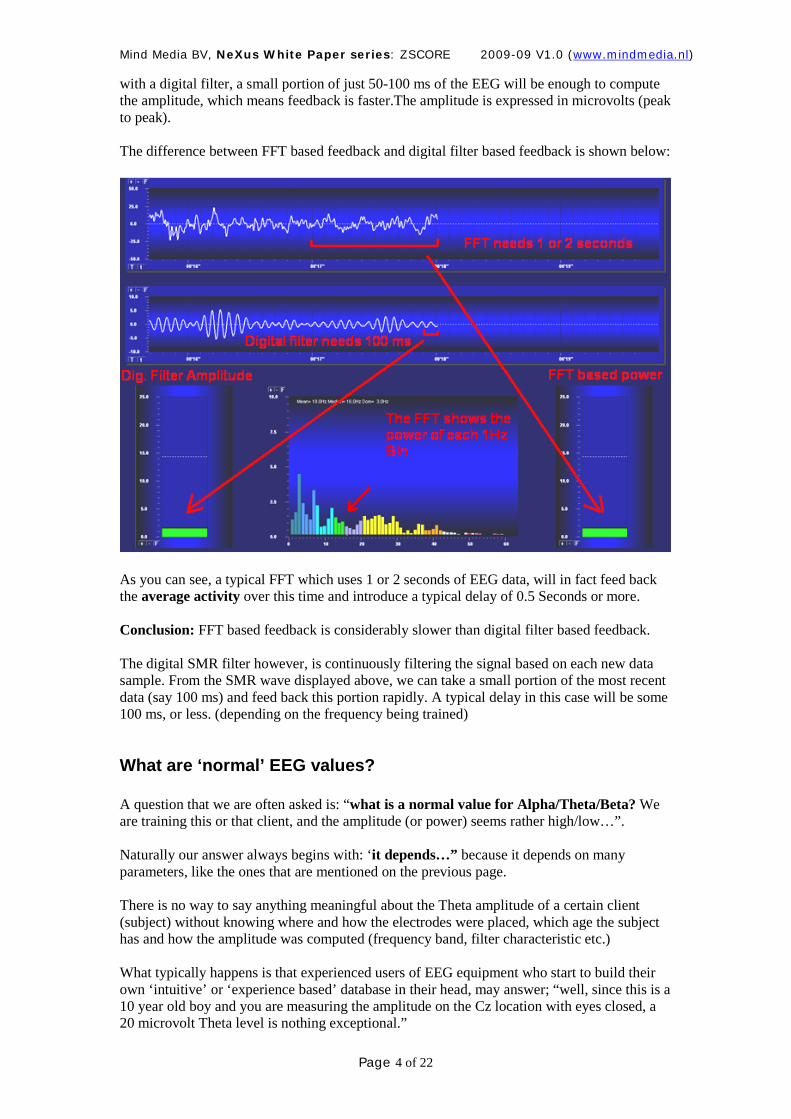
with a digital filter, a small portion of just 50-100 ms of the EEG will be enough to compute the amplitude, which means feedback is faster.The amplitude is expressed in microvolts (peak to peak). The difference between FFT based feedback and digital filter based feedback is shown below:
As you can see, a typical FFT which uses 1 or 2 seconds of EEG data, will in fact feed back the average activity over this time and introduce a typical delay of 0.5 Seconds or more. Conclusion: FFT based feedback is considerably slower than digital filter based feedback. The digital SMR filter however, is continuously filtering the signal based on each new data sample. From the SMR wave displayed above, we can take a small portion of the most recent data (say 100 ms) and feed back this portion rapidly. A typical delay in this case will be some 100 ms, or less. (depending on the frequency being trained)
What are ‘normal’ EEG values? A question that we are often asked is: “what is a normal value for Alpha/Theta/Beta? We are training this or that client, and the amplitude (or power) seems rather high/low…”. Naturally our answer always begins with: ‘it depends…” because it depends on many parameters, like the ones that are mentioned on the previous page. There is no way to say anything meaningful about the Theta amplitude of a certain client (subject) without knowing where and how the electrodes were placed, which age the subject has and how the amplitude was computed (frequency band, filter characteristic etc.) What typically happens is that experienced users of EEG equipment who start to build their own ‘intuitive’ or ‘experience based’ database in their head, may answer; “well, since this is a 10 year old boy and you are measuring the amplitude on the Cz location with eyes closed, a 20 microvolt Theta level is nothing exceptional.”
Mind Media BV, NeXus White Paper series: ZSCORE 2009-09 V1.0 (www.mindmedia.nl)
Page 5 of 22
However in this example, if the client were a 40 year old adult, and the Theta would be measured on Fz with a 20 microvolt level with eyes open, it could be considered to be rather high. (or it could be an eye movement artifact) In order to find out (and measure) what is normal (usually defined as ‘mean’ or ‘average’), we need to record many EEG’s from many different subjects, and do statistical analysis on the EEG parameters. That will enable us to compute the mean and standard deviations and other statistics.
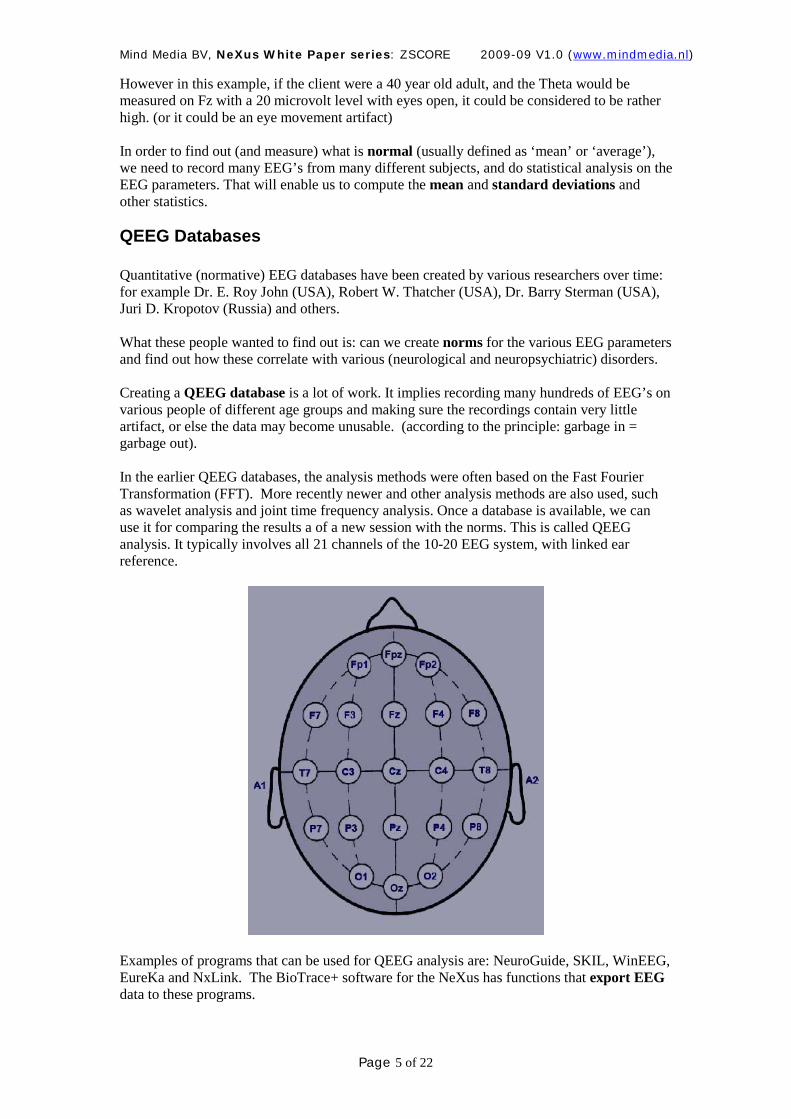
QEEG Databases Quantitative (normative) EEG databases have been created by various researchers over time: for example Dr. E. Roy John (USA), Robert W. Thatcher (USA), Dr. Barry Sterman (USA), Juri D. Kropotov (Russia) and others. What these people wanted to find out is: can we create norms for the various EEG parameters and find out how these correlate with various (neurological and neuropsychiatric) disorders. Creating a QEEG database is a lot of work. It implies recording many hundreds of EEG’s on various people of different age groups and making sure the recordings contain very little artifact, or else the data may become unusable. (according to the principle: garbage in = garbage out). In the earlier QEEG databases, the analysis methods were often based on the Fast Fourier Transformation (FFT). More recently newer and other analysis methods are also used, such as wavelet analysis and joint time frequency analysis. Once a database is available, we can use it for comparing the results a of a new session with the norms. This is called QEEG analysis. It typically involves all 21 channels of the 10-20 EEG system, with linked ear reference.
Examples of programs that can be used for QEEG analysis are: NeuroGuide, SKIL, WinEEG, EureKa and NxLink. The BioTrace+ software for the NeXus has functions that export EEG data to these programs.
Mind Media BV, NeXus White Paper series: ZSCORE 2009-09 V1.0 (www.mindmedia.nl)
Page 6 of 22
QEEG and Spectral Analysis QEEG databases and statistical analysis only became possible when computers were powerful enough to deal with large data files (an EEG session with 19 channels of some 15 minutes may contain more than 1 million data samples). The FFT was used for most types of analysis and this is how initial norms were computed for parameters like Delta, Theta, Alpha, Beta activity, ratio’s of these bands (like the Theta/Beta power ratio) and coherence. Let’s look at a simple example:
An example for the Alpha Amplitude:
When we have gathered enough EEG recordings (say 100+) and the population is large enough, we could perform a statistical analysis of the Alpha activity. Here is a (theoretical) example: Frequency band: 8-12 Hz Parameter measured: Alpha Amplitude (pk-pk) Electrode location: Cz Electrode reference: Mono-polar with linked ear reference Age of subject: 20-25 years old Size of population: 158 subjects State: eyes open Mean value (example) 9.0 microvolt (pk-pk) This could be useful information, when we have a client in this age category and we are interested in comparing his Alpha activity to the ‘normal’ value. Question: so what do we actually know after this? If our sample client (aged between 20-25) has an Alpha amplitude of 12 microvolt, on the Cz location, what does it mean? Is that good or bad? A quantitative database does not actually give an answer to the question “good or bad” but it can indicate whether the 12 microvolt (in this example) is significantly different from to the ‘normal’ value or not. In other words, it can show how much it ‘deviates’. Anyone who has ever studied statistics, will know what the ‘standard deviation’ is. Here is a brief summary:
“Standard deviation is a measure of variability of a statistical population”
or simpler:
“Standard deviation measures the ‘spread’ of data around the ‘mean’ value”
Statistics: normal distribution & standard deviation. The nice thing about statistics is that they can describe anything that you can put into a number. Let for instance say you want to know what the average amount of apples is, that grow on an apple tree. You start your research project and count apples on 200 trees. Now you compute the average (mean): you counted 35366 apples on 200 trees = 176 apples per tree.
Mind Media BV, NeXus White Paper series: ZSCORE 2009-09 V1.0 (www.mindmedia.nl)
Page 7 of 22
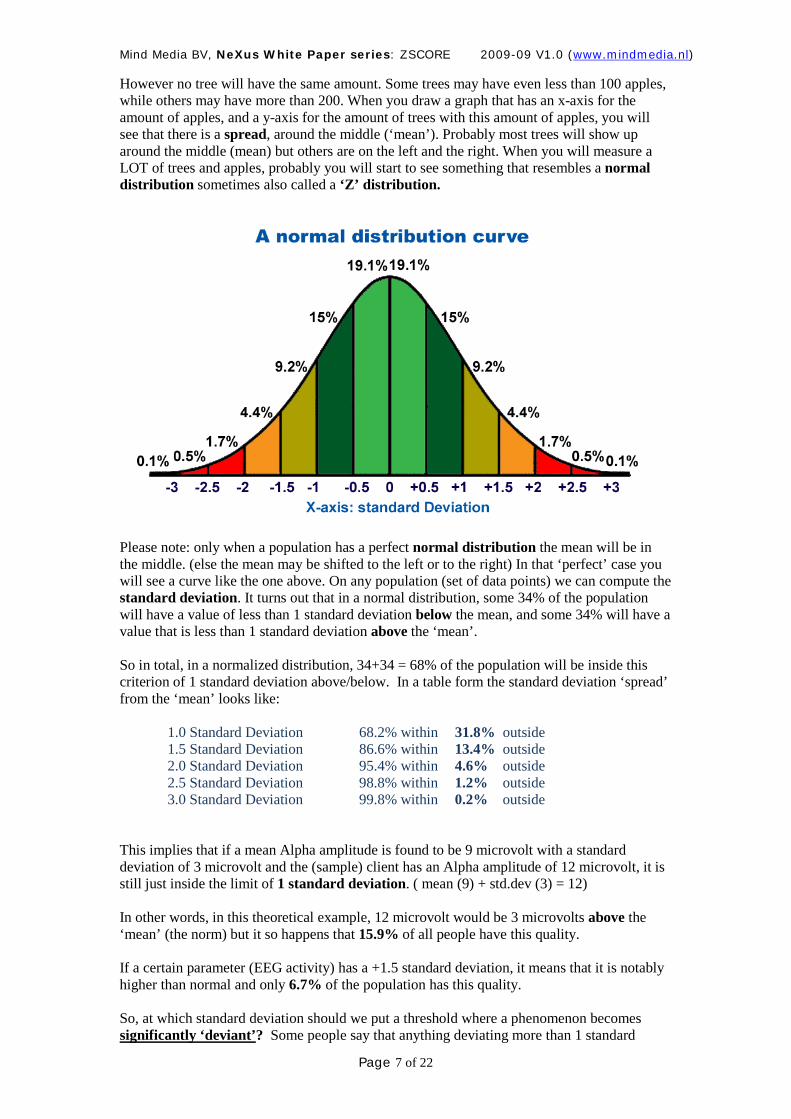
However no tree will have the same amount. Some trees may have even less than 100 apples, while others may have more than 200. When you draw a graph that has an x-axis for the amount of apples, and a y-axis for the amount of trees with this amount of apples, you will see that there is a spread, around the middle (‘mean’). Probably most trees will show up around the middle (mean) but others are on the left and the right. When you will measure a LOT of trees and apples, probably you will start to see something that resembles a normal distribution sometimes also called a ‘Z’ distribution.
Please note: only when a population has a perfect normal distribution the mean will be in the middle. (else the mean may be shifted to the left or to the right) In that ‘perfect’ case you will see a curve like the one above. On any population (set of data points) we can compute the standard deviation. It turns out that in a normal distribution, some 34% of the population will have a value of less than 1 standard deviation below the mean, and some 34% will have a value that is less than 1 standard deviation above the ‘mean’. So in total, in a normalized distribution, 34+34 = 68% of the population will be inside this criterion of 1 standard deviation above/below. In a table form the standard deviation ‘spread’ from the ‘mean’ looks like:
1.0 Standard Deviation 68.2% within 31.8% outside 1.5 Standard Deviation 86.6% within 13.4% outside 2.0 Standard Deviation 95.4% within 4.6% outside 2.5 Standard Deviation 98.8% within 1.2% outside 3.0 Standard Deviation 99.8% within 0.2% outside
This implies that if a mean Alpha amplitude is found to be 9 microvolt with a standard deviation of 3 microvolt and the (sample) client has an Alpha amplitude of 12 microvolt, it is still just inside the limit of 1 standard deviation. ( mean (9) + std.dev (3) = 12) In other words, in this theoretical example, 12 microvolt would be 3 microvolts above the ‘mean’ (the norm) but it so happens that 15.9% of all people have this quality. If a certain parameter (EEG activity) has a +1.5 standard deviation, it means that it is notably higher than normal and only 6.7% of the population has this quality. So, at which standard deviation should we put a threshold where a phenomenon becomes significantly ‘deviant’? Some people say that anything deviating more than 1 standard
Mind Media BV, NeXus White Paper series: ZSCORE 2009-09 V1.0 (www.mindmedia.nl)
Page 8 of 22
deviation, is already significant, while others use a limit (threshold) of 1.5 standard deviations or even higher. At this moment there are no fixed criteria for this. Interpretation of the QEEG: A QEEG report will show many EEG parameters in terms of their standard deviation, but interpreting what they mean, is not simple. There is some evidence that syndroms like ADD and ADHD correlate with EEG parameters such as for instance the Theta/Beta power ratio. Note: when a value is expressed in units of standard deviation, we call this a Z-Score. Note: all of the examples above assume a normal distribution. However populations (sets of data) are never perfectly ‘normally distributed’.
Definition and computation of Z-Scores Definition: in general statistics, a Z-score (sometimes called a standard score) indicates how many standard deviations a data value is above or below the ‘mean’. (assuming a Normal or ‘Z’ distribution) The idea behind Z-Score Neurofeedback is that instead of training complex EEG parameters with various magnitudes and units (that are not normalized), training with a standardized (or normalized) Z-Score can make Neurofeedback training more easy to understand and work with. The Z-Score function developed by Applied Neuroscience Inc. (USA), is based on joint time frequency analysis (JTFA) and specially designed for Neurofeedback in other words, for near real-time use. Joint time frequency analysis computes filtered results quicker than an FFT can, so it is better for training than FFT based methods. Please note that because this Z-Score module is based on joint time frequency computations, these Z-Scores are smaller than those derived from the FTT! The PDF document shown in the web-link below, explains the details of this. The difference with Z-Score computed by FFT and JTFA can be as large as a factor of two! Please keep this in mind when comparing these Z-Score to results from NeuroGuide and other QEEG databases. For training however this does not pose any problem. The database the Z-Score module is based on, has a population of N=625. For those interested in reading the technical foundations and details of the Z-score computations: please open this document from Applied NeuroScience Inc.: http://www.appliedneuroscience.com/Z%20Score%20Biofeedback.pdf
Mind Media BV, NeXus White Paper series: ZSCORE 2009-09 V1.0 (www.mindmedia.nl)
Page 9 of 22
Advantages of Z-score Neurofeedback on NeXus Z-score based Neurofeedback has not yet (September 2009) been clinically validated or compared to ‘classical’ Neurofeedback training in any large scale
scientific study, but it offers a simplification and standardization of Neurofeedback, which can be very useful.
To summarize the advantages:
- Simplification: the user can train more than 80 EEG parameters without having to know their ‘normal’ magnitudes, limits or properties.
- Standardization: each parameter is shown as a simple Z-score, (a single value) which can be trained up or down. Setting a threshold and training goal (e.g. stay below a Z-score of 1) is easy to do. Moreover Z-Score data is likely to be comparable between EEG systems from different manufacturers. (comparison of results)
- Versatility: with BioTrace+ you can quickly design or edit screens to use Z-Score for multi-media based training and feedback with graphics, video, sound and music.
- Multi-modal training: NeXus/BioTrace+ are multimodal
systems. This means you can combine Z-Score Neurofeedback with classical Neurofeedback, but also with respiration, HRV, slow cortical potentials, HEG, Skin Conductance, Bloodflow, etc…
However please keep in mind:
- We advise to use Z-Score training in addition to other Neurofeedback methods. It is not yet clear if it generates better results.
- Using Z-Score does not mean
you no longer need to know anything about EEG signals, electrodes, equipment and Biofeedback. As with Neurofeedback in general, it requires a good clinician/therapist, good equipment, a motivated client and enough time to train, in order to get (good) results.
- Z-Score is not an analysis tool, it has been designed for training. For analysis, QEEG database software is preferable.
- There are no norms yet for Z-Score based EEG training. (which parameters to train and how, which threshold levels to use, which training strategy works best for which applications)
Summary: Z-Score training is an new and interesting method, which can be used complementary to Biofeedback and Neurofeedback methods already offered by the NeXus platform. The efficacy of Z-Score based Neurofeedback however, is still subject of research.
Mind Media BV, NeXus White Paper series: ZSCORE 2009-09 V1.0 (www.mindmedia.nl)
Page 10 of 22
Z-Score training strategies One of the most straightforward strategies to use, is ‘normalization’ of the EEG. From our point of view, the main assumptions made in that strategy are:
- Good (better regulated) brain function correlates with the EEG being more ‘normal’. (in other words: smaller Z-Scores on various parameters)
- Z-Score Neurofeedback and the ‘normalization’ of the EEG is not a treatment for any specific disorder, it is a tool for training better self-regulation of the brain in general.
- The brain function can be finetuned (improve its self regulation) by training Z-Scores towards ‘normal’. ( in other words: towards Z Scores of 0)
- Which Z-Scores should be used for training is not prescribed, rather normalization of the EEG parameters is the goal. Training multiple parameters
therefore would be better than limiting the training to a single Z-Score.
- As with classical Neurofeedback, the principles of learning the desired changes through operant conditioning, still apply. The main difference is that the client will train with Z-Scores rather than levels of microvolts, hertz or ratios.
- What the Z-Scores actually mean (physiologically) is not central, normalization of the EEG (including complex parameters such as coherence, absolute phase etc.) is central in this strategy.
- Progress is measured by looking at multiple Z-Scores, rather than one or two. It is possible however that on average some Z-Scores get ‘better’ (move towards 0) while others get worse.
- Focusing on those parameters with the largest deviations from ‘normal’ (highest absolute Z-Scores) makes more sense than those with low Z-Score values. Therefore performing a QEEG analysis using all the electrode positions of the 10-20 EEG system, before the training begins, can make the training more effective. This will help to locate electrode positions with greater deviations. It this QEEG analysis is not possible, the Z-Score itself could be used, on multiple electrode locations, to find the greatest deviations, but that is less optimal.
Technical conditions:
- Z-Score Neurofeedback can (currently) be trained with 1, 2 or 4 EEG input channels. The default number of EEG input channels is two. Any electrode position from the 10-20 system can be chosen. By default, pairs of central positions can be selected.
- Z-Score Neurofeedback is always using mono-polar (uni-polar) electrodes with linked ear reference.
Summary: Z-Score Neurofeedback training is normally done with two EEG channels (optionally four). A QEEG analysis can be used to find the optimum training area (electrode locations) or else generic electrode locations could be used in the central region (F3,F4 or C3, C4 or P3, P4 etc.) The goal of the training is to normalize the EEG and improve general brain function.
Mind Media BV, NeXus White Paper series: ZSCORE 2009-09 V1.0 (www.mindmedia.nl)
Page 11 of 22
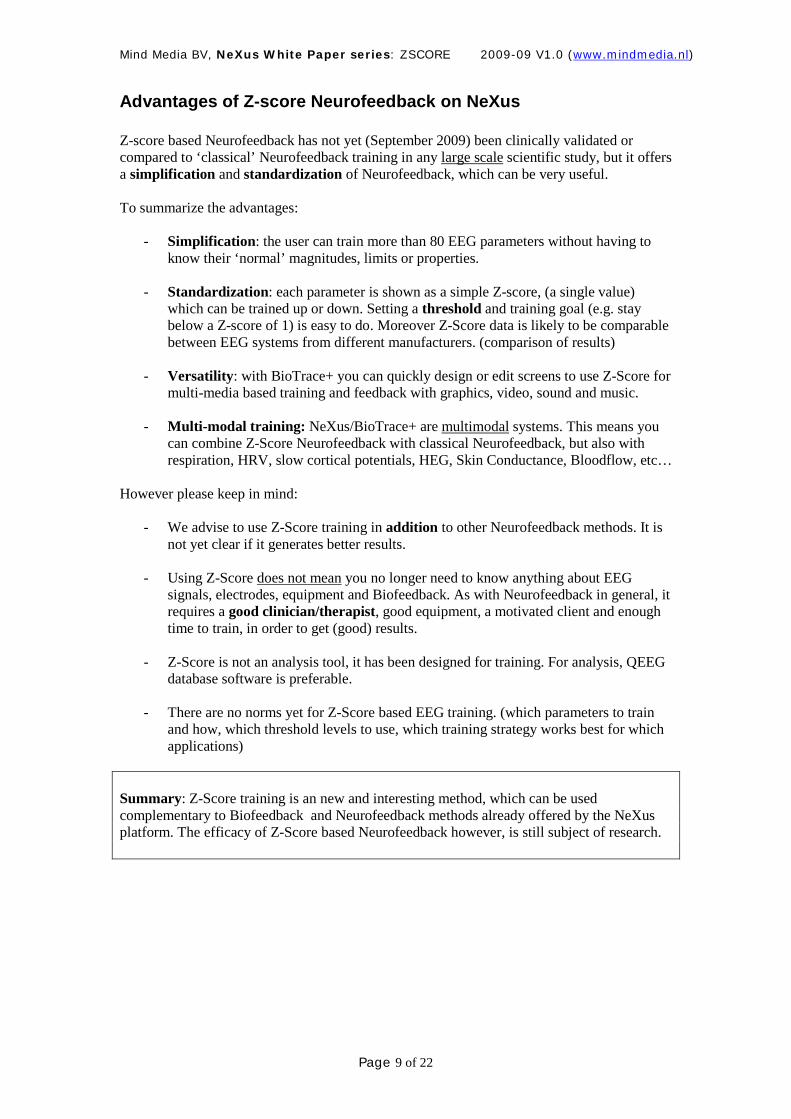
Z-Score EEG electrode locations The EEG electrode locations used for Z-Score Neurofeedback have not yet been standardized. They can be obtained from QEEG analysis (finding the locations with the greatest deviation) or be chosen from default locations, which are typically in the central area. Note: for most accurate results, a linked ear reference should be used. The Z-Score QEEG database has been built from EEG recordings with linked ear reference. The ground electrode location can be chosen freely. Z-Score: although a single active electrode could be used, typically two EEG channels are used. Only then can the coherence, amplitude assymetry and absolute phase be computed. (these are always computed between two locations). An example of training Z-Score on F3 and F4 with the NeXus EXG cable is shown below.
Notice that the active electrodes are the positive ones (A+ and B+, red) whereas the negative electrodes (black) are linked (shorted) and used as the reference. The ground electrode could be placed on the head (for instance on Pz or Cz) or in the neck area.
Mind Media BV, NeXus White Paper series: ZSCORE 2009-09 V1.0 (www.mindmedia.nl)
Page 12 of 22
Alternative central locations could be:
- Active electrodes on: C3, C4 - Active electrodes on: P3, P4 - Active electrodes on: O1,O2 - Active electrodes on: Fz, Pz
Note1: Fp1 and Fp2 are not excluded from the possibilities, but are generally less optimal, because they contain significantly more EMG and eye movement artifact. Note2: when four Z-Score channels are used (not yet supported in V2009a) more combinations are possible like: F3,F4,C3,C4 or P3,P4,O1, O2, etc. Also in that case linked ear reference will be used. When 4 EEG channels are used, the NeXus Mini Cap could come in handy.
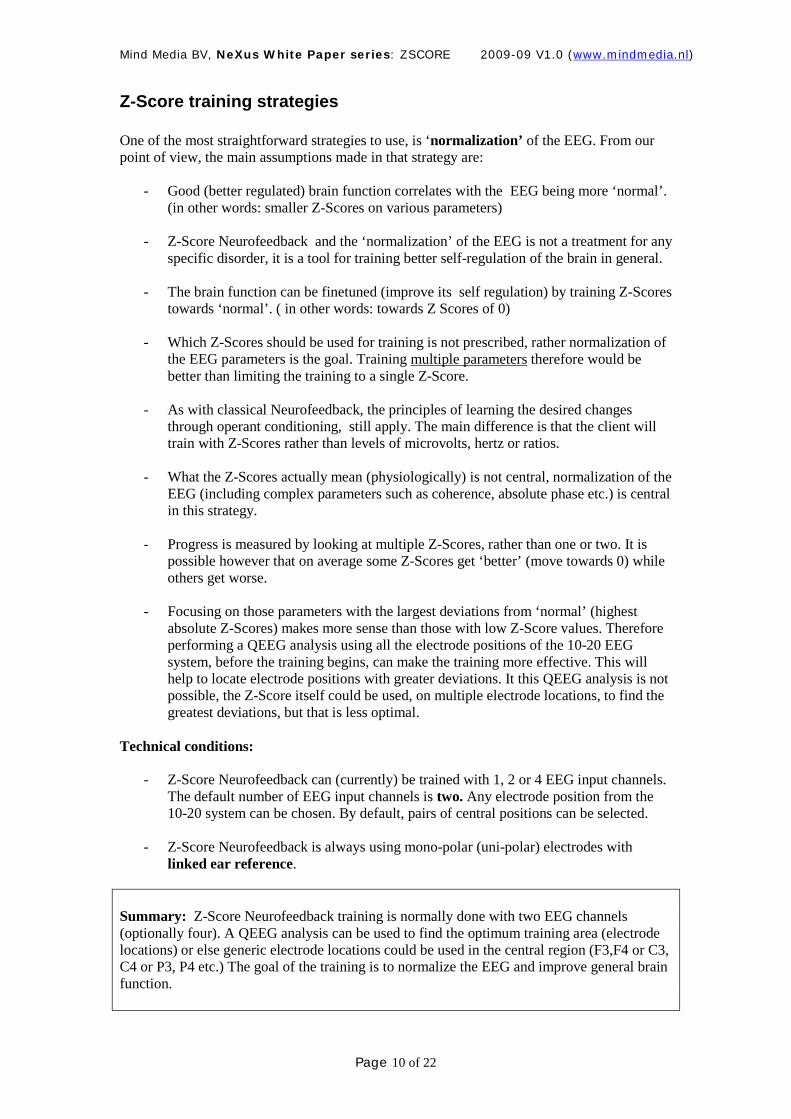
The NeXus Linked-Ear cable NeXus-4 and NeXus-10 have ultra wideband DC amplifiers which can record the EEG in the frequency range from 0 (DC) to 800 Hz. These are bi-polar amplifiers, which means that when uni-polar (also called mono-polar) EEG inputs required, a special cable must be placed in-between the NeXus EXG2 cable and the encoder. The NeXus-32 does not need this cable. The NeXus linked-ear cable links the negative EEG electrodes (black snapons) together so that they can be placed on the ear-lobes or mastoids. Most people prefer the ear-lobes because the mastoid locations tend to generate more EMG artifact. The picture below shows the NeXus-10 with the linked-ear cable.
In the picture above, at position A you will plug-in the standard NeXus EXG2 cable. This will result in 2 mono-polar EEG input channels. The small cable at B, is for linking two linked ear cables together. (when two NX-EXG2B and two linked-ear cables are linked, you will get 4 mono-polar EEG inputs)
Mind Media BV, NeXus White Paper series: ZSCORE 2009-09 V1.0 (www.mindmedia.nl)
Page 13 of 22
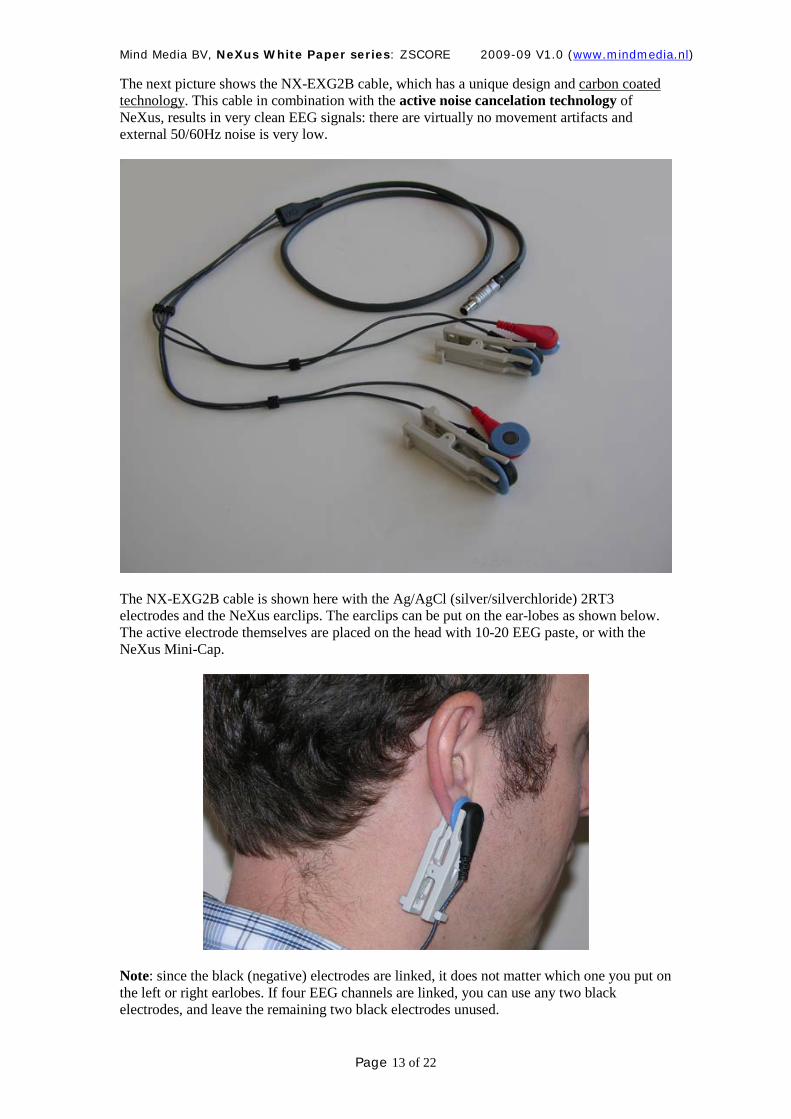
The next picture shows the NX-EXG2B cable, which has a unique design and carbon coated technology
. This cable in combination with the active noise cancelation technology of NeXus, results in very clean EEG signals: there are virtually no movement artifacts and external 50/60Hz noise is very low.
The NX-EXG2B cable is shown here with the Ag/AgCl (silver/silverchloride) 2RT3 electrodes and the NeXus earclips. The earclips can be put on the ear-lobes as shown below. The active electrode themselves are placed on the head with 10-20 EEG paste, or with the NeXus Mini-Cap.
Note: since the black (negative) electrodes are linked, it does not matter which one you put on the left or right earlobes. If four EEG channels are linked, you can use any two black electrodes, and leave the remaining two black electrodes unused.
Mind Media BV, NeXus White Paper series: ZSCORE 2009-09 V1.0 (www.mindmedia.nl)
Page 14 of 22
Which EEG parameters can be trained with Z-Score? The Z-Score module (DLL) provides 76 parameters in real-time, which are available to the user as virtual channels and can be used for any type of Multimedia Biofeedback. (video, animations, sound, music, graphics, games) On top of that, BioTrace+ derives 11 more parameters, which provide a summary of multiple Z-Scores in a single value. The available Z-score parameters can be categorized as follows:
- Absolute power 8 bands – Delta to Hi-Beta - Relative power 8 bands – Delta to Hi-Beta - Power ratios 10 Ratios (including Theta/Beta) - Amplitude Assymetry 8 bands – Delta to Hi-Beta - Coherence 8 bands – Delta to Hi-Beta - Absolute Phase 8 bands – Delta to Hi-Beta
Note: absolute power means power of that frequency band in microvolt squared. Relative power means the percentage of power of that frequency band out of the whole band (1-30Hz) The Z-score license can be purchased for 2 or for 4 EEG channels. This means that any 2 or 4 of the total of 19 EEG channels can be selected for training. However it does not mean all 19 channels can be used simultaneously! Only 2 (or 4) EEG channels can be trained at the same time. We believe that for most Neurofeedback applications 2 channels will suffice. Frequency bands that are available:
- Delta 1-4 Hertz - Theta 4-8 Hertz - Alpha 8-12 Hertz - Beta 12-25 Hertz - Hi-Beta 25-30 Hertz - Beta1 12-15 Hertz - Beta2 15-18 Hertz - Beta3 18-25 Hertz
Frequency ratios that are available:
- Delta / Theta - Delta / Alpha - Delta / Beta - Delta / HiBeta - Theta / Alpha - Theta / Beta - Theta / HiBeta - Alpha / Beta - Alpha / HiBeta - Beta / HiBeta
Mind Media BV, NeXus White Paper series: ZSCORE 2009-09 V1.0 (www.mindmedia.nl)
Page 15 of 22
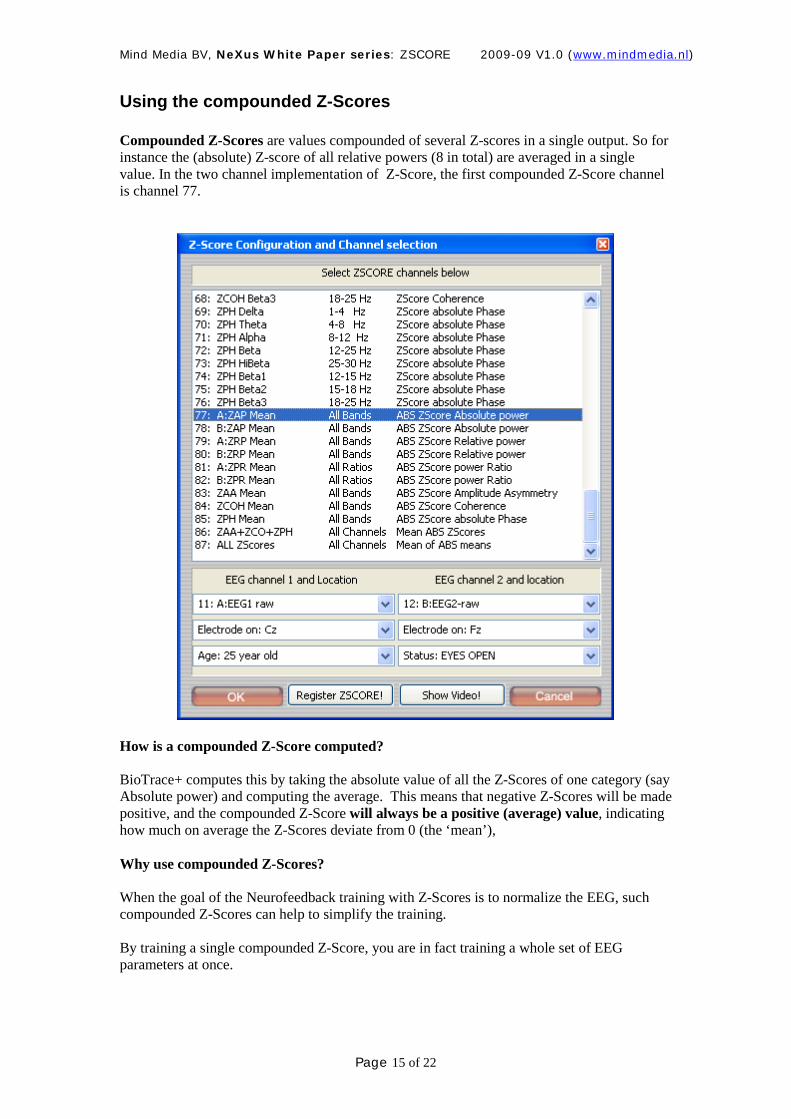
Using the compounded Z-Scores Compounded Z-Scores are values compounded of several Z-scores in a single output. So for instance the (absolute) Z-score of all relative powers (8 in total) are averaged in a single value. In the two channel implementation of Z-Score, the first compounded Z-Score channel is channel 77.
How is a compounded Z-Score computed? BioTrace+ computes this by taking the absolute value of all the Z-Scores of one category (say Absolute power) and computing the average. This means that negative Z-Scores will be made positive, and the compounded Z-Score will always be a positive (average) value, indicating how much on average the Z-Scores deviate from 0 (the ‘mean’), Why use compounded Z-Scores? When the goal of the Neurofeedback training with Z-Scores is to normalize the EEG, such compounded Z-Scores can help to simplify the training. By training a single compounded Z-Score, you are in fact training a whole set of EEG parameters at once.
Mind Media BV, NeXus White Paper series: ZSCORE 2009-09 V1.0 (www.mindmedia.nl)
Page 16 of 22
The following compounded
Z-Scores are implemented in BioTrace+:
ZAP mean The average (mean) of the absolute values of absolute powers. It shows how much on average, the Z-Score of absolute power of all bands (Delta to High Beta) deviate from the ‘norm’.
ZRP mean The average (mean) of the absolute values of relative
powers. It shows how much on average, the Z-Score of relative power of all bands (Delta to High Beta) deviate from the ‘norm’.
ZPR mean The average (mean) of the absolute Z-Scores of the power
ratios. It shows how much, on average, the power ratio’s deviate from the ‘norm’
ZAA mean The average (mean) of the absolute Z-Scores of the
amplitude assymetry. It shows how much, on average, the amplitude assymetries deviate from the ‘norm’
ZCOH mean The average (mean) of the absolute values of the coherence
Z-Scores. ZPH mean The average (mean) of the absolute values of the absolute
phase Z-Scores ZAA+ZCO+ZPH The average (mean) of the prior three averages (ZAA mean + ZCOH mean + ZPH mean) / 3 ALL ZScores The average (mean) of the absolute value of the Z-Score
channels 1-85. Note 1: for more detailed information on the Z-Scores, please refer to the document below: http://www.appliedneuroscience.com/Z%20Score%20Biofeedback.pdf Note 2: please note that the coherence, absolute phase and amplitude assymetry channels only work when 2 channels (A and B inputs) are used. They can’t be used with a single EEG channel.
Mind Media BV, NeXus White Paper series: ZSCORE 2009-09 V1.0 (www.mindmedia.nl)
Page 17 of 22
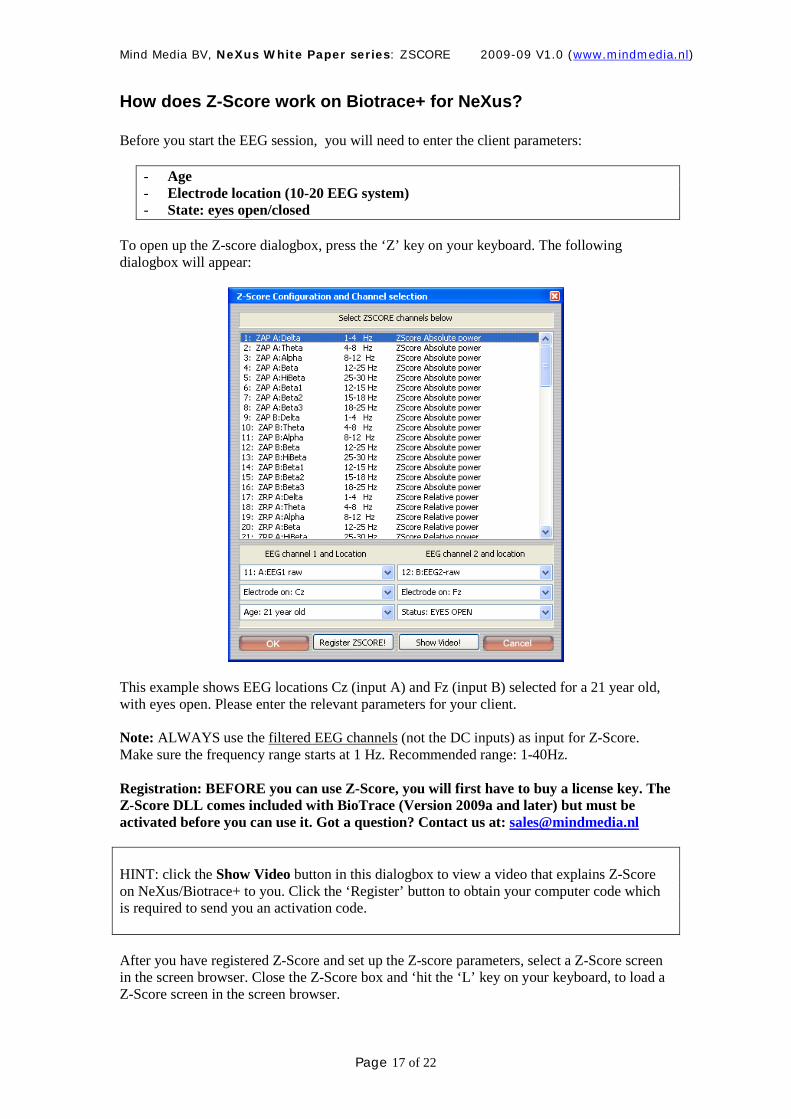
How does Z-Score work on Biotrace+ for NeXus? Before you start the EEG session, you will need to enter the client parameters:
- Age - Electrode location (10-20 EEG system) - State: eyes open/closed
To open up the Z-score dialogbox, press the ‘Z’ key on your keyboard. The following dialogbox will appear:
This example shows EEG locations Cz (input A) and Fz (input B) selected for a 21 year old, with eyes open. Please enter the relevant parameters for your client. Note: ALWAYS use the filtered EEG channels
(not the DC inputs) as input for Z-Score. Make sure the frequency range starts at 1 Hz. Recommended range: 1-40Hz.
Registration: BEFORE you can use Z-Score, you will first have to buy a license key. The Z-Score DLL comes included with BioTrace (Version 2009a and later) but must be activated before you can use it. Got a question? Contact us at: [email protected] HINT: click the Show Video button in this dialogbox to view a video that explains Z-Score on NeXus/Biotrace+ to you. Click the ‘Register’ button to obtain your computer code which is required to send you an activation code. After you have registered Z-Score and set up the Z-score parameters, select a Z-Score screen in the screen browser. Close the Z-Score box and ‘hit the ‘L’ key on your keyboard, to load a Z-Score screen in the screen browser.
Mind Media BV, NeXus White Paper series: ZSCORE 2009-09 V1.0 (www.mindmedia.nl)
Page 18 of 22
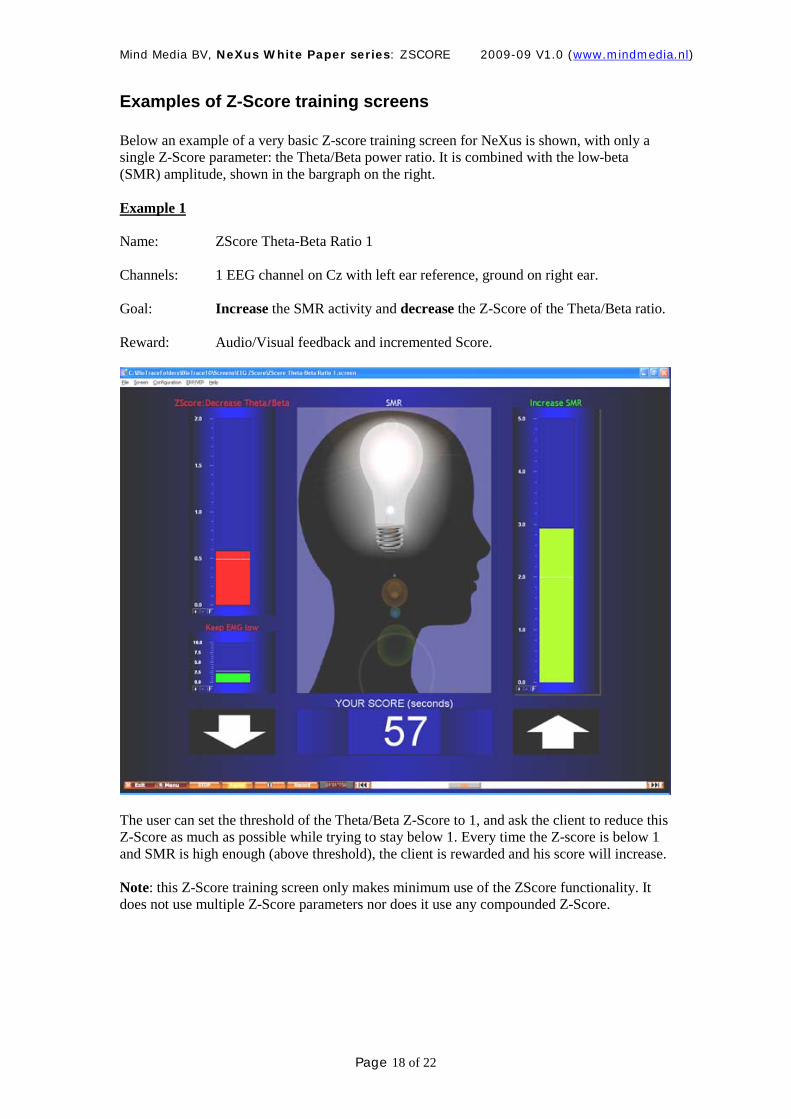
Examples of Z-Score training screens Below an example of a very basic Z-score training screen for NeXus is shown, with only a single Z-Score parameter: the Theta/Beta power ratio. It is combined with the low-beta (SMR) amplitude, shown in the bargraph on the right.
Example 1
Name: ZScore Theta-Beta Ratio 1 Channels: 1 EEG channel on Cz with left ear reference, ground on right ear. Goal: Increase the SMR activity and decrease the Z-Score of the Theta/Beta ratio. Reward: Audio/Visual feedback and incremented Score.
The user can set the threshold of the Theta/Beta Z-Score to 1, and ask the client to reduce this Z-Score as much as possible while trying to stay below 1. Every time the Z-score is below 1 and SMR is high enough (above threshold), the client is rewarded and his score will increase. Note: this Z-Score training screen only makes minimum use of the ZScore functionality. It does not use multiple Z-Score parameters nor does it use any compounded Z-Score.
Mind Media BV, NeXus White Paper series: ZSCORE 2009-09 V1.0 (www.mindmedia.nl)
Page 19 of 22
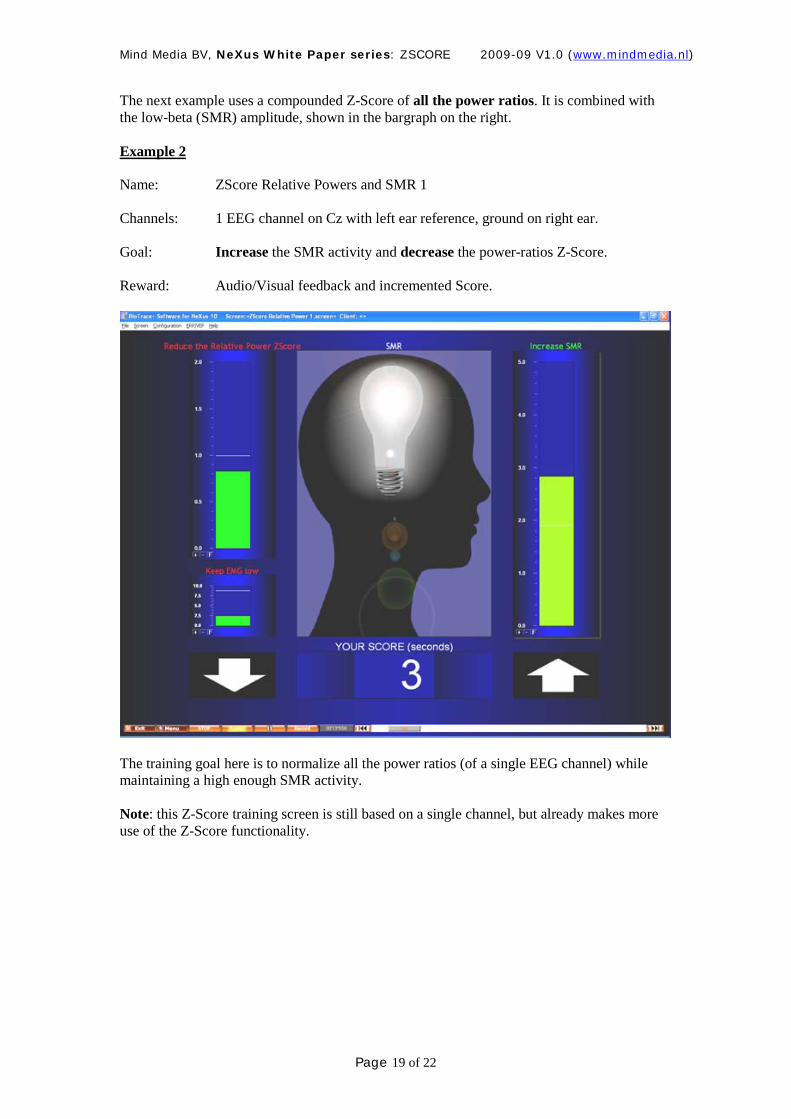
The next example uses a compounded Z-Score of all the power ratios. It is combined with the low-beta (SMR) amplitude, shown in the bargraph on the right.
Example 2
Name: ZScore Relative Powers and SMR 1 Channels: 1 EEG channel on Cz with left ear reference, ground on right ear. Goal: Increase the SMR activity and decrease the power-ratios Z-Score. Reward: Audio/Visual feedback and incremented Score.
The training goal here is to normalize all the power ratios (of a single EEG channel) while maintaining a high enough SMR activity. Note: this Z-Score training screen is still based on a single channel, but already makes more use of the Z-Score functionality.
Mind Media BV, NeXus White Paper series: ZSCORE 2009-09 V1.0 (www.mindmedia.nl)
Page 20 of 22
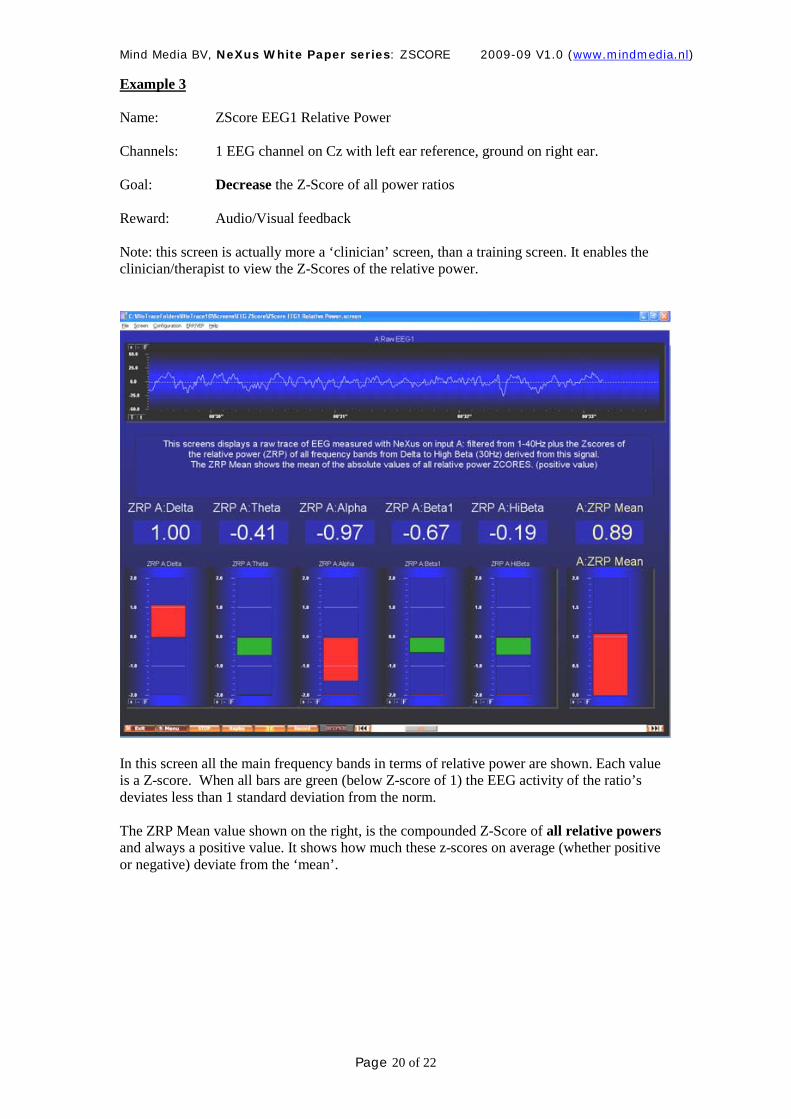
Example 3
Name: ZScore EEG1 Relative Power Channels: 1 EEG channel on Cz with left ear reference, ground on right ear. Goal: Decrease the Z-Score of all power ratios Reward: Audio/Visual feedback Note: this screen is actually more a ‘clinician’ screen, than a training screen. It enables the clinician/therapist to view the Z-Scores of the relative power.
In this screen all the main frequency bands in terms of relative power are shown. Each value is a Z-score. When all bars are green (below Z-score of 1) the EEG activity of the ratio’s deviates less than 1 standard deviation from the norm. The ZRP Mean value shown on the right, is the compounded Z-Score of all relative powers and always a positive value. It shows how much these z-scores on average (whether positive or negative) deviate from the ‘mean’.
Mind Media BV, NeXus White Paper series: ZSCORE 2009-09 V1.0 (www.mindmedia.nl)
Page 21 of 22
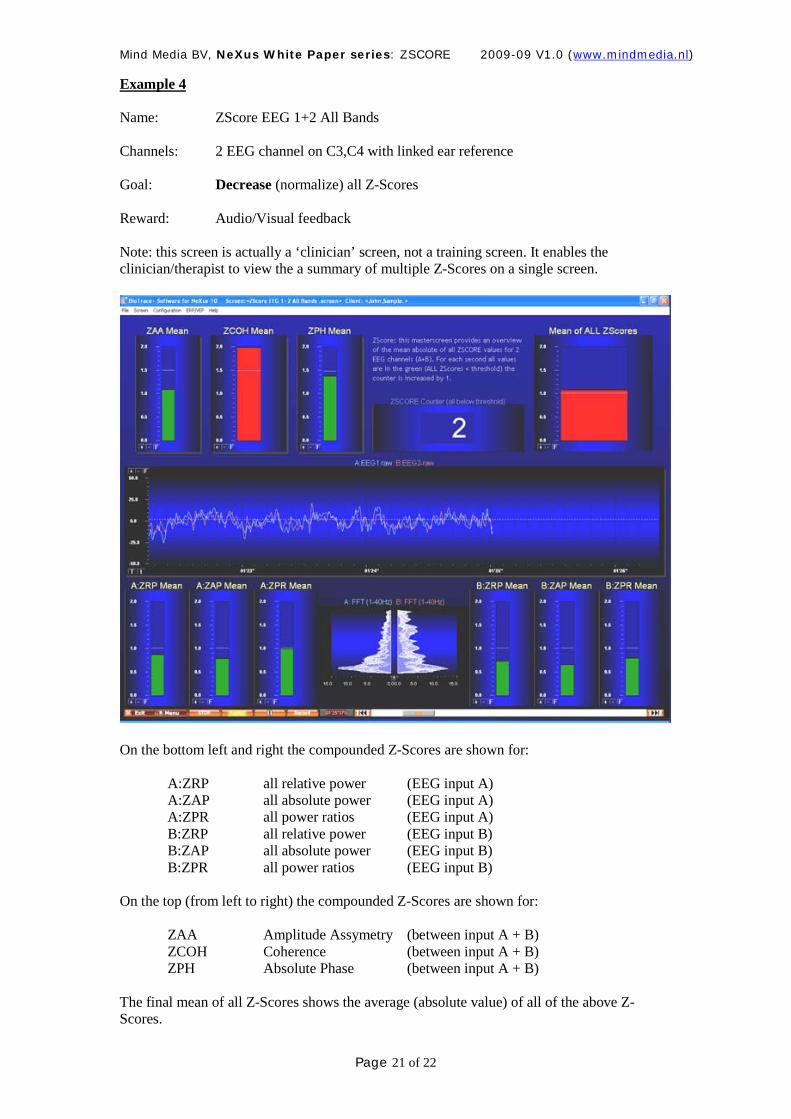
Example 4
Name: ZScore EEG 1+2 All Bands Channels: 2 EEG channel on C3,C4 with linked ear reference Goal: Decrease (normalize) all Z-Scores Reward: Audio/Visual feedback Note: this screen is actually a ‘clinician’ screen, not a training screen. It enables the clinician/therapist to view the a summary of multiple Z-Scores on a single screen.
On the bottom left and right the compounded Z-Scores are shown for: A:ZRP all relative power (EEG input A) A:ZAP all absolute power (EEG input A) A:ZPR all power ratios (EEG input A) B:ZRP all relative power (EEG input B) B:ZAP all absolute power (EEG input B)
B:ZPR all power ratios (EEG input B) On the top (from left to right) the compounded Z-Scores are shown for: ZAA Amplitude Assymetry (between input A + B) ZCOH Coherence (between input A + B) ZPH Absolute Phase (between input A + B) The final mean of all Z-Scores shows the average (absolute value) of all of the above Z-Scores.
Mind Media BV, NeXus White Paper series: ZSCORE 2009-09 V1.0 (www.mindmedia.nl)
Page 22 of 22
Short list of recommended literature:
1) J.Lubar et al.(2003) Quantitive Electrophalographic Analysis (QEEG) for Neurotherapy - (Haworth Press)
2) Brazis et al (2007). Localization in Clinical Neurology. Williams and Wilkins, Philadelphia.
3) Hughes, J. R. & John, E. R. (1999). Conventional and quantitative electroencephalography in psychiatry. Neuropsychiatry, 11, 190-208.
4) Thatcher, R.W. EEG normative databases and EEG biofeedback (1998). Journal of Neurotherapy, 2(4): 8-39
5) Thatcher, R.W., Walker, R.A., Biver, C., North, D., Curtin, R., (2003). Quantitative EEG Normative databases: Validation and Clinical Correlation, J. Neurotherapy, 7 (No. ¾): 87 –122.
< END OF DOCUMENT > For more information about NeXus, our BioTrace+ software and ZSCORE functions, please contact the Mind Media team at [email protected]. Note: the copyright of this document
remains with Mind Media BV © 2008/2009, and the contents of it may not be altered or copied. However we do permit unlimited distribution by electronics means of this document in the unaltered digital PDF format in which it is supplied.
Please check the following weblink for updated versions of this document: http://www.mindmedia.nl/english/PDFGallery.php Author: Erwin Hartsuiker (Netherlands) Date: September 2009, Version V1.0