minagri nisr vulnerability analysis and · 2017-07-05 · wealth index) is an underlying cause of...
TRANSCRIPT

Comprehensive Food Security and Vulnerability Analysis and
Nutri on Survey Rwanda 2012
MINAGRINISR

Methodology and partners
Both primary and secondary data analysis were carried out. The analyses build on the results of similar surveys conducted in 2006 and 2009 and on the more recently released EICV 3 and DHS 2010.
Primary data collec on took place over six weeks from early March to the end of April 2012, a period in between harvests when only 30% to 40% of all households have food stocks from their previous harvest. The survey was designed to provide sta s cally representa ve and precise informa on at the district level. Urban, rural and peri-urban households were all included in the sample.
In total, 748 key informant interviews were conducted while the household ques onnaire was administered in 7498 households, and valid anthropometric measurements were taken for 7418 women and 4651 children. Mothers or carers of 1613 children aged 6-23 months were given a specifi c Infant and Young Child Feeding module. Personal digital assistants were used for the data collec on.
The assessment was led by the Ministry of Agriculture and Animal Resources (MINAGRI), the Na onal Ins tute of Sta s cs of Rwanda (NISR) and the World Food Programme (WFP). It was supported by the Swiss Agency for Development and Coopera on (SDC), One UN, WFP (via the Bill and Melinda Gates founda on), the Canadian Interna onal Development Agency (CIDA), World Vision Rwanda, Famine Early Warning Systems Network (FEWS NET) and MINAGRI. It was coordinated by the CFSVA and Nutri on Survey technical commi ee of MINAGRI and NISR in partnership with the Ministries of Local Government (MINALOC), Disaster Management and Refugee Aff airs (MIDIMAR), Health (MINISANTE) and Gender
Rwanda is a small, landlocked, densely populated country with li le capital and few natural resources. Since the 1994 genocide it has made commendable progress in reducing poverty levels (from about 56.7% of the popula on in 2005/6 to 44.9% in 2010/2011.1
economy (GDP growth of 8.6% in 2011).
Despite these improvements, Rwanda is s ll facing many developmental challenges including popula on growth, widespread poverty and high levels of chronic malnutri on.
The Comprehensive Food Security and Vulnerability Analysis (CFSVA) and Nutri on
in Rwanda, following those of 2006 and 2009. The purpose is to gain a be er understanding of the nature and extent of food insecurity and malnutri on in the country. It seeks to analyse trends of food insecurity and malnutri on over me, measuring their extent and depth and iden fying their underlying causes.
In addi on, building on the recently released ‘Third Integrated Household Living Condi ons Survey’ (EICV 3) and ‘Rwanda Demographic Health Survey 2010’ (DHS 2010), this study is specifi cally geared towards producing evidence based support for targe ng (including at district level) of social protec on and other assistance aimed at elimina ng food insecurity and malnutri on in Rwanda.
1 EICV 3
Rwanda’s great economic progress remains tempered by poverty, high popula on growth and malnutri on
2
) and increasing agricultural produc on. It also has a rapidly growing
Survey 2012 is the third of its kind conducted
and Family Promo on (MIGEPROF).

In March/April 2012, one in fi ve Rwandan households (21%) had unacceptable food consump on and could be considered to be food insecure. Out of the total popula on, 4% had poor food consump on (82,000 households), which represents an extremely insuffi cient and unbalanced diet, and 17% borderline food consump on (378,000 households). These fi gures show clear improvement since the 2006 CFSVA and seem to indicate a slight, although not confi rmed, improvement in household food consump on since the last CFSVA and Nutri on Survey was conducted in February/March 2009.
3
This CFSVA uses the food consump on score as a preferred single indicator of ‘current’ household food security. Households with poor or borderline food consump on are considered to be food insecure while those with acceptable food consump on are food secure.
Likely improvement in food security in last three years
Food insecurity by province 2012 vs 2009 Confi dence interval: 95%
Source: CFSVA and Nutri on Survey, 2009 and 2012

4
2Was ng, measured by weight-for-height3(CI 3.1-4.3%).4
weight for age5(CI: 10.9-13.2%)6WHO child growth standards7Stun ng, measured by height-for-age849% in 1992, 51% in 2005, 44% in 20109(CI: 42.7-45.2%)
Acute malnutri on among children aged between six months and fi ve years2 is the only nutri on indicator within ’acceptable’ limits (3.6%).3 The prevalence of underweight,4 at 12%5 is classifi ed as ‘poor’.6
The prevalence of chronic malnutri on7 among children of this age has remained ‘very high’ in Rwanda over the last 20 years8 and s ll stands at 43%,9 making it one of the countries with the highest chronic malnutri on rates in the region.
Stun ng rates remain very high
Young mothers, mothers who have not completed secondary educa on and mothers who are stunted themselves are more likely to have stunted children.
The smaller the newborn, the more likely the child is to be stunted later on. A er birth, stun ng levels increase with age, par cularly a er the fi rst year, confi rming that the process of chronic undernutri on starts in the mother’s womb. In Rwanda, boys are more stunted than girls.
Refl ects both chronic and acute malnutri on, measured as
5
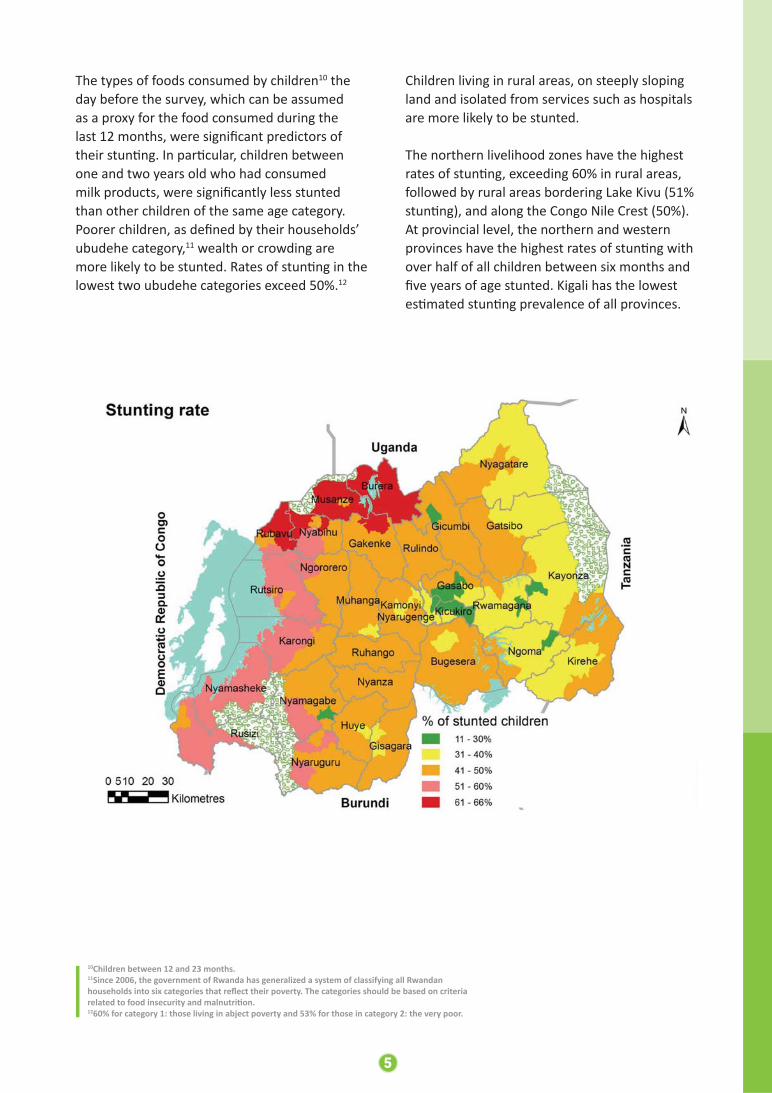
The types of foods consumed by children10 the day before the survey, which can be assumed as a proxy for the food consumed during the last 12 months, were signifi cant predictors of their stun ng. In par cular, children between one and two years old who had consumed milk products, were signifi cantly less stunted than other children of the same age category.Poorer children, as defi ned by their households’ ubudehe category,11 wealth or crowding are more likely to be stunted. Rates of stun ng in the lowest two ubudehe categories exceed 50%.12
Children living in rural areas, on steeply sloping land and isolated from services such as hospitals are more likely to be stunted.
The northern livelihood zones have the highest rates of stun ng, exceeding 60% in rural areas, followed by rural areas bordering Lake Kivu (51% stun ng), and along the Congo Nile Crest (50%). At provincial level, the northern and western provinces have the highest rates of stun ng with over half of all children between six months and fi ve years of age stunted. Kigali has the lowest es mated stun ng prevalence of all provinces.
10Children between 12 and 23 months.11Since 2006, the government of Rwanda has generalized a system of classifying all Rwandan households into six categories that refl ect their poverty. The categories should be based on criteria related to food insecurity and malnutri on.1260% for category 1: those living in abject poverty and 53% for those in category 2: the very poor.

6

7
13The 40% poorest households as measured by the wealth index.
In Rwanda in March/April 2012, the food insecure were typically poor, rural households, living in small crowded homes, depending on low income agriculture and casual labour.
Household level poverty (measured by the wealth index) is an underlying cause of both food insecurity and malnutri on. Households in the two poorest wealth quin les13 account for 73% of households with poor food consump on and 64% of households with borderline food consump on. Poor households simply cannot aff ord to access enough nutri ous food to live a healthy ac ve life or to invest in their livelihood. They are more vulnerable to high food prices - especially during the lean season when their own stocks have run dry. And they have no monetary buff er to protect them from the consequences of shocks such as drought, fl ooding, illness, crop disease etc.
The food insecure are more likely to rely on a small number of livelihood ac vi es; o en have no kitchen garden and their household food stocks are not suffi cient to last through the lean season un l the next harvest. The further households are located from a main road or market, the more likely they are to be food insecure. Food insecure households are more likely to be headed by a lowly educated, elderly person. The higher the level of educa on of the household head, the lower the likelihood of the household having a low food consump on score. By the same token, the lower the level of a mother’s educa on the greater the chances of her having chronically malnourished (stunted) children.
Having a higher number of livelihood ac vi es is signifi cantly associated with be er food consump on and food security. Households relying on more diversifi ed ac vi es, and especially urban households not involved in agricultural produc on, are be er off in terms of food security.
Low income agriculturalists, agricultural workers and unskilled daily labourers (among the main livelihood ac vi es in the country) have a lower food consump on score than households that are relying on livelihoods such as employment and business, agro-pastoralism, agriculture with medium/high income, selling of agriculture products, and those involved in informal selling.
In Rwanda, households that are not involved in agriculture at all are rela vely be er off than those that are. However, 85% of households in Rwanda cul vate land and rely on agriculture or livestock as the main (and o en only) livelihood ac vity. For many of these households, access to produc ve land is a problem. The smaller the plot they are cul va ng the more likely they are to have a low food consump on score. Some 60% of farming households cul vate plots smaller than 0.5 ha (26% below 0.2 ha) o en on steep slopes with poor soil fer lity.
The food insecure are poor, rural families with irregular incomes

8
Over 80% of food insecure households and households with stunted children live in rural villages.14 Percentages of households with unacceptable food consump on are especially high in the rural areas bordering Lake Kivu (42%). and West and East of the Congo Nile Crest (43% and 29% respec vely), where soils are less fer le and the land more suscep ble to erosion. Food insecure households are likely to live in remote villages far from the main roads. The further
households are from a main road, market, hospital or other public infrastructure, the more likely they are to be food insecure and their children are to be stunted.
The western province accounts for the largest numbers and highest rates of food insecure households.15 Although it is home to less than a quarter of all Rwandan households, half of all households with poor food consump on
Remote households and those in the western province face greater risk of food insecurity
1489% and 84% of households respec vely1565% of the rural households with unacceptable food consump on
9
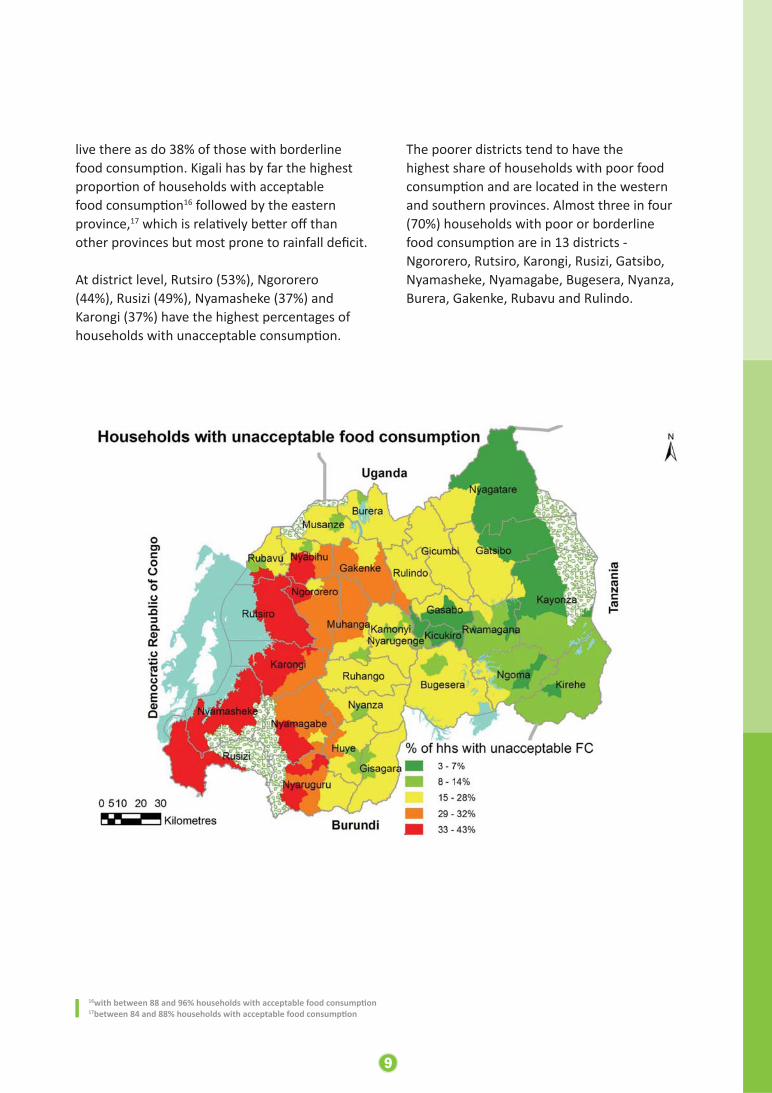
live there as do 38% of those with borderline food consump on. Kigali has by far the highest propor on of households with acceptable food consump on16 followed by the eastern province,17 which is rela vely be er off than other provinces but most prone to rainfall defi cit.
At district level, Rutsiro (53%), Ngororero (44%), Rusizi (49%), Nyamasheke (37%) and Karongi (37%) have the highest percentages of households with unacceptable consump on.
The poorer districts tend to have the highest share of households with poor food consump on and are located in the western and southern provinces. Almost three in four
food consump on are in 13 districts - Ngororero, Rutsiro, Karongi, Rusizi, Gatsibo, Nyamasheke, Nyamagabe, Bugesera, Nyanza, Burera, Gakenke, Rubavu and Rulindo.
16with between 88 and 96% households with acceptable food consump on17between 84 and 88% households with acceptable food consump on
(70%) households with poor or borderline

10
Lack of food availability does not seem to be driving food insecurity. Food produc on is increasing in Rwanda, markets are func oning rela vely well and food is fl owing easily within and outside the country thanks to the well-connected road network and market infrastructure.
One fi h (20%) of all households experienced recurrent seasonal challenges accessing food for their families (seasonal food access problems) in the year preceding the survey, while 17% experienced unusual diffi cul es at some point in the year in providing their families with food (acute food access problems) and 14% encountered these problems for most of the year (chronic food access problems). So in total, 51% of all households reported some type of diffi culty
Rwandans face seasonal food access problems and are becoming increasingly market dependent
in accessing food in the 12 months preceding the survey.
Household reliance on markets is increasing, and cons tutes the main source of food for Rwandans21 who, on average, spend almost half of their expenses on food. Seasonal price varia ons of staple crops are an important constraint to household access to food, especially during the lean seasons when private food stocks have run dry. Seasonal falls in demand for casual labour may also explain the seasonality of food security pa erns for those households that rely on casual work as a livelihood source. Finally, as expected, households that s ll had food stocks from their last harvest available at the me of the survey had be er food consump on and were signifi cantly more food secure than those who did not.
21 Markets provide, on average, 65% of the food consumed by a household with own produc on contribu ng an average of 30%. Other sources include fi shing, gathering, hun ng, exchange, borrowing, gi s and food aid.
Percentage of households repor ng seasonal, acute and chronic diffi cul es in accessing food by wealth quin le
Percentage of households repor ng seasonal, acute and chronic diffi cul es in accessing food by province

11
Almost half (45%) of Rwanda’s popula on faces the prospect of losing a major part of their livelihoods and becoming food insecure if confronted with moderate or severe rainfall defi cits. If a major rainfall defi cit were to aff ect the East (which happens every 4-5 years) an addi onal 170,000 households would become food insecure.
A fi h of Rwandan households are vulnerable to fl ooding with those in the southern and western provinces more exposed. As with drought/rain shortages, it is the high number of farming households, the poor and those that already have borderline food consump on pa erns, that are hit hardest.
Clima c shocks increase household vulnerability to food insecurity
Recommenda ons
Based on these results, this report formulates recommenda ons on the way forward to improve food and nutri on security in Rwanda. They are related to:
Upgrading household living condi ons, strengthening livelihood strategies and tackling
Monitoring and further analysing the food security and malnutri on situa on. Improving child food consump on Building community resilience to food and nutri on insecurity Developing and diversifying agricultural produc on
poverty
Improving coverage and targe ng of assistance and social protec on safety nets

For more informa on, please contact:
Ernest Ruzindaza, Permanent Secretary
Yusuf Murangwa, Director General NISR: yusuf.murangwa@sta s cs.gov.rw
Abdoulaye Balde, Representa ve & Country Director WFP: Abdoulaye. [email protected]
MINAGRI: [email protected]