millstone power station, unit 2, startup test report for ...criteria of the tests. all technical...
TRANSCRIPT
Dominion Nuclear Connecticut, Inc. • DominionMillstone Power Station Dominion-Rope Ferry RoadWaterford, CT 06385
U.S. Nuclear Regulatory Commission Serial No. 12-758Attention: Document Control Desk MPS Lic/WEB ROWashington, DC 20555 Docket No. 50-336
License No. DPR-65
DOMINION NUCLEAR CONNECTICUT, INC.MILLSTONE POWER STATION UNIT 2STARTUP TEST REPORT FOR CYCLE 22
Pursuant to Section 6.9.1.3 of the Millstone Power Station Unit 2 TechnicalSpecifications, Dominion Nuclear Connecticut, Inc. hereby submits the enclosed StartupTest Report for Cycle 22.
If you have any questions or require additional information, please contactMr. William D. Bartron at (860) 444-4301.
Sincerely,
Stephen E. ScaceSite Vice President - Millstone
Enclosure: (1)
Commitments made in this letter: None
cc: U.S. Nuclear Regulatory CommissionRegion I Administrator2100 Renaissance Blvd, Suite 100King of Prussia, PA 19406-2713
James S. KimNRC Project ManagerU.S. Nuclear Regulatory Commission, Mail Stop 08 C2AOne White Flint North11555 Rockville PikeRockville, MD 20852-2738
NRC Senior Resident InspectorMillstone Power Station
Serial No. 12-758MPS Unit 2 Startup Test Report For Cycle 22
bc Page 2 of 2Action Plan/Commitments (Stated or Implied)
1. None
Required Changes to the UFSAR or QA Topical Report
1. None
*Verification of Accuracy
1. EN 21004K, "Cycle 22, Low Power Physics Test"
2. EN 21004J, "Cycle 22, Power Ascension Testing"
3. ETE-NAF-2012-0140, Rev. 0, Attachment A, "Millstone Unit 2, Cycle 22, Startupand Operations Report," October 2012 (Areva NP, Inc. Proprietary).
4. SP 21010, "CEA Drop Times"
5. WCAP-1 6011-P-A Revision 0, "Startup Test Activity Reduction Program,"February 2005
6. ETE-MP-2012-1174, Rev 0, "Application of the Startup Test Activity Reduction(STAR) Program for Cycle 22," November 20, 2012

Serial No. 12-758MPS Unit 2 Startup Test Report For Cycle 22
Enclosure
Enclosure
Millstone Power Station Unit 2Startup Test Report For Cycle 22
Serial No. 12-758Enclosure/Page 1
Table of Contents
1. SUMMARY 2
2. INTRODUCTION 3
3. LOW POWER PHYSICS TESTING RESULTS 3
3.1 Unrodded Critical Boron Concentration 4
3.2 Moderator Temperature Coefficient 4
3.3 Control Element Assembly Rod Worth Parameters 5
3.4 Rodded Critical Boron Concentration 5
3.5 Control Rod Drop Time Measurements 5
4. POWER ASCENSION TESTING RESULTS 6
4.1 Power Peaking, Linear Heat Rate and Incore Tilt Measurements 6
4.2 Critical Boron Measurements 7
4.3 Hot Zero Power (HZP) to Hot Full Power (HFP) Critical Boron Difference 7
4.4 Flux Symmetry Measurements 8
4.5 Moderator Temperature Coefficient 8
4.6 Reactor Coolant System Flow 9
4.7 Core Power Distributions 9
4.8 Reactor Coolant System Radiochemistry 10
5. REFERENCES 11
6. FIGURES 11
6.1 Cycle 22 Core Loading Map 12
6.2 69% Core Power Distribution Map 13
6.3 100% Core Power Distribution Map 14
December 2012

Serial No. 12-758Enclosure/Page 2
SUMMARY
The Millstone Power Station Unit 2 (MPS2) refueling outage preceding the Cycle22 startup was approximately 48 days, starting on October 6, 2012 and endingon November 23, 2012.
The results of the MPS2, Cycle 22 low power physics testing and powerascension testing programs were in good agreement with the core designpredictions. All measured parameters were within the review and acceptancecriteria of the tests. All Technical Specification Limiting Conditions ofOperation (LCOs) were met.
Implementation of the Startup Test Activity Reduction (STAR) Program forMPS2 Cycle 22 has been accomplished in accordance with the steps outlined inWCAP-16011-A-P, Rev. 0 for (1) core design, (2) Control Element Assembly(CEA) lifetime, and (3) fuel and CEA fabrication. The STAR applicabilityrequirements for refueling have been accomplished for core verification, CEAcoupling verification and startup testing. The application of the STAR Programallowed for the elimination of control rod worth measurements from the startupphysics testing.
December 2012

Serial No. 12-758Enclosure/Page 3
2. INTRODUCTION
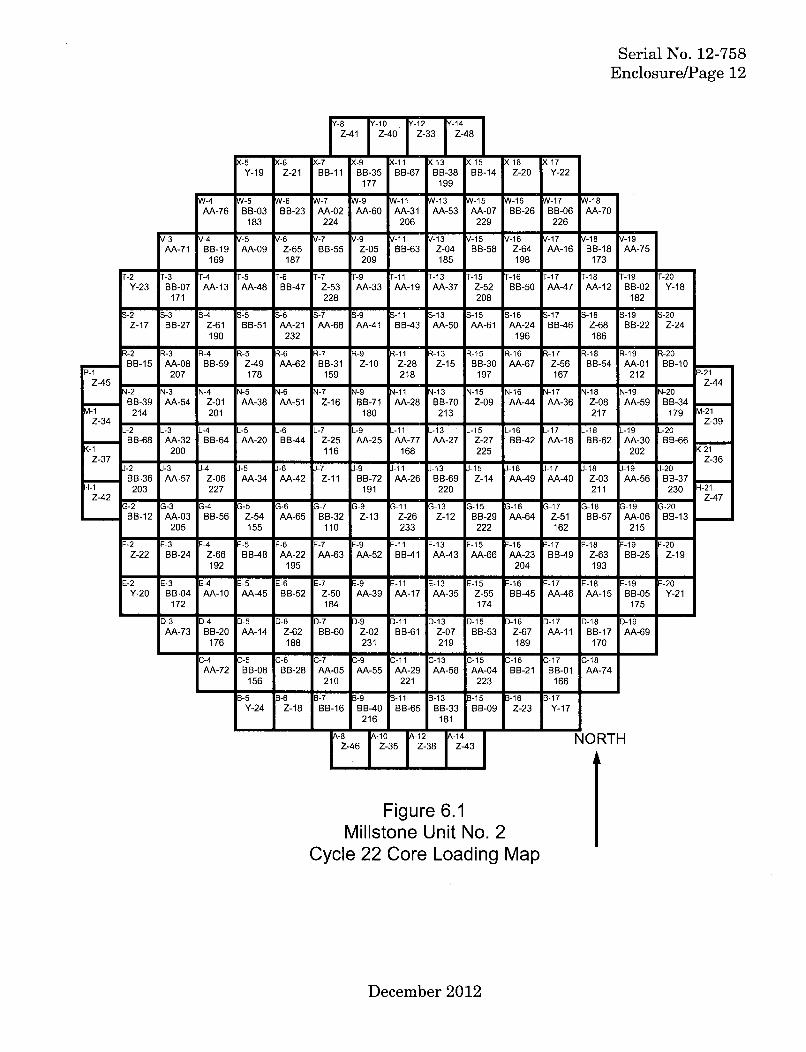
The MPS2 Cycle 22 fuel loading was completed on November 8, 2012. Theattached core map (Figure 6.1) shows the final core loading. The subsequentoperation/testing milestones were completed as follows:
Initial Criticality November 21, 2012
Low Power Physics Testing Complete November 22, 2012
Turbine On-Line November 23, 2012
30% Power Testing Complete November 23, 2012
69% Power Testing Complete November 24, 2012
100% Power Testing Complete December 5, 2012
The MPS2 Cycle 22 core is comprised of 217 AREVA manufactured fuelassemblies.
3. LOW POWER PHYSICS TESTING RESULTS
Low Power Physics Testing was conducted at a power level of approximately2 x 10-2 % power.
December 2012

Serial No. 12-758Enclosure/Page 4
3.1 Unrodded Critical Boron Concentration
The Critical Boron Concentration (CBC) measured with CEA Group 7 at148 steps withdrawn and a reactor coolant system (RCS) temperature of528.2°F was 1571 ppm.
Adjusted to the prediction conditions of Group 7 at 180 steps withdrawnand an RCS temperature of 532°F yields an adjusted, measured CBC of1582 ppm.
Adjusted, measured unrodded CBC
Predicted unrodded CBC
= 1582 ppm
= 1578 DDm
Difference 4 ppm (30 pcm)
Review Criteria is ± 50 ppm of the predicted CBC.
Acceptance Criteria is ± 1000 pcm of the predicted CBC.
Review and Acceptance Criteria met? Yes.
3.2 Moderator Temperature Coefficient
The Isothermal Temperature Coefficient (ITC) measurements wereperformed at a boron concentration of 1571 ppm, an average RCStemperature of 529.3°F, and CEA Group 7 at 148 steps.
The measured ITC at these conditions was +0.97 pcm/°F.
Adjusted to the prediction conditions for an RCS boron concentration of1565 ppm and an RCS temperature of 532°F yields an adjusted, measuredITC of +0.77 pcm/°F.
Adjusted, measured ITC
Predicted ITC
= +0.77 pcm/°F
= +0.96 ncm/°F
Difference = -0.19 pcm/°F
Review Criteria is ± 2 pcm/°F of the predicted ITC.
December 2012
Serial No. 12-758Enclosure/Page 5
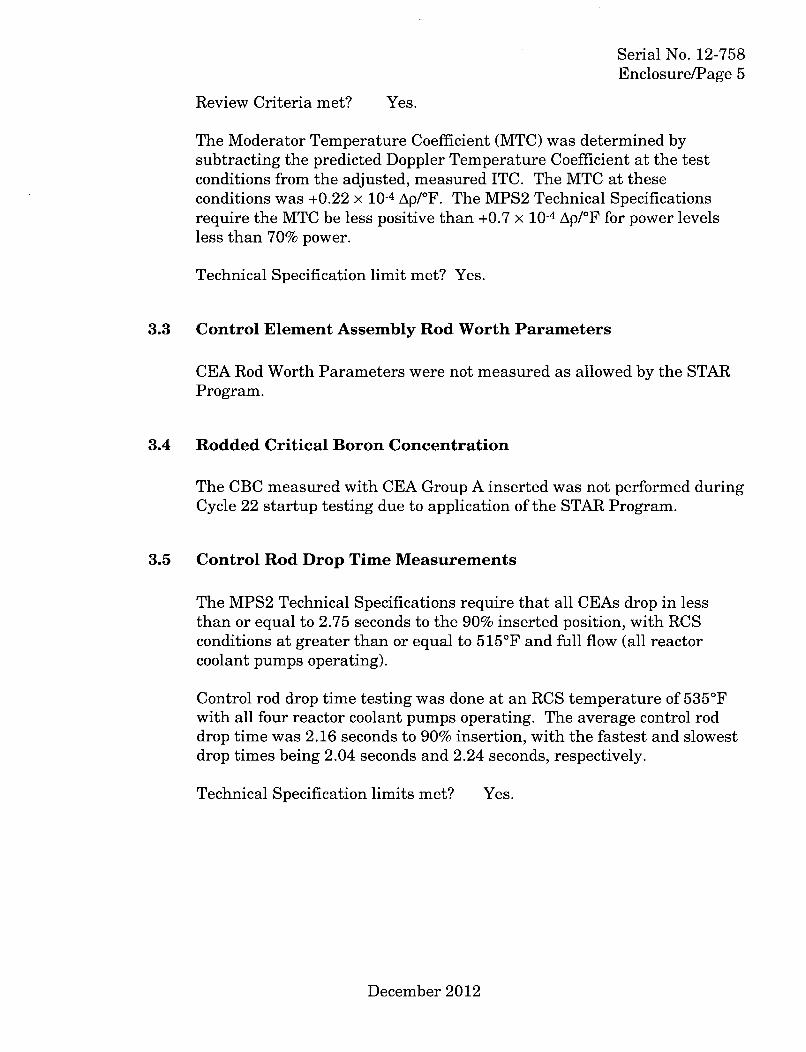
Review Criteria met? Yes.
The Moderator Temperature Coefficient (MTC) was determined bysubtracting the predicted Doppler Temperature Coefficient at the testconditions from the adjusted, measured ITC. The MTC at theseconditions was +0.22 x 10⁻⁴ Ap/°F. The MPS2 Technical Specificationsrequire the MTC be less positive than +0.7 x 10⁻⁴ Ap/°F for power levelsless than 70% power.
Technical Specification limit met? Yes.
3.3 Control Element Assembly Rod Worth Parameters
CEA Rod Worth Parameters were not measured as allowed by the STARProgram.
3.4 Rodded Critical Boron Concentration
The CBC measured with CEA Group A inserted was not performed duringCycle 22 startup testing due to application of the STAR Program.
3.5 Control Rod Drop Time Measurements
The MPS2 Technical Specifications require that all CEAs drop in lessthan or equal to 2.75 seconds to the 90% inserted position, with RCSconditions at greater than or equal to 515'F and full flow (all reactorcoolant pumps operating).
Control rod drop time testing was done at an RCS temperature of 535°Fwith all four reactor coolant pumps operating. The average control roddrop time was 2.16 seconds to 90% insertion, with the fastest and slowestdrop times being 2.04 seconds and 2.24 seconds, respectively.
Technical Specification limits met? Yes.
December 2012

Serial No. 12-758Enclosure/Page 6
4. POWER ASCENSION TESTING RESULTS
4.1 Power Peaking, Linear Heat Rate and Incore Tilt Measurements
The following core power distribution parameters were measured during thepower ascension to ensure compliance with the Technical Specifications:
* Total Unrodded Integrated Radial Peaking Factor (FrT) is the ratio of thepeak fuel rod power to the average fuel rod power in an unrodded core.This value includes the effect of Azimuthal Power Tilt.
* Linear Heat Rate (LHR) is the amount of power being produced perlinear length of fuel rod.
* Azimuthal Power Tilt is the maximum difference between the powergenerated in any core quadrant (upper or lower) and the average power ofall quadrants in that half (upper or lower) of the core divided by theaverage power of all quadrants in that half (upper or lower) of the core.
The measurements of these parameters were:
Power Level FrT Peak Linear Heat Rate Incore Tilt69% 1.571 9.14 KW/ft 0.0079
100% 1.556 12.71 KW/ft 0.0081
The corresponding technical specification limits for all power levels for theseparameters are:
" FrT < 1.69 (Note - larger values of FrT are permissible at less than 100%power)
" Peak Linear Heat Rate __ 15.1 KW/ft* Azimuthal Power Tilt _ 0.02
Technical Specification limit for FrT met? Yes.
Technical Specification limit for LHR met? Yes.
Technical Specification limit for Tilt met? Yes.
December 2012

Serial No. 12-758Enclosure/Page 7
4.2 Critical Boron Concentration Measurements
CBC measurement was performed at 100% power at equilibrium xenonconditions.
The CBC measured at 100% power with CEA Group 7 at 180 stepswithdrawn and an RCS cold leg temperature of 544.1°F was 1099 ppm.The cycle average exposure at the time of this measurement was 351Megawatt Days per Metric Ton Uranium (MWD/MTU).
Adjusted to the prediction conditions of 100% power at an All Rods Out(ARO) condition and an RCS cold leg temperature of 545 'F yields anadjusted, measured CBC of 1099.8 ppm.
Adjusted, measured 100% power CBC =
Predicted 100% Dower CBC
1099.8 ppm
1099.6 DDm
Difference 0.2 ppm (2 pem)
Review Criteria is ± 50 ppm of the predicted CBC.
Acceptance Criteria is ± 1000 pcm of the predicted CBC.
Review and Acceptance Criteria met? Yes.
4.3 Hot Zero Power (HZP) to Hot Full Power (HFP) Critical BoronConcentration Difference
The difference in the adjusted measured CBC performed at HZP and HFPwas determined and compared to the design prediction.
Predicted change in CBC from HZP to HFP = 478.4 ppm
Adiusted, measured change in CBC from HZP to HFP = 481.8 DDm
Difference = -3.4 ppm
Review Criteria is ± 50 ppm of the predicted CBC difference.
Review Criteria met? Yes.
December 2012

Serial No. 12-758Enclosure/Page 8
4.4 Flux Symmetry Measurements
The core neutron flux symmetry was measured at approximately 30% powerusing the fixed incore detector monitoring system. The differences betweenmeasured and calculated signals in operable incore detector locations rangedfrom -0.043 to +0.040.
Review Criteria is ± 0.10.
Review Criteria met? Yes.
The maximum azimuthal asymmetry in the neutron flux frommeasurements of the variation in incore detector signals from symmetricincore detectors was 2.60%
Review Criteria is ± 10%.
Review Criteria met? Yes.
4.5 Moderator Temperature Coefficient
The ITC measurements were performed at a power level of 98.49 %, anRCS boron concentration of 1099 ppm, and an average RCS temperatureof 569.27°F, and CEA Group 7 at 180 steps.
The measured ITC at these conditions was -7.234 pcm/°F.
The predicted ITC was determined for a power level of 100%, an RCSboron concentration of 1122 ppm, an average RCS temperature of 570.1°F,and at an ARO condition.
The predicted ITC at these conditions was -7.290 pcm/°F.
The predicted ITC adjusted for 98.49% power, an actual RCS boronconcentration of 1099 ppm and an RCS temperature of 569.27°F yields anadjusted, predicted ITC of -7.490 pcm/°F.
Adjusted, Predicted ITC = -7.490 pcm/°F
Measured ITC = -7.234 pcm/PF
Difference = -0.256 pcm/°F
Review Criteria is ± 2 pcm/°F of the predicted ITC.
December 2012
Serial No. 12-758Enclosure/Page 9
Review Criteria met? Yes.
The MTC was determined by subtracting the predicted DopplerTemperature Coefficient at the test conditions from the measured ITC.The MTC at these conditions was -0.6 x 10⁻⁴ Ap/°F. The MPS2 TechnicalSpecifications require the MTC be less than or equal to +0.4 x 10⁻⁴ Ap/°Ffor power levels greater than 70% power.
Technical Specification limit met? Yes.
4.6 Reactor Coolant System Flow
The RCS flow rate was measured using the secondary calorimetric method,in which the RCS flow rate is inferred by performing a heat balance aroundthe steam generators and RCS to determine reactor power, and measuringthe differential temperature across the reactor core to determine theenthalpy rise.
The measured RCS flow rate at 100% power was 390,541 gallons per minute(GPM).
When 13,000 GPM is subtracted from the measured flow rate to account formeasurement uncertainties, the Minimum Guaranteed Safety Analysis RCSFlow Rate is 377,541 GPM. This value is used to satisfy the technicalspecification surveillance requirement.
The MPS2 Technical Specifications require the RCS flow rate to be greaterthan 360,000 GPM.
Technical Specification limit met? Yes.
4.7 Core Power Distributions
The core power distribution measurements were inferred from the signalsobtained by the fixed incore detector monitoring system. Thesemeasurements were performed at 69% power and 100% to determine if themeasured and predicted core power distributions are consistent.
The core power distribution map for 69% power, cycle average exposure of 23MWD/MTU, non-equilibrium xenon conditions is shown in Figure 6.2. Thismap shows that there is good agreement between the measured andpredicted values.
December 2012

Serial No. 12-758Enclosure/Page 10
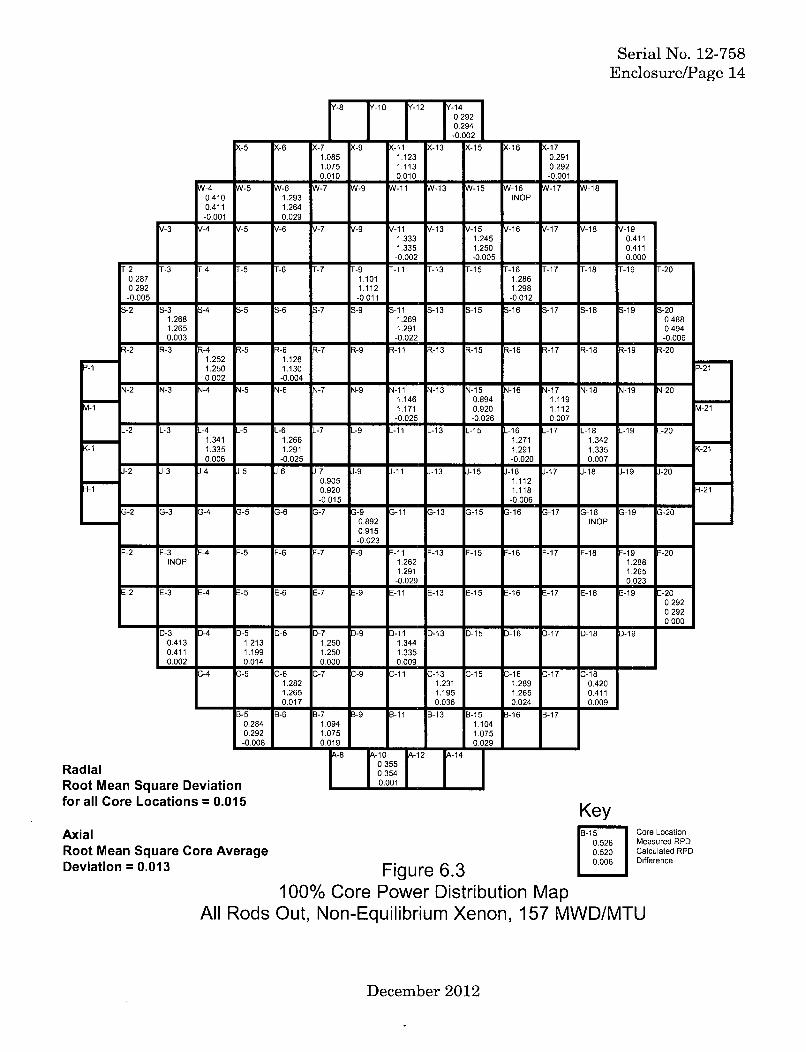
The core power distribution map for 100%, cycle average exposure of 157MWD/MTU, non-equilibrium xenon conditions is shown in Figure 6.3. Thismap also shows that there is good agreement between the measured andpredicted values.
The review criteria for these measurements are:
1. The difference between the measured and predicted Relative PowerDensities (RPDs) for core locations with an operable incore detector isless than 0.1.
2. The Root Mean Square (RMS) deviation for radial and axial powerdistributions between the measured and predicted values is less than0.05.
Review Criteria met? Yes, for both 69% and 100% power.
4.8 Reactor Coolant System Radiochemistry
RCS radiochemistry analysis during the power ascension testing programand during subsequent power operation indicate activity levels with Iodine-131 values of about 2.6 x 10⁻⁴ gCi/ml. These RCS activity levels show thereare no failed fuel assemblies resident in the core.
December 2012
Serial No. 12-758Enclosure/Page 11
5. REFERENCES
5.1 EN 21004K, "Cycle 22, Low Power Physics Test"
5.2 EN 21004J, "Cycle 22, Power Ascension Testing"
5.3 ETE-NAF-2012-0140, Rev. 0, Attachment A, "Millstone Unit 2, Cycle 22,Startup and Operations Report," October 2012 (Areva NP, Inc. Proprietary).
5.4 SP 21010, "CEA Drop Times"
5.5 WCAP-16011-P-A Revision 0. "Startup Test Activity Reduction Program,"February 2005
5.6 ETE-MP-2012-1174, Rev 0, "Application of the Startup Test ActivityReduction (STAR) Program for Cycle 22," November 20, 2012
6. FIGURES
6.1 Cycle 22 Core Loading Map
6.2 69% Core Power Distribution Map
6.3 100% Core Power Distribution Map
December 2012
Serial No. 12-758Enclosure/Page 12
Zr41 I~ Z- rZ-3 -48flu - S - S - S - S - S - S - S -
<-9 <-1 1 <-16 <-17
B 8-35 BB-67 Z-20 Y-22
K-5Y-19
K-6Z-21
K-7BB-11
K-9BB-35
177
K-1 1BB-67
K-13BB-38
199
K-15BB-14
K-16Z-20
K(-17Y-22
- a - a - a - a - a - a - a - a - a - a -N-4AA-76
N-5BB-03
183
N-6BB-23
N-7AA-02
224
N-9AA-60
N-i1AA-31
206
N-13AA-53
N-15AA-07
229
N-16BB-26
N-17BB-06
226
N-18AA-70
1-18 1-19
88-18 AA-75V-3
AA-71V-4BB-19
169
V-5AA-09
V-6Z-65187
V-7BB-55
V-9Z-05209
-1-1BB-63
V-13Z-04185
V-15BB-58
1-16Z-64198
V-17AA-16
V-18BB-18
173
V-19AA-75
P-iZ-45
M-1Z-34
K-iZ-37
H-1Z-42
T-2 T-3 T-4 T-5 T-6 T-7 T-9 T-11 T-13 T-15 T-16 T-17 T-18 T-19 T-20Y-23 BB-07 AA-13 AA-48 BB-47 Z-53 AA-33 AA-19 AA-37 Z-52 BB-50 AA-47 AA-12 BB-02 Y-18
171 228 208 182
S-2 S-3 S-4 S-5 S-6 S-7 S-9 S-11 S-13 S-15 S-16 S-17 S-18 S-19 S-20Z-17 BB-27 Z-61 BB-51 AA-21 AA-68 AA-41 BB-43 AA-50 AA-61 AA-24 BB-46 Z-68 BB-22 Z-24
190 232 196 186
R-2 R-3 R-4 R-5 R-6 R-7 R-9 R-11 R-13 R-15 R-16 R-17 R-18 R-19 R-20BB-15 AA-08 BB-59 Z-49 AA-62 BB-31 Z_10 Z-28 Z-15 BB-30 AA-67 Z-56 BB-54 AA-01 BB-10
207 178 159 218 197 167 212
N-2 N-3 N-4 N-5 N-6 N-7 N-9 N-11 N-13 N-15 N-16 N-17 N-18 N-19 N-20BB-39 AA-54 Z-0I AA-38 AA-51 Z-16 BB-71 AA-28 BB-70 Z-09 AA-44 AA-36 Z-08 AA-59 BB-34
214 201 180 213 217 179
L-2 L-3 L-4 L-5 L-6 L-7 L-9 L-11 L-13 L-15 L-16 L-17 L-18 L-19 L-20BB-68 AA-32 BB-64 AA-20 BB-44 Z-25 AA-25 AA-77 AA-27 Z-27 BB-42 AA-18 BB-62 AA-30 BB66
200 116 168 225 202
-2 J-3 J-4 J-5 J-6 J-7 -9 -11 J-13 J-15 J-16 J-17 J-18 J-19 J-20
BB-36 AA-57 Z-06 AA-34 AA-42 Z-11 BB-72 AA-26 BB-69 Z-14 AA-49 AA-40 Z-03 AA-56 BB-37203 227 191 220 211 230
G-2 G-3 G-4 G-5 G-6 G-7 G-9 G-11 G-13 GS-15 -16 G-17 G-18 G-19 G-20BB-12 AA-03 BB-56 Z-54 AA-65 BB-32 Z-13 Z-26 Z-12 BB-29 AA-64 Z-51 BB-57 AA-06 BB-13
205 155 110 233 222 162 215
F-2 F-3 F-4 F-5 F-6 F-7 F-9 F-11 F-13 F-15 F-16 F-17 F-18 -19 F-20Z-22 BB-24 Z-66 BB-48 AA-22 AA-63 AA-52 BB-41 AA-43 AA-66 AA-23 BB-49 Z-63 BB-25 Z-19
192 195 204 193
E-2 E-3 E-4 E-5 E-6 E-7 E-9 E-11 E13 E-15 E-16 E-17 E618 19 E-20Y-20 BB-04 AA-10 AA-45 BB-52 Z-50 AA-39 AA-17 AA-35 Z-55 BB-45 AA-46 AA-15 BB-05 Y-21
172 184 174 175
' 2iZ-44
11-21Z-39
(-21Z-36
+I2iZ-47
D-3AA-73
D-4BB-20
176
D-5AA-14
D-6Z-62188
D-7BB-60
D-9Z-02231
D-11BB-61
D-13Z-07219
D-15BB-53
D-16Z-67189
D-17AA-11
D-18BB-17
170
D-19AA-69
- a - a - a - a - a - a - a - a - a - a - a - a -C-4AA-72
C-5BB-08
156
C-6BB-28
C-7AA-05
210
C-9AA-55
C-11AA-29
221
C-13AA-58
C-15AA-04
223
C-16BB-21
C-17BB-01
166
C-18AA-74
-4-4-4-4-4- a - a - a - a - a -B-5 B-6
Y-24 IZ-18B-7
BB-16B-9
BB-40216
B-11BB-65
B-13BB-33
181
B-15BB-09
B-16 B-17Z-23 IY-17
- a - a - a - a - a - a a - a -rZ-46 [Z-35 Z-38 Z-143
Figure 6.1Millstone Unit No. 2
Cycle 22 Core Loading Map
NORTH
December 2012

Serial No. 12-758Enclosure/Page 13
[8[1 [1 [10291r:4001- F - F - F - I - I - q - q - q -(-5 (-7 X-1 3 X-l 5 X-l 6 X-1 7
1107
0.289(-5 (-6 <-7
1 .-1 0 71.1000.007
(-9 X-1 11.1461.1390.007
X-1 3 X-1 5 X-16 X-1 7012890.2880,001
1.100 0.2860.007 0.001- F - F - F - F - F - I - q - q - q - q -N-S N-il W-17
N-4 W-18
N-40.405
-0.002
N-5 N-61.3141.2890.025
fV-1 1 W-13 W-15 W-16INOP
W-17 W-18
- - - - h - h - h - h - i - i i i h/-3
1-1913 /-4 /-5 /-6 /-7 /-9 /-11
1.3401.345-0.005
/-13 V-151.2531.258-0.005
V-16 V-17 V-18 /4190.4080.4070,001
'-1
(-1
K-1-
T-2 T-3 T-4 T-5 T-6 T-7 9 T-11 -13 T-15 -16 T-17 T-18 T-19 -200,284 1.085 1.2890.288 1.095 1.304-0.004 -0.010 -0.015
S-2 S-3 S-4 S-5 S-6 S-7 S-9 S-11 S-13 S-15 5-16 5-17 5-18 S-19 -201.288 1.248 0.4901.289 1.272 0.493
-0.001 -0.024 -0.003
R-2 R-3 R-4 R-5 R-6 R-7 R-9 Ru-11 R-13 R-15 R-16 R-17 R-18 R-19 R-201.256 1.1071.258 1.112
-0.002 -0.005
N-2 N-3 N-4 N-5 N-6 N-7 N-9 N- 1 N-13 N-15 N-16 N-17 N-18 N-19 N-201.116 0.868 1.1071.132 0.889 1.095
-0.016 -0.021 0.012L-2 L-3 L-4 L-5 L-6 L-7 L-9 L-11 L-13 L-15 L-16 L-17 L-18 L-19 L-20
1.350 1.243 1,253 1.3531.345 1.273 1.273 1.3450.005 -0.030 -0,020 0.008
J-2 J-3 J-4 J-5 J-6 J-7 J-9 J-11 J-13 J-15 J-16 J-17 "-18 -19 -200.876 1,0910.890 1.094-0,014 -0.003
0-2 0-3 G-4 G-5 G-6 0-7 G-9 G-11 G-13 G-15 G-16 G-17 0-18 0-19 G-200.865 INOP0.885
-0.020
F-2 F-3 F-4 E-5 F-6 F7 F-9 F-11 F-13 F-15 F-16 F-17 F-18 F-19 F-20INOP 1.241 1.312
1.273 1.289-0.032 0.023
-2 E-3 E-4 E-5 E-6 E-7 E-9 - "i--13 215 --16 E-17 6-18 6-19 E-200.2900,2880.002
(-21
M1-21
D-30.4090.4070.002
D-4 D-61.22512140.1
1.2561.258-0.002
0-111.3511.3450.006
D-13 D-15 D-16 D-17 D-18 0-19
- - - - U - S - S - S - S - S - S - S - S -,-6
1.3031.2890.014
3-7 C-9 -- 11 C-13 c15 - -16 IC-17 C-181.247 1 -i312 0.4171.212 1.289 0.4070.035 0.023 0.010
- - - F - U - F - F - F - F - F - F -3-5
0.2810.288-0.007
3-6 3-71.1161.1000.016
3-9 3-11 3-13 3-151.1271.1000.027
3-16 IB-17
- - . - . - . - . - . - . - . -r8-1 [12[14 Key15 Core Location0.5231 Measured RPD0.5151 Calculated RPD
DifferenceRoot Mean Square Deviationfor all Core Locations = 0.015
Figure 6.269% Core Power Distribution Map
All Rods Out, Non-Equilibrium Xenon, 23 MWD/MTU
December 2012
Serial No. 12-758Enclosure/Page 14
[8 [1 [1 [10292- - . - . - . - . - . - . - -
<-6 (-7 <-9 <-11 EX-13 IX-15 IX-16 IX-17K-6 K•-7
1 .0851.0750.010
K(-9 (-11 I-1 3 X-1 5 IX-16 IX-1 7
1 123 0.2911.11 3 0.292
0010 1 1 1 -0.001- - - h - - - I. - h - h - h - h -N-4
N-18N-4
0.4100.411-0.001
N-5 N-6 IW-7 N-91.2931.2640.029
N-11 N-13 N-15 N-16INOP
N-17 NV-18
1-3 1-4 /-18 1-19
V-3 V-4 V-5 1-6 /-7 1-9 /-111.3331.335
-0.002
/-13 1-151.2451.250-0.005
/-16 /-17 /-18 /0190.4110.4110.000
'-1
VIA
T-2 T-3 T-4 T-5 T-6 T-7 9 T-11 -13 T-15 T-16 T-17 T-18 T-19 T-200,287 1.101 1.2860,292 1.112 1.298-0.005 -0,011 -0.012
S-2 S-3 S-4 S-5 S-6 S-7 5-9 S-11 S-13 S-15 S-16 S-17 S-18 S-19 S-201.268 1.269 0.4881.265 1.291 0.4940.003 -0.022 -0.006
R-2 R-3 R-4 R-5 R-6 R-7 R-9 R-11 R-13 R-15 R-16 R-17 R-18 R-19 R-201 252 1.1261.250 1.1300,002 -0.004
N-2 N-3 N-4 N-5 N-6 N-7 N-9 N-11 N-13 N-15 N-16 N-17 N-18 N-19 6-201.146 0.894 1.1191.171 0.920 1.1120025 -0.026 0.007
L-2 L-3 L-4 L-5 L-6 L-7 L-9 L-1I L-13 L-15 L-16 L-17 L-18 L-19 L-201.341 1.266 1.271 1.3421.335 1.291 1.291 1.3350.006 -0025 -0020 0.007
J-2 J-3 J-4 J-5 J-6 J-7 J-9 j1-1 J-13 J-15 J-16 J-17 J-18 J-19 J-200.905 1,1120.920 1.118-0.015 -0.006
G-2 G-3 G-4 G-5 G-6 G-7 G-9 G-11 G-13 G-15 G-16 G-17 G-18 G-19 G-200.892 INOP0.915-0.023
F2 F-3 F-4 F-5 F-6 F-7 F-9 F-11 F-13 F-15 F-16 F-17 F-18 F-19 F-20INOP 1.262 1.288
1.291 1265-0.029 0023
E-2 E-3 E-4 E-5 E-6 E-7 8-9 E-11 E-13 E-15 E-16 E-17 E-18 E-19 .- 200 2920.2920.000
'-21
0-21
(-21
H-21
3-30.4130.4110n002
3-4 3-51.2131.199nn014
3-6 3-71.2501.250n nno
3-111.3441.3350.009
3-13 3-15 3-16 3-17 3-18 3-19
- 0009 - . - - I * - I - I -3-5 2-6
1.2821.2650.017
9-7 ,-11 L-13 IG-15 -16 8 -1i7 C-181.231 1.289 0,4201.195 1.265 0.411003 1 0024 0.009
- 9 I L I~ I~ I~ ~ I - I - I -3-5 lB-6
0.2840.292-0.008
-3-71.0941.0750.019
3-9 3-11 3-13 3-151.1041.0750.029
3-16 13-17
- & - & - & - & - & - & - & - & -
Radial 0,34035
Root Mean Square Deviation 0.00 1 4or1 €11ll C li~ L. tII•Fion
AxialRoot Mean Square CoDeviation = 0.013
S- U'" '"J Key- 5 Core Location
0,5261 Measured RPDore Average Calculated RPDFigure 6.3 0.006 Difference
100% Core Power Distribution MapAll Rods Out, Non-Equilibrium Xenon, 157 MWD/MTU
December 2012