millennials and financial literacy: a global perspective
TRANSCRIPT
Millennials and Financial Literacy: A Global Perspective | 1www.gflec.org
Millennials and Financial Literacy: A Global Perspective
May 2017
Authors: Annamaria Lusardi Noemi OggeroGlobal Financial Literacy Excellence Center, The George Washington University School of Business
Research support was provided by the Global Thinking Foundation.
Millennials and Financial Literacy: A Global Perspective | 1
Introduction 2
The importance of financial literacy for Millennials 2
Measuring financial literacy around the world 3
Financial literacy and GDP per capita 6
Financial literacy among Millennials 7
Financial literacy among Millennials and economic indicators 9
Case study: Italy 13
Conclusion 14
Appendix
References
Contents

Millennials and Financial Literacy: A Global Perspective | 2
Introduction
Every generation influences the economy, but Millennials, also known as Generation Y, have grown up in a time of rapid economic change, which gave them higher career expectations than previous generations. Millennials are, in fact, poised to reshape the economy: They have entered the workforce at a time of economic instability and are approaching critical points of their financial decision making.
Millennials are often referred to as the “instant-gratification generation,” with high expectations for their professional and personal lives (Bishop, 2006). The supreme confidence and high optimism characteristic of this generation have, indeed, informed its attitudes about professional achievement. With very high—and perhaps unrealistic—aspirations, Millennials are also prone to higher-than-average levels of disappointment. A study conducted in the United States found that Millennials are the most dissatisfied with their current earnings with regard to their ability to lead desirable lifestyles (Taylor and Keeter, 2010).
Millennials are also the first truly digital generation, raised amid laptop computers, cell phones, and rapidly advancing technology that is changing the way individuals interact and conduct business. Among other things, technology is altering where and how Millennials get their information, with the Internet displacing newspapers and television as the source for news (National Chamber Foundation, 2012). Global interconnectedness has also left Millennials increasingly reliant on peers for information and motivation.
Millennials will soon make up the largest share of the labor market: It is projected that by 2025, three out of every four workers globally will be Millennials (Schawbel, 2012). Their financial behavior will more greatly affect the global economy than the financial behavior of the generations that preceded them. To understand how prepared Millennials are to handle financial decision making, this paper examines the level of financial literacy of young people around the world, as well as factors associated with Millennials’ financial knowledge.
The importance of financial literacy for Millennials
In recent decades, governments and employers have increasingly transferred the responsibility for saving and investing onto individuals. For example, the reduction of state-supported pensions in some countries means individuals must save in order to provide for their own financial security after retirement. Decreasing generosity of welfare systems and increasing life expectancy have contributed to an environment in which it is more difficult to achieve financial security in retirement. Life expectancy is high and continues to increase, meaning that young people today will need to be able to support themselves for much longer than did past generations. Moreover, financial services and products have become more complex and more widely accessible due to globalization and digital technologies.
Financial literacy is an important element of economic and financial stability both for the individual and the economy. Wide-ranging developments in the financial marketplace have contributed to growing concerns about the level of financial literacy of citizens of many countries. Moreover, the recent financial crisis demonstrated that ill-informed financial decisions—often caused by a lack of financial literacy—can have tremendous negative consequences (OECD, 2009a; OECD, 2009b).

Millennials and Financial Literacy: A Global Perspective | 3
Financial literacy is essential for Millennials, as they face financial decisions that can have important consequences throughout their life. The financial choices that younger generations face are far more challenging than those faced by past generations. Individuals today must take on greater responsibility for decisions like investing in additional education and planning for retirement. When facing major decisions such as these, financial literacy is critical.
Financial ignorance carries significant costs. Consumers who fail to understand the concept of interest compounding incur more transaction fees, run up bigger debts, and engage in loans with higher interest rates (Lusardi and Tufano, 2015; Lusardi and de Bassa Scheresberg, 2013). They also end up borrowing more and saving less money (Stango and Zinman, 2009). Meanwhile, the potential benefits of financial literacy are manifold. People with strong financial skills do a better job planning and saving for retirement (Behrman et al., 2012; Lusardi and Mitchell, 2014). Financially savvy investors are more likely to diversify risk (Van Rooj, Lusardi, and Alessie, 2011).
Given the many ways financial literacy affects financial behavior (Lusardi and Mitchell, 2014), it is important to know the extent of people’s understanding of basic financial concepts as well as the degree to which financial skills fall short, especially among Millennials. The 2014 Standard & Poor’s Ratings Services Global Financial Literacy Survey (S&P Global FinLit Survey) provides this information across a wide array of countries. It builds on early initiatives by the International Network on Financial Education (INFE) of the Organization for Economic Co-operation and Development (OECD), the World Bank’s Financial Capability and Household Surveys, the Financial Literacy around the World (FLAT World) project, and numerous national survey initiatives that collect information on financial literacy.
Measuring financial literacy around the world
The S&P Global FinLit Survey delivers the most comprehensive global gauge of financial literacy to date. More than 150,000 nationally representative and randomly selected adults in more than 140 economies were interviewed.1 By showing where financial skills are strong and where they are lacking, the S&P Global FinLit can help stakeholders design policies and programs to improve the financial well-being of individuals around the world.
Financial literacy was measured using questions assessing basic knowledge of four fundamental concepts in financial decision making: numeracy (interest), compound interest, inflation, and risk diversification. The wording of the questions is as follows (the answer options are in brackets, with the correct answer in bold.)
• Numeracy (Interest)Suppose you need to borrow 100 US dollars. Which is the lower amount to pay back: 105 US dollars or 100 US dollars plus three percent? [105 US dollars; 100 US dollars plus three percent; don’t know; refuse to answer]
• Compound InterestSuppose you put money in the bank for two years and the bank agrees to add 15 percent per year to your account. Will the bank add more money to your account the second year than it did the first year,
1 For more information see Klapper, Lusardi, and van Oudheusden (2015).

Millennials and Financial Literacy: A Global Perspective | 4
or will it add the same amount of money both years? [more; the same; don’t know; refuse to answer]
Suppose you had 100 US dollars in a savings account and the bank adds 10 percent per year to the account. How much money would you have in the account after five years if you did not remove any money from the account? [more than 150 dollars; exactly 150 dollars; less than 150 dollars; don’t know; refuse to answer]
• InflationSuppose over the next 10 years the prices of the things you buy double. If your income also doubles, will you be able to buy less than you can buy today, the same as you can buy today, or more than you can buy today? [less; the same; more; don’t know; refuse to answer]
• RiskDiversificationSuppose you have some money. Is it safer to put your money into one business or investment, or to put your money into multiple businesses or investments? [one business or investment; multiple businesses or investments; don’t know; refuse to answer]
A person is defined as financially literate when he or she correctly answers at least three out of the four financial concepts described above. This definition was chosen because the concepts are basic and this is what would correspond to a passing grade. Based on this definition, 33 percent of adults worldwide are financially literate. In other words, roughly 3.5 billion adults globally, most of them in developing economies, lack an understanding of basic financial concepts. These global figures highlight deep disparities around the world (Figure 1).
Figure 1: Percentage of financially literate adults
Source:S&PGlobalFinLitSurvey.
The countries with the highest financial literacy rates are Australia, Canada, Denmark, Finland, Germany, Israel, the Netherlands, Norway, Sweden, and the United Kingdom, where about 65 percent or more of
[65,75][55,65][45,55][35,45][25,35][0,25]No data
Millennials and Financial Literacy: A Global Perspective | 5
adults are financially literate. Some of the countries with the lowest financial literacy scores are in South Asia, where only a quarter of adults—or fewer—are financially literate.
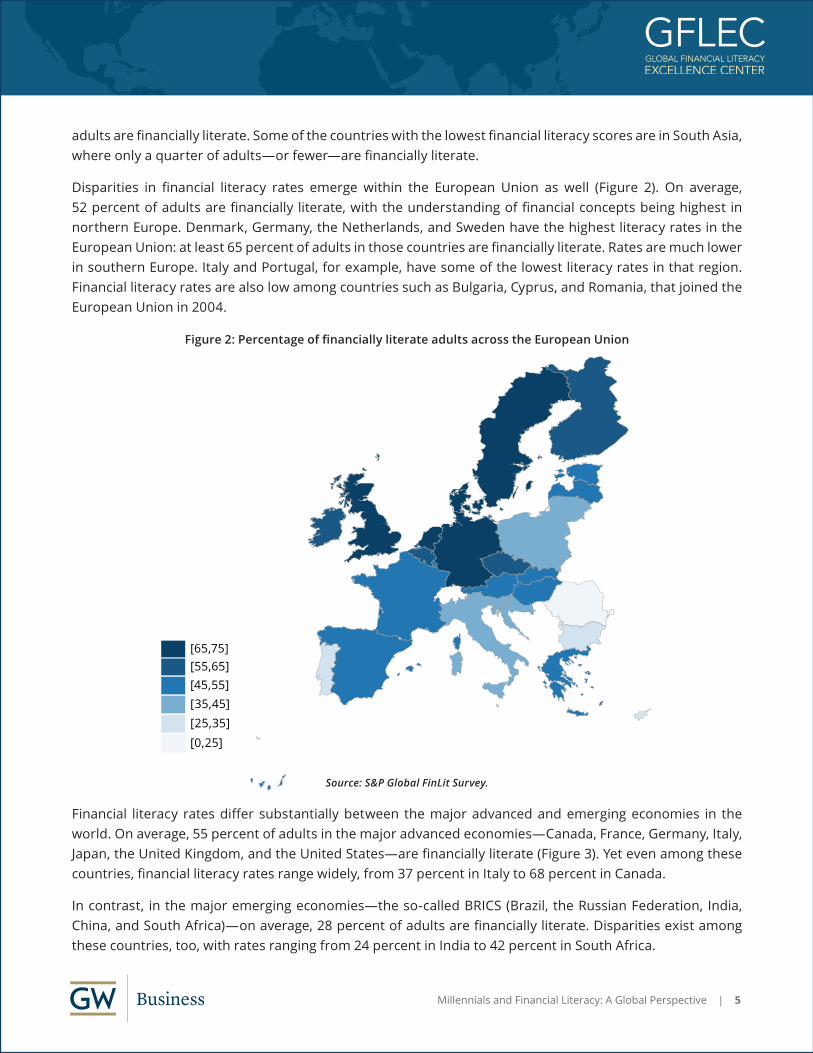
Disparities in financial literacy rates emerge within the European Union as well (Figure 2). On average, 52 percent of adults are financially literate, with the understanding of financial concepts being highest in northern Europe. Denmark, Germany, the Netherlands, and Sweden have the highest literacy rates in the European Union: at least 65 percent of adults in those countries are financially literate. Rates are much lower in southern Europe. Italy and Portugal, for example, have some of the lowest literacy rates in that region. Financial literacy rates are also low among countries such as Bulgaria, Cyprus, and Romania, that joined the European Union in 2004.
Figure 2: Percentage of financially literate adults across the European Union
Source:S&PGlobalFinLitSurvey.
Financial literacy rates differ substantially between the major advanced and emerging economies in the world. On average, 55 percent of adults in the major advanced economies—Canada, France, Germany, Italy, Japan, the United Kingdom, and the United States—are financially literate (Figure 3). Yet even among these countries, financial literacy rates range widely, from 37 percent in Italy to 68 percent in Canada.
In contrast, in the major emerging economies—the so-called BRICS (Brazil, the Russian Federation, India, China, and South Africa)—on average, 28 percent of adults are financially literate. Disparities exist among these countries, too, with rates ranging from 24 percent in India to 42 percent in South Africa.
[65,75][55,65][45,55][35,45][25,35][0,25]

Millennials and Financial Literacy: A Global Perspective | 6
Figure 3: Percentage of financially literate adults in major advanced and emerging economies
Source:S&PGlobalFinLitSurvey.
Financial literacy and GDP per capita
As mentioned earlier, there are large differences in financial literacy levels across countries. Income explains only a small fraction of those differences. Figure 4 shows financial literacy rates by income, proxied by GDP per capita. As displayed in the figure, financial literacy rates tend to be highest in the higher income economies. However, the relationship only holds when looking at the richest 50 percent of economies. In these economies, about 38 percent of the variation in financial literacy rates can be explained by differences in income across countries. For the poorest 50 percent of economies, with a GDP per capita of $12,000 or less, there is no evidence that income is associated with financial literacy. This likely means that national policies related to education shape financial literacy in these economies more than any other factor.
Figure 4: Financial literacy and GDP per capita
Source:S&PGlobalFinLitSurveyandGlobalFindexDatabase2014.
We encounter similar findings when looking at financial knowledge among the young. Data from the OECD’s 2012 Programme for International Student Assessment (PISA) show that living in a rich country has a modest
Cana
da
Fran
ce
Ger
man
y
Ital
y
Japa
n
Uni
ted
Kin
gdom
Uni
ted
Stat
es
Bra
zil
Chin
a
Indi
a
Sout
h A
fric
a
Russ
ian
Fede
rati
on
Major advanced economies
0%
20%
40%
60%
80%
Major emerging economies
68%
52%
66%
37%43%
67%
57%
35%28%
24%
38%42%
0%
20%
40%
60%
80%
700 12,000 70,000
Fina
ncia
l lit
erac
y ra
te
GDP per capita
Poorest 50%
Richest 50%

Millennials and Financial Literacy: A Global Perspective | 7
impact on the financial literacy scores of 15-year-olds (OECD, 2014a).2 Figure 5 shows the relationship between per capita GDP and students’ mean scores on the financial literacy assessment. While higher per capita GDP is associated with higher mean scores, some countries with lower per capita GDP perform better on financial literacy measures than higher income countries. For example, the mean scores of the Czech Republic, Estonia, and Poland are higher than those of Italy and the United States, both of which have higher per capita GDP (OECD, 2014a). Overall, per capita GDP only explains 16 percent of the variation in mean financial literacy scores among the 16 countries participating in the PISA financial literacy assessment.3 The fact that students in advanced economies do not score higher than students in less rich countries underscores the importance of having a well-functioning education system: Financial knowledge should be offered in a rigorous format in school curricula.
Figure 5: Financial literacy among 15-year-olds and GDP per capita
Source:PISA2012Results:StudentsandMoney:FinancialLiteracySkillsforthe21stCentury(VolumeVI).OECD(2014).
Financial literacy among Millennials
Financial literacy rates differ considerably between the major advanced and emerging economies even among people age 15–34. On average, Millennials in the major advanced economies are much more financially literate compared to their counterparts in emerging economies (Figure 6). Yet even within these two groups of countries, financial literacy rates vary widely, from 43 percent in Japan to 72 percent in Germany among advanced economies, and from 27 percent in India to 43 percent in South Africa among developing countries.
2 In 2012, PISA introduced the first optional financial literacy assessment, which measures the proficiency of 15-year-olds in demon-strating and applying financial knowledge and skills. A sample of students were selected from the same schools that completed PISA’s core assessments in mathematics, reading, and science. The optional assessment was conducted in a total of 18 countries and econo-mies. In two cases the assessment was performed only in a part of the country. 3 The two participating economies that represent specific subsets of their respective countries, i.e., the Flemish Community of Belgium and Shanghai-China of the People’s Republic of China, are not included in the regression.
Score points
GDP per capita (US$ converted using PPPs), 2010 or latest year
370
0
Colombia
Slovak Republic
Russian FederationLatvia
Poland
Estonia
Czech Republic
New Zealand Australia
Israel Italy
Spain France United States
10,000 20,000 30,000 40,000 50,000
420
470
520
CroatiaSlovenia

Millennials and Financial Literacy: A Global Perspective | 8
Figure 6: Percentage of financially literate Millennials in major advanced and emerging economies
Source:S&PGlobalFinLitSurvey.
In the major advanced economies, financial literacy rates display an inverse U-shaped profile; they increase initially with age but decline later in life, i.e., older people or older generations are less financially literate than middle-age ones (Figure 7). On average, 56 percent of adults age 35 or younger are financially literate, compared with 63 percent of those age 36 to 50. Financial literacy rates are even lower for adults older than 50, and rates are lowest among those older than 65. The pattern is different for the major emerging economies. In the BRICS, individuals age 15–35 have the highest financial literacy rates (32 percent), and adults age 65 plus have the lowest financial literacy rates (17 percent) of any age group.
Figure 7: Percentage of financially literate adults by age
Source:S&PGlobalFinLitSurvey.
Cana
da
Fran
ce
Ger
man
y
Ital
y
Japa
n
Uni
ted
Kin
gdom
Uni
ted
Stat
es
Bra
zil
Chin
a
Indi
a
Sout
h A
fric
a
Russ
ian
Fede
rati
on
Major advanced economies
0%
20%
40%
60%
80%
Major emerging economies
66% 67%
57%
46% 43%37% 35%
27%
39%43%
47%
72%
Age 15-35 Age 36-50 Age 51-65 Age 65+ Age 15-35 Age 36-50 Age 51-65 Age 65+
Major advanced economies Major emerging economies
0%
10%
20%
30%
40%
50%
60%
70%

Millennials and Financial Literacy: A Global Perspective | 9
Financial literacy sharply increases with educational attainment—which is strongly associated with math skills. Overall understanding of financial concepts tends to be high in countries where 15-year-old students performed well on the OECD’s 2012 PISA math test (OECD, 2014b). While there is generally a positive relationship between math scores among 15-years-olds and financial literacy rates (as shown in Figure 8), China, South Korea, Portugal, and Vietnam are notable outliers. In these countries, financial literacy rates (proxied by math) are much higher among young adults than older adults. These findings suggest that a general proficiency in math may be beneficial for understanding financial concepts. In some countries, young people have acquired a high math knowledge that may translate into much higher financial literacy in adulthood.
Figure 8: Relationship between S&P Global FinLit Survey and PISA 2012 scores
Source:S&PGlobalFinLitSurveyandOECDPISAdata(2014).
Financial literacy among Millennials and economic indicators
Analysis of the S&P Global FinLit Survey data sheds light on economic indicators that are associated with worldwide differences in financial literacy among Millennials. In particular, we will focus on the relationship between financial literacy among the young and factors such as formal and informal saving mechanisms, the use of the Internet, and the ability to come up with emergency funds among the G20.
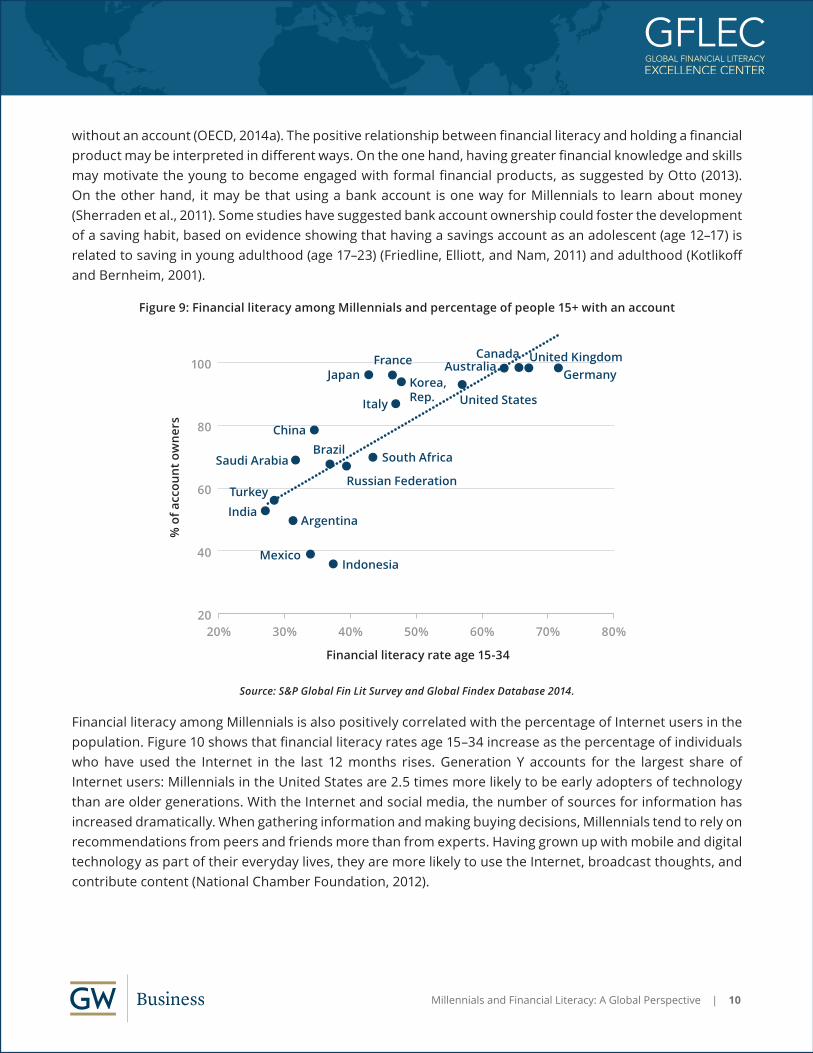
Figure 9 shows that there is a strong correlation between financial literacy among Millennials and the percentage of people age 15 and above who have their own or a joint account at a bank, or another type of formal financial institution. The association between performance in financial literacy and holding a bank account is related, in part, to socio-economic status. However, controlling for socio-economic status across OECD countries, research found that students with bank accounts score higher on average than students
ChinaSouth Korea
Portugal Vietnam
0%
10%
20%
30%
40%
50%
60%
70%
80%
350 400 450 500 550 600 650
2012 PISA math scores
Fina
ncia
l lit
erac
y ra
te
Millennials and Financial Literacy: A Global Perspective | 10
without an account (OECD, 2014a). The positive relationship between financial literacy and holding a financial product may be interpreted in different ways. On the one hand, having greater financial knowledge and skills may motivate the young to become engaged with formal financial products, as suggested by Otto (2013). On the other hand, it may be that using a bank account is one way for Millennials to learn about money (Sherraden et al., 2011). Some studies have suggested bank account ownership could foster the development of a saving habit, based on evidence showing that having a savings account as an adolescent (age 12–17) is related to saving in young adulthood (age 17–23) (Friedline, Elliott, and Nam, 2011) and adulthood (Kotlikoff and Bernheim, 2001).
Figure 9: Financial literacy among Millennials and percentage of people 15+ with an account
Source:S&PGlobalFinLitSurveyandGlobalFindexDatabase2014.
Financial literacy among Millennials is also positively correlated with the percentage of Internet users in the population. Figure 10 shows that financial literacy rates age 15–34 increase as the percentage of individuals who have used the Internet in the last 12 months rises. Generation Y accounts for the largest share of Internet users: Millennials in the United States are 2.5 times more likely to be early adopters of technology than are older generations. With the Internet and social media, the number of sources for information has increased dramatically. When gathering information and making buying decisions, Millennials tend to rely on recommendations from peers and friends more than from experts. Having grown up with mobile and digital technology as part of their everyday lives, they are more likely to use the Internet, broadcast thoughts, and contribute content (National Chamber Foundation, 2012).
Financial literacy rate age 15-34
% o
f acc
ount
ow
ners
20
40
60
80
100
20% 30% 40% 50% 60% 70% 80%
IndonesiaMexico
ArgentinaIndiaTurkey
Saudi Arabia
ChinaBrazil
Russian Federation
South Africa
Italy
JapanFrance
Korea,Rep. United States
AustraliaCanada
GermanyUnited Kingdom

Millennials and Financial Literacy: A Global Perspective | 11
Figure 10: Financial literacy among Millennials and percentage of Internet users
Source:S&PGlobalFinLitSurvey2014andWorldDevelopmentIndicators2014.
Financial knowledge is also correlated with the use of credit from formal institutions or informal networks of family and friends. The use of informal networks decreases with financial literacy: Countries with higher financial literacy among the young have a lower percentage of people who took loans from family or friends in the past year (Figure 11).
Figure 11: Financial literacy among Millennials and loans from family/friends
Source:S&PGlobalFinLitSurveyandGlobalFinancialDevelopmentDatabase2014.
When looking at developing countries among the G20, we notice that financial literacy among Millennials is positively correlated with the percentage of people age 15 and above who save using savings clubs or a
Financial literacy rate age 15-34
% o
f Int
erne
t use
rs
20
40
60
80
100
20% 30% 40% 50% 60% 70% 80%
Mexico
Argentina
India
Turkey
Saudi Arabia
ChinaBrazil
Russian Federation
South Africa
Italy
Japan
France
Korea, Rep.
United States
Australia
CanadaGermany
United Kingdom
Financial literacy rate age 15-34
% t
akin
g lo
ans
from
fam
ily/f
rien
ds
0
20
40
60
80
20% 30% 40% 50% 60% 70% 80%
Mexico
Argentina
IndiaTurkey
Saudi Arabia
China
BrazilRussian Federation
South Africa
Italy
JapanFrance
Korea, Rep.
United States
AustraliaCanada
GermanyUnitedKingdom
Indonesia

Millennials and Financial Literacy: A Global Perspective | 12
person outside the family (Figure 12). In other words, those with higher financial literacy use semiformal mechanisms to save. Similarly, financial knowledge is positively associated with the likelihood that an individual will resort to formal saving mechanisms, e.g., saving or setting aside money at a bank or another type of financial institution (Figure 13).
Figure 12: Financial literacy among Millennials and percentage of people 15+
saving using a savings club or a person outside the family
Source:S&PGlobalFinLitSurveyandGlobalFindexDatabase2014.
Figure 13: Financial literacy among Millennials and percentage of people 15+ saving at financial institutions
Source:S&PGlobalFinLitSurvey2014andGlobalFindexDatabase2014.
Financial literacy rate age 15-34
% s
avin
g at
fina
ncia
l ins
titu
tion
s
0
10
20
30
40
50
60
70
80
20% 30% 40% 50% 60% 70% 80%
Mexico
Argentina
IndiaTurkey
Saudi Arabia
China
BrazilRussian Federation
South Africa Italy
Japan
FranceKorea, Rep. United States
AustraliaCanada
Germany
United Kingdom
Indonesia
Financial literacy rate age 15-34
% u
sing
sem
iform
al s
avin
g m
echa
nism
s
0
10
20
30
40
50
20% 30% 40% 50% 60% 70% 80%
Mexico
Argentina
IndiaTurkey
China BrazilRussian Federation
South Africa
Indonesia

Millennials and Financial Literacy: A Global Perspective | 13
Finally, financial literacy is a key factor in explaining financial fragility. Research shows that being more financially knowledgeable is associated with a higher probability of being able to handle an unexpected expense. Financial literacy has an independent effect on reducing financial fragility, above and beyond the impact of education (Lusardi, Mitchell, and Oggero, 2016). Similarly, the S&P Global FinLit Survey data show that the percentage of people who cannot come up with emergency funds is negatively correlated with financial literacy among Millennials (Figure 14). In this case, the indicator denotes the percentage of respondents age 15 and above who reported that it would not be possible for them to come up with funds to cover an emergency within the following month—with the emergency amount indicated on the survey equal to 1/20 of Gross National Income (GNI) per capita in local currency.
Figure 14: Financial literacy among Millennials and percentage of people 15+
unable to come up with emergency funds
Source:S&PGlobalFinLitSurvey2014andGlobalFindexDatabase2014.
Case study: Italy
Among the major advanced economies, Italy is the country with the lowest percentage of financially literate people. Only 37 percent of Italians are able to correctly answer at least three out of four basic financial concepts. Not only does Italy have the lowest level of financial literacy among major developed countries, it also performs worse than some emerging economies such as South Africa and the Russian Federation, whose financial literacy rates are 42 percent and 38 percent, respectively.
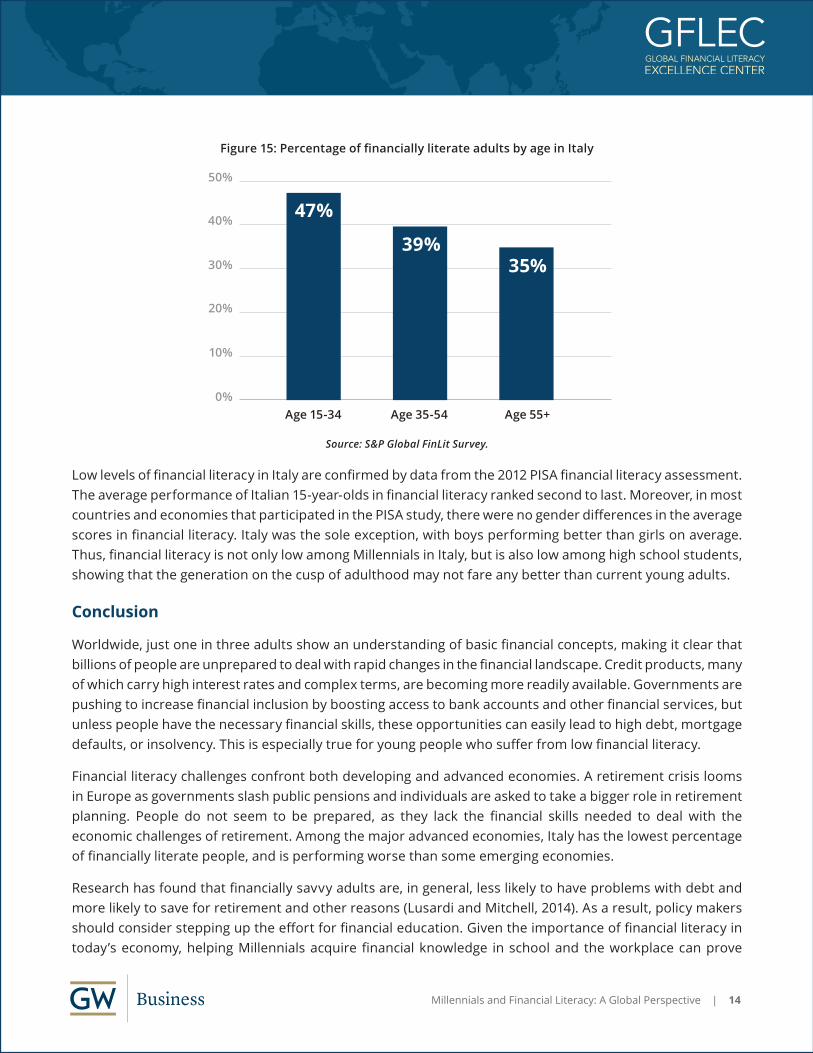
Young adults generally have a lower level of financial literacy than middle-age respondents in major advanced economies, while young adults have the highest level of financial literacy in major emerging economies. Strikingly, in Italy Millennials have the highest levels of financial literacy (Figure 15). Similar to the major developing countries, financial literacy rates in Italy decline with age: 47 percent of people age 15–34 can be considered financially literate versus 39 percent of people age 35–54 and 35 percent of people age 55 and above.
Financial literacy rate age 15-34
% u
nabl
e to
com
e up
wit
h em
erge
ncy
fund
s
0
10
20
30
40
50
60
20% 30% 40% 50% 60% 70% 80%
MexicoArgentina
India
Turkey
Saudi Arabia
China
Brazil
Russian Federation
South Africa
Italy
Japan
France
Korea, Rep.
United States
AustraliaCanada
GermanyUnitedKingdom
Indonesia
Millennials and Financial Literacy: A Global Perspective | 14
Figure 15: Percentage of financially literate adults by age in Italy
Source:S&PGlobalFinLitSurvey.
Low levels of financial literacy in Italy are confirmed by data from the 2012 PISA financial literacy assessment. The average performance of Italian 15-year-olds in financial literacy ranked second to last. Moreover, in most countries and economies that participated in the PISA study, there were no gender differences in the average scores in financial literacy. Italy was the sole exception, with boys performing better than girls on average. Thus, financial literacy is not only low among Millennials in Italy, but is also low among high school students, showing that the generation on the cusp of adulthood may not fare any better than current young adults.
Conclusion
Worldwide, just one in three adults show an understanding of basic financial concepts, making it clear that billions of people are unprepared to deal with rapid changes in the financial landscape. Credit products, many of which carry high interest rates and complex terms, are becoming more readily available. Governments are pushing to increase financial inclusion by boosting access to bank accounts and other financial services, but unless people have the necessary financial skills, these opportunities can easily lead to high debt, mortgage defaults, or insolvency. This is especially true for young people who suffer from low financial literacy.
Financial literacy challenges confront both developing and advanced economies. A retirement crisis looms in Europe as governments slash public pensions and individuals are asked to take a bigger role in retirement planning. People do not seem to be prepared, as they lack the financial skills needed to deal with the economic challenges of retirement. Among the major advanced economies, Italy has the lowest percentage of financially literate people, and is performing worse than some emerging economies.
Research has found that financially savvy adults are, in general, less likely to have problems with debt and more likely to save for retirement and other reasons (Lusardi and Mitchell, 2014). As a result, policy makers should consider stepping up the effort for financial education. Given the importance of financial literacy in today’s economy, helping Millennials acquire financial knowledge in school and the workplace can prove
Age 15-34 Age 35-54 Age 55+0%
10%
20%
30%
40%
50%
47%
39%35%

Millennials and Financial Literacy: A Global Perspective | 15
particularly successful. Research has shown that targeted financial literacy programs that are focused on specific behaviors and populations can lead to smarter financial decisions (Miller et al., 2014).
Our findings indicating that Millennials lack the basic skills needed to make savvy financial decisions suggest that there is a great need to promote financial capability among the young. Programs aimed at improving financial literacy could help Millennials minimize the costs incurred in managing their financial products, improve their financial safety net in the event of emergencies, and strengthen their financial security. The gap between the amount of financial responsibility given to the young and their demonstrated ability to manage financial decisions and take advantage of financial opportunities, is rapidly widening. Unless significant action is taken to alter this, financial illiteracy will remain an obstacle to Millennials’ financial security.

Millennials and Financial Literacy: A Global Perspective | 16
APPENDIX Financial Literacy: An Economy-by-Economy Breakdown
EconomyFinancially
literate adults (%)
EconomyFinancially
literate adults (%)
EconomyFinancially
literate adults (%)
EconomyFinancially
literate adults (%)
Afghanistan 14 Côte d’Ivoire 35 Kyrgyz Republic 19 Saudi Arabia 31
Albania 14 Denmark 71 Latvia 48 Senegal 40
Algeria 33 Dominican Republic 35 Lebanon 44 Serbia 38
Angola 15 Ecuador 30 Lithuania 39 Sierra Leone 21
Argentina 28 Egypt, Arab Rep. 27 Luxembourg 53 Singapore 59
Armenia 18 El Salvador 21 Macedonia, FYR 21 Slovak Republic 48
Australia 64 Estonia 54 Madagascar 38 Slovenia 44
Austria 53 Ethiopia 32 Malawi 35 Somalia 15
Azerbaijan 36 Finland 63 Malaysia 36 South Africa 42
Bahrain 40 France 52 Mali 33 Spain 49
Bangladesh 19 Gabon 35 Malta 44 Sri Lanka 35
Belarus 38 Georgia 30 Mauritania 33 Sudan 21
Belgium 55 Germany 66 Mauritius 39 Sweden 71
Belize 33 Ghana 32 Mexico 32 Switzerland 57
Benin 37 Greece 45 Moldova 27 Taiwan, China 37
Bhutan 54 Guatemala 26 Mongolia 41 Tajikistan 17
Bolivia 24 Guinea 30 Montenegro 48 Tanzania 40
Bosnia and Herzegovina 27 Haiti 18 Myanmar 52 Thailand 27
Botswana 52 Honduras 23 Namibia 27 Togo 38
Brazil 35 Hong Kong SAR, China 43 Nepal 18 Tunisia 45
Bulgaria 35 Hungary 54 Netherlands 66 Turkey 24
Burkina Faso 33 India 24 New Zealand 61 Turkmenistan 41
Burundi 24 Indonesia 32 Nicaragua 20 Uganda 34
Cambodia 18 Iran, Islamic Rep. 20 Niger 31 Ukraine 40
Cameroon 38 Iraq 27 Nigeria 26 United Arab Emirates 38
Canada 68 Ireland 55 Norway 71 United Kingdom 67
Chad 26 Israel 68 Pakistan 26 United States 57
Chile 41 Italy 37 Panama 27 Uruguay 45
China 28 Jamaica 33 Peru 28 Uzbekistan 21
Colombia 32 Japan 43 Philippines 25 Venezuela, RB 25
Congo, Dem. Rep. 32 Jordan 24 Poland 42 Vietnam 24
Congo, Rep. 31 Kazakhstan 40 Portugal 26 West Bank and Gaza 25
Costa Rica 35 Kenya 38 Puerto Rico 32 Yemen, Rep. 13
Croatia 44 Korea, Rep. 33 Romania 22 Zambia 40
Cyprus 35 Kosovo 20 Russian Federation 38 Zimbabwe 41
Czech Republic 58 Kuwait 44 Rwanda 26
Source:S&PGlobalFinLitSurvey.

Millennials and Financial Literacy: A Global Perspective | 17
Financial Literacy Among Millennials (Age 15-34): An Economy-by-Economy Breakdown
EconomyFinancially
literate Millennials
(%)Economy
Financially literate
Millennials (%)
EconomyFinancially
literate Millennials
(%)Economy
Financially literate
Millennials (%)
Afghanistan 14% Côte d’Ivoire 37% Kyrgyz Republic 19% Saudi Arabia 32%
Albania 19% Denmark 76% Latvia 59% Senegal 41%
Algeria 36% Dominican Republic 38% Lebanon 50% Serbia 43%
Angola 16% Ecuador 32% Lithuania 44% Sierra Leone 20%
Argentina 31% Egypt, Arab Rep. 31% Luxembourg 58% Singapore 66%
Armenia 20% El Salvador 25% Macedonia, FYR 27% Slovak Republic 45%
Australia 64% Estonia 59% Madagascar 36% Slovenia 62%
Austria 56% Ethiopia 35% Malawi 36% Somalia 15%
Azerbaijan 41% Finland 80% Malaysia 36% South Africa 43%
Bahrain 39% France 46% Mali 37% Spain 47%
Bangladesh 21% Gabon 35% Malta 51% Sri Lanka 43%
Belarus 45% Georgia 39% Mauritania 35% Sudan 24%
Belgium 63% Germany 72% Mauritius 45% Sweden 71%
Belize 36% Ghana 33% Mexico 34% Switzerland 56%
Benin 37% Greece 56% Moldova 29% Taiwan, China 47%
Bhutan 56% Guatemala 29% Mongolia 42% Tajikistan 16%
Bolivia 28% Guinea 30% Montenegro 52% Tanzania 46%
Bosnia and Herzegovina 37% Haiti 16% Myanmar 51% Thailand 32%
Botswana 53% Honduras 27% Namibia 31% Togo 42%
Brazil 37% Hong Kong SAR, China 58% Nepal 21% Tunisia 48%
Bulgaria 39% Hungary 63% Netherlands 71% Turkey 28%
Burkina Faso 32% India 27% New Zealand 59% Turkmenistan 42%
Burundi 24% Indonesia 38% Nicaragua 21% Uganda 36%
Cambodia 18% Iran, Islamic Rep. 25% Niger 34% Ukraine 52%
Cameroon 39% Iraq 31% Nigeria 24% United Arab Emirates 39%
Canada 66% Ireland 57% Norway 76% United Kingdom 67%
Chad 29% Israel 68% Pakistan 28% United States 57%
Chile 47% Italy 47% Panama 31% Uruguay 49%
China 35% Jamaica 37% Peru 30% Uzbekistan 22%
Colombia 36% Japan 43% Philippines 22% Venezuela, RB 27%
Congo, Dem. Rep. 32% Jordan 28% Poland 50% Vietnam 33%
Congo, Rep. 29% Kazakhstan 47% Portugal 38% West Bank and Gaza 27%
Costa Rica 38% Kenya 42% Puerto Rico 36% Yemen, Rep. 16%
Croatia 50% Korea, Rep. 48% Romania 30% Zambia 42%
Cyprus 40% Kosovo 22% Russian Federation 39% Zimbabwe 43%
Czech Republic 59% Kuwait 45% Rwanda 27%
Source:S&PGlobalFinLitSurvey.

Millennials and Financial Literacy: A Global Perspective | 18
Survey methodology
Surveys are conducted face-to-face in economies where telephone coverage represents less than 80 percent of the population or is the customary methodology. In most economies the fieldwork is completed in two to four weeks. In economies where face-to-face surveys are conducted, the first stage of sampling is the identification of primary sampling units. These units are stratified by population size, geography, or both, and clustering is achieved through one or more stages of sampling. Where population information is available, sample selection is based on probabilities proportional to population size. Otherwise, simple random sampling is used. Random route procedures are used to select sampled households. Unless an outright refusal occurs, interviewers make up to three attempts to survey the sampled household. To increase the probability of contact and completion, attempts are made at different times of the day and, where possible, on different days. If an interview cannot be obtained at the initial sampled household, a simple substitution method is used. Respondents are randomly selected within the selected households by means of the Kish grid. In economies where cultural restrictions dictate gender matching, respondents are randomly selected through the Kish grid from among all eligible adults of the interviewer’s gender.
In economies where telephone interviewing is employed, random digit dialing or a nationally representative list of phone numbers is used. In most economies where cell phone penetration is high, a dual sampling frame is used. Random selection of respondents is achieved by using either the latest birthday or Kish grid method. At least three attempts are made to reach a person in each household, spread over different days and times of day.
Data weighting is used to ensure a nationally representative sample for each economy. Final weights consist of the base sampling weight, which corrects for unequal probability of selection based on household size, and the post-stratification weight, which corrects for sampling and nonresponse error. Post-stratification weights use economy-level population statistics on gender and age and, where reliable data are available, education or socioeconomic status. More information on the data collection period, number of interviews, approximate design effect, and margin of error, as well as sampling details for each economy, can be found in Demirguc-Kunt et al. (2015).
Millennials and Financial Literacy: A Global Perspective | 19
References
Behrman, Jere R., Olivia S. Mitchell, Cindy K. Soo, and David Bravo. 2012. “The Effects of Financial Education and Financial Literacy: How Financial Literacy Affects Household Wealth Accumulation.” American Economic Review: Papers & Proceedings 102 (3): 300-304.
Bishop, Ian. 2006. “Hill Scolds Lazy Millennials – ‘They Have to Do Their Part.’” New York Post. March 12. http://nypost.com/2006/05/12/hill-scolds-lazy-Millennials-they-have-to-do-their-part/.
Demirguc-Kunt, Asli, Leora Klapper, Dorothe Singer, and Peter Van Oudheusden. 2015. “The Global Findex Database 2014: Measuring Financial Inclusion around the World.” World Bank Policy Research Working Paper 7255.
Friedline, Terri L., William Elliott and Ilsung Nam. 2011. “Predicting Savings from Adolescence to Young Adulthood: A Propensity Score Approach.” Journal of the Society for Social Work and Research 2: 1-22.
Klapper, Leora, Annamaria Lusardi, and Peter van Oudheusden. 2015. “Financial Literacy Around the World: Insights from the Standard & Poor’s Ratings Services Global Financial Literacy Survey.” http://gflec.org/wp-content/uploads/2015/11/Finlit_paper_16_F2_singles.pdf.
Kotlikoff, Laurence J., and Douglas B. Bernheim. 2001. “Household Financial Planning and Financial Literacy: The Need for New Tools.” In Essays on Saving, Bequests, Altruism and Life-Cycle Planning, edited by L.J. Kotlikoff, 427-478. MITPress: Cambridge.
Lusardi, Annamaria, and Carlo de Bassa Scheresberg. 2013. “Financial Literacy and High-Cost Borrowing in the United States.” NBER Working Paper 18969.
Lusardi, Annamaria, and Olivia S. Mitchell. 2014. “The Economic Importance of Financial Literacy: Theory and Evidence.” Journal of Economic Literature 52 (1): 5-44.
Lusardi, Annamaria, Olivia. S. Mitchell, and Noemi Oggero. 2016. “Debt and Financial Vulnerability on the Verge of Retirement.” GFLEC Working Paper n. 2016-5, December.
Lusardi, Annamaria, and Peter Tufano. 2015. “Debt Literacy, Financial Experiences, and Over Indebtedness.” Journal of Pension Economics and Finance 14 (4): 332-328.
Miller, Margaret, Julia Reichelstein, Christian Salas, and Bilal Zia. 2014. “Can You Help Someone Become Financially Capable? A Meta-Analysis of the Literature.” World Bank Policy Research Working Paper 6745.
National Chamber Foundation. 2012. “The Millennial Generation: Research Review.” U.S. Chamber of Commerce. https://www.uschamberfoundation.org/sites/default/files/article/foundation/MillennialGeneration.pdf.
OECD. 2009a. “Financial Education and the Crisis: Policy Paper and Guidance.” International Network on Financial Education. June 2009. http://www.oecd.org/finance/financial-education/50264221.pdf.

Millennials and Financial Literacy: A Global Perspective | 20
OECD. 2009b. “Financial Literacy and Consumer Protection: Overlooked Aspects of the Crisis.” http://www.oecd.org/finance/financial-markets/43138294.pdf.
OECD. 2014a. “PISA 2012 Results: Students and Money: Financial Literacy Skills for the 21st Century (Volume VI).” OECD Publishing. http://dx.doi.org/10.1787/9789264208094-en.
OECD. 2014b. “PISA 2012 Results in Focus: What 15-year-olds know and what they can do with what they know.” OECD Publishing. https://www.oecd.org/pisa/keyfindings/pisa-2012-results-overview.pdf.
Otto, Annette. 2013. “Saving in Childhood and Adolescence: Insights from Developmental Psychology.” Economics of Education Review 33: 8-18.
Schawbel, Dan. 2012. “Millennials vs. Baby Boomers: Who Would You Rather Hire?” Time Magazine. March 29. http://business.time.com/2012/03/29/Millennials-vs-baby-boomers-who-would-you-rather-hire/.
Sherraden, Margaret S., Lissa Johnson, Baorong Guo, and William Elliot. 2011. “Financial Capability in Children: Effects of Participation in School-Based Financial Education and Savings Program.” Journal of Family & Economic Issues 32: 385-399.
Stango, Victor, and Jonathan Zinman. 2009. “Exponential Growth Bias and Household Finance.” The Journal of Finance 64 (6): 2807-2849.
Taylor, Paul, and Scott Keeter. 2010. “Millennials: Confident. Connected. Open to Change.” Pew Research Center. http://www.pewsocialtrends.org/files/2010/10/Millennials-confident-connected-open-to-change.pdf.
Van Rooj, Maarten, Annamaria Lusardi, and Rob Alessie. 2011. “Financial Literacy and Stock Market Participation.” Journal of Financial Economics. 101 (2): 449-472.