migration in the 21 century: breaking the myths
TRANSCRIPT

Migration in the 21st Century: Breaking the Myths
Chatham House rule: Informal DiscussionRome, Italy | 18 December 2019
Arif HusainChief EconomistUnited Nations World Food Programme

What do we know aboutMIGRATION?

Main types of migration
Migration out of choice
ECONOMIC MIGRATION
Migration out of necessity
Key drivers: Economic opportunities, income inequality and employment gaps, lack of education, healthcare or social security,
population growth, existence of established networks for migration, etc.
Key drivers: Conflict, persecution, disasters, climate change, food
insecurity, poverty, etc.
FORCED MIGRATION OR DISPLACEMENT
Note: Other types of migration include irregular migration, environmental migration, return migration, etc.
1 2

Global migration has been on the rise since 1990
161.3173.6
191.6
220.8
248.9 271.6
0
50
100
150
200
250
300
1995 2000 2005 2010 2015 2019
Source: World Bank, 2019; UN DESA, 2019, IOM, 2018.
266 (2018)
(2019 mid-year)
Total number of international migrants and refugees (1990-2019)
more than 780MInternal migrants and IDPs

Of the 266 million international migrants in 2018, 10% were refugees
OTHER MIGRANTS
240M266M(90%)
Total international
migrants, 2018
Source: World Bank, 2019. Leveraging Economic Migration for Development: A Briefing for the World Bank Board.
REFUGEES*
(10%)26M
*This does not include other forcibly displaced people, such as internally displaced persons (IDPs) and asylum seekers
- Migrant workers- Irregular migrants- Temporary and circular migrants

While this increase was smaller relative to that observed in many high-income countries outside the OECD, it has led to widespread concerns in many host countries about possible large and sudden influx of migrants.
Share of immigrants in the global population vs high-income member countries in the OECD (%), 2018
14
12
10
8
6
4
2
0
Percent (%)
2000 2018
2.8%3.5%
8.8%
12.6%
The share of immigrants in high-income member countries of the OECDsaw a greater increase than those in the global population from 2000-2018
Share of migrants in the global population
Share of migrants in high-income member counties

The total number of forcibly displaced people amounted to 70.8 million in 2018
70.8 million forcibly displaced people worldwide
Internally Displaced People
25.9 million
Refugees
3.5 million
Asylum-seekers
41.3 million
Source: UNHCR, June 2019
1 person
every 2 seconds
is forcibly displacedas a result of conflict, violence or persecution

Internally Displaced Persons (IDPs)
New displacements (2018)Close to 80% of the 41.3 million
are displaced in only 11 countries:
Syria
6.1 M
Colombia
5.7 M
Democratic Republic of the Congo
3.1 M
Somalia
2.6 M
Afghanistan
2.6 M
Yemen
2.3 M
Nigeria
2.2 M
Source: Internal Displacement Monitoring Centre, 2018.
Conflict
10.8M
Natural disasters
17.2M
Main drivers
Armed conflict and violence
Human rights violations
Sudden-onset disasters
Slow-onset disasters
At least 17 million children under the age of 18 were living in internal displacement around the world at the end of 2018
were under the age of five.
5 million More than

Refugees
Around 80% of refugees live in countries neighbouring their countries of origin
80%
of UNHCR refugees came from three countries57%
Syria
6.7M
Afghanistan
2.7M
South Sudan
2.3M
Over half of refugees in 2018 are under the age of 18
of all refugees were in situations lasting for more than five years
(a sharp rise from 66 per cent in 2018)
78%
Top refugee-hosting countries
Germany1.1m
Sudan1.1m
Uganda1.2m
Pakistan1.4m
Turkey3.7m
many of whom are crossing borders unaccompaniedor separated from their families.
Source: UNHCR, 2018.

The share of migrants from developing countries going to other developing countries was larger than the share going to the “North”
Source: World Bank, 2019. Leveraging Economic Migration for Development: A Briefing for the World Bank Board.
Composition of international migrants and
refugees, 2018
Note: South = Low- and middle-income countries, North = high-income OECD countries
North-North(16%)
North-South(4%)
South-Other High-Income
(14%)
South-North(32%)
South-South(34%)

Over two-thirds of international migration in Sub-Saharan Africa and 58 percent in Europe and Central Asia is intra-regional
International migrants and refugees within and across regions and income groups, 2018
Millions, by destination
Source: World Bank staff estimates based on UNDESA.
Intra regional
Other developing
High income: OECD
High income: non-OECD
East Asia and the Pacific
South Asia
Sub-Saharan Africa
0 10 20 30 40 50
24%
23%
70%
Europe and Central Asia 58%
Middle East and North Africa 28%
Latin America and the Caribbean 9%

Why do people move from their countries of origin?
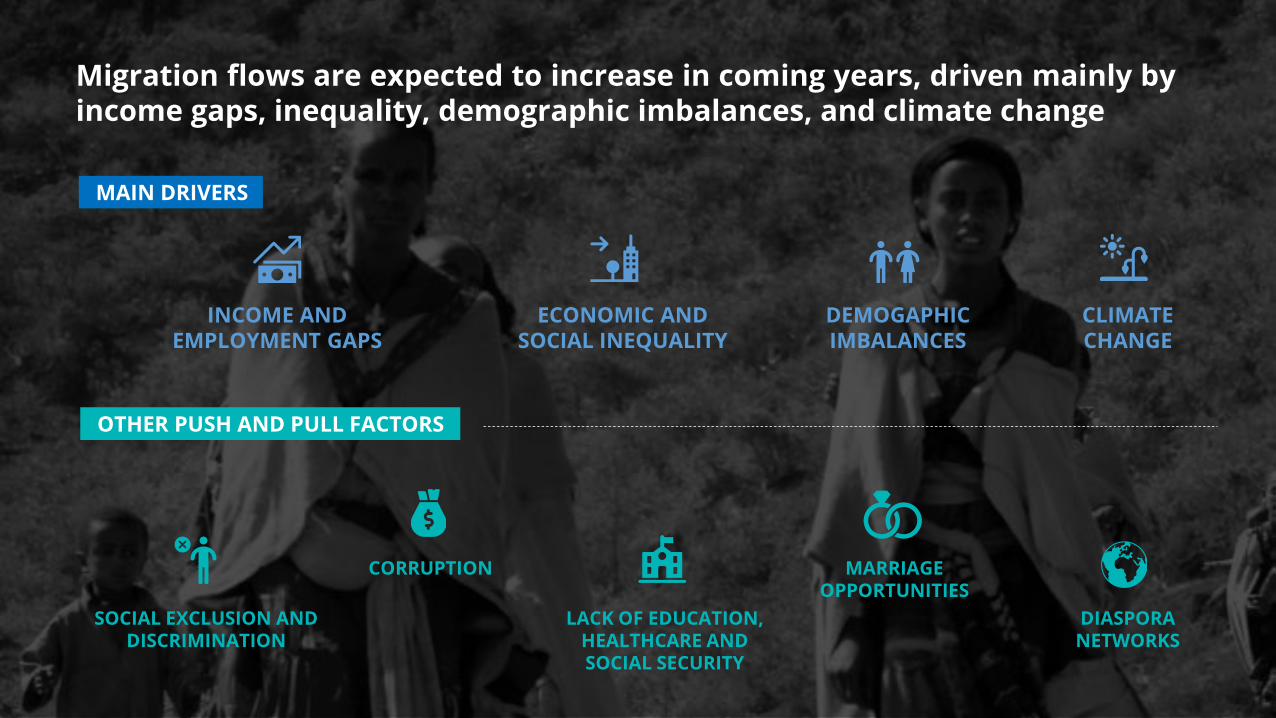
Migration flows are expected to increase in coming years, driven mainly byincome gaps, inequality, demographic imbalances, and climate change
MAIN DRIVERS
OTHER PUSH AND PULL FACTORS
INCOME AND EMPLOYMENT GAPS
ECONOMIC AND SOCIAL INEQUALITY
DEMOGAPHIC IMBALANCES
CLIMATE CHANGE
SOCIAL EXCLUSION AND DISCRIMINATION
CORRUPTION
LACK OF EDUCATION, HEALTHCARE AND SOCIAL SECURITY
MARRIAGE OPPORTUNITIES
DIASPORA NETWORKS

During 2013–17, the average income in the high-income OECD countries was USD43,083, compared with USD 795 in the low-income countries — a ratio of 54:1
At current growth rates, it would take
135 years to close the income gaps
45,000
40,000
35,000
30,000
25,000
20,000
15,000
10,000
5,000
0
USD
High-income OECD countries
Low-income countries
USD 43,083
USD 795
Average income in high-income OECD countries vs low-income countries, 2013-2017
Ratio = 54:1

1:9 in Uganda
1:7 in Nigeria
1:2 in India and
Mexico
- large labor-market imbalances
- mounting fiscal pressures as tax bases narrow
- costs of care for the elderly rises
- hardening attitudes toward migration
According to current population trajectories, by 2030….
(15-24 years)
For every young person
In Germany, Italy and Japan
There will be three seniors (65+)
In high-income countries..
The ratio of old to young will be:
- Growing pools of young people
- Need to generate sufficient jobs to reach their targets for poverty reduction and growth
- Increase migration pressures, esp. from South Asia and Sub-Saharan Africa
In developing nations…
Projected increase of working-age populations in the world’s LMICs
= 552 million by 2030
Co
nse
qu
en
ce
s
=

In 2017, WFP conducted a migration study “At the Root of Exodus” to explore the nexus of conflict, migration and food security.
The study concluded that food insecurity is a critical ‘push’ factor driving international migration, along with economic opportunities, income inequality, population growth and the existence of established networks for migration.
“High levels of food insecurity lead to higher levels of migration across borders.”

Syrian Asylum Applications in Europe

Improved undernourishment
reduces out-migration by
0.2 percent
HIGH LEVELS OF
UNDERNOURISHMENT
PREVIOUS LEVELS OF
MIGRATION
Global drivers of migration
Out-migration is substantially influenced by:
Presence of diaspora in the
recipient country and/or
network effects
DOMESTIC ECONOMIC
GROWTH
Better opportunities within
countries of origin offset
migration

For each
additional year of conflict
an extra 40 out of 10,000
people will flee their country
Global drivers of refugees
Source: WFP, 2017. At the root of exodus: Food security, conflict and international migration.
For each
1% rise in hunger
an extra 200 out of 10,000
people will flee their country

Key findings
• Countries with the highest level of food insecurity, coupled with armed conflict, have the highest outward migration of refugees. Additionally, when coupled with poverty, food insecurity increases the likelihood and intensity of armed conflicts.
• Food security, conflict and international migration are issues, which cut across the entire humanitarian-development-peacebuilding nexus with far-reaching implications for policy-makers and the wider international community.
• People leave their countries after multiple internal displacements due to conflict, disrupted livelihoods and food insecurity.
• When migration is conflict-driven, families often travel together.
• Onward migration is driven by a desire for stability triggered by economic factors and food security.
• The use of new technology and social media has revolutionized information flows amongst refugees.

Monitoring the needs of displaced populations
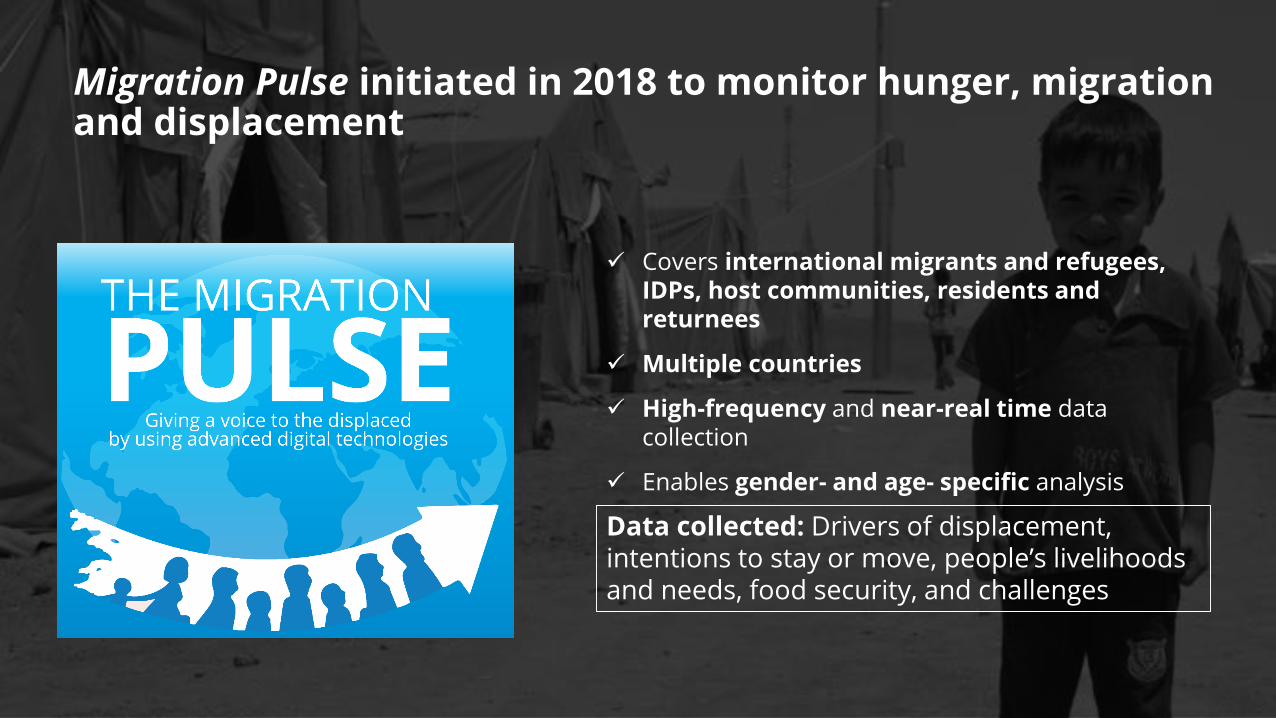
Migration Pulse initiated in 2018 to monitor hunger, migration and displacement
Data collected: Drivers of displacement, intentions to stay or move, people’s livelihoods and needs, food security, and challenges
✓ Covers international migrants and refugees, IDPs, host communities, residents and returnees
✓ Multiple countries
✓ High-frequency and near-real time data collection
✓ Enables gender- and age- specific analysis

Innovative assessment tool: Web surveys
People on the move are connected: mobile
technology is a lifeline for the displaced
57% globally are connected to the internet
(9% increase from 2018-2019)
Benefits/opportunities:
• Allows accessing subgroups that are often “invisible”
• Reach younger population groups
• Faster and cheaper
• Reduced environmental footprint
• Safe space for people to respond
• Partnership with IOM and others
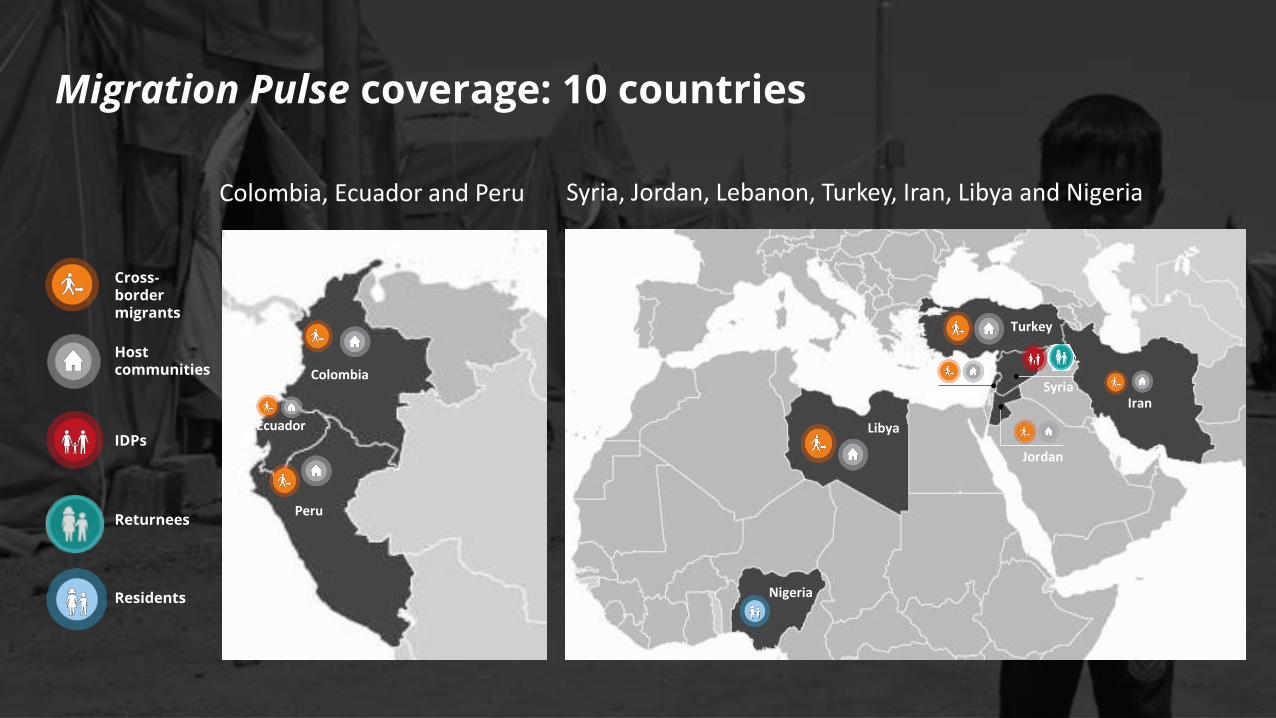
Migration Pulse coverage: 10 countries
Syria, Jordan, Lebanon, Turkey, Iran, Libya and Nigeria
Iran
Syria
Jordan
Libya
Turkey
Nigeria
Lebanon
Peru
Colombia
Ecuador
Colombia, Ecuador and Peru
Cross-bordermigrants
Host communities
IDPs
Residents
Returnees

Profiles of migrant respondents in Libya
2,545 web surveys were completed during round 2 by migrants from 36 countries from North Africa, Sub-Saharan Africa, the Middle East and Asia.
23%
36%
23%
18%14-20 years
21-30 years
31-40 years
41+ years
Age groupsGender
35%Female
65%Male
Libya

Key findings of the joint IOM-WFP study in Libya
NO CHOICE BUT TO LEAVE
41%
LEFT OUT OF CHOICE
59%Drivers of migration
Top drivers
Top drivers
Poverty
Conflict/insecurity
Inability to meet food needs
Search for better income opportunities
Education

Key findings of the joint IOM-WFP study in Libya
Food security status
of migrants respondents in Libya were concerned about where their next meal would come from
52%
Compromised their food consumption30%
Are adopting coping strategies due to lack of food or means to buy food57%
Remittances
of migrants sending remittances back home
2/3
Food needs of family left behind19%
Paying of debts17%
Main use of remittances reported by migrants:
Education14%

What we can do to addressthe root causes of migration

0
20
40
60
80
100
120
140
160
2000 2001 2002 2003 2004 2005 2006 2007 2008 2009 2010 2011 2012 2013 2014 2015 2016 2017 2018(p)
Co
nst
an
t 2
01
7 U
SD
bil
lio
n
Components of DAC countries’ net ODA (2000-2018)
Source: OECD, 2018.
People assisted (2016):
3.8 million
People assisted (2016):
164 million
Net debt relief grants
In-donor refugee costs
Humanitarian aid
Multilateral ODA
Bilateral development projects, programmes and technical cooperation
14.6B(2016)
16.4B (2016)
10.1B (2018)
14.8B(2018)
Internal spending on refugees and asylum seekers
Humanitarian aid
The richest 30 countries in the world spend far more money on assisting refugees and
asylum seekers in their own countries than humanitarian aid

Remittance flows to LMICs are expected to reach USD 550 billion in 2019—more thanthree times total development aid. They are likely to overtake foreign directinvestment to developing countries.
Sources: World Bank staff estimates; World Development Indicators; International Monetary Fund’s Balance of Payment Statistics. Note: The figure for 2018 is an estimate and for 2019 is a forecast. FDI = foreign direct investment; ODA = official development assistance.
Remittance flows to low- and middle-income countries, official development assistance and private capital flows, 1990-2018900
700
500
300
100
-100 19
90
19
91
19
92
19
93
19
94
19
95
19
96
19
97
19
98
19
99
20
00
20
01
20
02
20
03
20
04
20
05
20
06
20
07
20
08
20
09
20
10
20
11
20
12
20
13
20
14
20
15
20
16
20
17
20
18
e
20
19
f
US$ billions
FDI
Remittances
ODA
Portfolio debt and equity flows

Recommendations- Short-term
Source: WFP.
Countries of origin
• Adequate humanitarian support must be provided to people who are internally displaced within their own countries, with particular attention on children.
• Invest more in strengthening livelihoods and food security in countries of origin to reduce push factors compelling migrants to leave their countries out of destitution.
Host countries
• Support host communities as they become more vulnerable over time
• Enhance joint planning and investments for dignified returns (for those who wish to return)
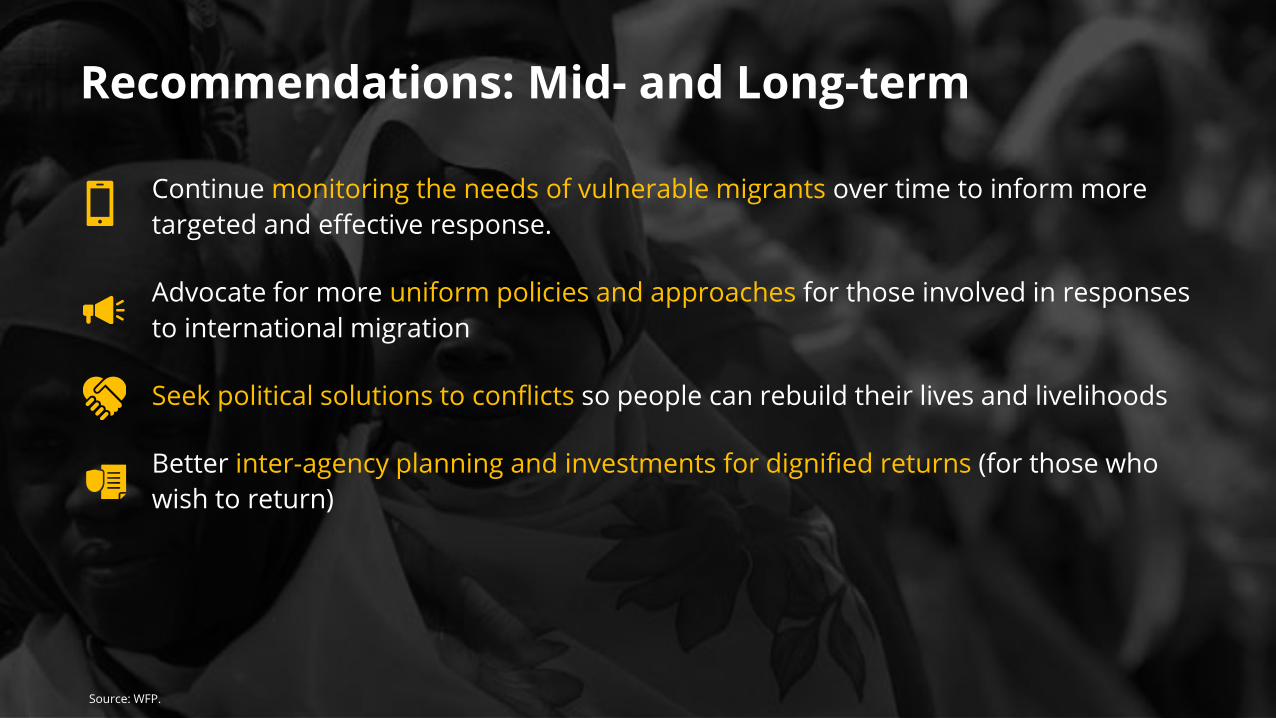
Continue monitoring the needs of vulnerable migrants over time to inform more
targeted and effective response.
Advocate for more uniform policies and approaches for those involved in responses
to international migration
Seek political solutions to conflicts so people can rebuild their lives and livelihoods
Better inter-agency planning and investments for dignified returns (for those who
wish to return)
Recommendations: Mid- and Long-term
Source: WFP.

Thank you
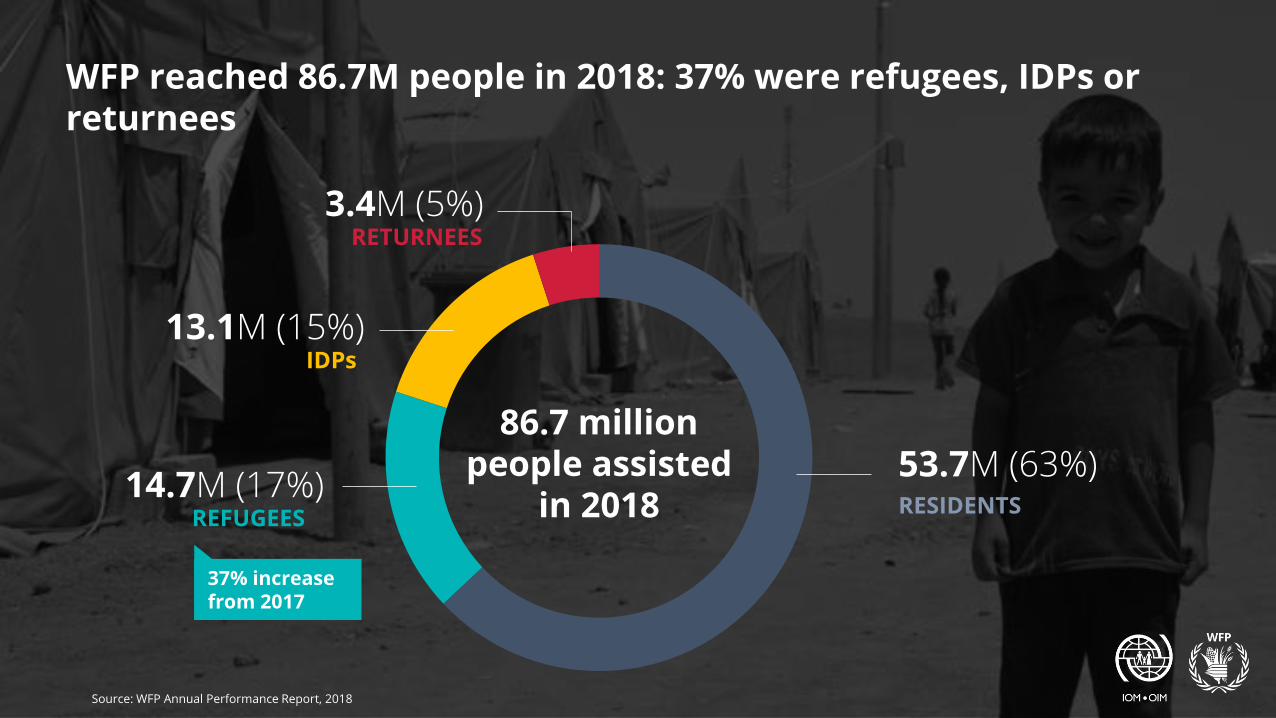
WFP reached 86.7M people in 2018: 37% were refugees, IDPs or returnees
86.7 million people assisted
in 2018 RESIDENTS
53.7M (63%)
3.4M (5%)RETURNEES
13.1M (15%)IDPs
14.7M (17%)REFUGEES
37% increase from 2017
Source: WFP Annual Performance Report, 2018