migrant workers in the hospitality and tourism sector and ... · 8.1% to 5.4% by 2015.3 as a...
TRANSCRIPT
Migrant workers in the hospitality and tourism sector and the potential impact of labour restrictions
August 2016
www.people1st.co.uk | 2
By 51.9% to 48.9%, the UK has voted to leave the European Union. Migration dominated the referendum campaign and as the UK prepares to negotiate its exit, the restriction of labour is likely to be a significant part of the political debate.
As the hospitality and tourism sector starts thinking about the implications of Brexit and any new labour restrictions for EU workers, this paper sets out the key figures to inform the debate and to help the sector understand where any new restrictions are likely to have the biggest impact.
Reliance on migrant labour1
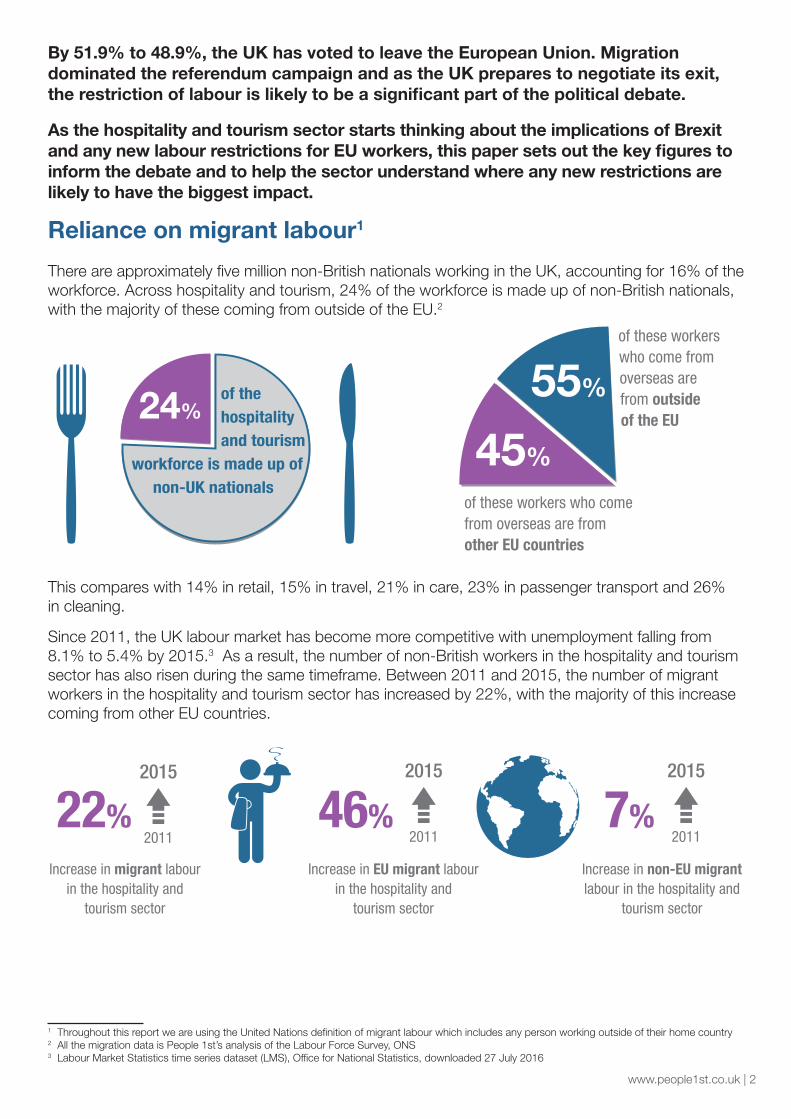
There are approximately five million non-British nationals working in the UK, accounting for 16% of the workforce. Across hospitality and tourism, 24% of the workforce is made up of non-British nationals, with the majority of these coming from outside of the EU.2
This compares with 14% in retail, 15% in travel, 21% in care, 23% in passenger transport and 26% in cleaning.
Since 2011, the UK labour market has become more competitive with unemployment falling from 8.1% to 5.4% by 2015.3 As a result, the number of non-British workers in the hospitality and tourism sector has also risen during the same timeframe. Between 2011 and 2015, the number of migrant workers in the hospitality and tourism sector has increased by 22%, with the majority of this increase coming from other EU countries.
1 Throughout this report we are using the United Nations definition of migrant labour which includes any person working outside of their home country2 All the migration data is People 1st’s analysis of the Labour Force Survey, ONS3 Labour Market Statistics time series dataset (LMS), Office for National Statistics, downloaded 27 July 2016
24% of the hospitality and tourism workforce is made up of non-UK nationals
45%
55%
of these workers who come from overseas are from other EU countries
of these workers who come fromoverseas are from outside of the EU
Increase in migrant labour in the hospitality and
tourism sector
Increase in EU migrant labour in the hospitality and
tourism sector
Increase in non-EU migrant labour in the hospitality and
tourism sector
2015
22% 46% 7%2011
2015
2011
2015
2011

www.people1st.co.uk | 3
The growing labour market The increase in the number of migrant workers found in the hospitality and tourism sector between 2011 and 2015 needs to be seen in context to the growing sector. The hospitality and tourism workforce increased by 13% between 2011 and 2015, with the restaurant industry alone increasing by over 120,000 employees. This has had a particular impact on a number of roles, including chefs, which have increased by 49,000.4
Skill shortages and possible migrant labour restrictions
Between 2014 and 2024, the hospitality and tourism sector needs to recruit 1.3m staff. Currently, a quarter of hospitality and tourism businesses have vacancies of which 38% consider hard-to-fill.
The most acute occupations to fill continue to be front of house staff (reported by 54% of employers with hard-to-fill vacancies) and chefs (reported by 42% of employers with hard-to-fill vacancies).
It is becoming harder to recruit.
• Unemployment has fallen to 4.9% 5, of which 28% of those classed as unemployed have been out of work for more than 12 months and are therefore more of challenge to get into employment.6
• Demographic changes mean that there are fewer younger people entering the job market, which has a proportionally adverse effect on the hospitality and tourism sector as it employs three times the proportion of 16-24 found across the economy as a whole.
Given this backdrop, migrant workers remain a critical labour pool for many sector businesses. Currently, there are no labour restrictions for other EU nationals. However, if restrictions were to be introduced on the back of the UK’s exit from the EU, it is likely that these would be similar to the current points based system that was introduced in 2010 for non-EU nationals. This may make it extremely difficult for those businesses recruiting front of house staff, as they will not be considered sufficiently skilled to fall within any ‘skilled’ occupational list. Similarly, it may be more difficult to recruit chefs as currently the ‘tier 2’ restrictions for skilled occupations means that any chef needs to be earning £35,000 per annum. Currently, the medium annual chef salary is £17,483. 7
The number of non-British nationals working in the hospitality and tourism sector from outside of the EU increased far less than those from other EU countries. Between 2011 and 2015, the number of non-EU nationals working in the sector increased by 17,573 compared to 69,945 of other EU workers.
If restrictions were to be introduced it is likely to hit those areas of the sector that currently employ a high percentage of other EU nationals, as restrictions are already in place for non-EU workers.
staff need to be recruited in the hospitality and tourism sector
1.3million2024
2014Between
38%
Currently, a quarter of hospitality and tourism businesses have vacancies of which consider hard-to-fill.
and
4 People 1st analysis of Labour Force Survey (2015), ONS5 Between March and May 2016, unemployment across the UK was 4.9%6 Statistical Bulletin: UK Labour Market 2016, ONS7 Annual Survey of Hours and Earnings 2015, ONS

www.people1st.co.uk | 4
Geographical reliance Geographically, any restrictions will have a larger negative impact for hospitality and tourism businesses in England, Scotland and Northern Ireland, who have a significant percentage of non-British nationals making up their workforce and of which other EU nationals make up a significant proportion.
Scotland, in particular, has seen the percentage of its workforce made up of non-British workers increase by three percent between 2011 and 2015, of which the percentage of other EU nationals has increased by 14%. In contrast, Wales employs the lowest percentage of non-British workers and at the same time employers are more likely to report hard-to-fill vacancies and skill shortages.
Looking at the English regions, areas such as London, the South West, South East, East of England and the West Midlands are more dependent on other EU nationals to make up their workforce. London is the most dependent on non-British nationals, with 64% of the hospitality and tourism workforce made up of migrant labour, of which 46% comes from other EU countries.
There does appear to be a relationship between reported hard-to-fill vacancies and the percentage of non-British workers employed, which highlights the importance of other EU nationals to help alleviate hard-to-fill vacancies. However, this is not uniform across all regions. The North East of England has the lowest percentage of non-British nationals in its workforce and one of the highest reported hard-to-fill vacancies. In contrast, London has the highest percentage of non-British nationals in its workforce and it has the lowest reported hard-to-fill vacancies.
There is not a similar pattern for reported skill shortages, which would suggest at this macro level that non-British nationals are not necessarily filling skilled vacancies in significant numbers.
Dependency of migrant workers in hospitality occupations across the UK home nations (2011 to 2015)
AreaSize of the workforce
Employment projections
% of reported
hard-to-fill vacancies
% of reported
skill shortages
% of migrant workers
% of EU migrants
2015 2011 2015 2011 2015
England 1,690,054 1,118,590 38% 63% 24% 26% 36% 45%
Scotland 206,903 100,863 39% 64% 15% 18% 44% 58%
Wales 106,124 47,341 42% 78% 10% 11% 51% 52%
Northern Ireland
43,696 27,467 31% 60% 16% 20% – –
Source: People 1st analysis of Labour Force Survey 2015, ONS/Employer Skill Survey, UKCES
www.people1st.co.uk | 5
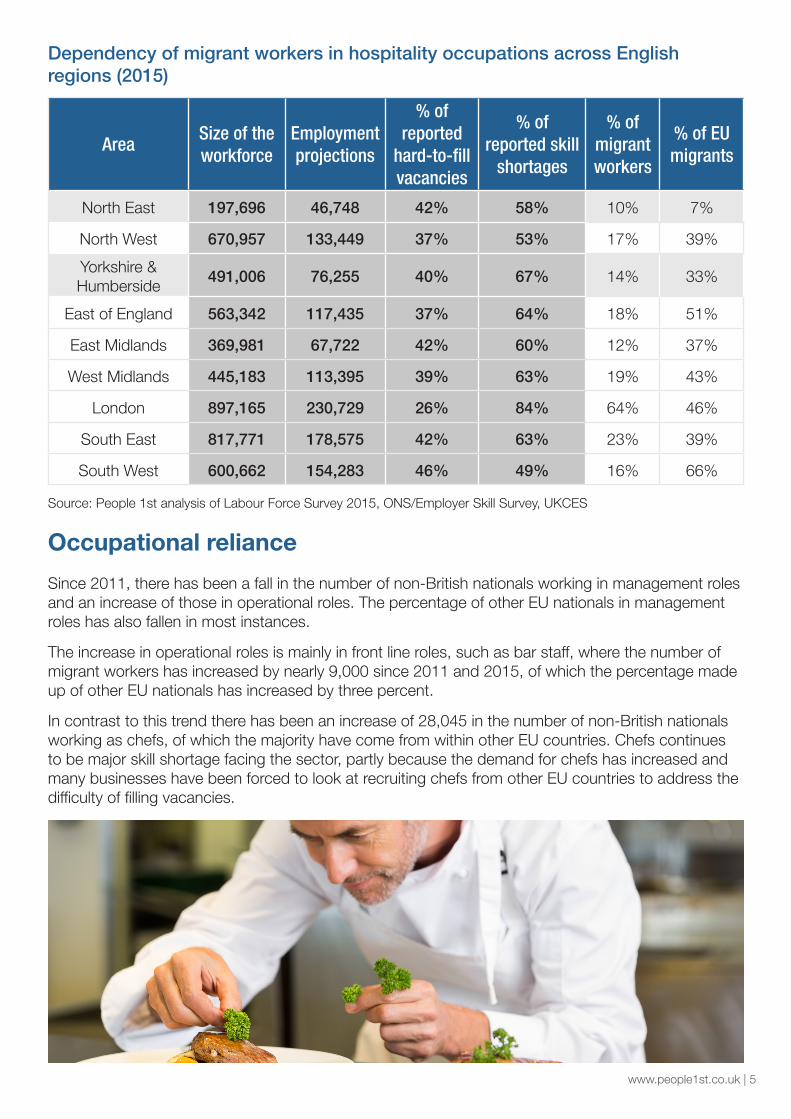
Dependency of migrant workers in hospitality occupations across English regions (2015)
AreaSize of the workforce
Employment projections
% of reported
hard-to-fill vacancies
% of reported skill
shortages
% of migrant workers
% of EU migrants
North East 197,696 46,748 42% 58% 10% 7%
North West 670,957 133,449 37% 53% 17% 39%
Yorkshire & Humberside
491,006 76,255 40% 67% 14% 33%
East of England 563,342 117,435 37% 64% 18% 51%
East Midlands 369,981 67,722 42% 60% 12% 37%
West Midlands 445,183 113,395 39% 63% 19% 43%
London 897,165 230,729 26% 84% 64% 46%
South East 817,771 178,575 42% 63% 23% 39%
South West 600,662 154,283 46% 49% 16% 66%
Source: People 1st analysis of Labour Force Survey 2015, ONS/Employer Skill Survey, UKCES
Occupational reliance Since 2011, there has been a fall in the number of non-British nationals working in management roles and an increase of those in operational roles. The percentage of other EU nationals in management roles has also fallen in most instances.
The increase in operational roles is mainly in front line roles, such as bar staff, where the number of migrant workers has increased by nearly 9,000 since 2011 and 2015, of which the percentage made up of other EU nationals has increased by three percent.
In contrast to this trend there has been an increase of 28,045 in the number of non-British nationals working as chefs, of which the majority have come from within other EU countries. Chefs continues to be major skill shortage facing the sector, partly because the demand for chefs has increased and many businesses have been forced to look at recruiting chefs from other EU countries to address the difficulty of filling vacancies.
www.people1st.co.uk | 6
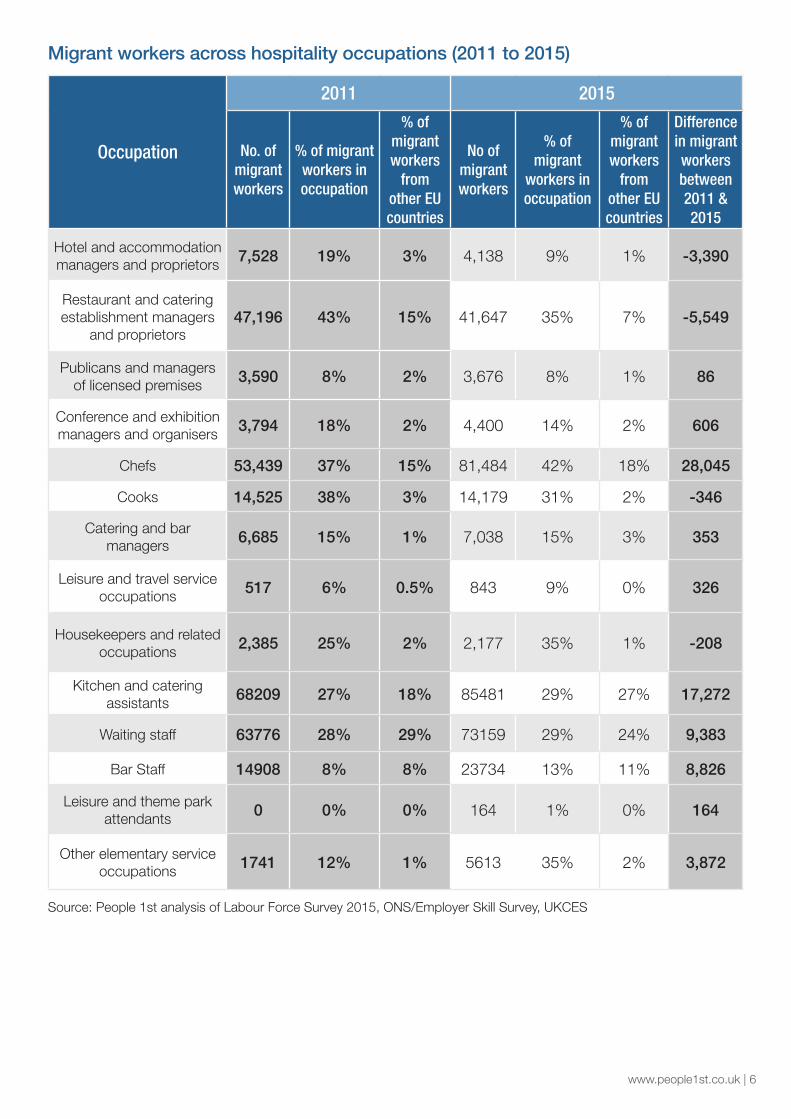
Migrant workers across hospitality occupations (2011 to 2015)
Occupation
2011 2015
No. of migrant workers
% of migrant workers in occupation
% of migrant workers
from other EU countries
No of migrant workers
% of migrant
workers in occupation
% of migrant workers
from other EU countries
Difference in migrant workers between 2011 & 2015
Hotel and accommodation managers and proprietors 7,528 19% 3% 4,138 9% 1% -3,390
Restaurant and catering establishment managers
and proprietors47,196 43% 15% 41,647 35% 7% -5,549
Publicans and managers of licensed premises 3,590 8% 2% 3,676 8% 1% 86
Conference and exhibition managers and organisers 3,794 18% 2% 4,400 14% 2% 606
Chefs 53,439 37% 15% 81,484 42% 18% 28,045
Cooks 14,525 38% 3% 14,179 31% 2% -346
Catering and bar managers 6,685 15% 1% 7,038 15% 3% 353
Leisure and travel service occupations 517 6% 0.5% 843 9% 0% 326
Housekeepers and related occupations 2,385 25% 2% 2,177 35% 1% -208
Kitchen and catering assistants 68209 27% 18% 85481 29% 27% 17,272
Waiting staff 63776 28% 29% 73159 29% 24% 9,383
Bar Staff 14908 8% 8% 23734 13% 11% 8,826
Leisure and theme park attendants 0 0% 0% 164 1% 0% 164
Other elementary service occupations 1741 12% 1% 5613 35% 2% 3,872
Source: People 1st analysis of Labour Force Survey 2015, ONS/Employer Skill Survey, UKCES

www.people1st.co.uk | 7
Industry reliance The increased reliance on non-British workers to fill vacancies is highlighted when looking at the breakdown of sector industries. With the exception of the events industry, since 2011 all hospitality industries have seen an increase in the number of non-British workers making up their workforce.
Migrant workers across hospitality industries (2011 to 2015)
Industries
2011 2015
No of migrant workers
% of migrant
workers in industry
% of migrant workers
from other EU countries
No of migrant workers
% of migrant workers
in industry
% of migrant workers
from other EU countries
Difference in migrant workers between 2011 & 2015
Hotels and similar accommodation 65,794 19% 23% 88,587 33% 25% 22,793
Holiday and other short - stay accommodation 3,823 7% 1% 4,970 7% 2% 1,147
Camp Sites and Other Accommodation 2,091 11% 1% 5,476 18% 2% 3,385
Restaurants 250,659 37% 52% 294,593 37% 50% 43,934
Food and Service Management 30,644 19% 7% 42,780 22% 7% 12,136
Pubs, Bars and Nightclubs 14,525 8% 8% 23,127 8% 7% 645
Organisation of conventions and trade shows 5,704 15% 2% 2,878 11% 0% -2,826
Tourist Services 1,700 8% 1% 3,946 12% 1% 2,246
Museum and Cultural Attractions 4,520 9% 1% 7,718 13% 2% 3,198
Visitor Attractions 17,823 7% 4% 18,681 7% 5% 858
TOTAL 405,239 22% 38% 492,756 24% 45% 87,517
Source: People 1st analysis of Labour Force Survey 2015, ONS/Employer Skill Survey, UKCES

www.people1st.co.uk | 8
Pressures on a changing labour market Any restrictions on recruiting EU nationals as a result of the UK’s exit from the EU is liable to have a significant impact on many sector businesses. As we have seen this will affect different occupations, industries and geographic locations in different ways. It will take time for businesses to adjust to any restrictions and in the short-term there is an insufficient supply of labour to meet the growth projections for the sector.
However, possible labour restrictions are just one pressure on a business’ people strategy. The National Living Wage, based on current government expectations, is to be at least £9.00 by 2020, which will significantly raise labour costs across the sector. Similarly, the apprenticeship levy is forcing businesses to rethink how they maximise their levy contributions, which for many large businesses is a significant outlay.
As a result, an increased number of businesses are rethinking their people strategies by placing greater emphasis on staff engagement, increased retention, progression and increased performance. This is sensible as it will increase the effectiveness and productivity of the workforce and reduce the need to recruit in such large numbers. Of the 1.3m staff projected to be required by 2024, 75% are to replace existing staff.
However, efforts in this direction will take time and in the short-term any significant restriction on migrant labour is liable to have a negative impact on many businesses.
For more information on how you can maximise your investment in your people and for support on the apprenticeship levy contact People 1st.
www.people1st.co.uk | [email protected] | 020 3074 1222