mifid/mifir briefing (05/03/2015) - profile dynamism and profile drift (by prof. hubner)
TRANSCRIPT

Prof. Georges Hübner Deloitte Chair of Portfolio Management and Performance, HEC-Univ. of Liège
Chief Scientific Officer, Gambit Financial Solutions
Profile Dynamism and Profile Drift
Risk perception makes the difference

2
• Existing questionnaires (before or after MiFID) were developed in a pre-crisis context: focus on “risk aversion”
• Two crises have shown that gains and losses produce asymmetric feelingso Prevalence of the notion of “drawdown”, referring to the sense of regret
o This also strongly depends on the investment objectives
Relation to personal situation matters; focus on “loss aversion”
• Heterogeneity of investors becoming more tangible:o Some (having lived several cycles) are patient, can wait to capture a risk
premium
o Others (“new money”) become impatient; they can take risks but need a safety net.
Relation to personal horizon matters; focus on “risk horizon”
New challenges raised by MiFIDRisk profiling

3
• Increasing pressure from some national authorities to improve “suitability” procedures
o BE: FSMA has published a tough report in August
o FR: deep questioning wrt application of the letter of MiFID
• Scientific study ordered by AMF about the concordance of profiling questionnaires
o Systematic study of several bank’s questionnaires
o Three axes of analysis:
• Axis 1: risk aversion
• Axis 2: loss aversion strongest contrib. of academic research to sector best practices
• Axis 3: risk horizon strongest value-added of financial practice with respect to academic research
o Diagnosis: 60% chance of obtaining radically difference advice from one bank to another
• Outcome: profiles are poorly understood and followed-up
New challenges raised by MiFIDRisk profiling

4
• For UCITS, the Key Information Document (KIID) presents risk in terms of volatility, even for complex funds. This is a simplification necessary for the purpose of the document, but is it sufficient?
• The burst of the crises (2008, 2011,…) revealed that many investors do care about tail risk. They want to protect a level of income or limit their regret (drawdown).
• This is too often confused with a defensive behavior, although it is not the level, but the type of risk that matters.
• This is captured by the notion of risk perception in the investor risk profile.
Dimensions of risk profilesBehavioral finance
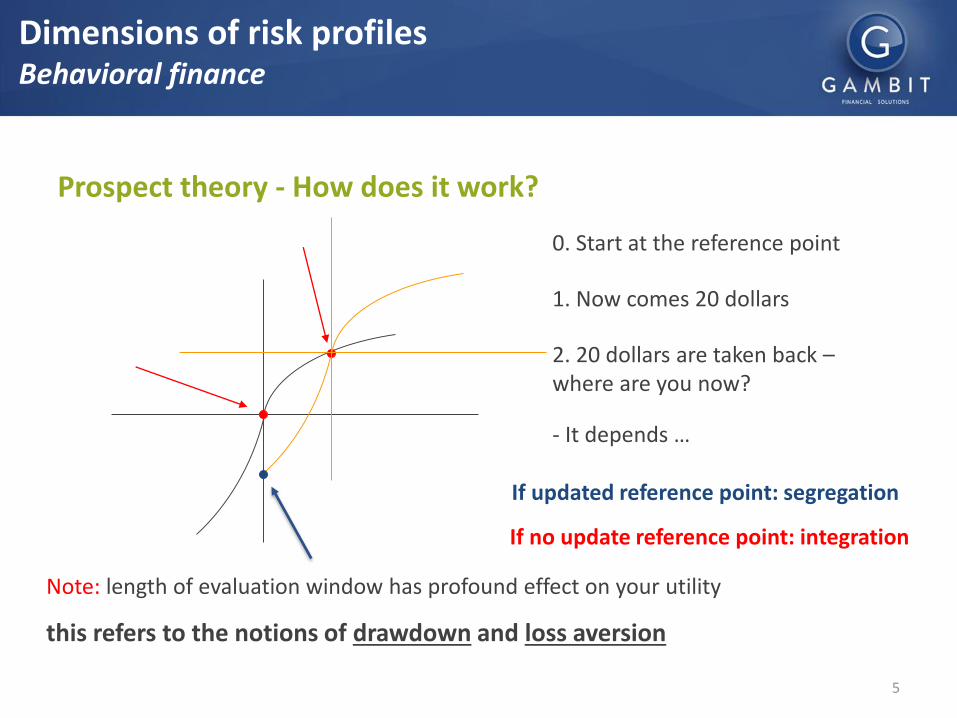
Prospect theory - How does it work?
0. Start at the reference point
1. Now comes 20 dollars
2. 20 dollars are taken back –where are you now?
- It depends …
If updated reference point: segregation
If no update reference point: integration
Note: length of evaluation window has profound effect on your utility
this refers to the notions of drawdown and loss aversion
5
Dimensions of risk profilesBehavioral finance

6
Investor 1 cares about volatility. He wants 1/3 of the volatility risk of an index. The UCITS can be a simple portfolio mixing 33% of the index and the rest in cash.
Investor 2 cares about protection. He wants to get initial capital back in 10 years and a guaranteed dividend of 1.4%/year, but can fully bear a 100% exposure to the index beyond this threshold. The UCITS can be a guaranteed fund with a cap (collar), and risk is not adequately captured by volatility.
Index Portfolio 1 Portfolio 2
St. Dev. 7,08% 2,34% 3,14%
Skewness -1,26 -1,24 -0,44
Kurtosis 7,33 7,27 0,92
VaR(Gaussian) 16,47% 5,44% 7,30%
MVaR 26,34% 8,70% 8,06%
Investor 1 prefersportfolio 1. For her, it has 33% of the riskof the index
Investor 2 prefers portfolio 2. For her, it has 33% of the risk of the index too, but differently. The KIID will be adapted to represent this risk exposure
EXAMPLE
Dimensions of risk profilesRisk perception

Gambit – No distribution allowedGambit – No distribution allowed
Definition of risk from the investor’s perspective (Loss aversion)
Dimensions of risk profilesRisk perception
7
market
wealth
market
wealth
Vertical dimension : Risk aversion- i.e. the quantity of risk an investor is willing to take
market
wealth
market
wealth
Horizontal dimension: Risk perception (Loss aversion)- ie the type of risk an investor wants to
avoid: capital loss or revenue decrease
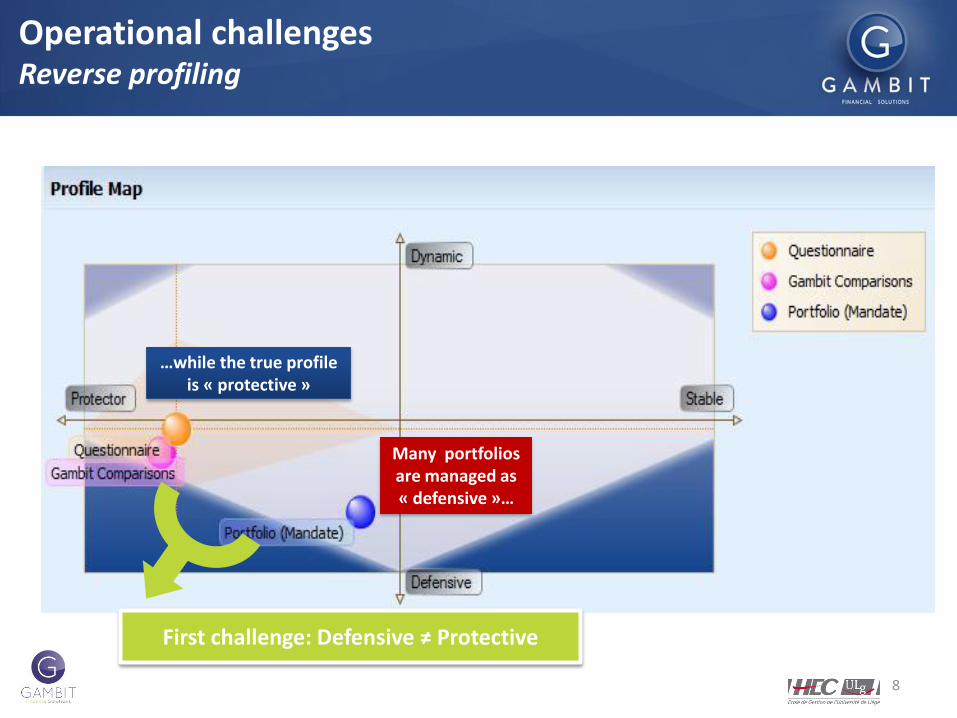
Your risk profile
8
Let’s represent this as a second profiling
dimension!
…while the true profile is « protective »
Many portfolios are managed as « defensive »…
First challenge: Defensive ≠ Protective
Operational challengesReverse profiling

9
Example: three portfolios proposed by a European bank
Outcome from the reverse profiling
Operational challengesReverse profiling
Equity Bonds Alternatives
Defensive profile 20% 57% 23%
Neutral profile 41,50% 42,50% 16%
Dynamic profile 60% 24% 16%

10
• A behavioral finance perspective instructs that the mix risk aversion – risk perception evolves over time:
Profile DriftProfile dynamism
– When obtaining higher returns, people can become more aggressive but wish to avoid regret Less RA, More LA
– For targeted investments, need for protection increases and volatility should shrink More RA, More LA
– As people get more experienced, they can change their perspective and become more “old money” (long run trend), but also objective need for more defensive portfolios Less LA, More RA

11
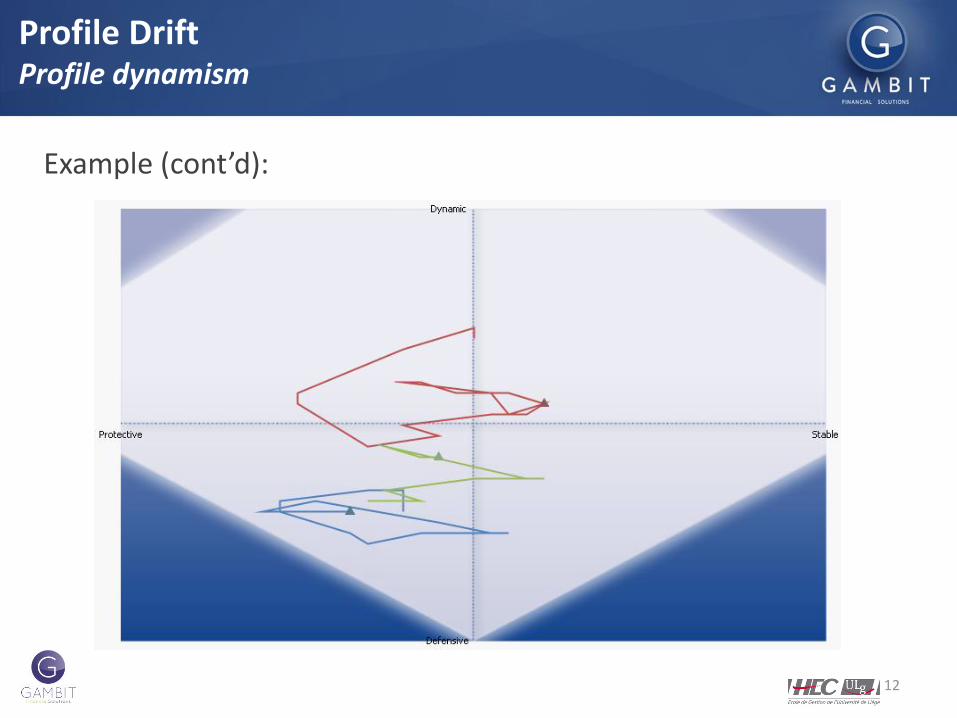
Even if portfolios are correctly mapped, MiFID II also requires a dynamic monitoring more difficult in two dimensions
Profile DriftProfile dynamism
Starting point: (3 years before): 3
protective/defensive portfolios
Ending point (sept 2014):
violations of investor profiles
(1 + agressive, 2 - protective)
Second challenge: Profile adequacy changes over time
12
Example (cont’d):
Profile DriftProfile dynamism

13
Portfolio solutionsSRRA
Dimension Strategic Asset AllocationStrategic Risk-Return
Allocation
Direction Top-down Top-down
Red wire Constant proportion of asset classes
Constant risk-return trade-off
Assumptions Constant risk exposuresCare for risk aversion
Varying risk exposuresCare for risk aversion and perception
Source of instability Risk Asset allocations
Tactical aspects Tolerance on asset bounds Tolerance on risk bounds
A new paradigm consistent with this approach

Example: start with a base of indexes
SRRA involves fairly strong rebalancings…
14
Portfolio solutionsSRRA
Equity Bond Alternative Cash
S&P 500Russel 1000 ValueBel 20
BarCap Euro Gov 10YrS&P/LSTA Leveraged BB Loan
HFRX Global Hedge FundS&P Global REITS&P GSCI Gold
Eonia total return
0%
10%
20%
30%
40%
50%
60%
70%
80%
90%
100%
déc.-07 juin-08 déc.-08 juin-09 déc.-09 juin-10 déc.-10 juin-11 déc.-11 juin-12 déc.-12
Cash
Alternatives
Bond
Equity

…but the reward is worth the effort in the end!
15
Portfolio solutionsSRRA
Min protection level
Max risk level

MiFID II: Advice and Discretionary services
16
Other Main impacts (non-limitative)
Requirement Impact Possible solution
Communicate whether the investment advice is independent or not
A quantitative, cross-product and independent methodology to asses risks will be required
Reverse Profiling of products
Communicate whether Suitability is assessed periodically or not
Automatic follow-up the portfolio and its adequacy with the risk profile
Continuous cross check of profile and reverse profile of portfolio
Ban on inducements Real added value of the service must be proven to the customer by (amongst others) a more rigorous risk and needs analysis, including risk profile.
Client-centric advice: Real-time portfolio construction showing the consistency between the recommendation and therisk profile/objectives of the client.
MiFID II is not the finance of the 21st century, but it will help innovators entering it!
Thank you for your attention
www.gambit-finance.com www.hec.ulg.ac.be