microwave extraction in analytical chemistry of pollutants: polychlorinated biphenyls
TRANSCRIPT

Microwave Extraction in Analytical Chemistry of Pollutants: Polychlorinated Biphenyls Francis I. Onuska" and Ken A. Terry Environment Canada, National Water Research Institute, Aquatic Ecobyaem Protection Branch. 867 Lakeshore Blvd , Burlington, Ont L7R 4A6 Canada
Key Words: Microwave extraction of PCBs Water samples Low ng/L concentration ECD quantitation
Summary
The microwave energy produced by a high intensity microwave oven was used to extract polychlorinated biphenyls (PCB) from water samples. This static method was compared with liquid-liquid extraction to determine the optimum and limiting conditions in extraction processes. The sample size and sample container shape determine the temperature profiles in the sample. Using a 500 rnL sample size, the detection limit is in the low ng/L range when an electron capture detector is employed.
1 Introduction
Sample preparation is as responsible for accuracy and precision as is instrumental analysis. Recent advances in analytical instru- mentation and sample preparation techniques, especially in su- percritical fluid extraction [ 11, do not provide too much hope for extracting aqueous samples at low parts-per-trillion levels (ppt). Although panaceas are rare in all analytical techniques, the ap- plicability of microwave-assisted sample extraction to all the sample matrices has met with a high degree of success [24] . Lopez-Avila et al. [5] extracted several groups of pollutants such as PAHs, phenolic compounds and organochlorinated pesticides spiked on different soil matrices with very good recoveries (from 70 to 100 %).
Microwaves have been used to process food for almost 40 years. The explosive growth in home microwave ovens in recent years, combined with the increased industrial use of microwaves, has created the need for research on the behavior of microwaves as a source of electromagnetic waves. The research and develop- ment activities in this area involve generation of microwaves in a cavity, heat and mass transfer during the exposure to micro- waves, and analytical utilization of microwaves in a sample preparation and analysis. In our study, we focused our research activity on the third area.
Recently, commercially available microwave ovens have been introduced into analytical laboratories to achicve a fast sample dissolution, drying, ashing, and microwave digestion [6]. The process of microwave extraction has been patented by Environ- ment Canada [7]. Environment Canada also holds worldwide trademark rights on Microwave Assisted Process (MAPTM').
It may be seen that microwave heating has many advantages over conventional heating but the process itself is very complicated. The interior electric field, the moisture movement in solid porous materials, and changes in the dielectric and other properties combine to make designing microwave analytical processes a challenging task. Moisture migration in turn, affects microwave
energy absorption characteristics of various matrices in an elec- tromagnetic field.
The only available references [ 2 4 ] discussing microwave ex- traction reveal an obvious need for models that account for this coupled interaction of heat and mass transport, particularly mod- els that take into account the nonlinear energy deposition patterns of microwave energy in environmental matrices.
The purpose of this study was to develop a rapid, reliable and effective water extraction method using a microwave oven equipped with ahighly specific energy magnetron generator. This method was compared with liquid-liquid extraction and various experimental conditions were tested for their effect on extraction efficiency to determine the optimum and limiting conditions for use of the electromagnetic waves in extraction processes.
2 Theoretical
Because microwaves are electromagnetic waves, they are com- posed of an electric and magnetic field and thus represent elec- tromagnetic energy. This energy can act as a nonionizing radiation that causes molecular motion of ions and rotation of dipoles, but does not effect molecular structure. Microwave wavelengths range from 0.3 to 30 cm (100 MHz to 3 GHz). Microwaves are generated by a magnetron and are fed into a cavity such as the microwave oven. The inside walls of this cavity are metallic surfaces that completely reflect the microwaves. The cavity sizes and the microwave frequency used are usually matched to set up a resonant pattern at 2.45 GHz frequency used in all home microwave ovens.
To understand basic principles without an exhaustive mathemati- cal treatment which is given in [S), it is important to define terms used in microwave technology.
The heat generation in the sample that is obtained with micro- wave energy requires the presence of a dielectric compound. A dielectric is an electrically non-conducting material (insulator). Three mechanisms of polarization are characterized by elec- tronic, atomic, and dipole or orientation polarizability. These charges are locally distributed in atoms, in molecules, or in the structures of solids and liquids. A space-charge (interfacial) po- larizability represents charge carriers that can migrate for some distance through the &electric. Some dielectric materials, such as water, contain permanent dipoles. The rotation of the dipoles in an alternating field causes friction, which produces heat. The heating of a sample with microwave energy depends, in part, upon the dissipation factor (tan 6).
J. High Resol. Chromalogr. VOL. 18, JULY 1995 417

Microwave Extraction in Analytical Chemistry of Pollutants
The dissipation factor is a ratio of the sample's dielectric loss, so called loss factor E", to its dielectric constant E', thus : tan E = €)'I&'
The dielectric constant is a measure of a sample's ability to block the microwave energy as it passes through. The loss factor meas- ures the sample's ability to dissipate that energy.
Water has a dipolar nature and microwave interactions occur by orientation polarization and interfacial polarization. The applied microwave field causes the molecules of water, on average, to temporarily spend slightly more time orienting themselves in one direction rather than in other directions. When field is removed, thermal agitation returns the molecules to a disordered state in the relaxation time and thermal energy is released. At 2.45 GHz, the alignment of the molecules followed by their return to disor- der occurs approx. 5 x lo9 times per second which results in rapid heating.
The general relationship for calculating power output ( P ) is ex- pressed as:
P = cp K A T i d t = 35 A T
where AT = (TI - To) and Ti is the final temperature and To is the initial temperature in degrees Celsius. The microwave energy output is measured in watts. For our microwave oven it is 750 W (Figure 1). The apparent microwave power output can be easily determined by measuring the rise in temperature of 1000 grams of water at full power for 2 minutes [9].
0 10 20 30 40 50 60 70 80 90 100 Temperature in*C
Figure 1. Dependence of' the dielectric loss factor on temperature at 2.45 GHz.
In analytical applications small sample sizes (0.5 to 2 g) are often used. However, this can also cause a problem because reflected energy can damage the magnetron. Therefore, analytical work with small sample sizes requires a microwave oven that is de- signed to protect the source of microwave energy. If the micro- waves travel from the magnetron to the sample and are not reflected, then the system is perfectly matched. If there is reflec- tion, overheating of the magnetron may occur and it will cause a loss of power or even destruction of the magnetron. Location of samples in the microwave cavity must be carefully selected to intercept the microwave nodes. As the sample intercepts the microwaves, the percentage of energy in the wave is absorbed according to the dissipation factor of the solution in the sample container.
If more than one sample is placed in a cavity, the samples location with the cavity determines the particular exposure for each sam-
ple to the microwave pattern in the cavity. If one sample has greater exposure than the other to the intercepting microwaves, it will heat differently and non-uniformly. The uniformity can be improved by rotating the samples on a turntable. By moving the sample, all locations in the samples can be made to produce more uniform heating.
2.1 The Heat Transfer Profiles
For microwave heating, the governing energy equation includes a heat-generation term:
- = a x V 2 x T + ~
dT
This equation represents the temperature differential ( r ) as a function of time (t). The parameters a, p , v, and cp are the thermal diffusivity, density, temperature gradient, and specific heat ca- pacity of the material, respectively [lo]. The heat generated per unit volume of material (Q) represents the conversion of electro- magnetic energy.
Q at P x CP
Power in Watts 1000 -
800
600
400
200
0 0 50 100 150 200 250 300 350 400 450 500 550 600
Volume in mL
Figure 2. Requircd electric power YS. volume of Hater at 2.45 GHz to bring a sample temperature to 90 f 5 "C.
Figure 2 shows the dependence of the dielectric loss on tempera- ture for water at 2,450 MHz. The intensity of the electric field inside a sample matrix depends on several factors, including water dielectric constant and loss, the design of the oven and the placement of the sample inside the cavity. The value of the electric field can be increased by applying more power to the microwave oven.
3 Experimental
3.1 Standards
Analytical reference standard solution (CLB-1 -B) of the target PCB congeners was obtained from the National Research Coun- cil, Atlantic Region Laboratory, Halifax, N.S. Working solutions were prepared in isooctane. The concentration profile of the mixture is given in Table 1 . Other common chemicals were reagent grade purity from various suppliers. Glass fiber filters of nominal 1 pm pore size were obtained from Gelman Sciences lnc. (Rexdale, Ont.). The fiber filters, sodium sulfate used for drying organic extracts, and the disposable pipets were heated to 500 "C for 24 h before use.
418 VOL. 18, JULY 1995 J. High Resol. Chromatogr.
Microwave Extraction in Analytical Chemistry of Pollutants
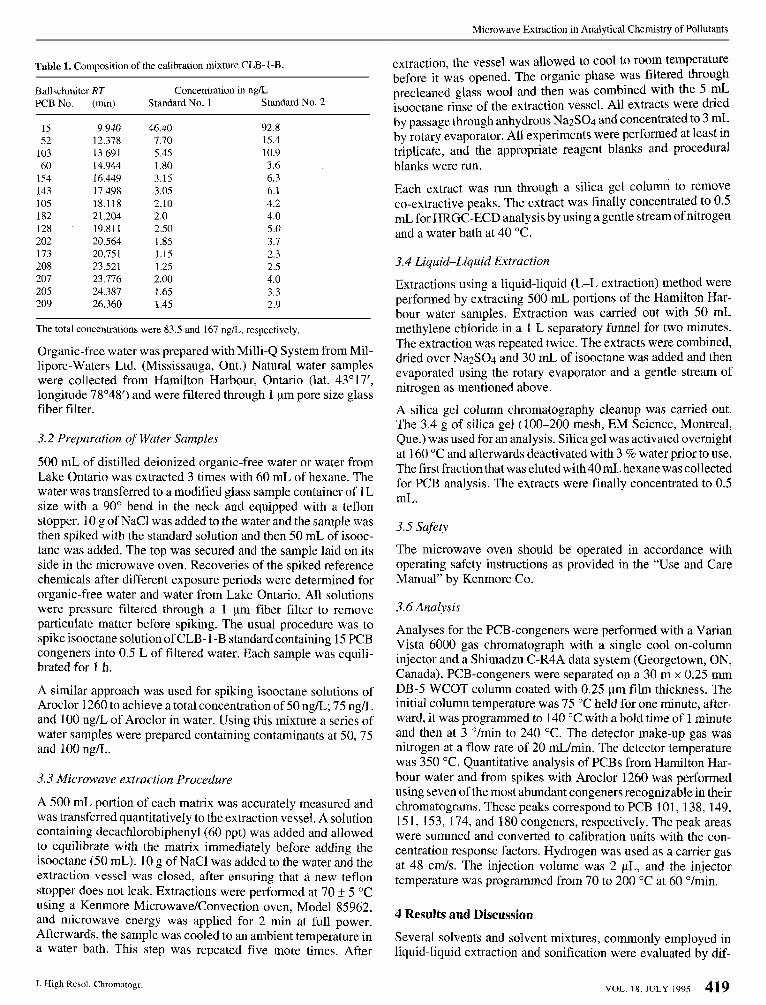
Table 1. Composition of the calibration mixture CLB-I-B.
Ballschmiter RT Concentration in n g L PCB No. (min) Standard No. 1 Standard No. 2
15 52
103 60
154 143 105 182 128 202 173 208 207 205 209
9.940 12.378 13.691 14.944 16.449 17.498 18.118 21.204 19.81 1 20.564 20.751 23.521 23.776 24.387 26.360
46.40 7.70 5.45 1 3 0 3.15 3.05 2.10 2.0 2.50 1.85 1.15 1.25 2.00 I .65 I .45
92.8 15.4 10.9 3.6 6.3 6.1 4.2 4.0 5.0 3.7 2.3 2.5 4.0 3.3 2.9
The total concentrations were 83.5 and 167 ngL, respectively.
Organic-free water was prepared with Milli-Q System from Mil- lipore-Waters Ltd. (Mississauga, Ont.) Natural water samples were collected from Hamilton Harbour, Ontario (lat. 43" 17', longitude 78'48') and were filtered through 1 pm pore size glass fiber filter.
3.2 Preparation of Water Samples
500 mL of distilled deionized organic-free water or water from Lake Ontario was extracted 3 times with 60 mL of hexane. The water was transferred to a modified glass sample container of 1L size with a 90" bend in the neck and equipped with a teflon stopper. 10 g of NaCl was added to the water and the sample was then spiked with the standard solution and then 50 mL of isooc- tane was added. The top was secured and the sample laid on its side in the microwave oven. Recoveries of the spiked reference chemicals after different exposure periods were determined for organic-free water and water from Lake Ontario. All solutions were pressure filtered through a 1 pm fiber filter to remove particulate matter before spilung. The usual procedure was to spike isooctane solution of CLB- 1-B standard containing 15 PCB congeners into 0.5 L of filtered water. Each sample was equili- brated for 1 h.
A similar approach was used for spiking isooctane solutions of Aroclor 1260 to achieve a total concentration of 50 ngL; 75 ngL and 100 ng/L of Aroclor in water. Using this mixture a series of water samples were prepared containing contaminants at 50,75 and 100 ngiL.
3.3 Microwave extraction Procedure
A 500 mL portion of each matrix was accurately measured and was transferred quantitatively to the extraction vessel. A solution containing decachlorobiphenyl(60 ppt) was added and allowed to equilibrate with the matrix immediately before adding the isooctane (50 mL). 10 g of NaCl was added to the water and the extraction vessel was closed, after ensuring that a new teflon stopper does not leak. Extractions were performed at 70 5 5 "C using a Kenmore Microwave/Convection oven, Model 85962, and microwave energy was applied for 2 min at full power. Afterwards, the sample was cooled to an ambient temperature in a water bath. This step was repeated five more times. After
extraction, the vessel was allowed to cool to room temperature before it was opened. The organic phase was filtered through precleaned glass wool and then was combined with the 5 mL isooctane rinse of the extraction vessel. All extracts were dried by passage through anhydrous N a 2 S 0 4 and concentrated to 3 mL by rotary evaporator. All experiments were performed at least in triplicate, and the appropriate reagent blanks and procedural blanks were run.
Each extract was run through a silica gel column to remove co-extractive peaks. The extract was finally concentrated to 0.5 mL for HRGC-ECD analysis by using a gentle stream of nitrogen and a water bath at 40 "C.
3.4 Liquid-Liquid Extrucfion
Extractions using a liquid-liquid (L-L extraction) method were performed by extracting 500 mL portions of the Hamilton Har- bour water saniples. Extraction was carried out with 50 mL methylene chloride in a 1 L separatory funnel for two minutes. The extraction was repeated twice. The extracts were combined, dried over N a 2 S 0 4 and 30 mL of isooctane was added and then evaporated using the rotary evaporator and a gentle stream of nitrogen as mentioned above.
A silica gel column chromatography cleanup was carried out. The 3.4 g of silica gel (100-200 mesh, EM Science, Montreal, Que.) was used for an analysis. Silica gel was activated overnight at 160 "C and afterwards deactivated with 3 % water prior to use. The first fraction that was eluted with 40 mL hexane was collected for PCB analysis. The extracts were finally concentrated to 0.5 mL.
3.5 Safety
The microwave oven should be operated in accordance with operating safety instructions as provided in the "Use and Care Manual" by Kenmore Co.
3.6 Analysis
Analyses for the PCB-congeners were performed with a Varian Vista 6000 gas chromatograph with a single cool on-column injector and a Shimadzu C-R4A data system (Georgetown, ON, Canada). PCB-congeners were separated on a 30 m x 0.25 mm DB-5 WCOT column coated with 0.25 pm film thickness. The initial column temperature was 75 "C held for one minute, after- ward, it was programmed to 140 "C with a hold time of 1 minute and then at 3 "/min to 240 "C. The detector make-up gas was nitrogen at a flow rate of 20 mL/min. The detector temperature was 350 "C. Quantitative analysis of PCBs from Hamilton Har- bour water and from spikes with Aroclor 1260 was performed using seven of the most abundant congeners recognizable in their chromatograms. These peaks correspond to PCB 101,138, 149, 151, 153, 174, and 180 congeners, respectively. The peak areas were summed and converted to calibration units with the con- centration response factors. Hydrogen was used as a carrier gas at 48 c d s . The injection volume was 2 FL, and the injector tempcrature was programmed from 70 to 200 "C at 60 "/min.
4 Results and Discussion
Several solvents and solvent mixtures, commonly employed in liquid-liquid extraction and sonification were evaluated by dif-
J . High Rrrol. Chromatog, VOL. 18, JULY 1995 419

Microwave Extraction in Analytical Chemistry of Pollutants
Table 2. Microwave extraction mean recoveries of selected PCB Congeners from distilled water ( n = 6).
PCB NO.
Mean % Recoveries for PCB at 83.5 ng/L Spike X S.D. %RSD Spike X S.D. BRSD
Mean 9'6 Recoveries for PCB at 167 n g L
15 52
103 60
154 143 10s 182 128 202 173 208 207 205 209
46.40 7.70 5.45 1.80 3.15 3.05 2.10 2.00 2.50 1.85 1.15 1.25 2.00 1.65 1.45
69.00 82.07 68.92 79.00 67.85 76.98 79.42 76.67 74.80 64.68 72.27 82.45 85.52 70.10 77.42
14.764 9.093 6.454 6.813 7.496 3.930 8.496 1.969 7.600 8.052 7.346
15.188 14.144 7.066
15.374
21.40 11.08 9.36 8.62
11.04 5.10
10.70 2.57
10.16 12.45 18.42 18.42 16.64 10.0 19.86
92.8 15.4 10.9 3.9 6.3 6.1 4.2 4.0 5.0 3.7 2.3 2.5 4.0 3.3 2.9
74.95 81.37 74.02 7 1.97 65.53 79.95 65.95 83.40 83.27 71.43 74.12 78.13 74.12 69.72 83.80
9.55 12.74 5.33 6.55 9.87 13.33 6.3X 8.86 9.06 13.82 5.49 6.87 8.89 13.48 8.35 10.01 3.56 4.28
11.17 15.64 6.85 9.24 7.61 9.74 2.20 2.94
14.18 20.34 16.34 19.5
ferent authors to achieve good recoveries [2,3,5,6] We chose isooctane in all subsequent experiments, since this solvent was relatively immiscible with water, dissolved PCB congeners ef- fectively, its boiling point is almost the same as for water, and it was compatible with electron capture detection.
Recoveries of the spiked PCB-congeners from organic free water at two levels (83.5 and 175 pg/L ) shown in Table 2 were in the range between 68 to 85 %. Variation of the recovery can be related to the fluctuation of temperature (or pressure) inside the extrac- tion vessel and a physical adsorption of PCBs on the micropar- ticulate matter and glass walls of the extraction vessel. Results indicate that recovery of selected PCB-congener spikes are re- producible and provide reliable data at the ppt-level. In agreement with the work published by Mas et a1 [ I 11 who evaluated the reliability of quantitation of PCBs, it can be concluded that the coefficients of variation (c.v.) were unsatisfactory for many con- geners when the concentration of an injected congener was below 5 pg/gL. The authors recommended, based on the interlaboratory data that C . V . values were generally acceptable, if these C.V. values were less than 20 %, at concentrations greater than 5 pg/pL. We were able to achieve relatively uniform reproducibility of data with satisfactory mean recoveries at PCB congener total concen- tration of 83.5 ng/L. Medium mean relative standard deviation within a range of 64.68 f 12.45% to 82.07 k 11.1% for the majority of congeners is realistic, excluding the most volatile congener # 15 and those that were injected below 5 pg/pL. To improve the recovery for these congeners, perhaps a higher boil- ing point solvent would be a more suitable collection solvent. Inconsistencies can also be partially attributed to erroneous inte- gration due to the rising baseline. A limited number of experi- ments indicated that a thick wall teflon vessel operated at much higher temperature (>lo0 ") provided recoveries greater than 95%.
Experiments, in which these samples were extracted using dif- ferent amount of sodium chloride showed strong evidence that the salting out effect plays an important role. This effect is illustrated in Figure 3. Besides the fact that salting out process
% Recovery in0
100
90 90 80 70 80 e0 70 53 60
50 40
40 30
30 20
0 20 10
10 0
Amount of NaCl in grams
Figure 3. The effect of sodium chloride on extraction recovery of PCBs.
occurs, it is also anticipated that heat transfer is much faster and more uniform due to the even distribution of NaCl ions in the solution.
The amount of water sample that can be used for an analysis depends on the microwave energy output which is measured in watts (1 W = 60J/min = 14.33 cal/min). The results indicated that a 500 mL sample volume was desirable since it can reach 70 ? 5 "C within 2 min and allows PCB quantitation down to low ppt levels. When varying both the solvent volume and the amount of NaC1, while keeping their ratio constant, the 2 minute cycle was sufficient. When simultaneous extractions were performed by employing 2 extraction vessels containing 500 mL of water in each, it was found that the time required to heat the content to the desired temperature almost doubled. It can be concluded that the sample size and the sample shape determine the temperature profiles in the sample. The relative magnitudes of the penetration depth and the sample size determine the uniformity of heating. When the penetration depth is much less than the sample size, heating is restricted near the surface. Surface evaporation also significantly alters the temperature profile near the surface.
The time rate of temperature change in a microwave-heated sample depends on the diffusion as well as the generation of heat. Boiling of the sample further limits temperature increase. As the water continues to boil it evaporates; energy absorption is re- duced because liquid water is the most active component in
420 VOL. 18, JULY 199s J. High Kesol. Chromatogr.
Microwave Extraction in Analytical Chemistry of Pollutants
absorbing microwave energy. This decrease in absovtion pro- duces an additional stabilizing effect. For continued heating after most of the water has evaporated, the temperature can eventually rise to very high values. This condition is not desirable during extraction.
Afterwards, the quantitation accuracy was also investigated using three different concentrations of Aroclor 1260. Results shown in Table 3 give recoveries corresponding to the average mean values of the spiked amount of the Aroclor. Standard deviations for all three concentrations were varying from 76.7 * 5.5 % for the 100 ppt level and 106.9 f 2.4 % for the 50 ppt level of Aroclor 1260. The statistical data for Aroclor 1260 quantitation indicates that the obtained results are acceptable. For this reason this technique can be recommended as an alternative method for extracting Aroclor from water samples at the ppt level.
Table 3. Effect of level of spiking on the efficiency of Arochlor 1260 extraction from Lake Ontario.
Concentration Extraction efficiency X k S.D. First Second Third extraction extraction extraction
50 ppt Arochlor 1260 109.1 104.3 107.2 106.9 f 2.4 75 ppt Arochlor 1260 103.0 91 .o 86.2 94.4 f 8.6
100 ppt Arochlor 1260 80.1 70.3 79.7 76.7 k 5.5
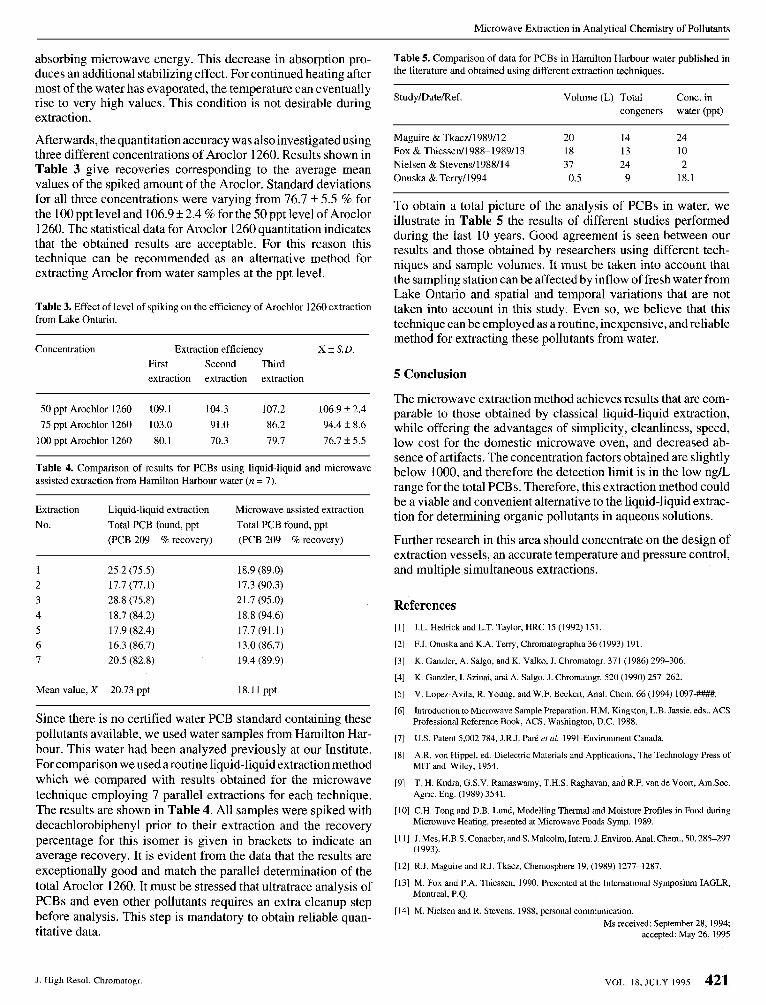
Table 4. Comparison of rcsults for PCBs using liquid-liquid and microwave assisted extraction from Hamilton Harbour water (n = 7).
Extraction Liquid-liquid extraction Microwave assisted extraction No. Total PCB found, ppt Total PCB found, ppt
(PCB 209 ?6 recovery) (PCB 209 75 recovery)
1 25.2 (75.5) 2 17.7 (77.1) 3 28.8 (75.8) 4 18.7 (84.2) 5 17.9 (82.4) 6 16.3 (86.7) 7 20.5 (82.8)
Mean value, X 20.73 ppt
18.9 (89.0) 17.3 (90.3) 21.7 (95.0) 18.8 (94.6) 17.7 (91.1) 13.0 (86.7) 19.4 (89.9)
18.11 ppt
Since there is no certified water PCB standard containing these pollutants available, we used water samples from Hamilton Har- bour. This water had been analyzed previously at our Institute. For comparison we used a routine liquid-liquid extraction method which we compared with results obtained for the microwave technique employing 7 parallel extractions for each technique. The results are shown in Table 4. All samples were spiked with decachlorobiphenyl prior to their extraction and the recovery percentage for this isomer is given in brackets to indicate an average recovery. It is evident from the data that the results are exceptionally good and match the parallel determination of the total Aroclor 1260. It must be stressed that ultratrace analysis of PCBs and even other pollutants requires an extra cleanup step before analysis. This step is mandatory to obtain reliable quan- titative data.
Table 5. Comparison of data for PCBs in Hamilton Harbour water published in the literature and obtained using different extraction techniques.
StudyiDdtelRef. Volume (L) Total Conc. in congeners water (ppt)
Maguire & Tkacz/1989/12 20 14 24 Fox & Thiessen/1988-1989/13 18 13 10 Nielsen & Stevend1988/14 37 24 2 Onuska & Terry11994 0.5 9 18.1
To obtain a total picture of the analysis of PCBs in water, we illustrate in Table 5 the results of different studies performed during the last 10 years. Good agreement is seen between our results and those obtained by researchers using different tech- niques and sample volumes. It must be taken into account that the sampling station can be affected by inflow of fresh water from Lake Ontario and spatial and temporal variations that are not taken into account in this study. Even so, we believe that this technique can be employed as a routine, inexpensive, and reliable method for extracting these pollutants from water.
5 Conclusion
The microwave extraction method achieves results that are com- parable to those obtained by classical liquid-liquid extraction, while offering the advantages of simplicity, cleanliness, speed, low cost for the domestic microwave oven, and decreased ab- sence of artifacts. The concentration factors obtained are slightly below 1000, and therefore the detection limit is in the low ng/L range for the total PCBs. Therefore, this extraction method could be a viable and convenient alternative to the liquid-liquid extrac- tion for determining organic pollutants in aqueous solutions.
Further research in this area should concentrate on the design of extraction vessels, an accurate temperature and pressure control, and multiple simultaneous extractions.
References J.L. Hedrick and L.T. Taylor, HRC 15 ( 1 992) 15 1 ,
F.I. Onuska and K.A. Terry, Chromatographia 36 (1993) 191.
K. Gander, A. Salgo. and K. Valko, J. Chromatogr. 371 (1986) 299-306.
K. Ganzler, I. Szinai, and A. Salgo, J . Chromatogr. 520 (1990) 257-262.
V. Lopez-Avila, R. Young, and W.F. Beekert, Anal. Chem. 66 (1994) 1097###.
Introduction to Microwave Sample Preparation, H.M. Kingston, L.B. Jassie, eds., ACS Professional Reference Book, ACS, Washington, D.C. 1988.
U S . Patent 5,002 784, J.R.J. Par6 er al. 1991-Environment Canada.
A.R. von Hippel, ed. Dielectric Materials and Applications, The Technology Press of MIT and Wiley, 1951.
T. H. Kudra, G.S.V. Ramaswamy,T.H.S. Raghavan, and R.F. vandeVoort,Am.Soc. Agric. Eng. (1989) 3541.
1101 C.H. Tong and D.B. Lund, Modelling Thermal and Moisture Profiles in Food during Microwave Heating, presented at Microwave Foods Symp. 1989.
1111 J. Mes, H.B.S. Conacher. andS.Malcolm, Intern. J.Environ. Anal. Chem., 50,285-297
[12] R.J. Maguire and R.J. Tkacr, Chernosphere. 19, (1989) 127771287,
[I31 M. Fox and P.A. Thiessen, 1990. Presented at the International Symposium IAGLR,
[I41 M. Nielsen and R. Stevens, 1988, personal communication.
(1993).
Montreal, P.Q.
Ms received: September 28, 1994; accepted: May 26,1995
J. High Resol. Chromatogr. VOL. 18, JULY 1995 421