method 8082a polychlorinated biphenyls ( · pdf filemethod 8082a polychlorinated biphenyls...
TRANSCRIPT

8082A - 1 Revision 1November 2000
METHOD 8082A
POLYCHLORINATED BIPHENYLS (PCBs) BY GAS CHROMATOGRAPHY
1.0 SCOPE AND APPLICATION
1.1 Method 8082 is used to determine the concentrations of polychlorinated biphenyls(PCBs) as Aroclors or as individual PCB congeners in extracts from solid, tissue, and aqueousmatrices, using open-tubular, capillary columns with electron capture detectors (ECD) or electrolyticconductivity detectors (ELCD). The target compounds listed below may be determined by eithera single- or dual-column analysis system. The Aroclors and PCB congeners listed below have beentested by this method, and the method may be appropriate for additional congeners and Aroclors(see Sec. 1.4). The method also may be applied to other matrices such as oils and wipe samples,if appropriate sample extraction procedures are employed.
Compound CAS Registry No. IUPAC #
Aroclor 1016 12674-11-2 -Aroclor 1221 11104-28-2 -Aroclor 1232 11141-16-5 -Aroclor 1242 53469-21-9 -Aroclor 1248 12672-29-6 -Aroclor 1254 11097-69-1 -Aroclor 1260 11096-82-5 -2-Chlorobiphenyl 2051-60-7 12,3-Dichlorobiphenyl 16605-91-7 52,2',5-Trichlorobiphenyl 37680-65-2 182,4',5-Trichlorobiphenyl 16606-02-3 312,2',3,5'-Tetrachlorobiphenyl 41464-39-5 442,2',5,5'-Tetrachlorobiphenyl 35693-99-3 522,3',4,4'-Tetrachlorobiphenyl 32598-10-0 662,2',3,4,5'-Pentachlorobiphenyl 38380-02-8 872,2',4,5,5'-Pentachlorobiphenyl 37680-73-2 1012,3,3',4',6-Pentachlorobiphenyl 38380-03-9 1102,2',3,4,4',5'-Hexachlorobiphenyl 35065-28-2 1382,2',3,4,5,5'-Hexachlorobiphenyl 52712-04-6 1412,2',3,5,5',6-Hexachlorobiphenyl 52663-63-5 1512,2',4,4',5,5'-Hexachlorobiphenyl 35065-27-1 1532,2',3,3',4,4',5-Heptachlorobiphenyl 35065-30-6 1702,2',3,4,4',5,5'-Heptachlorobiphenyl 35065-29-3 1802,2',3,4,4',5',6-Heptachlorobiphenyl 52663-69-1 1832,2',3,4',5,5',6-Heptachlorobiphenyl 52663-68-0 1872,2',3,3',4,4',5,5',6-Nonachlorobiphenyl 40186-72-9 206

8082A - 2 Revision 1November 2000
1.2 Aroclors are multi-component mixtures. When samples contain more than oneAroclor, a higher level of analyst expertise is required to attain acceptable levels of qualitative andquantitative analysis. The same is true of Aroclors that have been subjected to environmentaldegradation ("weathering") or degradation by treatment technologies. Such weathered multi-component mixtures may have significant differences in peak patterns compared to those of Aroclorstandards.
1.3 The seven Aroclors listed in Sec. 1.1 are those that are commonly specified in EPAregulations. The quantitation of PCBs as Aroclors is appropriate for many regulatory compliancedeterminations, but is particularly difficult when the Aroclors have been weathered by long exposurein the environment. Therefore, this method provides procedures for the determination of a selectedgroup of the 209 possible PCB congeners, as another means to measure the concentrations ofweathered Aroclors. The 19 PCB congeners listed above have been tested by this method andwere chosen for testing because many of them represent congeners specific to the commonAroclor formulations (see Table 7). These 19 PCB congeners do not represent the co-planar PCBsor the other PCBs of greatest toxicological significance. The analytical procedures for these 19congeners may be appropriate for the analysis of other congeners not specifically included in thismethod and may be used as a template for the development of such a procedure. However, all 209PCB congeners cannot be separated using the GC columns and procedures described in thismethod. If this procedure is expanded to encompass other congeners, then the analyst must eitherdocument the resolution of the congeners in question, or establish procedures for reporting theresults of coeluting congeners that are appropriate for the intended application.
1.4 The PCB congener approach potentially affords greater quantitative accuracy whenPCBs are known to be present. As a result, this method may be used to determine Aroclors, somePCB congeners, or "total PCBs," depending on regulatory requirements and project needs. Thecongener method is of particular value in determining weathered Aroclors. However, analystsshould use caution when using the congener method when regulatory requirements are based onAroclor concentrations. Also, this method is not appropriate as written for the determination of theco-planar PCB congeners at the very low (sub part per trillion) concentrations sometimes neededfor risk assessment purposes.
1.5 Compound identification based on single-column analysis should be confirmed on asecond column, or should be supported by at least one other qualitative technique. This methoddescribes analytical conditions for a second gas chromatographic column that can be used toconfirm the measurements made with the primary column. GC/MS (e.g., Method 8270) is alsorecommended as a confirmation technique when sensitivity permits (see Sec. 7.10).
1.6 This method includes a dual-column option that describes a hardware configurationin which two GC columns are connected to a single injection port and to two separate detectors.The option allows one injection to be used for dual-column simultaneous analysis.
1.7 The analyst must select columns, detectors and calibration procedures mostappropriate for the specific analytes of interest in a study. Matrix-specific performance data mustbe established and the stability of the analytical system and instrument calibration must beestablished for each analytical matrix (e.g., hexane solutions from sample extractions, diluted oilsamples, etc.). Example chromatograms and GC conditions are provided as guidance.
1.8 Prior to employing this method, analysts are advised to consult the base method foreach type of procedure that may be employed in the overall analysis (e.g., Methods 3500, 3600,

8082A - 3 Revision 1November 2000
5000, and 8000) for additional information on quality control procedures, development of QCacceptance criteria, calculations, and general guidance. Analysts also should consult the disclaimerstatement at the front of the manual and the information in Chapter Two, Sec. 2.1, for guidance onthe intended flexibility in the choice of methods, apparatus, materials, reagents, and supplies, andon the responsibilities of the analyst for demonstrating that the techniques employed are appropriatefor the analytes of interest, in the matrix of interest, and at the levels of concern.
In addition, analysts and data users are advised that, except where explicitly specified in aregulation, the use of SW-846 methods is not mandatory in response to Federal testingrequirements. The information contained in this method is provided by EPA as guidance to be usedby the analyst and the regulated community in making judgments necessary to generate results thatmeet the data quality objectives for the intended application.
1.9 This method is restricted to use by, or under the supervision of, analysts experiencedin the use of gas chromatographs (GC) and skilled in the interpretation of gas chromatograms.Each analyst must demonstrate the ability to generate acceptable results with this method.
2.0 SUMMARY OF METHOD
2.1 A measured volume or weight of sample (approximately 1 L for liquids, 2 to 30 g forsolids) is extracted using the appropriate matrix-specific sample extraction technique.
2.1.1 Aqueous samples may be extracted at neutral pH with methylene chlorideusing either Method 3510 (separatory funnel), Method 3520 (continuous liquid-liquid extractor),Method 3535 (solid-phase extraction), or other appropriate technique.
2.1.2 Solid samples may be extracted with hexane-acetone (1:1) or methylenechloride-acetone (1:1) using Method 3540 (Soxhlet), Method 3541 (automated Soxhlet),Method 3545 (pressurized fluid extraction), Method 3546 (microwave extraction), Method 3550(ultrasonic extraction), Method 3562 (supercritical fluid extraction), or other appropriatetechnique or solvents.
2.1.3 Tissue samples may be extracted using Method 3562 (supercritical fluidextraction), or other appropriate technique. (The extraction techniques for other solid matrices(see Sec. 2.1.2) may be appropriate for tissue samples).
2.2 Extracts for PCB analysis may be subjected to a sulfuric acid/potassiumpermanganate cleanup (Method 3665) designed specifically for these analytes. This cleanuptechnique will remove (destroy) many single component organochlorine or organophosphoruspesticides. Therefore, Method 8082 is not applicable to the analysis of those compounds. Instead,use Method 8081.
2.3 After cleanup, the extract is analyzed by injecting a measured aliquot into a gaschromatograph with either a narrow- or wide-bore fused-silica capillary column and either anelectron capture detector (GC/ECD) or an electrolytic conductivity detector (GC/ELCD).
2.4 The chromatographic data may be used to determine the seven Aroclors in Sec. 1.1,selected individual PCB congeners, or total PCBs (see Secs. 7.8 and 7.9).

8082A - 4 Revision 1November 2000
3.0 INTERFERENCES
3.1 Refer to Methods 3500 (Sec. 3.0, in particular), 3600, and 8000 for a discussion ofinterferences.
3.2 Interferences co-extracted from the samples will vary considerably from matrix tomatrix. While general cleanup techniques are referenced or provided as part of this method, uniquesamples may require additional cleanup approaches to achieve desired degrees of discriminationand quantitation. Sources of interference in this method can be grouped into four broad categories:
3.2.1 Contaminated solvents, reagents, or sample processing hardware.
3.2.2 Contaminated GC carrier gas, parts, column surfaces, or detector surfaces.
3.2.3 Compounds extracted from the sample matrix to which the detectorresponds, such as single-component chlorinated pesticides, including the DDT analogs (DDT,DDE, and DDD).
NOTE: A standard of the DDT analogs should be injected to determine which of the PCB orAroclor peaks may be subject to interferences on the analytical columns used.There may be substantial DDT interference with the last major Aroclor 1254 peak insome soil and sediment samples.
3.2.4 Coelution of related analytes. All 209 PCB congeners cannot be separatedusing the GC columns and procedures described in this method. If this procedure isexpanded to encompass other congeners, then the analyst must either document theresolution of the congeners in question or establish procedures for reporting the results ofcoeluting congeners that are appropriate for the intended application.
3.3 Interferences by phthalate esters introduced during sample preparation can pose amajor problem in PCB determinations.
3.3.1 Common flexible plastics contain varying amounts of phthalate esters whichare easily extracted or leached from such materials during laboratory operations.Interferences from phthalate esters can best be minimized by avoiding contact with any plasticmaterials and checking all solvents and reagents for phthalate contamination.
3.3.2 Exhaustive cleanup of solvents, reagents and glassware may be required toeliminate background phthalate ester contamination.
3.3.3 These materials can be removed through the use of Method 3665 (sulfuricacid/permanganate cleanup).
3.4 Cross-contamination of clean glassware routinely occurs when plastics are handledduring extraction steps, especially when solvent-wetted surfaces are handled. Glassware must bescrupulously cleaned.
3.4.1 Clean all glassware as soon as possible after use by rinsing with the lastsolvent used. This should be followed by detergent washing with hot water, and rinses withtap water and organic-free reagent water. Drain the glassware, and dry it in an oven at 130EC

8082A - 5 Revision 1November 2000
for several hours, or rinse with methanol and drain. Store dry glassware in a cleanenvironment.
NOTE: Oven-drying of glassware used for PCB analysis can increase contaminationbecause PCBs are readily volatilized in the oven and spread to other glassware.Therefore, exercise caution, and do not dry glassware from samples containing highconcentrations of PCBs with glassware that may be used for trace analyses.
3.42 Other appropriate glassware cleaning procedures may be employed, suchas using a muffle furnace at 430EC for at least 30 minutes. However, analysts are advisednot to place volumetric glassware in a muffle furnace, since the heat will burn off the markingson the glassware and may warp the glassware, changing its volume.
3.5 Sulfur (S8) is readily extracted from soil samples and may cause chromatographicinterferences in the determination of PCBs. Sulfur can be removed through the use of Method 3660.
4.0 APPARATUS AND MATERIALS
4.1 Gas chromatograph - An analytical system complete with gas chromatograph suitablefor on-column and split-splitless injection and all required accessories including syringes, analyticalcolumns, gases, electron capture detectors (ECD), and recorder/integrator or data system.Electrolytic conductivity detectors (ELCDs) may also be employed if appropriate for project needs.If the dual-column option is employed, the gas chromatograph must be equipped with two separatedetectors.
4.2 GC columns
This method describes procedures for both single-column and dual-column analyses. Thesingle-column approach involves one analysis to determine that a compound is present, followedby a second analysis to confirm the identity of the compound (Sec. 7.10 describes how GC/MSconfirmation techniques may be employed). The single-column approach may employ eithernarrow-bore (# 0.32-mm ID) columns or wide-bore (0.53-mm ID) columns. The dual-columnapproach generally employs a single injection that is split between two columns that are mountedin a single gas chromatograph. The dual-column approach generally employs wide-bore (0.53-mmID) columns, but columns of other diameters may be employed if the analyst can demonstrate anddocument acceptable performance for the intended application. A third alternative is to employ dualcolumns mounted in a single GC, but with each column connected to a separate injector and aseparate detector.
The columns listed in this section were the columns used to develop the method performancedata. Listing these columns in this method is not intended to exclude the use of other columns thatmay be developed. Laboratories may use other capillary columns or columns of other dimensions,provided that they document method performance data (e.g., chromatographic resolution, analytebreakdown, and sensitivity) that meet the data quality needs of the intended application.
4.2.1 Narrow-bore columns for single-column analysis (use both columns toconfirm compound identifications unless another confirmation technique such as GC/MS isemployed). Narrow-bore columns should be installed in split/splitless (Grob-type) injectors.

8082A - 6 Revision 1November 2000
4.2.1.1 30-m x 0.25-mm or 0.32-mm ID fused-silica capillary columnchemically bonded with SE-54 (DB-5 or equivalent), 1-µm film thickness.
4.2.1.2 30-m x 0.25-mm ID fused-silica capillary column chemicallybonded with 35 percent phenyl methylpolysiloxane (DB-608, SPB-608, or equivalent),2.5 µm coating thickness, 1-µm film thickness.
4.2.2 Wide-bore columns for single-column analysis (use two of the three columnslisted to confirm compound identifications unless another confirmation technique such asGC/MS is employed). Wide-bore columns should be installed in 1/4-inch injectors, withdeactivated liners designed specifically for use with these columns.
4.2.2.1 30-m x 0.53-mm ID fused-silica capillary column chemicallybonded with 35 percent phenyl methylpolysiloxane (DB-608, SPB-608, RTx-35, orequivalent), 0.5-µm or 0.83-µm film thickness.
4.2.2.2 30-m x 0.53-mm ID fused-silica capillary column chemicallybonded with 14% cyanopropylmethylpolysiloxane (DB-1701, or equivalent), 1.0-µm filmthickness.
4.2.2.3 30-m x 0.53-mm ID fused-silica capillary column chemicallybonded with SE-54 (DB-5, SPB-5, RTx-5, or equivalent), 1.5-µm film thickness.
4.2.3 Wide-bore columns for dual-column analysis (choose one of the three pairsof columns listed below).
4.2.3.1 Column pair 1
30-m x 0.53-mm ID fused-silica capillary column chemically bonded with SE-54 (DB-5, SPB-5, RTx-5, or equivalent), 1.5-µm film thickness.
30-m x 0.53-mm ID fused-silica capillary column chemically bonded with14% cyanopropylmethylpolysiloxane (DB-1701, or equivalent), 1.0-µm film thickness.
Column pair 1 is mounted in a press-fit Y-shaped glass 3-way union splitter(J&W Scientific, Catalog No. 705-0733) or a Y-shaped fused-silica connector (Restek,Catalog No. 20405), or equivalent.
NOTE: When connecting columns to a press-fit Y-shaped connector, a better sealmay be achieved by first soaking the ends of the capillary columns in alcoholfor about 10 seconds to soften the polyimide coating.
4.2.3.2 Column pair 2
30-m x 0.53-mm ID fused-silica capillary column chemically bonded with SE-54 (DB-5, SPB-5, RTx-5, or equivalent), 0.83-µm film thickness.
30-m x 0.53-mm ID fused-silica capillary column chemically bonded with14% cyanopropylmethylpolysiloxane (DB-1701, or equivalent), 1.0-µm film thickness.
8082A - 7 Revision 1November 2000
Column pair 2 is mounted in an 8-in. deactivated glass injection tee (Supelco,Catalog No. 2-3665M), or equivalent.
4.2.3.3 Column pair 3
30-m x 0.53-mm ID fused-silica capillary column chemically bonded with SE-54 (DB-5, SPB-5, RTx-5, or equivalent), 1.5-µm film thickness.
30-m x 0.53-mm ID fused-silica capillary column chemically bonded with 35percent phenyl methylpolysiloxane (HP-608, DB-608, SPB-608, RTx-35, or equivalent),0.5-µm film thickness.
Column pair 3 is mounted in separate injectors and separate detectors.
4.3 Column rinsing kit - Bonded-phase column rinse kit (J&W Scientific, Catalog No. 430-3000), or equivalent.
4.4 Volumetric flasks - 10-mL and 25-mL, for preparation of standards.
5.0 REAGENTS
5.1 Reagent grade or pesticide grade chemicals shall be used in all tests. Unlessotherwise indicated, all reagents shall conform to specifications of the Committee on AnalyticalReagents of the American Chemical Society, where such specifications are available. Other gradesmay be used, provided it is first ascertained that the reagent is of sufficiently high purity to permitits use without lessening the accuracy of the determination.
NOTE: Store the standard solutions (stock, composite, calibration, internal, and surrogatestandards) at 4EC in polytetrafluoroethylene (PTFE)-sealed containers in the dark. Whena lot of standards is prepared, it is recommended that aliquots of that lot be stored inindividual small vials. All stock standard solutions must be replaced after one year, orsooner if routine QC (Sec. 8.0) indicates a problem. All other standard solutions must bereplaced after six months, or sooner if routine QC (Sec. 8.0) indicates a problem.
5.2 Solvents used in the extraction and cleanup procedures (appropriate 3500 and 3600series methods) include n-hexane, diethyl ether, methylene chloride, acetone, ethyl acetate, andisooctane (2,2,4-trimethylpentane) and they must be exchanged to n-hexane or isooctane prior toanalysis. Therefore, n-hexane and isooctane will be required in this procedure. All solvents shouldbe pesticide quality or equivalent, and each lot of solvent should be determined to be free ofphthalates.
5.3 The following solvents may be necessary for the preparation of standards. All solventlots must be pesticide quality or equivalent and should be determined to be free of phthalates.
5.3.1 Acetone, (CH3)2CO
5.3.2 Toluene, C6H5CH3

8082A - 8 Revision 1November 2000
5.4 Organic-free reagent water - All references to water in this method refer to organic-free reagent water as defined in Chapter One.
5.5 Stock standard solutions (1000 mg/L) - May be prepared from pure standard materialsor can be purchased as certified solutions.
5.5.1 Prepare stock standard solutions by accurately weighing 0.0100 g of purecompound. Dissolve the compound in isooctane or hexane and dilute to volume in a 10-mLvolumetric flask. If compound purity is 96 percent or greater, the weight may be used withoutcorrection to calculate the concentration of the stock standard solution.
5.5.2 Commercially-prepared stock standard solutions may be used at anyconcentration if they are certified by the manufacturer or by an independent source.
5.6 Calibration standards for Aroclors
5.6.1 A standard containing a mixture of Aroclor 1016 and Aroclor 1260 will includemany of the peaks represented in the other five Aroclor mixtures. As a result, a multi-pointinitial calibration employing a mixture of Aroclors 1016 and 1260 at five concentrations shouldbe sufficient to demonstrate the linearity of the detector response without the necessity ofperforming multi-point initial calibrations for each of the seven Aroclors. In addition, such amixture can be used as a standard to demonstrate that a sample does not contain peaks thatrepresent any one of the Aroclors. This standard can also be used to determine theconcentrations of either Aroclor 1016 or Aroclor 1260, should they be present in a sample.
Prepare a minimum of five calibration standards containing equal concentrations ofboth Aroclor 1016 and Aroclor 1260 by dilution of the stock standard with isooctane or hexane.The concentrations should correspond to the expected range of concentrations found in realsamples and should bracket the linear range of the detector.
5.6.2 Single standards of each of the other five Aroclors are required to aid theanalyst in pattern recognition. Assuming that the Aroclor 1016/1260 standards described inSec. 5.6.1 have been used to demonstrate the linearity of the detector, these single standardsof the remaining five Aroclors also may be used to determine the calibration factor for eachAroclor when a linear calibration model through the origin is chosen (see Sec. 7.4). Preparea standard for each of the other Aroclors. The concentrations should generally correspondto the mid-point of the linear range of the detector, but lower concentrations may be employedat the discretion of the analyst.
5.6.3 Other standards (e.g., other Aroclors) and other calibration approaches (e.g.,non-linear calibration for individual Aroclors) may be employed to meet project needs. Whenthe nature of the PCB contamination is already known, use standards of those particularAroclors. See Method 8000 for information on non-linear calibration approaches.
5.7 Calibration standards for PCB congeners
5.7.1 If results are to be determined for individual PCB congeners, then standardsfor the pure congeners must be prepared. The table in Sec. 1.1 lists 19 PCB congeners thathave been tested by this method along with the IUPAC numbers designating these congeners.This procedure may be appropriate for other congeners as well, but the analyst must either

8082A - 9 Revision 1November 2000
document the resolution of the congeners in question or establish procedures for reportingthe results of coeluting congeners that are appropriate for the intended application.
5.7.2 Stock standards may be prepared in a fashion similar to that described forthe Aroclor standards, or may be purchased as commercially-prepared solutions. Stockstandards should be used to prepare a minimum of five concentrations by dilution of the stockstandard with isooctane or hexane. The concentrations should correspond to the expectedrange of concentrations found in real samples and should bracket the linear range of thedetector.
5.8 Internal standard
5.8.1 When PCB congeners are to be determined, the use of an internal standardis highly recommended. Decachlorobiphenyl may be used as an internal standard, added toeach sample extract prior to analysis, and included in each of the initial calibration standards.
5.8.2 When PCBs are to be determined as Aroclors, an internal standard istypically not used, and decachlorobiphenyl is employed as a surrogate (see Sec. 5.9).
5.8.3 When decachlorobiphenyl is an analyte of interest, as in some PCB congeneranalyses, see Sec. 5.9.3.
5.9 Surrogate standards
The performance of the method should be monitored using surrogate compounds. Surrogatestandards are added to all samples, method blanks, matrix spikes, and calibration standards. Thechoice of surrogate compounds will depend on analysis mode chosen, e.g., Aroclors or congeners.The following compounds are recommended as surrogates. Other surrogates may be used,provided that the analyst can demonstrate and document performance appropriate for the dataquality needs of the particular application.
5.9.1 When PCBs are to be determined as Aroclors, decachlorobiphenyl may beused as a surrogate, and is added to each sample prior to extraction. Prepare a solution ofdecachlorobiphenyl in acetone. The recommended spiking solution concentration is 5 mg/L.Tetrachloro-m-xylene also may be used as a surrogate for Aroclor analysis. If used, therecommended spiking solution concentration is 5 mg/L in acetone. (Other surrogateconcentrations may be used, as appropriate for the intended application.)
5.9.2 When PCB congeners are to be determined, decachlorobiphenyl isrecommended for use as an internal standard, and therefore it cannot also be used as asurrogate. Tetrachloro-m-xylene may be used as a surrogate for PCB congener analysis.The recommended spiking solution concentration is 5 mg/L in acetone. (Other surrogateconcentrations may be used, as appropriate for the intended application.)
5.9.3 If decachlorobiphenyl is a target congener for the analysis, 2,2',4,4',5,5'-hexabromobiphenyl may be used as an internal standard or a surrogate.
5.10 DDT analog standard - Used to determine if the commonly found DDT analogs (DDT,DDE, and DDD) elute at the same retention times as any of the target analytes (congeners or
8082A - 10 Revision 1November 2000
Aroclors). A single standard containing all three compounds should be sufficient. The concentrationof the standard is left to the judgement of the analyst.
6.0 SAMPLE COLLECTION, PRESERVATION, AND HANDLING
6.1 See Chapter Four, Organic Analytes, Sec. 4.1, for sample collection and preservationinstructions.
6.2 Extracts should be stored under refrigeration in the dark and should be analyzed within40 days of extraction.
NOTE: The holding time above is a recommendation. PCBs are very stable in a variety ofmatrices, and holding times under the conditions listed above may be as high as a year.
7.0 PROCEDURE
7.1 Sample extraction
7.1.1 Refer to Chapter Two and Method 3500 for guidance in choosing theappropriate extraction procedure. In general, water samples are extracted at a neutral pH withmethylene chloride using a separatory funnel (Method 3510), a continuous liquid-liquidextractor (Method 3520), solid-phase extraction (Method 3535), or other appropriate technique.Solid samples are extracted with hexane-acetone (1:1) or methylene chloride-acetone (1:1)using one of the Soxhlet extraction methods (Method 3540 or 3541), pressurized fluidextraction (Method 3545), microwave extraction (Method 3546), ultrasonic extraction (Method3550), supercritical fluid extraction (Method 3562), or other appropriate technique or solvents.Tissue samples are extracted using supercritical fluid extraction (Method 3562) or otherappropriate technique.
NOTE: Use of hexane-acetone generally reduces the amount of interferences that areextracted and improves signal-to-noise.
The choice of extraction solvent will depend on the analytes of interest. No singlesolvent is universally applicable to all analyte groups. The analyst must demonstrate adequateperformance for the analytes of interest, at the levels of interest, for any solvent systememployed, including those specifically listed in this method. At a minimum, such ademonstration will encompass the initial demonstration of proficiency described in Sec. 8.2of Method 3500, using a clean reference matrix. Each new sample type must be spiked withthe compounds of interest to determine the percent recovery. Method 8000 describesprocedures that may be used to develop performance criteria for such demonstrations as wellas for matrix spike and laboratory control sample results.
7.1.2 Reference materials, field-contaminated samples, or spiked samples shouldbe used to verify the applicability of the selected extraction technique to each new sampletype. Such samples should contain or be spiked with the compounds of interest in order todetermine the percent recovery and the limit of detection for that sample type (see ChapterOne). When other materials are not available and spiked samples are used, they should bespiked with the analytes of interest, either specific Aroclors or PCB congeners. When the
8082A - 11 Revision 1November 2000
presence of specific Aroclors is not anticipated, the Aroclor 1016/1260 mixture may be anappropriate choice for spiking. See Methods 3500 and 8000 for guidance on demonstrationof initial method proficiency as well as guidance on matrix spikes for routine sample analysis.
7.1.3 The extraction techniques for solids may be applicable to wipe samples andother sample matrices not addressed in Sec. 7.1.1. The analysis of oil samples may requirespecial sample preparation procedures that are not described here. Analysts should followthe steps described in Sec. 7.1.2 to verify the applicability of the sample preparation andextraction techniques for matrices such as wipes and oils.
7.2 Extract cleanup
Cleanup procedures may not be necessary for a relatively clean sample matrix, but mostextracts from environmental and waste samples will require additional preparation before analysis.The specific cleanup procedure used will depend on the nature of the sample to be analyzed andthe data quality objectives for the measurements. Refer to Methods 3660 and 3665 for informationon extract cleanup.
7.3 GC conditions
This method allows the analyst to choose between a single-column or a dual-columnconfiguration in the injector port. The columns listed in this section were the columns used todevelop the method performance data. Listing these columns in this method is not intended toexclude the use of other columns that may be developed. Wide-bore or narrow-bore columns maybe used with either option. Laboratories may use other capillary columns or columns of otherdimensions, provided that they document method performance data (e.g., chromatographicresolution, analyte breakdown, and sensitivity) that meet the data quality needs of the intendedapplication.
7.3.1 Single-column analysis
This capillary GC/ECD method allows the analyst the option of using 0.25-mm or 0.32-mm ID capillary columns (narrow-bore) or 0.53-mm ID capillary columns (wide-bore).Narrow-bore columns generally provided greater chromatographic resolution than wide-borecolumns, although narrow-bore columns have a lower sample capacity. As a result, narrow-bore columns may be more suitable for relatively clean samples or for extracts that have beenprepared with one or more of the clean-up options referenced in the method. Wide-borecolumns (0.53-mm ID) may be more suitable for more complex environmental and wastematrices. However, the choice of the appropriate column diameter is left to the analyst.
7.3.2 Dual-column analysis
The dual-column/dual-detector approach recommends the use of two 30-m x 0.53-mmID fused-silica open-tubular columns of different polarities, thus, different selectivities towardsthe target analytes. The columns may be connected to an injection tee and separate electroncapture detectors, or to both separate injectors and separate detectors. However, the choiceof the appropriate column dimensions is left to the analyst.

8082A - 12 Revision 1November 2000
7.3.3 GC temperature programs and flow rates
7.3.3.1 Table 2 lists suggested GC operating conditions for the analysisof PCBs as Aroclors for single-column analysis, using either narrow-bore or wide-borecapillary columns. Table 3 lists suggested GC operating conditions for the dual-column analysis. Use the conditions in these tables as guidance and establish the GCtemperature program and flow rate necessary to separate the analytes of interest.
7.3.3.2 When determining PCBs as congeners, difficulties may beencountered with coelution of congener 153 and other sample components. Whendetermining PCBs as Aroclors, chromatographic conditions should be adjusted to giveadequate separation of the characteristic peaks in each Aroclor (see Sec. 7.4.6).
7.3.3.3 Tables 4 and 5 summarize example retention times of up to 73Aroclor peaks determined during dual-column analysis using the operating conditionslisted in Table 3. These retention times are provided as guidance as to what may beachieved using the GC columns, temperature programs, and flow rates described inthis method. Note that the peak numbers used in these tables are not the IUPACcongener numbers, but represent the elution order of the peaks on these GC columns.
7.3.3.4 Once established, the same operating conditions must be usedfor the analysis of samples and standards.
7.4 Calibration
7.4.1 Prepare calibration standards as described in Sec. 5.0. Refer to Method8000 (Sec. 7.0) for proper calibration techniques for both initial calibration and calibrationverification. When PCBs are to be determined as congeners, the use of internal standardcalibration is highly recommended. Therefore, the calibration standards must contain theinternal standard (see Sec. 5.8) at the same concentration as the sample extracts. WhenPCBs are to be determined as Aroclors, external standard calibration is generally used.
NOTE: Because of the sensitivity of the electron capture detector, the injection port andcolumn should always be cleaned prior to performing the initial calibration.
7.4.2 When PCBs are to be quantitatively determined as congeners, an initialmulti-point calibration must be performed that includes standards for all the target analytes(congeners). See Method 8000 for details on calibration options.
7.4.3 When PCBs are to be quantitatively determined as Aroclors, the initialcalibration consists of two parts, described below.
7.4.3.1 As noted in Sec. 5.6.1, a standard containing a mixture of Aroclor1016 and Aroclor 1260 will include many of the peaks represented in the other fiveAroclor mixtures. Thus, such a standard may be used to demonstrate the linearity ofthe detector and that a sample does not contain peaks that represent any one of theAroclors. This standard can also be used to determine the concentrations of eitherAroclor 1016 or Aroclor 1260, should they be present in a sample. Therefore, an initialmulti-point calibration is performed using the mixture of Aroclors 1016 and 1260

8082A - 13 Revision 1November 2000
described in Sec. 5.6.1. See Sec. 7.0 of Method 8000 for guidance on the use of linearand non-linear calibrations.
7.4.3.2 Standards of the other five Aroclors are necessary for patternrecognition. When employing the traditional model of a linear calibration through theorigin, these standards are also used to determine a single-point calibration factor foreach Aroclor, assuming that the Aroclor 1016/1260 mixture in Sec. 7.4.3.1 has beenused to describe the detector response. The standards for these five Aroclors shouldbe analyzed before the analysis of any samples, and may be analyzed before or afterthe analysis of the five 1016/1260 standards in Sec. 7.4.3.1. For non-linearcalibrations, see Sec. 7.4.3.3.
7.4.3.3 In situations where only a few Aroclors are of interest for a specificproject, the analyst may employ a multi-point initial calibration of each of the Aroclorsof interest (e.g., five standards of Aroclor 1232 if this Aroclor is of concern and linearcalibration is employed) and not use the 1016/1260 mixture described in Sec. 7.4.3.1or the pattern recognition standards described in 7.4.3.2. When non-linear calibrationmodels are employed, more than five standards of each Aroclor of interest will beneeded to adequately describe the detector response (see Method 8000).
7.4.4 Establish the GC operating conditions appropriate for the configuration(single-column or dual column, Sec. 7.3). Optimize the instrumental conditions for resolutionof the target compounds and sensitivity. A final temperature of 240-275EC may be requiredto elute decachlorobiphenyl. The use of injector pressure programming will improve thechromatography of late eluting peaks.
NOTE: Once established, the same operating conditions must be used for both calibrationsand sample analyses.
7.4.5 A 2-µL injection of each calibration standard is recommended. Other injectionvolumes may be employed, provided that the analyst can demonstrate adequate sensitivityfor the compounds of interest.
7.4.6 Record the peak area (or height) for each congener or each characteristicAroclor peak to be used for quantitation.
7.4.6.1 A minimum of 3 peaks must be chosen for each Aroclor, andpreferably 5 peaks. The peaks must be characteristic of the Aroclor in question.Choose peaks in the Aroclor standards that are at least 25% of the height of the largestAroclor peak. For each Aroclor, the set of 3 to 5 peaks should include at least onepeak that is unique to that Aroclor. Use at least five peaks for the Aroclor 1016/1260mixture, none of which should be found in both of these Aroclors.
7.4.6.2 Late-eluting Aroclor peaks are generally the most stable in theenvironment. Table 6 lists diagnostic peaks in each Aroclor, along with exampleretention times on two GC columns suitable for single-column analysis. Table 7 lists13 specific PCB congeners found in Aroclor mixtures. Table 8 lists PCB congenerswith example retention times on a DB-5 wide-bore GC column. Use these tables asguidance in choosing the appropriate peaks.

8082A - 14 Revision 1November 2000
RF 'As × Cis
Ais × Cs
CF 'Peak Area (or Height) in the Standard
Total Mass of the Standard Injected (in nanograms)
7.4.7 When determining PCB congeners by the internal standard procedure,calculate the response factor (RF) for each congener in the calibration standards relative tothe internal standard, decachlorobiphenyl, using the equation that follows.
where:
As = Peak area (or height) of the analyte or surrogate.Ais = Peak area (or height) of the internal standard.Cs = Concentration of the analyte or surrogate, in µg/L.Cis = Concentration of the internal standard, in µg/L.
7.4.8 When determining PCBs as Aroclors by the external standard technique,calculate the calibration factor (CF) for each characteristic Aroclor peak in each of the initialcalibration standards (from either Sec. 7.4.3.1 or 7.4.3.2) using the equation below.
Using the equation above, a calibration factor will be determined for each characteristic peak,using the total mass of the Aroclor injected. These individual calibration factors are used toquantitate sample results by applying the factor for each individual peak to the area of thatpeak, as described in Sec. 7.9.
For a five-point calibration, five sets of calibration factors will be generated for theAroclor 1016/1260 mixture, each set consisting of the calibration factors for each of the five(or more) peaks chosen for this mixture, e.g., there will be at least 25 separate calibrationfactors for the mixture. The single standard for each of the other Aroclors (see Sec. 7.4.3.1)will generate at least three calibration factors, one for each selected peak.
If a non-linear calibration model is employed, as described in Method 8000, thenadditional standards containing each Aroclor of interest will be employed, with a correspondingincrease in the total number of calibration factors.
7.4.9 The response factors or calibration factors from the initial calibration are usedto evaluate the linearity of the initial calibration, if a linear calibration model is used. Thisinvolves the calculation of the mean response or calibration factor, the standard deviation, andthe relative standard deviation (RSD) for each congener or Aroclor peak.
When the Aroclor 1016/1260 mixture is used to demonstrate the detector response,the linear calibration models must be applied to the other five Aroclors for which only singlestandards are analyzed. If multi-point calibration is performed for individual Aroclors (see Sec.7.4.3.3), use the calibration factors from those standards to evaluate linearity.

8082A - 15 Revision 1November 2000
See Method 8000 for the specifics of the evaluation of the linearity of the calibration andguidance on performing non-linear calibrations. In general, non-linear calibrations also willconsider each characteristic Aroclor peak separately.
7.5 Retention time windows
Absolute retention times are generally used for compound identification. When absoluteretention times are used, retention time windows are crucial to the identification of targetcompounds, and should be established by one of the approaches described in Method 8000.Retention time windows are established to compensate for minor shifts in absolute retention timesas a result of sample loadings and normal chromatographic variability. The width of the retentiontime window should be carefully established to minimize the occurrence of both false positive andfalse negative results. Tight retention time windows may result in false negatives and/or may causeunnecessary reanalysis of samples when surrogates or spiked compounds are erroneously notidentified. Overly wide retention time windows may result in false positive results that cannot beconfirmed upon further analysis. Analysts should consult Method 8000 for the details of establishingretention time windows. Other approaches to compound identification may be employed, providedthat the analyst can demonstrate and document that they are appropriate for the intendedapplication. When PCBs are determined as congeners by an internal standard technique, absoluteretention times may be used in conjunction with relative retention times (relative to the internalstandard).
When conducting either Aroclor or congener analysis, it is important to determine thatcommon single-component pesticides such as DDT, DDD, and DDE do not elute at the sameretention times as the target congeners. There may be substantial DDT interference with the lastmajor Aroclor 1254 peak in some soil and sediment samples. Therefore, in conjunction withdetermining the retention time windows of the congeners, the analyst should analyze a standardcontaining the DDT analogs. This standard need only be analyzed when the retention time windowsare determined. It is not considered part of the routine initial calibration or calibration verificationsteps in the method, nor are there any performance criteria associated with the analysis of thisstandard.
If Aroclor analysis is performed and any of the DDT analogs elute at the same retention timeas an Aroclor peak that was chosen for use in quantitation (see Sec. 7.4.6), then the analyst musteither adjust the GC conditions to achieve better resolution, or choose another peak that ischaracteristic of that Aroclor and does not correspond to a peak from a DDT analog. If PCBcongener analysis is performed and any of the DDT analogs elute at the same retention time as aPCB congener of interest, then the analyst must adjust the GC conditions to achieve betterresolution.
7.6 Gas chromatographic analysis of sample extracts
7.6.1 The same GC operating conditions used for the initial calibration must beemployed for the analysis of samples.
7.6.2 Verify calibration at least once each 12-hour shift by injecting calibrationverification standards prior to conducting any sample analyses. A calibration standard mustalso be injected at intervals of not less than once every twenty samples (after every 10samples is recommended to minimize the number of samples requiring reinjection when QClimits are exceeded) and at the end of the analysis sequence. For Aroclor analyses, the

8082A - 16 Revision 1November 2000
% Difference 'CF & CFv
CF× 100
% Difference 'RF & RFv
RF× 100
calibration verification standard should be a mixture of Aroclor 1016 and Aroclor 1260. Thecalibration verification process does not require analysis of the other Aroclor standards usedfor pattern recognition, but the analyst may wish to include a standard for one of theseAroclors after the 1016/1260 mixture used for calibration verification throughout the analyticalsequence.
7.6.2.1 The calibration factor for each analyte calculated from thecalibration verification standard (CFv ) must not exceed a difference of more than ± 15percent when compared to the mean calibration factor from the initial calibration curve.If a calibration approach other than the RSD method has been employed for the initialcalibration (e.g., a linear model not through the origin, a non-linear calibration model,etc.), consult Sec. 7 of Method 8000 for the specifics of calibration verification.
7.6.2.2 When internal standard calibration is used for PCB congeners,the response factor calculated from the calibration verification standard (RFv ) must notexceed a ± 15 percent difference when compared to the mean response factor fromthe initial calibration. If a calibration approach other than the RSD method has beenemployed for the initial calibration (e.g., a linear model not through the origin, a non-linear calibration model, etc.), consult Sec. 7 of Method 8000 for the specifics ofcalibration verification.
7.6.2.3 If this criterion is exceeded for any calibration factor or responsefactor, use the approach described in Sec. 7 of Method 8000 to calculate the averagepercent difference across all analytes. If the average of the responses for all analytesis within ±15%, then the calibration has been verified. However, the conditions in Sec.7 of Method 8000 also apply, e.g., the average must include all analytes in thecalibration, regardless of whether they are target analytes for a specific project, andthe data user must be provided with the calibration verification data or a list of thoseanalytes that exceeded the ±15% limit.
7.6.2.4 If the calibration does not meet the ±15% limit (either on the basisof each compound or the average across all compounds), check the instrumentoperating conditions, and if necessary, restore them to the original settings, and injectanother aliquot of the calibration verification standard. If the response for the analyteis still not within ±15%, then a new initial calibration must be prepared. The effects ofa failing calibration verification standard on sample results are discussed in Sec. 7.6.6.
7.6.3 Inject a measured aliquot of the concentrated sample extract. A 2-µL aliquotis suggested, however the same injection volume must be used for both the calibrationstandards and the sample extracts. Record the volume injected and the resulting peak sizein area units.

8082A - 17 Revision 1November 2000
7.6.4 Qualitative identifications of target analytes are made by examination of thesample chromatograms, as described in Sec. 7.7.
7.6.5 Quantitative results are determined for each identified analyte (Aroclors orcongeners), using the procedures described in Secs. 7.8 and 7.9 for either the internal or theexternal calibration procedure (Method 8000). If the responses in the sample chromatogramexceed the calibration range of the system, dilute the extract and reanalyze. Peak heightmeasurements are recommended over peak area when overlapping peaks cause errors inarea integration.
7.6.6 Each sample analysis employing external standard calibration must bebracketed with an acceptable initial calibration, calibration verification standard(s) (each 12-hour analytical shift), or calibration standards interspersed within the samples. The resultsfrom these bracketing standards must meet the calibration verification criteria in Sec. 7.6.2.
Multi-level standards (mixtures or multi-component analytes) are highly recommendedto ensure that detector response remains stable for all analytes over the calibration range.
When a calibration verification standard fails to meet the QC criteria, all samples thatwere injected after the last standard that met the QC criteria must be evaluated to preventmisquantitations and possible false negative results, and reinjection of the sample extractsmay be required. More frequent analyses of standards will minimize the number of sampleextracts that would have to be reinjected if the QC limits are violated for the standard analysis.
However, if the standard analyzed after a group of samples exhibits a response for ananalyte that is above the acceptance limit, i.e., >15%, and the analyte was not detected in thespecific samples analyzed during the analytical shift, then the extracts for those samples donot need to be reanalyzed, since the verification standard has demonstrated that the analytewould have been detected if it were present. In contrast, if an analyte above the QC limits wasdetected in a sample extract, then reinjection is necessary to ensure accurate quantitation.
If an analyte was not detected in the sample and the standard response is more than15% below the initial calibration response, then reinjection is necessary. The purpose of thisreinjection is to ensure that the analyte could be detected, if present, despite the change in thedetector response, e.g., to protect against a false negative result.
7.6.7 Sample injections may continue for as long as the calibration verificationstandards and standards interspersed with the samples meet instrument QC requirements.It is recommended that standards be analyzed after every 10 samples (required after every20 samples and at the end of a set) to minimize the number of samples that must be re-injected when the standards fail the QC limits. The sequence ends when the set of sampleshas been injected or when qualitative or quantitative QC criteria are exceeded.
7.6.8 The use of internal standard calibration techniques does not require that allsample results be bracketed with calibration verification standards. However, when internalstandard calibration is used, the retention times of the internal standards and the arearesponses of the internal standards should be checked for each analysis. Retention timeshifts of more than 30 seconds from the retention time of the most recent calibration standardand/or changes in internal standard areas of more than -50 to +100% are cause for concernand must be investigated.
8082A - 18 Revision 1November 2000
7.6.9 If the peak response is less than 2.5 times the baseline noise level, the validityof the quantitative result may be questionable. The analyst should consult with the source ofthe sample to determine whether further concentration of the sample is warranted.
7.6.10 Use the calibration standards analyzed during the sequence to evaluateretention time stability. If any of the standards fall outside their daily retention time windows,the system is out of control. Determine the cause of the problem and correct it.
7.6.11 If compound identification or quantitation is precluded due to interferences(e.g., broad, rounded peaks or ill-defined baselines are present), corrective action iswarranted. Cleanup of the extract or replacement of the capillary column or detector may benecessary. The analyst may begin by rerunning the sample on another instrument todetermine if the problem results from analytical hardware or the sample matrix. Refer toMethod 3600 for the procedures to be followed in sample cleanup.
7.7 Qualitative identification
The identification of PCBs as either Aroclors or congeners using this method with an electroncapture detector is based on agreement between the retention times of peaks in the samplechromatogram with the retention time windows established through the analysis of standards of thetarget analytes. See Method 8000 for information on the establishment of retention time windows.
Tentative identification of an analyte occurs when a peak from a sample extract falls within theestablished retention time window for a specific target analyte. Confirmation is necessary when thesample composition is not well characterized. See Method 8000 for information on confirmation oftentative identifications. See Sec. 7.10 of this procedure for information on the use of GC/MS as aconfirmation technique.
When results are confirmed using a second GC column of dissimilar stationary phase, theanalyst should check the agreement between the quantitative results on both columns once theidentification has been confirmed. See Sec. 7 of Method 8000 for a discussion of such acomparison and appropriate data reporting approaches.
7.7.1 When simultaneous analyses are performed from a single injection (the dual-column GC configuration described in Sec. 7.3), it is not practical to designate one column asthe analytical (primary) column and the other as the confirmation column. Since thecalibration standards are analyzed on both columns, both columns must meet the calibrationacceptance criteria. If the retention times of the peaks on both columns fall within the retentiontime windows on the respective columns, then the target analyte identification has beenconfirmed.
7.7.2 The results of a single column/single injection analysis may be confirmed,if necessary, on a second, dissimilar, GC column. In order to be used for confirmation,retention time windows must have been established for the second GC column. In addition,the analyst must demonstrate the sensitivity of the second column analysis. Thisdemonstration must include the analysis of a standard of the target analyte at a concentrationat least as low as the concentration estimated from the primary analysis. That standard maybe either the individual congeners, individual Aroclor or the Aroclor 1016/1260 mixture.

8082A - 19 Revision 1November 2000
7.7.3 When samples are analyzed from a source known to contain specificAroclors, the results from a single-column analysis may be confirmed on the basis of a clearlyrecognizable Aroclor pattern. This approach should not be attempted for samples fromunknown or unfamiliar sources or for samples that appear to contain mixtures of Aroclors. Inorder to employ this approach, the analyst must document:
• The peaks that were evaluated when comparing the sample chromatogram and theAroclor standard.
• The absence of major peaks representing any other Aroclor.
• The source-specific information indicating that Aroclors are anticipated in the sample(e.g., historical data, generator knowledge, etc.).
This information should either be provided to the data user or maintained by the laboratory.
7.7.4 See Sec. 7.10 for information on GC/MS confirmation.
7.8 Quantitation of PCBs as congeners
7.8.1 The quantitation of PCB congeners is accomplished by the comparison ofthe sample chromatogram to those of the PCB congener standards, using the internalstandard technique (see Method 8000). Calculate the concentration of each congener.
7.8.2 Depending on project requirements, the PCB congener results may bereported as congeners, or may be summed and reported as total PCBs. The analyst shoulduse caution when using the congener method for quantitation when regulatory requirementsare based on Aroclor concentrations. See Sec. 7.9.3.
7.8.3 The analytical procedures for these 19 congeners may be appropriate for theanalysis of other congeners not specifically included in this method and may be used as atemplate for the development of such a procedure. However, all 209 PCB congeners cannotbe separated using the GC columns and procedures described in this method. If thisprocedure is expanded to encompass other congeners, then the analyst must eitherdocument the resolution of the congeners in question or establish procedures for reportingthe results of coeluting congeners that are appropriate for the intended application.
7.9 Quantitation of PCBs as Aroclors
The quantitation of PCB residues as Aroclors is accomplished by comparison of the samplechromatogram to that of the most similar Aroclor standard. A choice must be made as to whichAroclor is most similar to that of the residue and whether that standard is truly representative of thePCBs in the sample.
7.9.1 Use the individual Aroclor standards (not the 1016/1260 mixtures) todetermine the pattern of peaks on Aroclors 1221, 1232, 1242, 1248, and 1254. The patternsfor Aroclors 1016 and 1260 will be evident in the mixed calibration standards.
7.9.2 Once the Aroclor pattern has been identified, compare the responses of 3 to5 major peaks in the single-point calibration standard for that Aroclor with the peaks observed

8082A - 20 Revision 1November 2000
in the sample extract. The amount of Aroclor is calculated using the individual calibrationfactor for each of the 3 to 5 characteristic peaks chosen in Sec. 7.4.6.1. and the calibrationmodel (linear or non-linear) established from the multi-point calibration of the 1016/1260mixture. Non-linear calibration may result in different models for each selected peak. Aconcentration is determined using each of the characteristic peaks, using the individualcalibration factor calculated for that peak in Sec. 7.4.8, and then those 3 to 5 concentrationsare averaged to determine the concentration of that Aroclor.
7.9.3 Weathering of PCBs in the environment and changes resulting from wastetreatment processes may alter the PCBs to the point that the pattern of a specific Aroclor isno longer recognizable. Samples containing more than one Aroclor present similar problems.If the purpose of the analysis is not regulatory compliance monitoring on the basis of Aroclorconcentrations, then it may be more appropriate to perform the analyses using the PCBcongener approach described in this method. If results in terms of Aroclors are required, thenthe quantitation as Aroclors may be performed by measuring the total area of the PCB patternand quantitating on the basis of the Aroclor standard that is most similar to the sample. Anypeaks that are not identifiable as PCBs on the basis of retention times should be subtractedfrom the total area. When quantitation is performed in this manner, the problems should befully described for the data user and the specific procedures employed by the analyst shouldbe thoroughly documented.
7.10 GC/MS confirmation may be used in conjunction with either single-or dual-columnanalysis if the concentration is sufficient for detection by GC/MS.
7.10.1 Full-scan quadrupole GC/MS will normally require a higher concentration ofthe analyte of interest than full-scan ion trap or selected ion monitoring techniques. Theconcentrations will be instrument-dependent, but values for full-scan quadrupole GC/MS maybe as high as 10 ng/µL in the final extract, while ion trap or SIM may only require aconcentration of 1 ng/µL.
7.10.2 The GC/MS must be calibrated for the target analytes when it is used forquantitative analysis. If GC/MS is used only for confirmation of the identification of the targetanalytes, then the analyst must demonstrate that those PCBs identified by GC/ECD can beconfirmed by GC/MS. This demonstration may be accomplished by analyzing a single-pointstandard containing the analytes of interest at or below the concentrations reported in theGC/EC analysis. When using SIM techniques, the ions and retention times should becharacteristic of the Aroclors to be confirmed.
7.10.3 GC/MS confirmation should be accomplished by analyzing the same extractused for GC/ECD analysis and the extract of the associated blank.
7.11 Chromatographic system maintenance as corrective action
When system performance does not meet the established QC requirements, corrective actionis required, and may include one or more of the following.
7.11.1 Splitter connections
For dual columns which are connected using a press-fit Y-shaped glass splitter or aY-shaped fused-silica connector, clean and deactivate the splitter port insert or replace with
8082A - 21 Revision 1November 2000
a cleaned and deactivated splitter. Break off the first few inches (up to one foot) of theinjection port side of the column. Remove the columns and solvent backflush according tothe manufacturer's instructions. If these procedures fail to eliminate the degradation problem,it may be necessary to deactivate the metal injector body and/or replace the columns.
7.11.2 Metal injector body
Turn off the oven and remove the analytical columns when the oven has cooled.Remove the glass injection port insert (instruments with on-column injection). Lower theinjection port temperature to room temperature. Inspect the injection port and remove anynoticeable foreign material.
7.11.2.1 Place a beaker beneath the injector port inside the oven. Usinga wash bottle, rinse the entire inside of the injector port with acetone and then rinse itwith toluene, catching the rinsate in the beaker.
7.11.2.2 Consult the manufacturer's instructions regarding deactivating theinjector port body. Glass injection port liners may require deactivation with a silanizingsolution containing dimethyldichlorosilane.
7.11.3 Column rinsing
The column should be rinsed with several column volumes of an appropriate solvent.Both polar and nonpolar solvents are recommended. Depending on the nature of the sampleresidues expected, the first rinse might be water, followed by methanol and acetone.Methylene chloride is a good final rinse and in some cases may be the only solvent required.The column should then be filled with methylene chloride and allowed to stand floodedovernight to allow materials within the stationary phase to migrate into the solvent. Thecolumn is then flushed with fresh methylene chloride, drained, and dried at room temperaturewith a stream of ultrapure nitrogen.
8.0 QUALITY CONTROL
8.1 Refer to Chapter One and Method 8000 for specific quality control (QC) procedures.Quality control procedures to ensure the proper operation of the various sample preparationtechniques can be found in Method 3500. If an extract cleanup procedure was performed, refer toMethod 3600 for the appropriate quality control procedures. Each laboratory should maintain aformal quality assurance program. The laboratory should also maintain records to document thequality of the data generated.
8.2 Quality control procedures necessary to evaluate the GC system operation are foundin Method 8000, Sec. 7.0 and include evaluation of retention time windows, calibration verificationand chromatographic analysis of samples.
8.2.1 Include a calibration standard after each group of 20 samples (it isrecommended that a calibration standard be included after every 10 samples to minimize thenumber of repeat injections) in the analysis sequence as a calibration check. The responsefactors for the calibration should be within 15 percent of the initial calibration. When this

8082A - 22 Revision 1November 2000
continuing calibration is out of this acceptance window, the laboratory should stop analysesand take corrective action.
8.2.2 Whenever quantitation is accomplished using an internal standard, internalstandard responses must be evaluated for acceptance. The measured area of the internalstandard must be no more than 50 percent different from the average area calculated duringcalibration. When the internal standard peak area is outside the limit, all samples that falloutside the QC criteria must be reanalyzed.
8.3 Initial demonstration of proficiency
8.3.1 Each laboratory must demonstrate initial proficiency with each samplepreparation and determinative method combination it utilizes, by generating data of acceptableaccuracy and precision for target analytes in a clean matrix. The laboratory must also repeatthe following operations whenever new staff are trained or significant changes ininstrumentation are made. See Method 8000, Sec. 8.0, for information on how to accomplishthis demonstration.
8.3.2 The QC Reference Sample concentrate (Method 3500) should contain PCBsas Aroclors at 10-50 mg/L in the concentrate for water samples, or PCBs as congeners at thesame concentrations. A 1-mL volume of this concentrate spiked into 1 L of reagent water willresult in a sample concentration of 10-50 µg/L. If Aroclors are not expected in samples froma particular source, then prepare the QC reference samples with a mixture of Aroclors 1016and 1260. However, when specific Aroclors are known to be present or expected in samples,the specific Aroclors should be used for the QC reference sample. See Method 8000, Sec.8.0, for additional information on how to accomplish this demonstration. Other concentrationsmay be used, as appropriate for the intended application.
8.3.3 Calculate the average recovery and the standard deviation of the recoveriesof the analytes in each of the four QC reference samples. Refer to Sec. 8.0 of Method 8000for procedures for evaluating method performance.
8.4 Sample quality control for preparation and analysis
The laboratory must also have procedures for documenting the effect of the matrix on methodperformance (precision and accuracy). At a minimum, this includes the analysis of QC samplesincluding a method blank and a laboratory control sample (LCS) in each analytical batch, theaddition of surrogates to each field sample and QC sample, and routine analyses of matrix spikeand matrix spike duplicate aliquots.
8.4.1 Documenting the effect of the matrix should include the analysis of at leastone matrix spike and one duplicate unspiked sample or one matrix spike/matrix spike duplicatepair. The decision on whether to prepare and analyze duplicate samples or a matrixspike/matrix spike duplicate must be based on a knowledge of the samples in the samplebatch. If samples are not expected to contain target analytes, laboratories should use a matrixspike and matrix spike duplicate pair, spiked with the Aroclor 1016/1260 mixture. However,when specific Aroclors are known to be present or expected in samples, the specific Aroclorsshould be used for spiking. If samples are expected to contain target analytes, thenlaboratories may use one matrix spike and a duplicate analysis of an unspiked field sample.

8082A - 23 Revision 1November 2000
8.4.2 A laboratory control sample (LCS) should be included with each analyticalbatch. The LCS consists of an aliquot of a clean (control) matrix similar to the sample matrixand of the same weight or volume. The LCS is spiked with the same analytes at the sameconcentrations as the matrix spike. When the results of the matrix spike analysis indicate apotential problem due to the sample matrix itself, the LCS results are used to verify that thelaboratory can perform the analysis in a clean matrix.
8.4.3 See Method 8000, Sec. 8.0, for the details on carrying out sample qualitycontrol procedures for preparation and analysis.
8.5 Surrogate recoveries
The laboratory must evaluate surrogate recovery data from individual samples versus thesurrogate control limits developed by the laboratory. See Method 8000, Sec. 8.0, for information onevaluating surrogate data and developing and updating surrogate limits. Procedures for evaluatingthe recoveries of multiple surrogates and the associated corrective actions should be defined in anapproved project plan.
8.6 It is recommended that the laboratory adopt additional quality assurance practices foruse with this method. The specific practices that are most productive depend upon the needs ofthe laboratory and the nature of the samples. Whenever possible, the laboratory should analyzestandard reference materials and participate in relevant performance evaluation studies.
9.0 METHOD PERFORMANCE
9.1 The method detection limit (MDL) is defined in Chapter One. MDL data provided inthis method are for illustrative purposes only. Each laboratory should develop its own matrix-specific MDLs, if necessary, using the guidance found in Chapter One. Estimated quantitation limits(EQLs) may be determined using the factors in Table 1.
9.2 The accuracy and precision obtainable with this method depend on the sample matrix,sample preparation technique, optional cleanup techniques, and calibration procedures used. Table9 provides single laboratory recovery data for Aroclors spiked into clay and soil and extracted withautomated Soxhlet. Table 10 provides multiple laboratory data on the precision and accuracy forAroclors spiked into soil and extracted by automated Soxhlet.
9.3 During method performance studies, the concentrations determined as Aroclors werehigher than those obtained using the congener method for the limited set of congeners listed in Sec.1.1. In certain soils, interference prevented the measurement of congener 66. Recoveries ofcongeners from environmental reference materials ranged from 51 - 66% of the certified Aroclorvalues, illustrating the potential difficulties in using congener analysis to demonstrate compliancewith Aroclor-based regulatory limits.
9.4 Tables 11 through 13 contain laboratory performance data for several PCB congenersusing supercritical fluid extraction (Method 3562) on an HP 7680 to extract solid samples, includingsoils, sewage sludge, and fish tissue. Seven replicate extractions were performed on each sample.The method was performed using a variable restrictor and solid trapping material (Florisil). Sampleanalysis was performed by GC/ECD. The following solid samples were used for this study:

8082A - 24 Revision 1November 2000
9.4.1 Two field-contaminated certified reference materials were extracted by asingle laboratory. One of the materials was a lake sediment from Environment Canada (EC-5). The other material was soil from a dump site and was provided by the National Scienceand Engineering Research Council of Canada (EC-1). The average recoveries for EC-5 arebased on the certified value for that sample. The average recoveries for EC-1 are based onthe certified value of the samples or a Soxhlet value, if a certified value was unavailable for aspecific analyte.
9.4.2 Four certified reference materials were extracted by two independentlaboratories. The materials were: a marine sediment from NIST (SRM 1941), a fish tissuefrom NIST (SRM 2974), a sewage sludge from BCR European Union (CRM 392), and a soilsample from BCR European Union (CRM 481). The average recoveries are based on thecertified value of the samples or a Soxhlet value, if a certified value was unavailable for aspecific analyte.
9.4.3 A weathered sediment sample from Michigan (Saginaw Bay) was extractedby a single laboratory. Soxhlet extractions were carried out on this sample and the SFErecovery is relative to that for each congener. The average recoveries are based on thecertified value of the samples. Additional data are shown in the tables for some congenersfor which no certified values were available.
9.5 Tables 14 through 16 contain single laboratory recovery data for Aroclor 1254 usingsolid-phase extraction (Method 3535). Recovery data at 2, 10, and 100 ug/L are presented. Resultsrepresent three replicate solid-phase extractions of spiked wastewaters. Two different wastewatersfrom each wastewater type were spiked. All of the extractions were performed using 90-mm C18
disks.
9.6 Single-laboratory data were developed for PCBs extracted by pressurized fluidextraction (Method 3545) from sewage sludge, a river sediment standard reference material (SRM1939), and a certified soil reference material (CRM911-050). Certified values were available for fivePCB congeners for the sewage sludge and for four congeners in SRM 1939. The soil referencematerial was certified for Aroclor 1254. All pressurized fluid extractions were conducted usinghexane:acetone (1:1), at 100EC, 1300-1500 psi, and a 5-minute static extraction. Extracts wereanalyzed by GC/ECD. The data are presented in Tables 17 through 19 and are reported in detailin Reference 13.
9.7 Single-laboratory accuracy data were obtained for PCBs extracted by microwaveextraction (Method 3546) from three reference materials, EC-1, EC-2, and EC-3, from EnvironmentCanada. Natural soils, glass fiber, and sand samples were also used as matrices that were spikedwith PCBs. Concentrations varied between 0.2 and 10 µg/g (total PCBs). All samples wereextracted using 1:1 hexane:acetone. Extracts were analyzed by GC/ECD. Method blanks, spikesand spike duplicates were included for the low concentration spikes; matrix spikes were includedfor all other concentrations. The data are presented in Tables 20 through 22 and are reported indetail in Reference 14.

8082A - 25 Revision 1November 2000
10.0 REFERENCES
1. Lopez-Avila, V., Baldin, E., Benedicto, J, Milanes, J., Beckert. W.F., Application of Open-Tubular Columns to SW-846 GC Methods", final report to the U.S. Environmental ProtectionAgency on Contract 68-03-3511, Mid-Pacific Environmental Laboratory, Mountain View, CA,1990.
2. Development and Application of Test Procedures for Specific Organic Toxic Substances inWastewaters. Category 10 - Pesticides and PCB Report for the U.S. EnvironmentalProtection Agency on Contract 68-03-2606.
3. Ahnoff, M., Josefsson, B., "Cleanup Procedures for PCB Analysis on River Water Extracts",Bull. Environ. Contam. Toxicol., 1975, 13, 159.
4. Marsden, P.J., "Performance Data for SW-846 Methods 8270, 8081, and 8141", U.S.Environmental Protection Agency, EMSL-Las Vegas, EPA/600/4-90/015.
5. Marsden, P.J., "Analysis of PCBs", U.S. Environmental Protection Agency, EMSL-Las Vegas,NV, EPA/600/8-90/004.
6. Erickson, M., Analytical Chemistry of PCBs, Butterworth Publishers, Ann Arbor Science Book,(1986).
7. Stewart, J., "EPA Verification Experiment for Validation of the SOXTEC® PCB ExtractionProcedure", Oak Ridge National Laboratory, Oak Ridge, TN, 37831-6138, October 1988.
8. Lopez-Avila, V. (Beckert, W., Project Officer), "Development of a Soxtec Extraction Procedurefor Extracting Organic Compounds from Soils and Sediments", EPA 600/X-91/140, U.S.Environmental Protection Agency, Environmental Monitoring Systems Laboratory, Las Vegas,NV, October 1991.
9. Stewart, J.H., Bayne, C.K., Holmes, R.L., Rogers, W.F., and Maskarinec, M.P., "Evaluationof a Rapid Quantitative Organic Extraction System for Determining the Concentration of PCBin Soils", Proceedings of the U.S. EPA Symposium on Waste Testing and Quality Assurance,Oak Ridge National Laboratory, Oak Ridge, TN, 37831, July 11-15, 1988.
10. Tsang, S.F., Marsden, P.J., and Lesnik, B., "Quantitation of Polychlorinated Biphenyls Using19 Specific Congeners", Proceedings of the 9th Annual Waste Testing and Quality AssuranceSymposium, Office of Solid Waste and Emergency Response, U.S. Environmental ProtectionAgency, Washington, DC, July 1993.
11. S. Bøwadt, B. Johansson, S. Wunderli, M. Zennegg, L. F. de Alencastro and D. Grandjean,"Independent Comparison of Soxhlet and Supercritical Fluid Extraction for the Determinationof PCBs in an Industrial Soil," Anal. Chem., 1995, 67(14) 2424-2430.
12. Markell, C., "3M Data Submission to EPA," letter to B. Lesnik, June 27, 1995.

8082A - 26 Revision 1November 2000
13. Richter, B, Ezzell, J., and Felix D, "Single Laboratory Method Validation Report - Extraction ofOrganophosphorus Pesticides, Herbicides and Polychlorinated Biphenyls using AcceleratedSolvent Extraction (ASE) with Analytical Validation by GC/NPD and GC/ECD," Dionex, SaltLake City, UT, Document 101124, December 2, 1994.
14. K. Li, J. M. R. Bélanger, M. P. Llompart, R. D. Turpin, R. Singhvi, and J. R. J. Paré. Evaluationof rapid solid sample extraction using the microwave-assisted process (MAPTM) under closed-vessel conditions. Spectros. Int. J. 13 (1), 1-14 (1997).

8082A - 27 Revision 1November 2000
TABLE 1
FACTORS FOR DETERMINATION OF ESTIMATED QUANTITATION LIMITSa (EQLs)FOR VARIOUS MATRICES
Matrix Factor
Ground water 10
Low-concentration soil by sonication with GPC cleanup 670
High-concentration soil and sludges by sonication 10,000
Non-water miscible waste 100,000
aEQL = [MDL for water (see Sec. 1.8)] times [Factor in this table]
For nonaqueous samples, the factor is on a wet-weight basis. Sample EQLs are highlymatrix-dependent. EQLs determined using these factors are provided as guidance and maynot always be achievable.

8082A - 28 Revision 1November 2000
TABLE 2
SUGGESTED GC OPERATING CONDITIONS FOR PCBs AS AROCLORSSINGLE-COLUMN ANALYSIS
Narrow-bore columns
Narrow-bore Column 1 - 30-m x 0.25 or 0.32-mm ID fused-silica capillary column chemicallybonded with SE-54 (DB-5 or equivalent), 1 µm film thickness.
Carrier gas (He) 16 psiInjector temperature 225ECDetector temperature 300ECInitial temperature 100EC, hold 2 minutesTemperature program 100EC to 160EC at 15EC/min, followed
by 160EC to 270EC at 5EC/minFinal temperature 270EC
Narrow-bore Column 2 - 30-m x 0.25-mm ID fused-silica capillary column chemically bonded with35 percent phenyl methylpolysiloxane (DB-608, SPB-608, or equivalent) 25 µm coating thickness,1 µm film thickness
Carrier gas (N2) 20 psiInjector temperature 225ECDetector temperature 300ECInitial temperature 160EC, hold 2 minutesTemperature program 160EC to 290EC at 5EC/minFinal temperature 290EC, hold 1 min
Wide-bore columns
Wide-bore Column 1 - 30-m x 0.53-mm ID fused-silica capillary column chemically bonded with 35percent phenyl methylpolysiloxane (DB-608, SPB-608, RTx-35, or equivalent), 0.5 µm or 0.83 µmfilm thickness.
Wide-bore Column 2 - 30-m x 0.53-mm ID fused-silica capillary column chemically bonded with14% cyanopropylmethylpolysiloxane (DB-1701, or equivalent), 1.0 µm film thickness.
Carrier gas (He) 5-7 mL/minuteMakeup gas (argon/methane[P-5 or P-10] or N2) 30 mL/min Injector temperature 250ECDetector temperature 290ECInitial temperature 150EC, hold 0.5 minuteTemperature program 150EC to 270EC at 5EC/minFinal temperature 270EC, hold 10 min

8082A - 29 Revision 1November 2000
TABLE 2(continued)
SUGGESTED GC OPERATING CONDITIONS FOR PCBs AS AROCLORSSINGLE-COLUMN ANALYSIS
Wide-bore Columns (continued)
Wide-bore Column 3 - 30-m x 0.53-mm ID fused-silica capillary column chemically bonded with SE-54 (DB-5, SPB-5, RTx-5, or equivalent), 1.5 µm film thickness.
Carrier gas (He) 6 mL/minuteMakeup gas (argon/methane[P-5 or P-10] or N2) 30 mL/min Injector temperature 205ECDetector temperature 290ECInitial temperature 140EC, hold 2 minTemperature program 140EC to 240EC at 10EC/min,
hold 5 minutes at 240EC,240EC to 265EC at 5EC/min
Final temperature 265EC, hold 18 min

8082A - 30 Revision 1November 2000
TABLE 3
SUGGESTED GC OPERATING CONDITIONS FOR PCBs AS AROCLORSFOR THE DUAL-COLUMN METHOD OF ANALYSIS
Column 1 - DB-1701 or equivalent, 30-m x 0.53-mm ID, 1.0 µm film thickness.
Column 2 - DB-5 or equivalent, 30-m x 0.53-mm ID, 1.5 µm film thickness.
Carrier gas (He) flow rate 6 mL/minMakeup gas (N2) flow rate 20 mL/minTemperature program 0.5 min hold
150EC to 190EC, at 12EC/min, 2 min hold190EC to 275EC, at 4EC/min, 10 min hold
Injector temperature 250ECDetector temperature 320ECInjection volume 2 µL
Solvent HexaneType of injector Flash vaporizationDetector type Dual ECDRange 10Attenuation 64 (DB-1701)/64 (DB-5)Type of splitter J&W Scientific press-fit Y-shaped inlet splitter

8082A - 31 Revision 1November 2000
TABLE 4
EXAMPLE RETENTION TIMES OF AROCLORSON THE DB-5 COLUMNa, DUAL-COLUMN ANALYSIS
PeakNo.
Aroclor 1016
Aroclor1221
Aroclor1232
Aroclor1242
Aroclor1248
Aroclor1254
Aroclor1260
1 5.85 5.852 7.63 7.64 7.573 8.41 8.43 8.43 8.374 8.77 8.77 8.78 8.735 8.98 8.99 9.00 8.94 8.956 9.71 9.667 10.49 10.50 10.50 10.44 10.458 10.58 10.59 10.59 10.53 9 10.90 10.91 10.86 10.8510 11.23 11.24 11.24 11.18 11.1811 11.88 11.90 11.84 11.8512 11.99 12.00 11.9513 12.27 12.29 12.29 12.24 12.2414 12.66 12.68 12.69 12.64 12.6415 12.98 12.99 13.00 12.95 12.9516 13.18 13.19 13.14 13.1517 13.61 13.63 13.58 13.58 13.59 13.5918 13.80 13.82 13.77 13.77 13.7819 13.96 13.97 13.93 13.93 13.9020 14.48 14.50 14.46 14.45 14.4621 14.63 14.64 14.60 14.6022 14.99 15.02 14.98 14.97 14.9823 15.35 15.36 15.32 15.31 15.3224 16.01 15.9625 16.14 16.08 16.08 16.1026 16.27 16.29 16.26 16.24 16.25 16.2627 16.5328 17.04 16.99 16.96 16.9729 17.22 17.19 17.19 17.19 17.2130 17.46 17.43 17.43 17.4431 17.69 17.6932 17.92 17.91 17.9133 18.16 18.14 18.1434 18.41 18.37 18.36 18.36 18.3735 18.58 18.56 18.55 18.5536 18.68
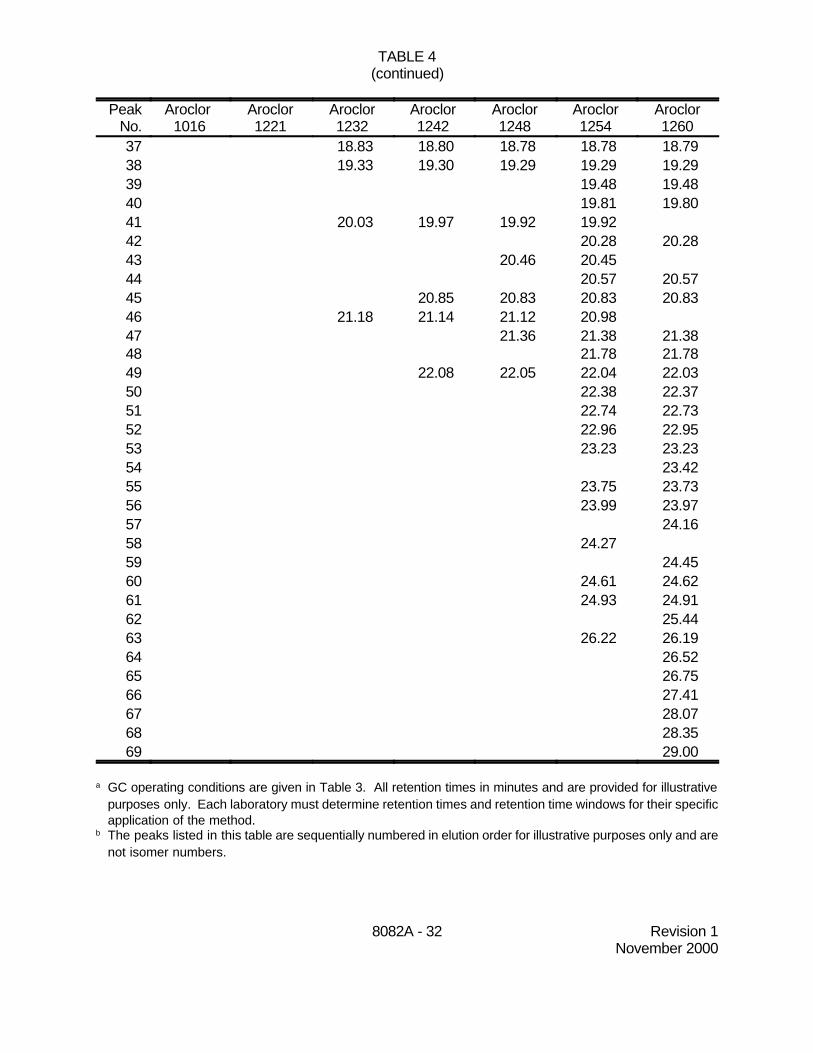
TABLE 4(continued)
PeakNo.
Aroclor 1016
Aroclor1221
Aroclor1232
Aroclor1242
Aroclor1248
Aroclor1254
Aroclor1260
8082A - 32 Revision 1November 2000
37 18.83 18.80 18.78 18.78 18.7938 19.33 19.30 19.29 19.29 19.2939 19.48 19.4840 19.81 19.8041 20.03 19.97 19.92 19.9242 20.28 20.2843 20.46 20.4544 20.57 20.5745 20.85 20.83 20.83 20.8346 21.18 21.14 21.12 20.9847 21.36 21.38 21.3848 21.78 21.7849 22.08 22.05 22.04 22.0350 22.38 22.3751 22.74 22.7352 22.96 22.9553 23.23 23.2354 23.4255 23.75 23.7356 23.99 23.9757 24.1658 24.2759 24.4560 24.61 24.6261 24.93 24.9162 25.4463 26.22 26.1964 26.5265 26.7566 27.4167 28.0768 28.3569 29.00
a GC operating conditions are given in Table 3. All retention times in minutes and are provided for illustrativepurposes only. Each laboratory must determine retention times and retention time windows for their specificapplication of the method.
b The peaks listed in this table are sequentially numbered in elution order for illustrative purposes only and arenot isomer numbers.

8082A - 33 Revision 1November 2000
TABLE 5
EXAMPLE RETENTION TIMES OF AROCLORSON THE DB-1701 COLUMNa, DUAL-COLUMN ANALYSIS
PeakNo.
Aroclor 1016
Aroclor1221
Aroclor1232
Aroclor1242
Aroclor1248
Aroclor1254
Aroclor1260
1 4.45 4.452 5.383 5.784 5.86 5.865 6.33 6.34 6.34 6.286 6.78 6.78 6.79 6.727 6.96 6.96 6.96 6.90 6.918 7.64 7.599 8.23 8.23 8.23 8.15 8.16
10 8.62 8.63 8.63 8.5711 8.88 8.89 8.83 8.8312 9.05 9.06 9.06 8.99 8.9913 9.46 9.47 9.40 9.4114 9.77 9.79 9.78 9.71 9.7115 10.27 10.29 10.29 10.21 10.2116 10.64 10.65 10.66 10.59 10.5917 10.96 10.95 10.9518 11.01 11.02 11.02 11.0319 11.09 11.1020 11.98 11.99 11.94 11.93 11.9321 12.39 12.39 12.33 12.33 12.3322 12.77 12.71 12.6923 12.92 12.94 12.9324 12.99 13.00 13.09 13.09 13.1025 13.14 13.1626 13.2427 13.49 13.49 13.44 13.4428 13.58 13.61 13.54 13.54 13.51 13.5229 13.67 13.6830 14.08 14.03 14.03 14.03 14.0231 14.30 14.26 14.24 14.24 14.2532 14.39 14.3633 14.49 14.46 14.4634 14.56 14.5635 15.10 15.1036 15.38 15.33 15.32 15.3237 15.65 15.62 15.62 15.61 16.6138 15.78 15.74 15.74 15.74 15.79

TABLE 5(continued)
PeakNo.
Aroclor 1016
Aroclor1221
Aroclor1232
Aroclor1242
Aroclor1248
Aroclor1254
Aroclor1260
8082A - 34 Revision 1November 2000
39 16.13 16.10 16.10 16.0840 16.1941 16.34 16.3442 16.44 16.4543 16.5544 16.77 16.73 16.74 16.77 16.7745 17.13 17.09 17.07 17.07 17.0846 17.29 17.3147 17.46 17.44 17.43 17.4348 17.69 17.69 17.68 17.6849 18.19 18.17 18.1850 18.48 18.49 18.42 18.4051 18.5952 18.86 18.8653 19.13 19.13 19.10 19.0954 19.42 19.4355 19.55 19.5956 20.20 20.2157 20.3458 20.4359 20.57 20.5560 20.62 20.6661 20.88 20.8762 21.0363 21.53 21.5364 21.83 21.8165 23.31 23.2766 23.8567 24.1168 24.4669 24.5970 24.8771 25.8572 27.0573 27.72
a GC operating conditions are given in Table 3. All retention times are in minutes and are provided forillustrative purposes only. Each laboratory must determine retention times and retention time windows fortheir specific application of the method.
b The peaks listed in this table are sequentially numbered in elution order for illustrative purposes only and arenot isomer numbers.

8082A - 35 Revision 1November 2000
TABLE 6
EXAMPLE RETENTION TIMES OF PEAKS DIAGNOSTIC OF PCBsON A 0.53-mm ID COLUMNS DURING SINGLE-COLUMN ANALYSIS
Peak No.a RT on DB-608b RT on DB-1701b Aroclorc
I 4.90 4.66 1221
II 7.15 6.96 1221, 1232, 1248
III 7.89 7.65 1061, 1221, 1232, 1242
IV 9.38 9.00 1016, 1232, 1242, 1248
V 10.69 10.54 1016, 1232, 1242
VI 14.24 14.12 1248, 1254
VII 14.81 14.77 1254
VIII 16.71 16.38 1254
IX 19.27 18.95 1254, 1260
X 21.22 21.23 1260
XI 22.89 22.46 1260
aPeaks are sequentially numbered in elution order and are not isomer numbers
bTemperature program: Ti = 150EC, hold 30 seconds; 5EC/minute to 275EC.
cUnderline indicates the largest peak in the pattern for that Aroclor
All retention times are in minutes and are provided for illustrative purposes only. Eachlaboratory must determine retention times and retention time windows for their specificapplication of the method.

8082A - 36 Revision 1November 2000
TABLE 7
SPECIFIC PCB CONGENERS THAT ARE MAJOR COMPONENTS IN COMMON AROCLORS
Aroclor
Congener IUPAC Number 1016 1221 1232 1242 1248 1254 1260
Biphenyl -- X
2-CB 1 X X X X
2,3-DCB 5 X X X X X
3,4-DCB 12 X X X X
2,4,4'-TCB 28* X X X X X
2,2',3,5'-TCB 44 X X X X X
2,3',4,4'-TCB 66* X X X
2,3,3',4',6-PCB 110 X
2,3',4,4',5-PCB 118* X X
2,2',4,4',5,5'-HCB 153 X
2,2',3,4,4',5'-HCB 138 X
2,2',3,4,4',5,5'-HpCB 180 X
2,2',3,3',4,4',5-HpCB 170 X
*Apparent co-elution of: 28 with 31 (2,4',5-trichlorobiphenyl)66 with 95 (2,2',3,5',6-pentachlorobiphenyl)118 with 149 (2,2',3,4',5',6-hexachlorobiphenyl)
This table is not intended to illustrate all of the congeners that may be present in a given Aroclor, butrather to illustrate the major congener components.
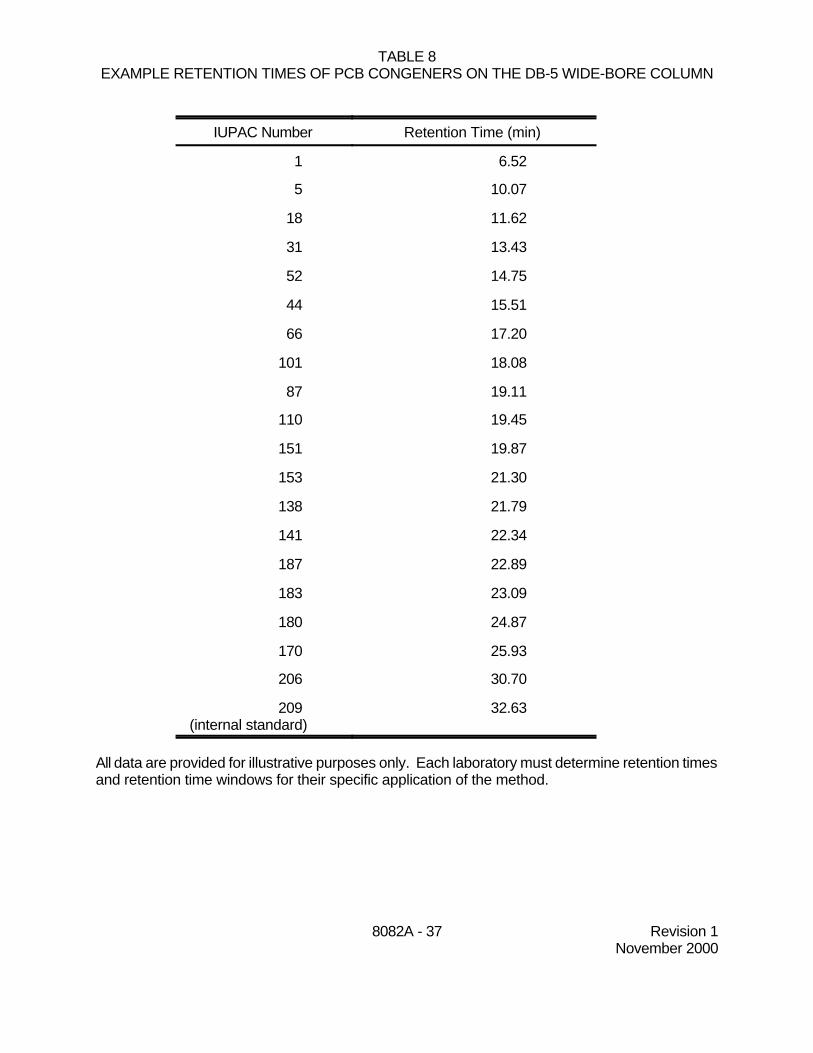
8082A - 37 Revision 1November 2000
TABLE 8EXAMPLE RETENTION TIMES OF PCB CONGENERS ON THE DB-5 WIDE-BORE COLUMN
IUPAC Number Retention Time (min)
1 6.52
5 10.07
18 11.62
31 13.43
52 14.75
44 15.51
66 17.20
101 18.08
87 19.11
110 19.45
151 19.87
153 21.30
138 21.79
141 22.34
187 22.89
183 23.09
180 24.87
170 25.93
206 30.70
209(internal standard)
32.63
All data are provided for illustrative purposes only. Each laboratory must determine retention timesand retention time windows for their specific application of the method.

8082A - 38 Revision 1November 2000
TABLE 9
SINGLE-LABORATORY RECOVERY DATA FOR THE EXTRACTION OFPCBs FROM CLAY AND SOIL BY AUTOMATED SOXHLET (METHOD 3541)a
Matrix Aroclor Spike Level (ppm) Trial Percent Recoveryb
Clay 1254 5 1 87
2 93
3 94
4 99
5 79
6 28
Clay 1254 50 1 65
2 72
3 97
4 80
5 50
6 59
Clay 1260 5 1 87
2 75
3 61
4 94
5 97
6 113
Clay 1260 50 1 74
2 70
3 92
4 89
5 90
6 67

8082A - 39 Revision 1November 2000
TABLE 9(continued)
Matrix Aroclor Spike Level (ppm) Trial Percent Recoveryb
Soil 1254 5 1 70
2 89
3 92
4 83
5 63
Soil 1254 50 1 84
2 78
3 92
4 67
5 82
6 62
Soil 1260 5 1 84
2 83
3 82
4 96
5 94
6 94
7 98
Soil 1260 50 1 77
2 69
3 93
4 82
5 83
6 76
aThe operating conditions for the automated SoxhletImmersion time: 60 minReflux time: 60 min
bMultiple results from two different extractors
Data from Reference 9

8082A - 40 Revision 1November 2000
TABLE 10
MULTIPLE-LABORATORY PRECISION AND ACCURACY DATA FOR THE EXTRACTIONOF PCBs FROM SPIKED SOIL BY AUTOMATED SOXHLET (METHOD 3541)
Percent Recovery atAroclor 1254 Spike
Concentration (µg/kg)
Percent Recovery atAroclor 1260 Spike
Concentration (µg/kg) Mean
Recovery
5 50 500 5 50 500 All Levels
Lab 1n
MeanS. D.
3101.234.9
374.041.8
383.97.4
378.57.4
1284.426.0
Lab 2n
MeanS. D.
656.57.0
666.915.4
670.114.5
674.510.3
2467.013.3
Lab 3n
MeanS. D.
372.810.8
363.38.3
370.62.5
357.25.6
1266.09.1
Lab 4n
MeanS. D.
6112.618.2
6144.330.4
6100.313.3
684.83.8
24110.528.5
Lab 5n
MeanS. D.
397.18.7
380.15.1
379.53.1
377.09.4
1283.510.3
Lab 6n
MeanS. D.
2140.9
4.3
3127.715.5
3138.715.5
4105.9
7.9
12125.418.4
Lab 7n
MeanS. D.
3100.117.9
3123.414.6
382.17.9
394.15.2
1299.919.0
Lab 8n
MeanS. D.
365.016.0
338.321.9
392.836.5
351.912.8
1262.029.1
AllLabs
nMeanS. D.
2098.828.7
3092.542.9
971.314.1
2195.525.3
3178.618.0
975.39.5
12087.629.7
Data from Reference 7

8082A - 41 Revision 1November 2000
TABLE 11
PERCENT RECOVERY (BIAS) OF PCBs IN VARIOUS SOILS USING SUPERCRITICAL FLUID EXTRACTION (METHOD 3562)
PCB No.a
EC-1 Dump Site SoilLow #1
SRM 1941Marine
SedimentLow #2
EC-5 LakeSedimentLow #3
CRM 481b
EuropeanSoil
High #1
Saginaw Bay
SedimentHigh #2
CRM 392SewageSludgeHigh #3
SRM 2974Fish Tissue
MusselLow #4
CongenerMean
28 148.4 63.3 147.7 67.3 114.7 89.2 101.7 104.6
52 88.5 106.6 115.8 84.5 111.1 96.2 131.4 104.9
101 93.3 91.2 100.2 84.5 111.5 93.9 133.2 101.1
149 92.6 105.1 101.5 73.2 111.2 69.4 92.2
118 89.9 66.1 108.9 82.1 110.8 73.5 82.7 87.7
153 90.8 65.1 95.1 82.8 118.6 97.3 107.5 94.0
105b 89.1 72.6 96.6 83.4 111.8 79.4 88.8
138 90.1 57.4 97.9 76.9 126.9 73.1 87.1
128 90.8 69.9 101.2 65.9 87.6 62.5 79.7
156b 90.6 88.9 94.3 85.2 101.1 59.3 86.6
180 92.4 142.4 93.3 82.2 109.2 100.5 65.7 98.0
170 91.3 101.1 95.2 80.5 33.0 81.8
Matrix Mean 95.7 85.8 104.0 79.0 108.7 91.8 83.2 92.2
a Congeners which are either certified or have had Soxhlet confirmation. b Congener 105 was not resolved from congener 132 and congener 156 was not resolved from congener 171 by the GC method used
for samples EC-1 and EC-5.

8082A - 42 Revision 1November 2000
TABLE 12
PRECISION (AS %RSD) OF PCBs EXTRACTED USING SUPERCRITICAL FLUID EXTRACTION (METHOD 3562)
PCB No.a
EC-1 Dump Site SoilLow #1
SRM 1941Marine
SedimentLow #2
EC-5 LakeSedimentLow #3
CRM 481European
SoilHigh #1
SaginawBay
SedimentHigh #2
CRM 392SewageSludgeHigh #3
SRM 2974Fish Tissue
MusselLow #4
CongenerMean
28 11.5 1.5 3.8 5.6 2.4 1.9 2.7 4.2
52 9.1 3.3 3.9 5.4 2.2 2.9 3.1 4.3
101 9.1 2.9 2.8 4.9 1.4 5.2 2.9 4.2
149 7.1 0.7 3.8 3.9 3.4 2.2 3.0
118 9.8 1.9 4.5 5.4 2.0 3.3 2.4 4.2
153 8.4 1.5 3.0 4.3 4.3 9.5 3.0 4.9
105b 6.6 3.7 2.7 4.3 2.7 2.5 3.2
138 9.2 1.8 3.1 4.7 2.3 2.9 3.4
128 6.0 5.3 3.3 4.9 2.8 3.3 3.7
156b 8.3 0.0 5.1 4.5 1.9 3.8 3.4
180 8.0 1.3 3.6 4.3 3.1 9.6 2.7 4.7
170 5.7 2.3 3.6 3.9 2.3 4.0 3.1
Matrix Mean 8.2 2.2 3.6 4.7 2.6 2.7 3.0 3.8
a Congeners which are either certified or have had Soxhlet confirmation.b Congener 105 was not resolved from congener 132 and congener 156 was not resolved from congener 171 by the GC method used
for samples EC-1 and EC-5.
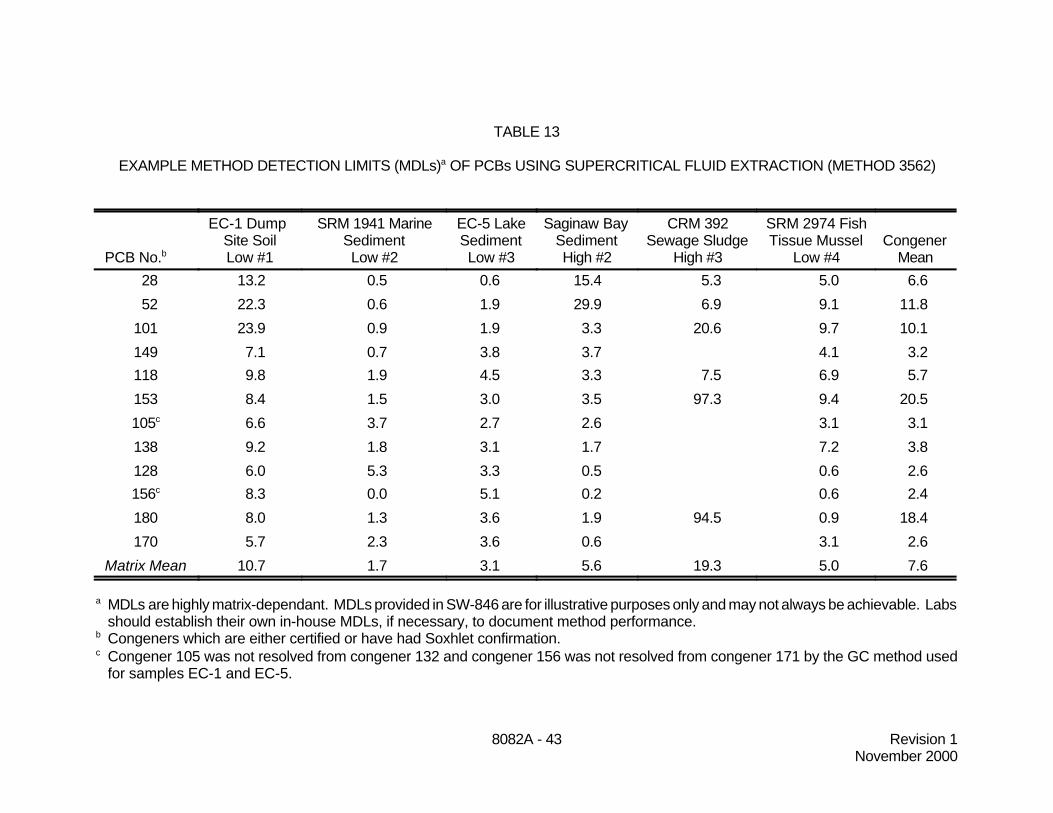
8082A - 43 Revision 1November 2000
TABLE 13
EXAMPLE METHOD DETECTION LIMITS (MDLs)a OF PCBs USING SUPERCRITICAL FLUID EXTRACTION (METHOD 3562)
PCB No.b
EC-1 Dump Site SoilLow #1
SRM 1941 MarineSedimentLow #2
EC-5 LakeSedimentLow #3
Saginaw Bay SedimentHigh #2
CRM 392Sewage Sludge
High #3
SRM 2974 FishTissue Mussel
Low #4Congener
Mean
28 13.2 0.5 0.6 15.4 5.3 5.0 6.6
52 22.3 0.6 1.9 29.9 6.9 9.1 11.8
101 23.9 0.9 1.9 3.3 20.6 9.7 10.1
149 7.1 0.7 3.8 3.7 4.1 3.2
118 9.8 1.9 4.5 3.3 7.5 6.9 5.7
153 8.4 1.5 3.0 3.5 97.3 9.4 20.5
105c 6.6 3.7 2.7 2.6 3.1 3.1
138 9.2 1.8 3.1 1.7 7.2 3.8
128 6.0 5.3 3.3 0.5 0.6 2.6
156c 8.3 0.0 5.1 0.2 0.6 2.4
180 8.0 1.3 3.6 1.9 94.5 0.9 18.4
170 5.7 2.3 3.6 0.6 3.1 2.6
Matrix Mean 10.7 1.7 3.1 5.6 19.3 5.0 7.6
a MDLs are highly matrix-dependant. MDLs provided in SW-846 are for illustrative purposes only and may not always be achievable. Labsshould establish their own in-house MDLs, if necessary, to document method performance.
b Congeners which are either certified or have had Soxhlet confirmation.c Congener 105 was not resolved from congener 132 and congener 156 was not resolved from congener 171 by the GC method used
for samples EC-1 and EC-5.
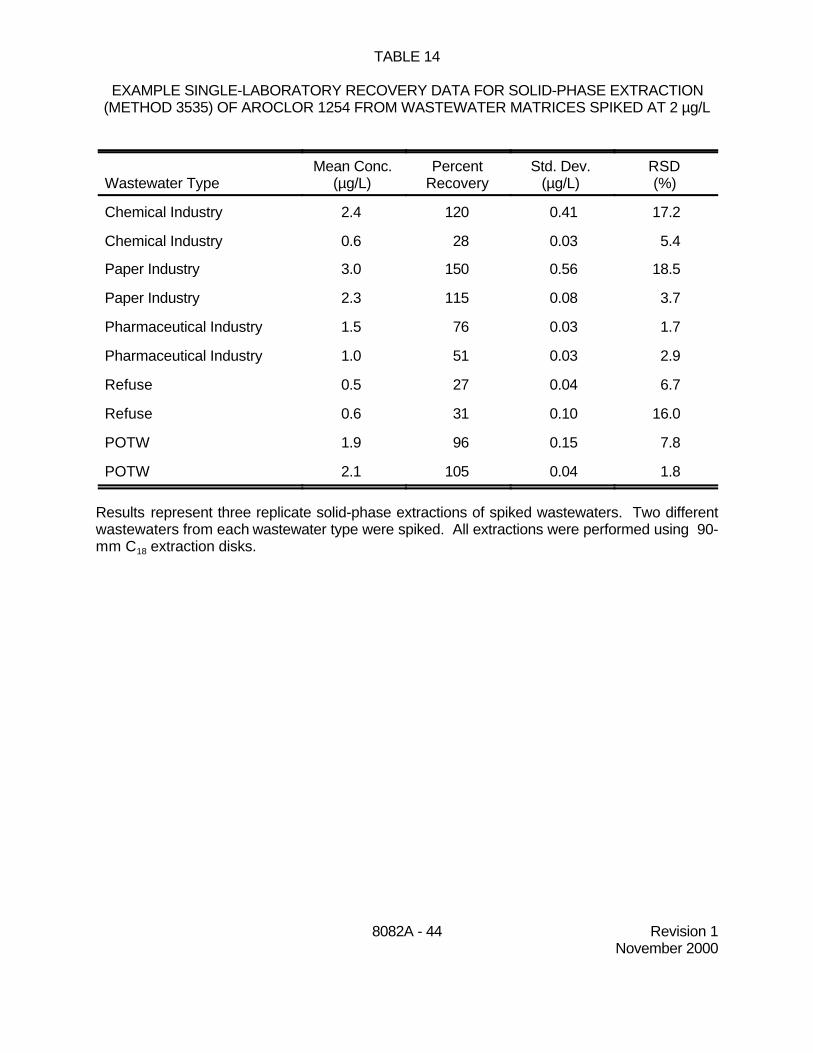
8082A - 44 Revision 1November 2000
TABLE 14
EXAMPLE SINGLE-LABORATORY RECOVERY DATA FOR SOLID-PHASE EXTRACTION(METHOD 3535) OF AROCLOR 1254 FROM WASTEWATER MATRICES SPIKED AT 2 µg/L
Wastewater TypeMean Conc.
(µg/L)Percent
RecoveryStd. Dev.
(µg/L)RSD(%)
Chemical Industry 2.4 120 0.41 17.2
Chemical Industry 0.6 28 0.03 5.4
Paper Industry 3.0 150 0.56 18.5
Paper Industry 2.3 115 0.08 3.7
Pharmaceutical Industry 1.5 76 0.03 1.7
Pharmaceutical Industry 1.0 51 0.03 2.9
Refuse 0.5 27 0.04 6.7
Refuse 0.6 31 0.10 16.0
POTW 1.9 96 0.15 7.8
POTW 2.1 105 0.04 1.8
Results represent three replicate solid-phase extractions of spiked wastewaters. Two differentwastewaters from each wastewater type were spiked. All extractions were performed using 90-mm C18 extraction disks.

8082A - 45 Revision 1November 2000
TABLE 15
EXAMPLE SINGLE-LABORATORY RECOVERY DATA FOR SOLID-PHASE EXTRACTION(METHOD 3535) OF AROCLOR 1254 FROM WASTEWATER MATRICES SPIKED AT 10 µg/L
Wastewater TypeMean Conc.
(µg/L)Percent
RecoveryStd. Dev.
(µg/L)RSD(%)
Chemical Industry 8.8 88 1.07 12.2
Chemical Industry 8.1 81 0.06 0.7
Paper Industry 8.9 89 0.71 7.9
Paper Industry 10.1 101 0.15 1.4
Pharmaceutical Industry 9.2 92 0.24 2.6
Pharmaceutical Industry 8.4 84 0.17 2.0
Refuse 8.8 88 0.49 5.6
Refuse 8.0 80 1.44 18.0
POTW 9.5 82 0.17 2.1
POTW 8.2 82 0.17 2.1
Results represent three replicate solid-phase extractions of spiked wastewaters. Two differentwastewaters from each wastewater type were spiked. All extractions were performed using 90-mm C18 extraction disks.

8082A - 46 Revision 1November 2000
TABLE 16
EXAMPLE SINGLE-LABORATORY RECOVERY DATAFOR SOLID-PHASE EXTRACTION (METHOD 3535) OF AROCLOR 1254
FROM WASTEWATER MATRICES SPIKED AT 100 µg/L
Wastewater TypeMean Conc.
(µg/L)Percent
RecoveryStd. Dev.
(µg/L)RSD(%)
Chemical Industry 81.7 82 1.46 1.8
Chemical Industry 89.7 90 0.66 0.7
Paper Industry 73.7 74 3.94 5.3
Paper Industry 95.3 95 1.89 2.0
Pharmaceutical Industry 86.4 86 1.95 2.3
Pharmaceutical Industry 79.2 79 3.92 4.9
Refuse 85.7 86 1.59 1.9
Refuse 71.5 72 1.61 2.2
POTW 87.8 88 1.76 2.0
POTW 80.6 81 0.40 0.5
Results represent three replicate solid-phase extractions of spiked wastewaters. Two differentwastewaters from each wastewater type were spiked. All extractions were performed using 90-mm C18 extraction disks.
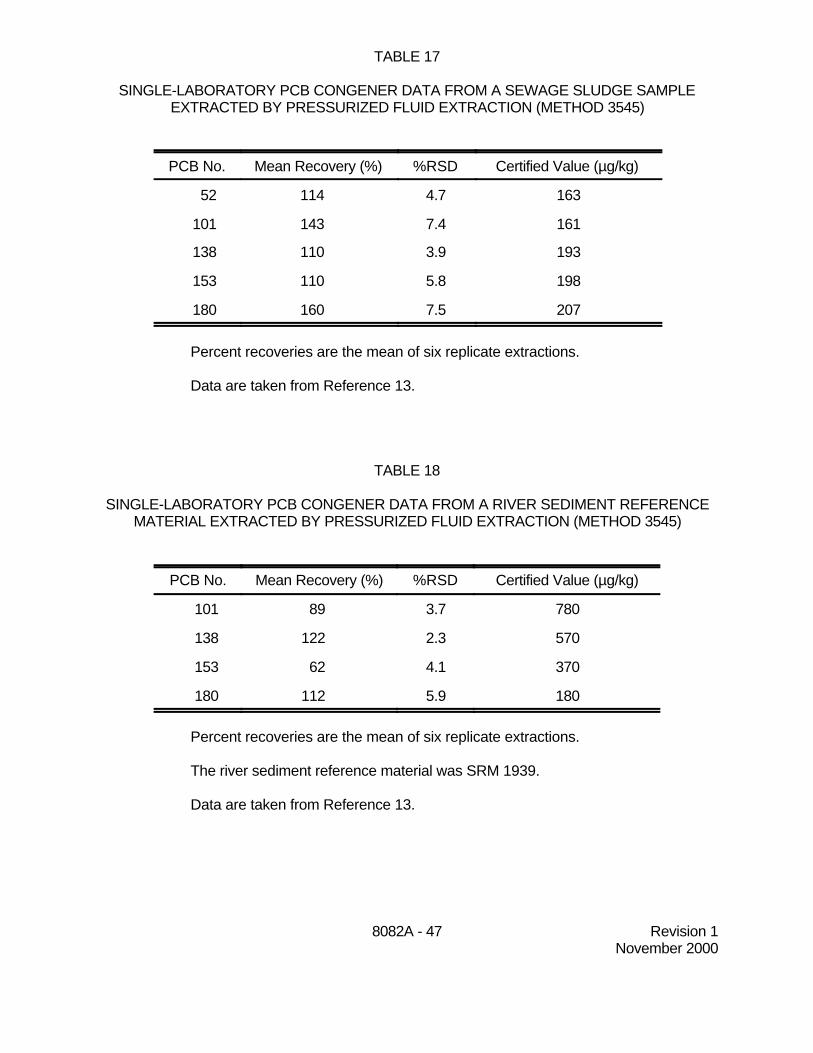
8082A - 47 Revision 1November 2000
TABLE 17
SINGLE-LABORATORY PCB CONGENER DATA FROM A SEWAGE SLUDGE SAMPLEEXTRACTED BY PRESSURIZED FLUID EXTRACTION (METHOD 3545)
PCB No. Mean Recovery (%) %RSD Certified Value (µg/kg)
52 114 4.7 163
101 143 7.4 161
138 110 3.9 193
153 110 5.8 198
180 160 7.5 207
Percent recoveries are the mean of six replicate extractions.
Data are taken from Reference 13.
TABLE 18
SINGLE-LABORATORY PCB CONGENER DATA FROM A RIVER SEDIMENT REFERENCEMATERIAL EXTRACTED BY PRESSURIZED FLUID EXTRACTION (METHOD 3545)
PCB No. Mean Recovery (%) %RSD Certified Value (µg/kg)
101 89 3.7 780
138 122 2.3 570
153 62 4.1 370
180 112 5.9 180
Percent recoveries are the mean of six replicate extractions.
The river sediment reference material was SRM 1939.
Data are taken from Reference 13.

8082A - 48 Revision 1November 2000
TABLE 19
SINGLE-LABORATORY AROCLOR 1254 DATA FROM A SOIL REFERENCE MATERIALEXTRACTED BY PRESSURIZED FLUID EXTRACTION (METHOD 3545)
Replicate Extraction Aroclor 1254 Concentration (µg/kg)
1 1290
2 1370
3 1280
4 1370
Mean 1330
%RSD 3.5%
Certified value 1340
Mean recovery (%) 99%
Data are taken from Reference 13.

8082A - 49 Revision 1November 2000
TABLE 20
SINGLE-LABORATORY PCB HOMOLOGUE DATA BY MICROWAVE EXTRACTION(METHOD 3546) FROM A CERTIFIED GREAT LAKE SEDIMENT MATERIAL (EC-2)
PCB homologue
Microwave Extraction Soxhlet Extraction
µg/kg Peaksa % RSD µg/kg Peaksa % RSD
Trichlorobiphenyl 130 4 21.8 100 4 14.6
Tetrachlorobiphenyl 400 10 13.2 390 20 10.2
Pentachlorobiphenyl 310 9 1.9 300 9 8.7
Hexachlorobiphenyl 120 3 0.0 110 3 9.1
a Number of PCB peaks detectedCl3 to Cl10 homologues analyzedn=3Data are taken from Reference 14.
TABLE 21
SINGLE-LABORATORY PCB HOMOLOGUE DATA BY MICROWAVE EXTRACTION(METHOD 3546) FROM A CERTIFIED HARBOR SEDIMENT MATERIAL (SRM-1944)
PCB homologue
Microwave Extraction Soxhlet Extraction
µg/kg Peaksa % RSD µg/kg Peaksa % RSD
Trichlorobiphenyl 450 8 10.1 360 6 5.8
Tetrachlorobiphenyl 580 12 3.9 580 11 6.0
Pentachlorobiphenyl 330 9 6.1 330 9 7.9
Hexachlorobiphenyl 260 3 12.4 240 3 5.1
Heptachlorobiphenyl 60 2 43.8 80 2 27.3
a Number of PCB peaks detectedCl3 to Cl10 homologues analyzedn=3Data are taken from Reference 14.

8082A - 50 Revision 1November 2000
TABLE 22
SINGLE-LABORATORY PCB DATA BY MICROWAVE EXTRACTION(METHOD 3546) FROM CERTIFIED GREAT LAKE SEDIMENT MATERIALS
SedimentTotal Aroclor
Concentration (µg/kg)Standard
Deviation (µg/kg)RSD(%) n
Certified Value(µg/kg)
EC-1 1850 0.07 3.78 3 2000 ± 54
EC-2 1430 0.09 6.60 4 1160 ± 70
EC-3 670 0.02 3.12 3 660 ± 54
Sample size = 2 g extracted into a final volume of 4 mL
EC-2 and EC-3 certified values were only provisional values at the time the work was conducted.The data presented herein were part of the validation data package used to confirm the certifiedvalues.
Data are taken from Reference 14.

8082A - 51 Revision 1November 2000
FIGURE 1. Example GC/ECD chromatogram of the Aroclor 1016/1260 mixture analyzed on aRtx-5/HP-608 column pair connected to separate injectors. The top trace is the Rtx-5 column (30-m x 0.53-mm ID, 1.5-µm film thickness) and the bottom trace is theHP-608 column (30-m x 0.53-mm ID, 0.5-µm film thickness). Temperature program:150EC (1.0 min hold) to 280EC (17 min hold) at 8EC/min.

8082A - 52 Revision 1November 2000
FIGURE 2. Example GC/ECD chromatogram of Aroclor 1221 analyzed on a Rtx-5/HP-608column pair connected to separate injectors. The top trace is the Rtx-5 column (30-m x 0.53-mm ID, 1.5-µm film thickness) and the bottom trace is the HP-608 column(30-m x 0.53-mm ID, 0.5-µm film thickness). Temperature program: 150EC (1.0min hold) to 280EC (17 min hold) at 8EC/min.

8082A - 53 Revision 1November 2000
FIGURE 3. Example GC/ECD chromatogram of Aroclor 1232 analyzed on a Rtx-5/HP-608column pair connected to separate injectors. The top trace is the Rtx-5 column (30-m x 0.53-mm ID, 1.5-µm film thickness) and the bottom trace is the HP-608 column(30-m x 0.53-mm ID, 0.5-µm film thickness). Temperature program: 150EC (1.0min hold) to 280EC (17 min hold) at 8EC/min.

8082A - 54 Revision 1November 2000
FIGURE 4. Example GC/ECD chromatogram of Aroclor 1242 analyzed on a Rtx-5/HP-608column pair connected to separate injectors. The top trace is the Rtx-5 column (30-m x 0.53-mm ID, 1.5-µm film thickness) and the bottom trace is the HP-608 column(30-m x 0.53-mm ID, 0.5-µm film thickness). Temperature program: 150EC (1.0min hold) to 280EC (17 min hold) at 8EC/min.

8082A - 55 Revision 1November 2000
FIGURE 5. Example GC/ECD chromatogram of Aroclor 1248 analyzed on a Rtx-5/HP-608column pair connected to separate injectors. The top trace is the Rtx-5 column (30-m x 0.53-mm ID, 1.5-µm film thickness) and the bottom trace is the HP-608 column(30-m x 0.53-mm ID, 0.5-µm film thickness). Temperature program: 150EC (1.0min hold) to 280EC (17 min hold) at 8EC/min.

8082A - 56 Revision 1November 2000
FIGURE 6. Example GC/ECD chromatogram of Aroclor 1254 analyzed on a Rtx-5/HP-608column pair connected to separate injectors. The top trace is the Rtx-5 column (30-m x 0.53-mm ID, 1.5-µm film thickness) and the bottom trace is the HP-608 column(30-m x 0.53-mm ID, 0.5-µm film thickness). Temperature program: 150EC (1.0min hold) to 280EC (17 min hold) at 8EC/min.

8082A - 57 Revision 1November 2000
Start
7.1 Choose appropriateextraction technique and
extract sample.
7.2 Perform extractcleanup, if necessary.
7.3-7.5 Establishchromatographic
conditions. Performinitial calibration.
Establish retention timewindows.
7.6 Perform GC analysisof sample extracts.
7.6.4 Identify samplepeaks.
7.6.5 Doesresponse fall
within calibrationrange.
7.6.7-7.6.9 Dobracketing standards meet the QC limits?
7.7-7.9 Qualitative andQuantitative peak
identification.
Stop
Take corrective action. (Extract cleanup or
system adjustment maybe necessary.)
7.6.5 Dilute extract.
Take corrective action. (Extract cleanup or
system adjustment maybe necessary.)
7.6.10 Any sample peakinterferences?
No
No
Yes
No
Yes
Yes
METHOD 8082A
POLYCHLORINATED BIPHENYLS (PCBs) BY GAS CHROMATOGRAPHY