pcbs (polychlorinated biphenyls) ddt
TRANSCRIPT

Euro Chlor Risk Assessment for the Marine Environment OSPARCOM Region - North Sea
June 2002
PCBs (Polychlorinated biphenyls)
DDT (Di(para-chloro-phenyl)-trichloroethane)
Dioxins

2
TABLE OF CONTENTS INTRODUCTION 3 PCBs (Polychlorinated biphenyls) 4 DDT (Di(para-chloro-phenyl)-trichloroethane) 12 DIOXINS 18 REFERENCES 27

3
EURO CHLOR RISK ASSESSMENT FOR THE MARINE ENVIRONMENT OSPARCOM REGION NORTH SEA
INTRODUCTION
While participating in the European Union programme on risk assessment of existing chemicals, Euro Chlor, representing all major European chlorine producers, recognized the need to focus risk evaluation on chemicals linked to the chlorine production. In view of concerns about specific risks for the marine environment as a final sink for all watercourses, Euro Chlor considers it necessary to focus on this specific environmental compartment with emphasis on the North Sea. This area has been extensively studied and controlled by the Oslo and Paris Convention for the Prevention of Marine Pollution (OSPARCOM) for which organohalogen compounds have been considered specifically. Therefore Euro Chlor has voluntarily agreed to carry out risk-assessments of 25 chemicals related to the chlorine industry. This voluntary exercise aimed at using the formal EU risk assessment methodology laid down in the European Commission Regulation (1488/94) and following closely the principle of the Technical Guidance Document (TGD, 1996) of the EU Existing Substances Regulation (793/93). Risk assessments of five compounds have already been published (Calow, 1998). Similar reports for 7 other compounds are in press and an additional set of 9 is in preparation and well advanced. Preparatory work for assessing the risk linked to DDT, PCBs and dioxins has also been carried out by Euro Chlor. For instance, literature data on aquatic (marine) toxicity and environmental occurrence (monitoring data) have been collected. For these chemicals however, a considerable know-how has also been built up by various other bodies and individuals within academia, governmental institutes, regulatory bodies and industry. The current knowledge on these chemicals and in most cases the available data is considered to be sufficient to justify the need for risk reduction measures. This is the reason why these chemicals are already strictly regulated and several risk reduction measures have been taken. Euro Chlor has contributed to these measures and is also active in the follow up of their results in particular by monitoring emissions and environmental concentrations. As risk reduction measures already exist, it is considered as no more useful to carry out detailed risk assessments for these chemicals for the marine environment as part of the Euro Chlor voluntary programme mentioned above. For completeness, a short document for each of these substances or group of substances has been prepared. These short papers will present an overview of some important environmental characteristics, regulatory background, monitoring data, as well as the Euro Chlor position on risk management of these chemicals.

4
PCBs
Polychlorinated biphenyls General background The polychlorinated biphenyls (PCBs) are a group of chemical substances with the general chemical formula :
Figure 1 which can contain chlorine at the numbered positions, as shown in Figure 1. The degree of chlorination ranges from 1-10 chlorine atoms in the molecule. There are 209 substances of this kind. In expert’s language, PCBs with a different number of chlorine atoms are called “congeners”, and with the same chlorine content but at different positions, “isomers”. The industrial production started in 1929 and reached a maximum in the 70’s. PCBs are produced by chlorination of biphenyl with anhydrous chloride. The result is a mixture of different congeners, which is purified by neutralisation and distillation. PCBs are no longer manufactured in Europe and in the US. The industrially produced PCB mixtures are colourless liquids. Their viscosity, their density and their lipid solubility increase with increasing the chlorine substitution, whereas their water solubility and vapour pressure decrease. The value of PCBs for industrial applications is related to their chemical inertness, resistance to heat, low flammability, low vapour pressure, high dielectric constant and low acute toxicity. These properties made them particularly suitable, for applications such as dielectrics in transformers and large capacitors, as heat exchange fluids and filler of hydraulic tools. They also found wide-spread use as lubricants for turbines and pumps and in the formulation of cutting oils for metal treatment, sealings, adhesives, paints and carbonless copy paper. Due to their chemical stability – originally seen as a useful characteristic – and their lipophilicity the PCBs appeared to be very persistent in the environment and to associate with the organic components of soils, marine sediments and biological tissues, in which they can accumulate and then enter the food chain. They are distributed in the environment due to long-range atmospheric transport and have been detected in the fatty tissues of animals and humans even in remote areas. Health concerns about PCBs was triggered by an incident in 1968, when 1850 people in Yusho (Japan) became ill after eating rice oil, which was accidentally, heavily contaminated with PCBs. Environmental concerns first surfaced in the late 1960’s, - some 30 years after PCBs were introduced - , when a Swedish scientist found that egg-shell thinning among seabirds, in relationship with bioaccumulation of PCBs led to reduced reproductive capacity.

5
High levels of PCBs in the environment have also been linked to the death of wildlife such as guillemots in the North Sea. Toxicological properties There is a vast amount of information of the effects of PCB mixtures and congeners on humans, animals and wildlife. Comprehensive overviews are given in the ‘CANTOX’ study (CanTox, Inc, 1994) and in the IPCS Monograph (IPCS, 1993). A short review has been made by Ritter et al. (1996) in a document presented to the Intergovernmental Conference on Land Based Pollution Sources in 1995 and submitted by the International Programme of Chemical Safety (IPCS) to the Intergovernmental Forum on Chemical Safety (Canberra 1996). These reports are summarised here after. The toxicological properties of PCBs are affected by the number and position of the chlorine atoms, as substitution in the ortho position hinders the rotation of the rings. PCBs without ortho substitution are generally referred to as coplanar and all others as non-coplanar. Coplanar PCBs can bind to the Ah receptor and may exert additional effects, which are not observed with non-coplanar PCBs. PCBs have a low acute toxicity to laboratory animals, with acute LD50 values in rats in the range of 2 to 10 g/kg body weight. Effects are manifested primarily through chronic exposure. Effects on the liver, skin, immune system, reproductive system, gastrointestinal tract and thyroid gland have been observed associated with exposure to PCB mixtures or individual congeners. PCBs are classified by IARC as probable human carcinogens (group 2A) with adverse effects being predominantly linked to high blood concentrations. A maximum daily intake of 0.2 µg/kg body weight has been proposed by IPCS (1993). PCBs are toxic to aquatic organisms, with 96-hour LC50 values in the range of 0.015 mg/l in fathead minnows to 2.74 mg/l in bluegills. PCBs have a low acute toxicity to birds, with 5-day dietary LC50 values in the range of 747 mg/kg diet in quail to more than 5 g/kg in several other species. There is growing evidence, which associates PCBs to reproductive and immunotoxic effects in wildlife. In laboratory studies, NOELs values for these effects in monkeys vary between 30 and 100 µg/kg body weight. Persistence and bioaccumulation in the environment The degradation of PCBs in the environment depends largely on the degree of chlorination of the biphenyl, with persistence increasing as the degree of chlorination increases. Half-lives for PCBs undergoing photodegradation in air range from approximately 10 days for a monochlorobiphenyl to 1.5 year for a heptachlorobiphenyl. PCB half-life is about 5 days in water and about 40 days in soil. The persistence of PCBs combined with their high lipophilicity provides the necessary conditions for them to bioaccumulate in living organisms. High bioconcentration factors (between 100 000 and 300 000) as well as high values of the octanol-water partition coefficients (log Kow ranging from 4.3 to 8.26 depending on the congener) have been reported. In fish, the bioconcentration occurs more via the direct uptake from water than through the diet. The chemical properties of PCBs (low water solubility, high stability and semi-volatility) favour their long-range transport in the environment, making them detectable in remote areas like in the arctic air, water and organisms. Regulatory aspects

6
The risks associated with PCBs have given rise to a number of national and international regulations (e.g. EU, UN-ECE Convention on Long-Range Transboundary Air Pollution on Persistent Organic Pollutants) whose aim is to eliminate the production, use and emission of PCBs and to destroy currently used PCBs in an environmentally sound manner. The use of PCBs in open applications such as printing inks and adhesives was banned in the European Community in 1976 under Directive 76/403/EEC. They were banned in the US in 1979. The use of PCBs as a raw material or chemical intermediate has been banned in the EU since 1985. In 1996 in the EU the 1976 Directive has been replaced by Directive 96/59/EC, adopted in September 1996. The new directive controls the disposal of PCBs (and polychlorinated terphenyls, PCTs) as well as equipment containing PCBs. Key features of this Directive are:
• within 3 years EU member states must submit an inventory and detailed plans for decontamination or disposal of contaminated equipment. These will have to cover all equipment containing more than 5 liters of PCB.
• A deadline of 2010 is set for complete destruction or decontamination of equipment containing PCBs. The only exception is for transformers containing less than 50 ppm of PCB, which are allowed to remain in service indefinitely.
However, the United Nations Environment Programme (UNEP) global treaty adopted at the Stockholm Convention on Persistent Organic Pollutants (May 2001) stipulates that the use in equipment shall be eliminated by 2025. This date is a minimum requirement and does not prevent individual governments, or groups of governments, from maintaining earlier phase-out dates. The Stockholm Convention will come into force after ratification by 50 states. So far (May 2002), only eight states have ratified the Convention. The Basel Convention (May 1992) adopted Technical Guidelines for PCB handling, disposal and destruction. Despite the existing regulations, there is still a substantial amount of PCB in use, because exemption has been given in many countries for contained use in existing equipment with long lifetimes, at least for an initial period after a production ban was decided. There are also quantities in storage awaiting disposal. The chemical industry is currently making a proposal to solve the disposal problem (ICCA/WCC Position Paper, 1999). Remaining sources of PCBs and environmental fate in the OSPAR region An informative assessment of PCB fluxes and inventories relevant to the OSPAR area has been reported in Axelman (1998). The results of this report are summarised hereafter and combined with the information coming from the report by Ritter et al. (1998). The total amount of PCBs produced in the world since 1929 is estimated to be between 1 and 1.2 million tons. The total amount of PCB released to the environment in the Northern Hemisphere is about 100,000 tons, 75% having been released between 1955 and 1970. Current emissions are much lower and are estimated to be between 10 and 100 tons per year both in the OSPAR area and in North America, the larger part of it coming from electrical equipment. Recent studies (Jansson et al., 1997) indicated that, in the OSPAR area, about 5000 t PCB could still be present in old buildings in the form of various surface coatings and sealant. If this is the case, large amount of PCBs could be emitted during demolition of buildings. Due to the persistent, semi-volatile character of the PCBs, the “old” emissions are still present in the environment and wide spread into the different compartments via a deposition-volatilisation redistribution mechanism. The “new” emissions should then be considered in a global approach, which takes into account inventories and annual losses.

7
Such an approach was developed by Axelman (1998) for both a trichloro- and hexachloro-biphenyl (PCB #28 and PCB #153). The results are summarised in table 1.
TABLE 1 PCBs inventories and fluxes according to Axelman (1998)
PCB# 28 PCB# 153 EMISSIONS Total “old” emission (t) 14 000 4 850 “New” emission (t/y) 6 0.6 INVENTORIES In atmosphere (t) 62 17 In surface water (t) 6 7 In deep water (t) 45 54 In shelf sediment (t) 10 53 In soil (t) 917 760 In biomass and litter (t) 122 74 TOTAL (t) 1 117 950 LOSSES / DEGRADATION In atmosphere (t/y) 92 3.5 In sea water (t/y) 1 1.3 In sediment (t/y) 1 5 In soil and biomass (t/y) 0.3 0.2 TOTAL (t/y) 94.3 10 TOTAL (% inventory/y) 8 1 These results indicate that the major part of the existing PCBs is adsorbed in soil, litter and sediment. They are progressively volatilised in the atmosphere where the main degradation takes place. The overall degradation process is however very slow, in particular for the highly chlorinated congeners. In this context, the present emissions may act as a continuous supply to maintain constant the atmospheric concentrations. It has to be pointed out that the concentration of PCBs in the atmosphere logarithmically decreases with increasing latitude, indicating a probable temperature effect. Monitoring data and temporal trends. To follow the effects of the risk reduction measures, Euro Chlor is collecting monitoring data on a broad range of chlorinated chemicals, including PCBs. The temporal variations of PCB sales in the US, indicating a clear drop in the early 70’s (Christensen and Lo, 1986) are shown in Figure 2 hereafter. Fig. 2:Sales of PCBs in the US from 1957 to
1974

8
The decrease in sales of PCBs is associated with a strong decrease in human intake through the diet as demonstrated by the results of a study made by the US FDA (Gunderson, 1988) and illustrated in Figure 3.
Fig. 3: PCB daily intake by adults via diet according to US FDA report (Gunderson, 1988) In the period 1982-1984, the daily intake level by humans is estimated in the range 0.5 to 1 ng / kg body weight per day. A very detailed statistical study of PCB concentrations in different biota in the Baltic Sea area was recently published by Bignert et al. (1998). Some of the observed trends are given in the Figures 4 a, b and c here after. Clear decreases in concentrations, between 4 and 10% per year, are observed over the two last decades.

9
Fig. 4: a – b - c Total PCB concentration (µg/g lipid weight) in herring muscle of southern Baltic Proper (a), in cod liver of the Swedish west coast (b) and in guillemot eggs of the Baltic Proper (c). The calculated log-linear regression lines are shown.
In the AMAP Assessment Report (1998), temporal trends of PCB concentrations in various media of the Arctic are given. • In air, the study indicates the “absence of any overall temporal trend for the time period
from 1964/65 to 1992/93”. As previously noted, this steady state probably comes from the PCB continuous revolatilisation process from soil and ocean surface.
• In terrestrial environment, the PCB concentrations in moss collected in remote sites in Norway decrease with time in all locations from 1977 to 1990. Similarly, a “substantial decline” of PCB concentrations in UK soils is observed after the early 70’s. In mustelids living in Sweden, the PCB concentrations have been divided by a factor of 5 between 1970 and 1992. The current PCB levels in polar bear indicate that in some locations the populations are still at risk for reproductive and immunosuppressive effects.
• In freshwater environment, historical profiles of PCBs in lake’s sediment are similar to the production or sales functions, but shifted in time depending on the latitude.
• In marine environment, PCB levels in eggs of various seabirds living in Canadian High Arctic are reported to have significantly decreased (by a factor from 2 to 5) over the period 1975-1993. Similarly, PCB concentrations in blubber of Holman Seals declined to about 20% of their initial value between 1972 and 1991. In cetaceans (beluga) or in mammals like polar bear or Arctic fox, there is no significant decline in PCB concentrations between 1982 and 1993. The period of observation is however considered too short to make any conclusion.
In eel caught in Dutch surface water between 1977 and 1990, the PCB concentration is also decreasing in all locations, as shown in Figure 5 hereafter.

10
1983 1983.51984 1984.51985 1985.51986 1986.51987 1987.519881000
1500
2000
2500
3000
3500
4000
Year
PCB concentration in eel from Dutch surface water (KEMI, 1996) Finally, a statistical analysis of monitoring data from the WRc database (1998) indicates decreasing trends of PCB concentrations in fresh water (UK data) as well as in mollusks from the North Sea (Norway data) as illustrated in Figures 6 a and 6 b hereafter.
1975 1980 1985 1990 199515
20
25
30
35
40
45
50
55
60
65
Year Fig. 6 a Fig. 6 b Statistical analyses of temporal trends in PCB concentrations in UK rivers (a) and in North Sea mollusks (b). The lines indicate the statistically significant slopes of the observed trends for different time intervals over the period. Chemical industry position Even if it has been proven to be a difficult task to find suitable substitutes to PCBs particularly for existing equipment with long lifetimes, such as transformers, the chemical industry worldwide drastically reduced its production in the early 70’s. By the 80’s, all the chemical companies, members of ICCA/WCC/Euro Chlor, had stopped production and marketing of PCBs. Today, ICCA/WCC/Euro Chlor and their member companies • consider it appropriate that equipment containing PCBs are labeled and regularly
inspected for any leakage • support the call for safe and environmentally sound destruction of all PCBs. There are
several destruction methods for PCBs such as incineration, gas-phase chemical reduction, molten metal technology and plasma energy pyrolysis. High temperature destruction in special incinerators for hazardous waste is the primary option (KEMI, 1996).

11
EURO CHLOR POSITION
No Euro Chlor members manufacture PCBs. Euro Chlor has from the beginning supported POP negotiations and welcomes the balanced and workable regime set up by the Stockholm Convention and its science-based approach which is set to fully protect public health and the environment. Euro Chlor welcomes the reference to Best Available Techniques for destruction of POP wastes and believes that the rapid destruction of withdrawn PCBs should be mandatory. The main destruction method is incineration; a number of specialized chemical waste disposal companies have approved high-temperature incineration processes suitable for safely destroying PCBs. For this purpose only, certain restrictions on the international transport of these chemicals may need to be lifted. This will allow the safe destruction of PCBs in well suited industrial units instead of illegal spillage or uncontrolled storage and destruction in different parts of the world. Euro Chlor is ready to assist in the destruction programmes of PCBs by providing the appropriate incineration facilities. This position is fully in line with the ICCA/WCC Position Paper presented at the UNEP-INC3 meeting in Geneva, September 6-10, 1999.

12
DDT (Di(para-chloro-phenyl)-trichloroethane)
General background DDT was widely used during the Second World War to protect troops and civilians from the spread of malaria, typhus and other vector borne diseases. After the war, DDT was widely used on a variety of agricultural crops and for the control of disease vectors as well. It is still being produced and used for controlling mosquito vectors of malaria in numerous countries. DDT is insoluble in water and is soluble in most organic solvents. It is semi-volatile and can be expected to partition into the atmosphere as a result. Its presence is ubiquitous in the environment and residues have been detected in remote regions like the Arctic. It is lipophilic and partitions readily into the fat of living organisms. It has been demonstrated to bioconcentrate and to biomagnify. Moreover its breakdown product (DDE), resulting from the dehydrochlorination of the aliphatic part of the molecule, is also present virtually everywhere in the environment. DDT is no longer produced in Europe. Its use was banned in the US in 1972 and since then, either banned or severely restricted in 68 other countries. In Europe such restrictions were put in place in 1979. These decisions were based on the carcinogenicity of DDT observed in mice as well as on its high persistence in the environment. The ubiquitous presence and persistence of DDT in the environment were considered sufficient to indicate unreasonable risk to fish and birds. Toxicological properties There is a vast amount of information on the effects of DDT on humans, animals and wildlife. Several reviews have been published (1-3) which are summarised hereafter. The mechanism of action of DDT and DDE generally involves an alteration of the electro-physiological and enzymatic properties of the membranes of nerve cells (Smith, 1991). Such effects will influence the Na+ and K+ ion flux across the nerve cell membranes disturbing nerve pulse transmission (CanTox, 1994). This is a non-specific mechanism of action across animal species, affecting both target species (usually insects) as well as non-target species, including mammals, the difference in sensitivity only depending on the exposure level. Apart from the neurotoxic effects to both target and non-target organisms, toxicity of these chemicals has also been related to modifications in the structure and functioning of endocrine organs and to the induction of hormonal changes (Smith, 1991; Singh et al., 1985; Baggett et al., 1980). There is some evidence to suggest that DDT may be suppressive to the immune system (Ritter et al., 1996). IARC has classified DDT as a possible human carcinogen (Group 2B). DDT is not highly acutely toxic to laboratory animals, with acute oral LD50 values in the range of 100 mg/kg body weight for rats to 1 770 mg/kg for rabbits. At a dietary level of 25 ppm, no effects on fertility, viability or survival were observed in a six generation reproduction study in mice. A level of 250 ppm produced clear adverse reproductive effects.

13
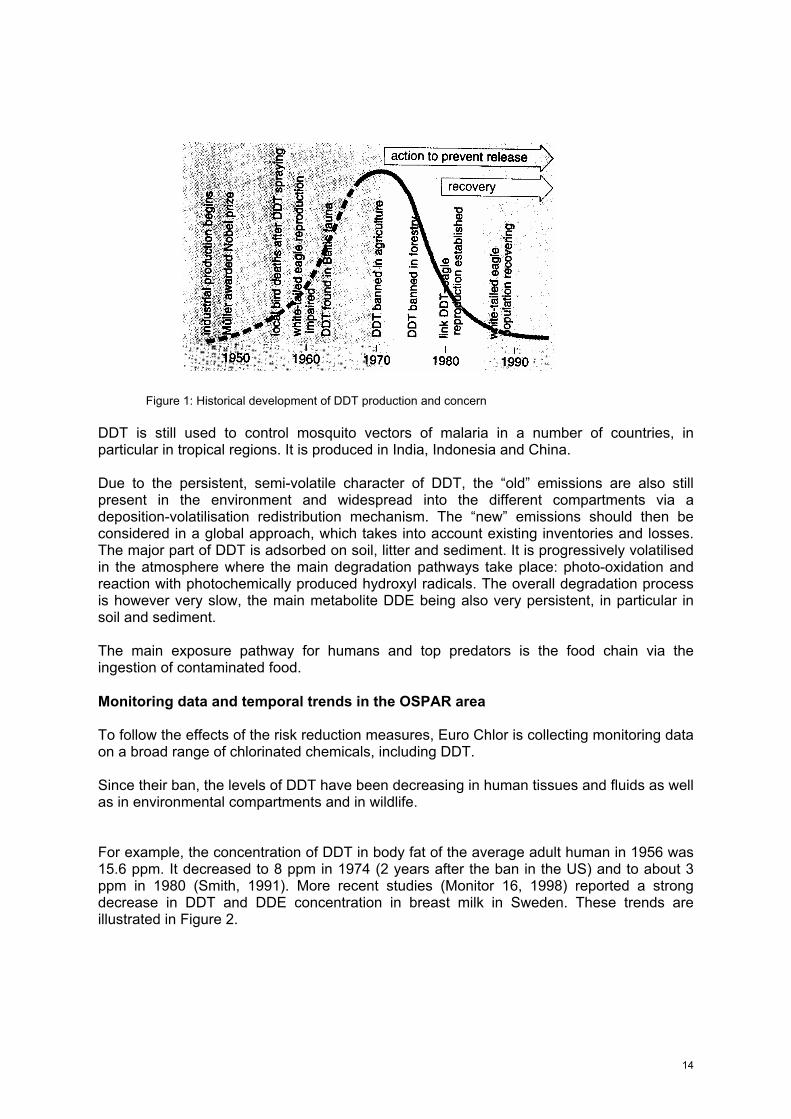
DDT is however highly toxic to aquatic organisms, with 96-hour LC50 values in the range of 0.4 µg/l for shrimp to 42 µg/l for rainbow trout. DDT is acutely toxic to birds with acute oral LD50 values in the range of 595 mg/kg body weight in quail to 1 334 mg/kg in pheasant. Persistence and bioaccumulation in the environment DDT and DDE are very persistent in the environment, as much as 50% remaining in the soil 10-15 years after application. This persistence, combined with a high octanol-water partition coefficient (the log Kow being in the range 4.89 to 6.91), provides the necessary conditions for DDT to bioconcentrate in organisms. Bioconcentration factors of 154 000 and 51 355 have been recorded for fathead minnows and rainbow trout, respectively. In aquatic organisms, the bioconcentration occurs more via the direct uptake from water than through the diet. Its ability to bioaccumulate in biological tissues and consequently its occurrence in higher trophic levels in the food chain (biomagnification) are considered responsible for the chronic toxicity of DDT to wildlife (CanTox, 1994). The chemical properties of DDT (low water solubility, high stability and semi-volatility) favour its long-range transport. DDT and its metabolites have been detected in all compartments (air, water, soil and living organisms) in remote areas. The ubiquitous presence of DDT and its metabolite DDE in the environment and in wildlife illustrates its overall persistence. Regulatory aspects The risks associated with DDT have given rise to national and international regulations (e.g. EU, UN-ECE Convention on Long-Range Transboundary Air Pollution on Persistent Organic Pollutants) whose aim is to eliminate the production and use of DDT. The same objectives are envisaged by the United Nations Environment Programme (UNEP) global treaty adopted at the Stockholm Convention on Persistent Organic Pollutants (May 2001). This Convention will come into force when ratified by 50 states, in May 2002 only eight states have ratified. In the EU, various Directives regulating the use of DDT have been issued in the late 70’s: EU Directive 76/464 on dangerous substances in water and EU Directive 79/117 Annex I, indicating that DDT may not be marketed or used as pesticide. Remaining sources and environmental fate The largest use of DDT was in agriculture. Before 1970, 80% of the production was used for treating cotton in the US and for treating cereals and top fruit in Europe. DDT was also used in the 50’s as a sheep-dip and as dusting powder for poultry. Its total use declined during the 60’s but was still substantial in the 70’s and early 80’s. Thereafter its use in Europe virtually ceased in response to regulations imposed by the European Union. There is however evidence that DDT has been used or discharged into the environment as recently as 1990 (Wells et al., 1994). DDT is still used in Europe as an intermediate in the production of dicofol, in closed chemical process, but to our best knowledge, there is no more DDT production in Europe. A history of DDT production and concern is presented in Figure 1.
14
Figure 1: Historical development of DDT production and concern DDT is still used to control mosquito vectors of malaria in a number of countries, in particular in tropical regions. It is produced in India, Indonesia and China. Due to the persistent, semi-volatile character of DDT, the “old” emissions are also still present in the environment and widespread into the different compartments via a deposition-volatilisation redistribution mechanism. The “new” emissions should then be considered in a global approach, which takes into account existing inventories and losses. The major part of DDT is adsorbed on soil, litter and sediment. It is progressively volatilised in the atmosphere where the main degradation pathways take place: photo-oxidation and reaction with photochemically produced hydroxyl radicals. The overall degradation process is however very slow, the main metabolite DDE being also very persistent, in particular in soil and sediment. The main exposure pathway for humans and top predators is the food chain via the ingestion of contaminated food. Monitoring data and temporal trends in the OSPAR area To follow the effects of the risk reduction measures, Euro Chlor is collecting monitoring data on a broad range of chlorinated chemicals, including DDT. Since their ban, the levels of DDT have been decreasing in human tissues and fluids as well as in environmental compartments and in wildlife. For example, the concentration of DDT in body fat of the average adult human in 1956 was 15.6 ppm. It decreased to 8 ppm in 1974 (2 years after the ban in the US) and to about 3 ppm in 1980 (Smith, 1991). More recent studies (Monitor 16, 1998) reported a strong decrease in DDT and DDE concentration in breast milk in Sweden. These trends are illustrated in Figure 2.

15
Similar trends are observed in wildlife as illustrated on Figures 3 and 4 .
Figure 3: DDE levels in lake trout from Lake Ontario (CanTox, 1994)
Figure 2: DDT and DDE levels in breast milk in Sweden (Monitor 16, 1998)
Figure 4: (A) (B) (C)
Total DDT (DDT+DDE) concentrations in biota from Baltic Proper (µg/g lipid weight) in herring muscle (A), in cod liver (B) and in guillemot eggs (C). The calculated log-linear regression lines are shown. According to Bignert et al. (Bignert et al., 1998) Total DDT concentrations in marine fish from the Swedish Sea have fallen by an average of 9-12 percent per year since monitoring began around 1970. In the same time the ratio between DDT and its metabolites (DDD and DDE) decreases. Similar trends are observed in fresh water fish and in land birds and mammals (Monitor 16, 1998).

16
1974 1976 1978 1980 1982 1984 1986 1988 1990 1992 19941.5
2
2.5
3
3.5
4
4.5
5
5.5
Year1974 1976 1978 1980 1982 1984 1986 1988 1990 1992 19940
2
4
6
8
10
12
14
Year
In the AMAP Assessment Report (AMAP, 1998), temporal trends of DDT concentrations in various media of the Arctic are given. • In air, DDT related compounds are present at levels very close to detection limits at both
Canadian and Norwegian sampling sites, but the DDT found in the Russian snow and wet precipitation survey tend to be an order of magnitude higher than those reported for Canada.
• In terrestrial environment, studies on the Swedish Arctic population of peregrine falcon revealed a decline in concentration in eggs of p,p’-DDE from 12 µg/g wet weight in 1972 to 2.9 µg/g wet weight in 1991-1994. Similarly, median values of total DDT concentrations in otter muscle samples from Northern Sweden decrease from 2.6 in the 70’s to 0.14 µg/g lipid weight in the 90’s.
• In fresh water environment, a decrease of about 10% per year in muscle of pike from Swedish lakes is observed over the period 1968 to 1995.
• In the marine environment, significant declines in levels of p,p’-DDE in six of the seabird species breeding in Northern Norway are reported since 1983. Total DDT concentrations in Holman seals from Canadian Arctic did not fall significantly between 1972 and 1981, indicating continued input of DDT. Similarly, no significant changes were observed in DDT concentration in seal blubber and cetaceans (beluga) over the two last decade. In polar bear however, a decrease of about 40% in DDE levels is observed between 1983 and 1993, indicating a shorter clearance time for the bear than for the sea mammals.
A report from IFREMER (1993) indicated that the concentrations of DDT in mussels(Mytilus edulis) from the French coast has been decreased by a factor of 4-5 in the period between 1979 and 1991. The Swedish EPA (Monitor 16, 1998) acknowledge the recovery in wildlife reproduction (peregrine falcons, white-tailed eagle and Baltic seals) starting in the 80’s, thanks to a reduction of the DDT and DDE levels in the environment. Finally, a statistical analysis of monitoring data from the WRc database (WRc, 1998) indicates decreasing trends of DDT concentrations in mollusks from the North Sea as well as in fresh water and fresh water sediment. The decline in DDE and DDT concentration in UK rivers is illustrated in Figure 5 a and 5b.
Figure 5: (a) (b) Statistical analyses of temporal trends in DDE (a) and DDT (b) concentrations in UK rivers. The lines indicate the statistically significant slopes of the observed trends for different time intervals over the period.

17
Chemical industry position The chemical industry worldwide drastically reduced its production of DDT in the early 60’s. Presently, all Euro Chlor member companies have stopped production and marketing of DDT.
EUROCHLOR POSITION No Euro Chlor members manufacture DDT. Euro Chlor supports the inclusion of DDT on the international priority list of POPs and the use restriction approach agreed in the UN-ECE LRTAP Protocol

18
DIOXINS
General background The name “dioxins” refers to a group of 75 chemicals having the dibenzo-p-dioxin structure with various numbers of chlorine atoms substituted on various positions at the benzene rings. In practice however, furans (a group of 135 related compounds) are often also included in the term “dioxins. The general formulas of dioxins and furans are shown in Figure 1, where the chlorine atoms can occupy any of the numbered positions. Figure 1: Structural formula of dioxins and furans, see text for explanation In some cases, the word “dioxin” refers to a specific dioxin, i.e. 2,3,7,8,-tetrachlorodibenzo-p-dioxin (2,3,7,8, TCDD), which is generally considered as the most toxic one. Dioxins in a broad sense, including both dioxins (PCDDs) and furans (PCDFs), are mainly formed during combustion and incineration processes. Neither dioxins nor furans are produced commercially and they have no known use. In the presence of carbon, oxygen, hydrogen and chlorine dioxin-like compounds appear in flue gases of combustion in a temperature range of 200 to 400°C, especially in poor combustion conditions. For instance as a consequence of waste, wood, coal and other fuel combustion processes such as in municipal, hospital and hazardous waste incinerators, power plants, wood stoves and motor vehicles, dioxin formation can occur, if the well known 3 T rule is not followed. To avoid dioxin formation in combustion processes the Temperature has to be higher than 850°C, the residence Time longer than 2 seconds and the Turbulence optimised by appropriate furnace geometry. Natural dioxin formation processes include forest fires, volcanoes and compost heaps. Interest in dioxin has increased over the last 20 years due to the awareness of the contribution of man-made dioxin, and also to improved techniques for the measurement and detection of dioxin at extremely low levels. Major public interest in dioxins originated with the 1976 accident in Seveso (Italy) when a phenol dioxin mixture was released after an explosion at a trichlorophenol manufacturing plant. Dioxin also gained notoriety as a contaminant in “Agent Orange” which was used as defoliant during the Vietnam war. Due to their chemical stability and their lipophilicity, dioxins appeared to be very persistent in the environment and to associate with the organic components of soils, marine sediments and biological tissues, in which they can accumulate and then enter the food chain. They are distributed in the environment due to long-range atmospheric transport and have been detected in the fatty tissues of animals and humans even in remote areas, including the Arctic and Antarctic

19
Toxicological properties There is a large and constantly growing body of literature on dioxins. The available data show that it is hard to discuss the environmental characteristics and risks of dioxins in general terms, basically because of 3 essential complicating factors. 1. Dioxins are in fact a large, heterogeneous group of chemicals. The differences between
congeners, with respect to environmental characteristics such as ecotoxicity, bioaccumulation and environmental fate and therefore the associated risks, can be very large.
2. Most of the dioxin congeners are very hydrophobic. The hydrophobic nature is a complicating factor in studying the environmental characteristics. Regular ecotoxicity tests for instance, are designed for water-soluble compounds. By using additional solvents, concentrations in the test medium can lead to ecologically irrelevant levels. This has resulted in a number of data on dioxins, which are not suitable for risk assessment. In fact a similar problem occurs in determining the toxicity to humans, where high doses used in animal testing make it extremely difficult to estimate the risks at very low concentrations as found in the environment.
3. A large part of the body of evidence was generated for the 2,3,7,8 TCDD congener which is regarded as the most toxic one, but which is not necessarily the environmentally most relevant one.
As illustrated hereafter there is a large range in environmental characteristics (ecotoxicity and bioaccumulation) of the different congeners, for example: • The ecotoxicity of 2,3,7,8 TCDD to fish (Salmo gairdneri) in a properly designed flow-
through test with concentrations analysed over 28 days of exposure (validity 1 according to EU classification) resulted in an LC50 of 0.046 ng/L and a NOEC of 0.038 ng/L (Mehrle et al., 1988). Recently, the toxicity of octachlorinated dioxins and furans (OCDD and OCDF) was examined in a 32 days study conducted with early-life stages of zebra fish (Brachydanio rerio) in a flow-through experimental set-up (validity 1 according to the EU classification). Saturated concentrations were generated in the test vessels with measured values of 32 and 34 ng/L, respectively, and no toxic effects were detected (Berends et al., 1997).
• In the same study (Berends et al., 1997), a review of data from laboratory experiments also demonstrated a lack of biomagnification of OCDD and OCDF. In contrast bioconcentration factors for 2,3,7,8 TCDD of up to 40.000 have been observed (Mehrle et al., 1988).
• Other experiments by Berends et al. (1998) with 14C labeled OCDD and OCDF spiked to sediments revealed no significant difference between the controls and organisms exposed to 10 and 100 µg/kg (d.w. sediment).
These examples illustrate that, due to huge differences in ecotoxicity and bioaccumulation potential between the various dioxin congeners, it is virtually impossible to determine environmental risks for dioxins without considering individual congeners. The concept of toxic equivalent factors (TEQs) has been developed to deal with the complex situation resulting from the large range of eco-toxicological properties of dioxins. The TEQ concept is based on the assumption that dioxin-like compounds share a common mechanism of action – binding to the Ah-receptor. By applying this TEQ concept, the toxicity of the different congeners relative to that of 2,3,7,8-TCDD is determined on the basis of in vivo and in vitro data. Substantial evidence indicated that the TEQ approach is equally valid for human risk assessment as for wildlife. The TEQ is defined to be an order of magnitude estimate of the toxicity of a compound relative to the toxicity of TCDD. A recent

20
update of the TEQs has been published by WHO (Van den Berg et al., 1997), in which differences of 4 orders of magnitude in the toxicity of the various congeners are reported. As stated by IFCS (Ritter et al., 1996): “TEQs are regarded as risk management tools and they do not necessarily represent actual toxicity with respect to all endpoints. Rather, they tend to overestimate the toxicity of mixtures.” There is a vast amount of information of the effects of dioxin mixtures and congeners on humans, animals and wildlife. A short review (Ritter et al., 1996) has been made by L. Ritter et al. (1996) in a document presented to the Intergovernmental Conference on Land Based Pollution Sources in 1995 and submitted by the International Programme of Chemical Safety (IPCS) to the Intergovernmental Forum on Chemical Safety (Canberra 1996). Overviews are given in several studies (CanTox, 1994; Smith, 1991) and a comprehensive survey is currently under development by the US-EPA (in preparation). These reports could be summarised as follow: • At the present time, the only persistent effect associated with dioxin exposure in
humans is chloracne. Other health effects, like peripheral neuropathies, depression, hepatitis, abnormal enzyme levels, have been observed though no causal relationships were established in every case.
• The acute oral toxicity in laboratory animals is highly variable, the most common effects being wasting, lymphoid involution, hepatotoxicity, chloracne and epidermal changes. Observed effects depend not only on the congener but also on the species studied.
• Dioxins, specifically 2,3,7,8-TCDD, are associated with a variety of adverse effects on the reproductive systems of both male and female rats. IARC has concluded that there is sufficient evidence for carcinogenicity of 2,3,7,8-TCDD in experimental animals and has classified this congener as human carcinogen (Group 1). The other congeners are deemed not classifiable as to their carcinogenicity in humans (Group 3).
Persistence in the environment The degradation of dioxins in the environment depends largely on their degree of chlorination and on the position of chlorine atoms in the molecule. The persistence increases as the degree of chlorination increases. Half-lives for dioxins undergoing degradation in air (the OH radical reaction being the predominant pathway) range from 1 to 10 days. The degradation process depends on the presence of particulate matter, on which dioxins can be adsorbed. In water, the measured biodegradation half-lives of TCDD are reported to range between 1.1 and 1.6 years, while its photolysis half-life varies from 21 hours in the summer to 118 hours in the winter. The biodegradation half-life varies between 1 to 12 years in soil and between 4 to 6 years in sediment, the adsorbed forms of the dioxins being not easily bioavailable. It is concluded that the more highly chlorinated (i.e., tetra-CDD/Fs and above) congeners are persistent in the environment (Environment Canada, 1997). The persistence of dioxins combined with their high lipophilicity provides the necessary conditions for them to bioaccumulate in living organisms. High values of the octanol-water partition coefficients (log Kow ranging from 4.75 to 8.20 depending on the degree of chlorination) have been reported. Dioxins are not metabolised at a significant rate by invertebrates and therefore they may biomagnify through the diet in invertebrate food chains. Dioxins that do not possess chlorine at all four 2,3,7 and 8 positions do not bioaccumulate in vertebrates (except in cetaceans). Clearance rates of 2,3,7,8-TCDDs/TCDFs are low enough to allow biomagnification to occur in food chains, in the order of 3- to 10-fold per trophic level (Carey et al., 1998). The cetaceans’ metabolism makes them able to easily eliminate the 2,3,7,8 TCDDs/TCDFs congeners.
21
The chemical properties of dioxins (low water solubility, high stability and semi-volatility) favour their long-range transport in the environment, making them detectable in remote areas such as in the arctic air, water and organisms. Regulatory aspects The risks associated with dioxins have given rise to national and international regulations (e.g. EU, UN-ECE Convention on Long-Range Transboundary Air Pollution on Persistent Organic Pollutants) with the aim to reduce the dioxin emissions. As dioxins were never commercially produced but are unavoidable by-products of several high temperature processes like combustion and incineration, the Best Available Technique (BAT) concept should be applied to properly manage emission levels. The same objectives are envisaged by the United Nations Environment Programme (UNEP) global treaty adopted at the Stockholm Convention on Persistent Organic Pollutants (May 2001). This Convention will come into force when ratified by 50 states, in May 2002 only eight states have ratified. In the EU, several Directives have been published for limiting dioxin emissions during waste incineration. Both municipal (EEC 89/36) and hazardous (EEC89/429) waste incineration have been regulated. In 1994, a limit of 0.1 ng TEQ dioxin / m3 exhaust air has been set for hazardous waste incinerators (EC 94/67). This value will also apply to all types of waste in the near future as proposed by the political agreement COM 98/558. In this agreement a limit of 0.3 ng TEQ dioxin/l scrubber water is also recommended for new incineration plants. In Germany, a regulation stipulates that any marketed product should have less than 2 ppb of 2,3,7,8-TCDD and less than 5 ppb for the sum of other congeners. Remaining sources of dioxins In particular, uncontrolled combustion processes are important primary sources of dioxins (Wormgoor, 1994; Quass and Fermann, 1997). Many thermal processes, which involve burning of organic and inorganic compounds containing chlorine atoms (e.g. sodium chloride), may result in the formation of dioxins. Of special importance is the incineration of various types of municipal, hospital and hazardous waste. Production of steel and non-ferrous metals (copper, magnesium, nickel, …) are other important sources. The chemical industry is not a major source of dioxin. Several national inventories have been published (Wormgoor, 1994; RIVM, 1993; Her Majesty Inspectorate for Pollution, 1995), but the most recent one covering 17 countries of Europe (Quass, 1997) is summarised hereafter. • A total annual PCDD/F air emission of 6 500 g TEQ is estimated to be released by all
known sources in the 17 countries considered. Assuming that the emissions are uniformly deposited on the surface area of these countries, an average deposition rate of about 5 pg TEQ / m2.day can be calculated. This value compares quite well with the lower limit of deposition rates estimated to be 5-20 pg TEQ / m2.day for rural areas in Germany.
• The major industrial emission sources in Europe, accounting for about 62% of the total dioxin air emissions are municipal waste incinerators, iron ore sinter plants, hospital waste incinerators and facilities of the non-ferrous metal industry.
• The remaining 38% are dominated by non-industrial sources, like domestic heating facilities (particularly wood combustion), accidental fires and road traffic.
• The total annual air emissions could be reduced by about 50% if the emission from the main industrial sources could comply with the 0.1 ng TEQ/m3 limit value recommended by the European Commission. The abatement technology required for this purpose is state of the art and may be applied to all important industrial emission sources.

22
As waste incinerators have been for a long time considered as major sources of dioxins, several studies (Wehlow et al., 1997; Ballschmitter, 1990) have been carried out to determine if there is a relationship between chlorine input and dioxins output in field experiments. All the studies concluded that there is no significant relationship between chlorine in incinerator feeds and dioxin emissions from waste incinerators. The only way to effectively control the dioxin emissions is to apply Best Available Techniques (BAT) on process design and abatement techniques. Industrial incineration processes are also complying to stringent standards and the chlor-alkali industry currently has a number of approved, high-temperature incineration processes operational, suitable for destroying chlorinated chemicals, with extremely low dioxin emissions. Chemical processes where PCDD/PCDF can be formed have either been stopped (e.g. PCB production) or best available techniques (BAT) have been installed to drastically reduce their emissions into the environment. A good illustration of this approach is the self-regulatory Charter adopted by the European PVC industry, which includes dioxin emission guidelines based on Best Available Technique (ECVM, 1994). Environmental burden and exposure pathways The largest part of dioxin emissions occurs to the atmosphere where partition between gas and particulate phases quickly takes place. The partitioning varies with the congeners according to their octanol/air partition coefficient (log Koa varies from 7 to 12 depending on the chlorination degree). More than 90% of the dioxins in the atmosphere are present in the adsorbed form, the concentration being higher on smaller particles. The long range transport and further deposition of dioxins occur via atmospheric routes, the behaviour and fate depending on the particle size. Due to the persistent, semi-volatile character of dioxins, the “old” emissions are still present in the environment and widespread into the different compartments via a deposition-volatilisation redistribution mechanism. The “new” emissions should then be considered in a global approach, which takes into account inventories and annual losses. The physico-chemical properties of dioxins as well as their half-lives in the various environmental compartments indicate that the main historical burden of dioxin is stored in soil and sediment. Soil can then act as a secondary source of dioxins through volatilisation or resuspension of soil dust particles, but at the present time, soil outgassing of dioxins is unlikely to make a significant contribution to the total annual atmospheric emissions (Duarte-Davidson et al., 1997). However, in the future, if primary dioxin emissions are reduced, recycling of previously emitted PCDD/F back to the air will assume greater relative importance as a source. The main exposure pathways of living organisms are: • Air-deposition-soil-plants-grazing animals and wildlife-dairy products and food-humans • Air-deposition-water bodies-wildlife-humans/top predators More than 95% of human exposure to dioxins occurs via the food chain (dairy products, meat and oils) and only to a very limited extent via inhalation (Rappe, 1996). Monitoring data and temporal trends. At the Dioxin 97 Conference, one of the most important issues discussed was the significant decrease in emissions and environmental levels of dioxins, both in Europe and North America. The following findings have been reported:
23
• Since 1970, dioxin accumulation rates have dramatically decreased in the Great Lakes (Pearson)
• Rappe reported significant decreases in dioxins in sewage sludge in Switzerland of almost two orders of magnitude between 1989 and 1995
• Atmospheric dioxins in the UK and Germany have steadily decreased from 1980 to 1996. There has also been approximately a 5-fold decrease in dioxin intake from food from 1982 to 1992 (Jones)
• In Germany, from 1989 to 1996 there has been a 50% decrease in dietary dioxin intake and a 60% decrease in dioxins in breast milk. In 1996, adult exposures were below the TDI value of 1 pg TEQ / kg-day.
• According to US-EPA, dioxin exposures demonstrate a bell-shaped distribution with a peak around 1967 to 1969. Expressed in pg TEQ/ kg-day, exposures were 0.1 at the beginning of the century, 30 in the sixties and 1 in the nineties (Lorber).
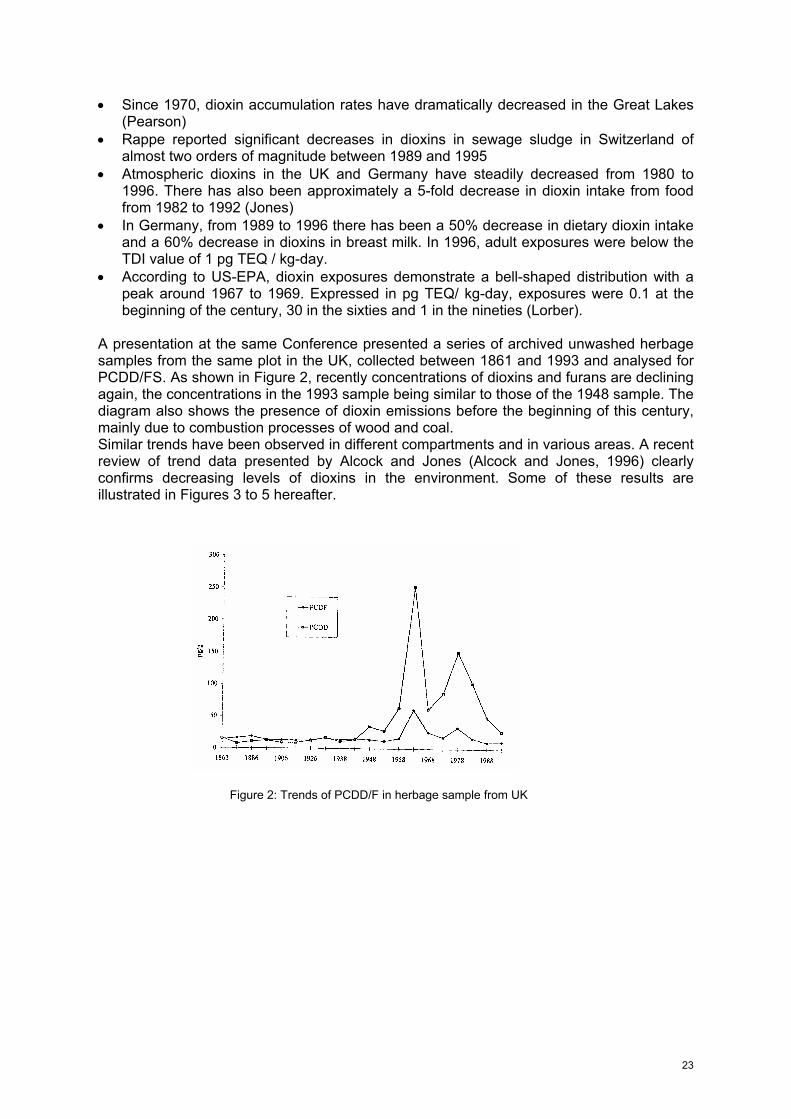
A presentation at the same Conference presented a series of archived unwashed herbage samples from the same plot in the UK, collected between 1861 and 1993 and analysed for PCDD/FS. As shown in Figure 2, recently concentrations of dioxins and furans are declining again, the concentrations in the 1993 sample being similar to those of the 1948 sample. The diagram also shows the presence of dioxin emissions before the beginning of this century, mainly due to combustion processes of wood and coal. Similar trends have been observed in different compartments and in various areas. A recent review of trend data presented by Alcock and Jones (Alcock and Jones, 1996) clearly confirms decreasing levels of dioxins in the environment. Some of these results are illustrated in Figures 3 to 5 hereafter.
Figure 2: Trends of PCDD/F in herbage sample from UK

24
PCDD/F concentrations in soil
020406080
100120140
1957 1962 1967 1972 1977 1982 1987 1992
Year
ng/k
g d.
w.
Figure 3: PCDD/F content of laminated marine sediment core from the Baltic Proper This result suggests that there is some degradation of dioxins in sediments. This was supported by a study carried out in the Rhine estuary (Beurkens et al., 1995) where a microbibal dechlorination of highly chlorinated dioxins is observed. A recent study (Alcock et al., 1998) on historical samples of soils shows that PCDD/F were present in the late 1800s at readily detectable levels and that the soil has acted as a sink for atmospheric dioxins in recent decades due to their high persistence. An increase in dioxin concentrations in soil was still observed between 1957 and 1987, indicating that the rate of deposition exceeded the net rate of disappearance. This is illustrated in Figures 4 and 5 hereafter.
Figure 4: PCDD/F congener concentrations in Figure 5: PCDD/F concentrations in soil Soil (Alcock et al., 1998) (Alcock et al., 1998) The changes between 1881 and 1986 in the distribution pattern of PCDD/F in soil indicate an increase of the 6, 7 and 8 CDDs corresponding to a combustion pattern. The furan congeners also increase significantly.

25
Figure 6: Dietary intake of milk and milk products in the UK A study carried out by the Ministry of Agriculture, Fisheries and Foods in the UK shows that the dietary intakes of dioxins by average UK consumers of milk and milk products substantially declined over the time period 1982-1992 as illustrated in the figure on the left. Similar trends have been observed in Germany and related to the decline of atmospheric concentrations of dioxins. In wildlife, there is a limited number of temporal trends available. Interesting results are reported by de Wit on guillemot egg samples of the Baltic Proper. The total dioxin concentration in these samples decreases from about 3500 pg/g in 1969 to about 900 pg/g in 1994. Several other studies have been carried out to detect dioxins in the Arctic region and are reported in the AMAP Report (1998). They are summarised hereafter: • In caribou fat in Canada, Sweden and Norway, the PCDD/F levels measured are very
low, generally less than 1 pg TEQ/g ww. • Similarly, PCDD/F levels in freshwater fish from arctic are low (typically less than 1pg/g
ww) and the TCDD levels in fish tissue do not exceed the US-EPA guideline for protection of fish-eating wildlife of 0.57 pg/g ww.
• In the marine environment, the limited information available indicates also very low levels of TCDD in mussels (from 0.2 to 0.6 pg/g ww) and in Atlantic cod muscle (from 0.02 to 0.04 pg/g ww).
• In ringed seal blubber, the 2,3,7,8-TCDD concentrations ranged from less than 2 to 37 pg/g ww, depending on the location in the Arctic area. Beluga and narwhal blubber has uniformly low levels of PCDD/F, reflecting their ability to metabolise planar aromatics.
• PCDD/F levels in polar bear, measured in 1992-1994, are 27 pg/g lipid weight in fat and 1.0-3.5 pg/g lipid weight in milk.
• Recent declines in dioxin deposition are discernible in different remote locations. Chemical industry position Euro Chlor recognises that dioxins have a widespread environmental and geographic occurrence, that a number of compounds belonging to this group are relatively persistent, that a number are toxic to humans and wildlife and that dioxins undergo long-range aerial transport. Therefore, and also because dioxins are unwanted by-products, a pragmatic and general risk reduction approach of dioxins is pursued and advocated by Euro Chlor, as expressed in the position statement hereafter. Apart from the need to comply with applicable regulations, Euro Chlor companies are dedicated to minimise their dioxin emissions through the application of the Best Available Technology (BAT) approach. Data on the reduction of dioxin emissions, the relative contribution of chlor-alkali production and concentration trends in environmental compartments are followed by Euro Chlor and the results have been presented in the previous chapters.

26
EUROCHLOR POSITION • Dioxins are not manufactured intentionally, except in very small quantities for research
purposes • Dioxins are formed as unwanted contaminants in a variety of combustion and
manufacturing processes as well as through natural processes • The European Dioxin Inventory 1993-1995 (Björndal, 1996) showed that chemical
industry contribution is less than 1% of the total dioxin emissions • Despite the minor contribution by chemical industry Euro Chlor actively contributes to
minimise the dioxin emissions by promoting and applying Best Available Techniques as well as by collecting monitoring data to follow dioxin trends in the environment.

27
References Alcock, R.E., Jones, K.C. (1996): Environmental Science & Technology, 30, 3133-3143 Alcock, R.E., McLachlan, M.S., Johnston, A.E., Jones, K.C.(1998): Environmental Science
and Technology, 32, 1580-1587, 1998 AMAP Assessment report (1998): Arctic Pollution Issues, Eds: S.J. Wilson, J.L. Murray and
H.P. Huntington, Arctic Monitoring and Assessment Programme Axelman, J. (1998): “Assessment of PCB fluxes and inventories relevant to the OSPAR
convention area”, presented by Sweden at the OSPAR-INPUT meeting on 9-13 Feb. 1998, Document INPUT (1) 98/7/1-E.
Baggett, J., Thureson-Klein, M. and Klein, R.L. (1980):Effects of chlordecone on the adrenal medulla of the rat. Toxicol. Appl. Pharmacol., 52, 313-322
Ballschmiter, K. (1990): Dioxins and Furans from Waste, Chemische Industrie 7/90 Berends, A.G., Boelhouwers, E.J., Thus, J.L.G., de Gerlache, J. and de Rooij, C.G. (1997):
Bioaccumulation and lack of toxicity of octachlorodibenzofuran (OCDF) and octachlorodibenzo-p-dioxin (OCDD) to early-life stages of zebra fish (Brachydanio rerio). Chemophere, 33,140,4: 854-865.
Berends, A.G., Boelhouwers, E.J., Groeneveld, A.H.C., Nijssen, O.A., Olthof, J.A. and Feenstra, A.F.M. (1998): The toxicity of octachlorodibenzofuran (OCDF) and 14C-octachlorodibenzo-p-dioxin (14C-OCDD) to midges (Chironomus riparius). Solvay internal GLP study report, no. 56834/43/98
Beurkens J.E., Mol, G.A., Barreveld, H., Van Munster, B., Winkels, H. (1995): Environ. Toxicol. Chem. 12, 1549-1566
Bignert, A., Olsson, M., Persson, W., Jensen, S., Zakrisson, S., Litzén, K., Eriksson, U., Häggberg, L., Alsberg, T. (1998): Environmental Pollution 99, 177-198
Björndal, H.(1996): UNEP supported Expert Meeting to review the Outcome of a Project on Alternatives to POPs, Stockholm
Calow, P. (1998): Euro Chlor risk assessment for the marine environment Osparcom Region: North Sea. Environmental monitoring and assessment, 53,3 (special issue): 391-513.
CanTox, Inc (1994): “Interpretive Review of the Potential Adverse Effects of Chlorinated Organic Chemicals on Human Health and the Environment”, Report of an Expert Panel, Regulatory Toxicology and Pharmacology, Volume 20, Number 1, August 1994, Part 2, Chapter 5, S187-S307, Editors: F. Coulston and A.C. Kolbye,Jr.
Carey, J., Cook, P., Giesy, J., Hodson, P., Muir, D., Owens, J.W., Solomon, K. (1998): Ecotoxicological Risk Assessment of the Chlorinated Organic Chemicals, , Proceedings from the Pellston Workshop, held on 24-29 July 1994, in Aliston, Ontario, Canda, SETAC Special PublicationS Series, SETAC Press
Christensen, E.R., Lo, E.K. (1986): Environmental Pollution (B) 12, 217-232 Duarte-Davidson, R., Sewart, A., Alcock, R.E., Cousins, I.T., Jones, K.C. (1997):
Environmental Science and Technology, 31, 1-11 ECVM, (1994): On the environmental impact of the manufacture of polyvinylchloride, a
description of Best Available Techniques Environment Canada (1997): Toxic Substances Management Policy, Scientific Justification,
Polychlorinated dibenzo-p-dioxins and Polychlorinated dibenzo furans, March 1997, available on the web: http://www.ec.gc.ca/cceb1/eng/sj_dioxins.htm
Gunderson, E.L. (1988): J. Assoc.Off. Anal. Chem.71 (6), 1200-1209 ICCA/WCC Position Paper (1999): “Best Available Techniques for Destruction of PCBs-
Incineration Technology”, presented at the UNEP-INC 3 meeting on POPs in Geneva, September 6-10, 1999.
IPCS, (1993): Environmental Health Criteria 140, Polychlorinated Biphenyls and Terphenyls (Second Edition), World Heath Organisation
Jansson B., Sandberg, J., Johansson, N., Astebro, A. (1997): Report N° 4697 from the Swedish Environmental Protection Agency, Stockholm

28
KEMI (1996): “Alternatives to Persistent Organic Pollutants”, The Swedish input to the IFCS Expert Meeting on Persistent Organic Pollutants in Manila, the Philippines, 17-19 June 1996, Report 4/96 from the Swedish National Chemicals Inspectorate.
Her Majesty Inspectorate for Pollution (1995): A review of dioxin emissions in the UK, Report No.DoE/HMIP/RR/95/004, DoE, London
Mehrle, P.M., Buckler, D.R., Little, E.W., Smith, L.M., Petty, J.D, Peterman, P.H., Stalling, D.L., de Graeve, G.M., Coyle, J.J., Adams, W.J. (1988): Toxicity and bioconcentration of 2,3,7,8-tetrachlorodibenzodioxin and 2,3,7,8-tetrachlorodibenzofuran in rainbow trout. Environ. Toxicol. Chem., 7:47-62.
Monitor 16 (1998): “Persistant Organic Pollutants – A Swedish View of an International Problem” Published by the Swedish Environmental Protection Agency
Quaβ, U. and Fermann, M. (1997): Identification of Relevant Industrial Sources of Dioxins and Furans in Europe – European Dioxin Inventory, North-Rhine-Westphalia State Environment Agency, Materialen N°43 (report prepared on behalf of the European Commission DG XI).
Rappe, C. (1996): IUPAC, Pure and Applied Chemistry 68, 1781-1789 Rigo, H.G., Chandler, A.J., Lanier, W.S. (1995): The relationship between chlorine in waste
streams and dioxin emissions from waste combustor stacks”, ASME-CRTD, Vol. 36 Ritter, L., Solomon, K.R., Forget, J., Stemeroff, M. and O’Leary C. (1986): Persitent Organic
Pollutants, An Assessment Report for the International Programme on Chemical Safety (IPCS), presented at the Second meeting of the ISG, Canberra, Australia
RIVM (1993): Emissies van dioxinen in Nederland, Report N° 770 501 003 Singh, A., Bhantagar, M.K., Villeneuve, D.C. and Valli, V.E. (1985): Ultrastructure of the
thyroid glands of rats fed photomirex: a 48-week recovery study. J. Environ. Pathol. Toxicol. Oncol., 6, 115-126
Smith, A.G. (1991); Chlorinated hydrocarbon insecticides; Handbook of Pesticide Toxicology Classes of Pesticides (W.J. Hayes and E.R. Laws, Eds) Vol. 2, pp731-915, Academic Press.
US-EPA: Dioxin Reassessment Report (in preparation). Van den Berg, M. et al. (1998): WHO Toxic Equivalency Factors (TEFs) for dioxin-like
compounds for humans and wildlife, WHO Meeting held on 15-18 June 1997, in Stockholm, (Sweden), Environmental Health Perspective, 106, 775-792
Vehlow, J. et al. (1997): Co-combustion of electric and electronic waste in the Karlsruhe test incinerator TAMARA, Paper presented at “Recycle 97, Geneva
Wells, D.E., Campbell, L.A., Ross, H.M., Thomson, P.M., Lockyer, C.H. (1994): Sci. Total Env. 151, 77-99
Wormgoor, J.W. (1994): Sources of Dioxin Emissions into the Air in Western Europe, TNO Institute of Environmental and Energy Technology, reference number 94-405
WRc (1998): “Collation and Evaluation of European Monitoring Data on Mercury and Chlorinated Organic Compounds”, WRc Ref: CO 4517