microwave dielectric spectroscopy workshop - keysight · 2005-01-24 · microwave dielectric...
TRANSCRIPT
1
Microwave Dielectric Spectroscopy Workshop “Measure the Difference”Copyright 2004 www.agilent.com/find/materials
Microwave Dielectric Spectroscopy Workshop
“Measure the Difference”
Agilent Technologies& Innovative Measurement Solutions
In the mid 1980s, Agilent Technologies developed several products that measure the electromagnetic properties of material samples. At that time Agilent Technologies was a part of the Hewlett Packard Company. These products were developed to meet the needs our customers involved in the development of electronic components, circuits and systems. These products were also used by Department of Defense contractors involved in the design and development of stealth vehicles. Since there introductions these products have found many other applications. The aim of this presentation is to give a survey of these and other potential applications .
2
Microwave Dielectric Spectroscopy Workshop “Measure the Difference”Copyright 2004 www.agilent.com/find/materials
! Why Dielectric Spectroscopy?• Definition of dielectric properties• Relationship to other properties• Measurement techniques
“Measure the Difference”
The presentation consists of four parts. First we’ll answer the question, why dielectric spectroscopy. Then will define dielectric properties and explains why one material’s dielectric properties is different from another material. Then well discuss several measurement techniques and show demonstrations.
3
Microwave Dielectric Spectroscopy Workshop “Measure the Difference”Copyright 2004 www.agilent.com/find/materials
Why Dielectric Spectroscopy?
A material’s dielectric properties are determined by its molecular structure.
Other properties of interest can be correlated to dielectric properties.
And…
So, why dielectric spectroscopy?An alternative title for this presentation could have been, What are dielectric properties and why would I want to measure them?. The answer to this question is obvious to electrical engineers and physicists that are involved in the design and development of electrical/electronic components, circuits and systems. The answer is not as obvious to other scientists involved in other technical endeavors. The general answer is that a materials dielectric properties are determined by its molecular structure. If the molecular structure changes it dielectric properties changes.
4
Microwave Dielectric Spectroscopy Workshop “Measure the Difference”Copyright 2004 www.agilent.com/find/materials
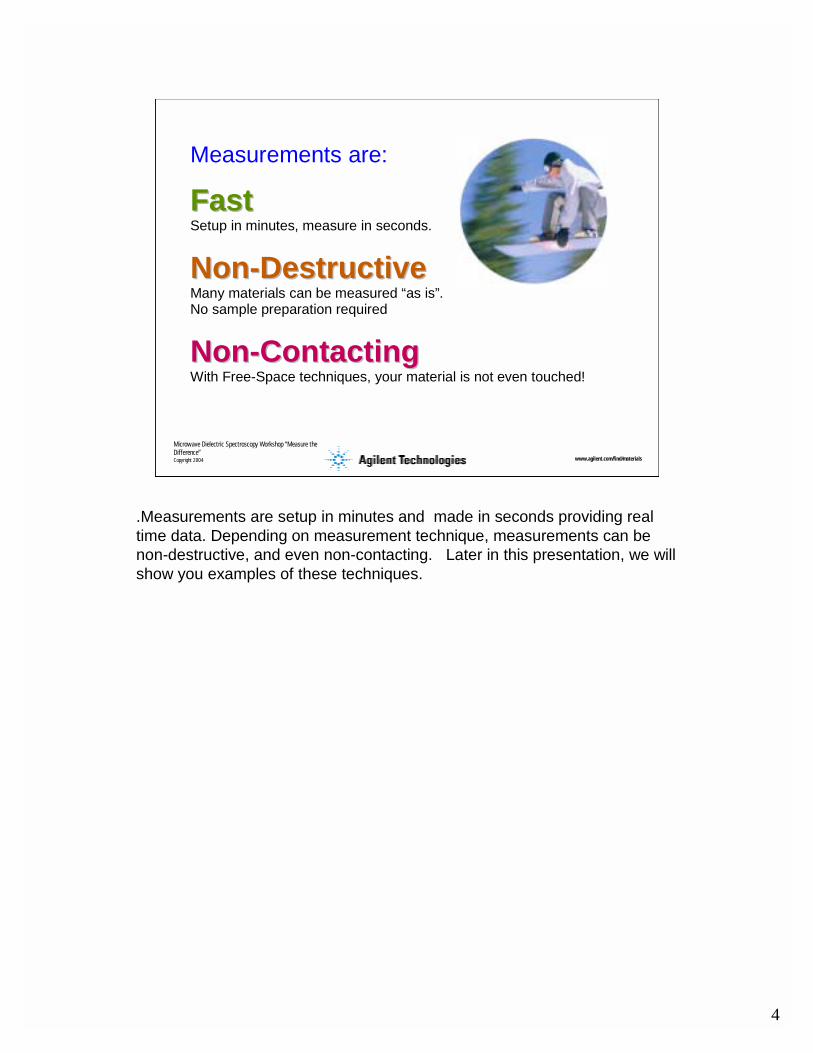
Measurements are:
FFaasstt Setup in minutes, measure in seconds.
NNoonn--DDeessttrruuccttiivvee Many materials can be measured “as is”. No sample preparation required
NNoonn--CCoonnttaaccttiinngg With Free-Space techniques, your material is not even touched!
.Measurements are setup in minutes and made in seconds providing real time data. Depending on measurement technique, measurements can be non-destructive, and even non-contacting. Later in this presentation, we will show you examples of these techniques.
5
Microwave Dielectric Spectroscopy Workshop “Measure the Difference”Copyright 2004 www.agilent.com/find/materials
• Why Dielectric Spectroscopy? ! Definition of dielectric properties• Relationship to other properties• Measurement techniques
“Measure the Difference”
6
Microwave Dielectric Spectroscopy Workshop “Measure the Difference”Copyright 2004 www.agilent.com/find/materials
Permittivity Definition
• One of the factors that determine how the material interacts with an electromagnetic field
• Its dimensions are farad per meter (capacitance per distance)
The dielectric properties, or permittivity, is one of the factors that determines how a material interacts with an applied electromagnetic field. Its fundamental dimensions are T2Q2M-1L-3 where T, Q, M and L are time, charge, mass and length respectively. Normally this is expressed as farad per meter (capacitance per distance).
7
Microwave Dielectric Spectroscopy Workshop “Measure the Difference”Copyright 2004 www.agilent.com/find/materials
Maxwell’s Equations
t∂∇× =− ∂BE
t∂∇× = +∂DH J
ρ∇• =D
0∇• =BJames Clerk Maxwell
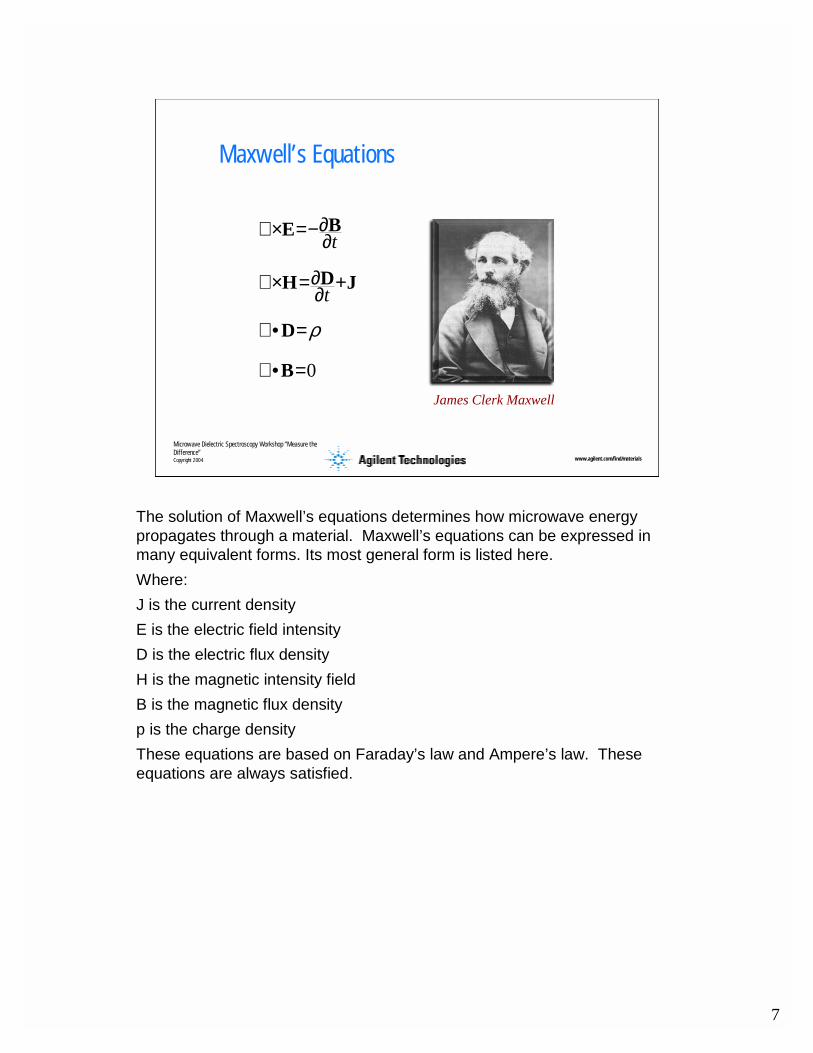
The solution of Maxwell’s equations determines how microwave energy propagates through a material. Maxwell’s equations can be expressed in many equivalent forms. Its most general form is listed here. Where:J is the current densityE is the electric field intensityD is the electric flux densityH is the magnetic intensity fieldB is the magnetic flux densityp is the charge densityThese equations are based on Faraday’s law and Ampere’s law. These equations are always satisfied.
8
Microwave Dielectric Spectroscopy Workshop “Measure the Difference”Copyright 2004 www.agilent.com/find/materials
Constitutive Relations
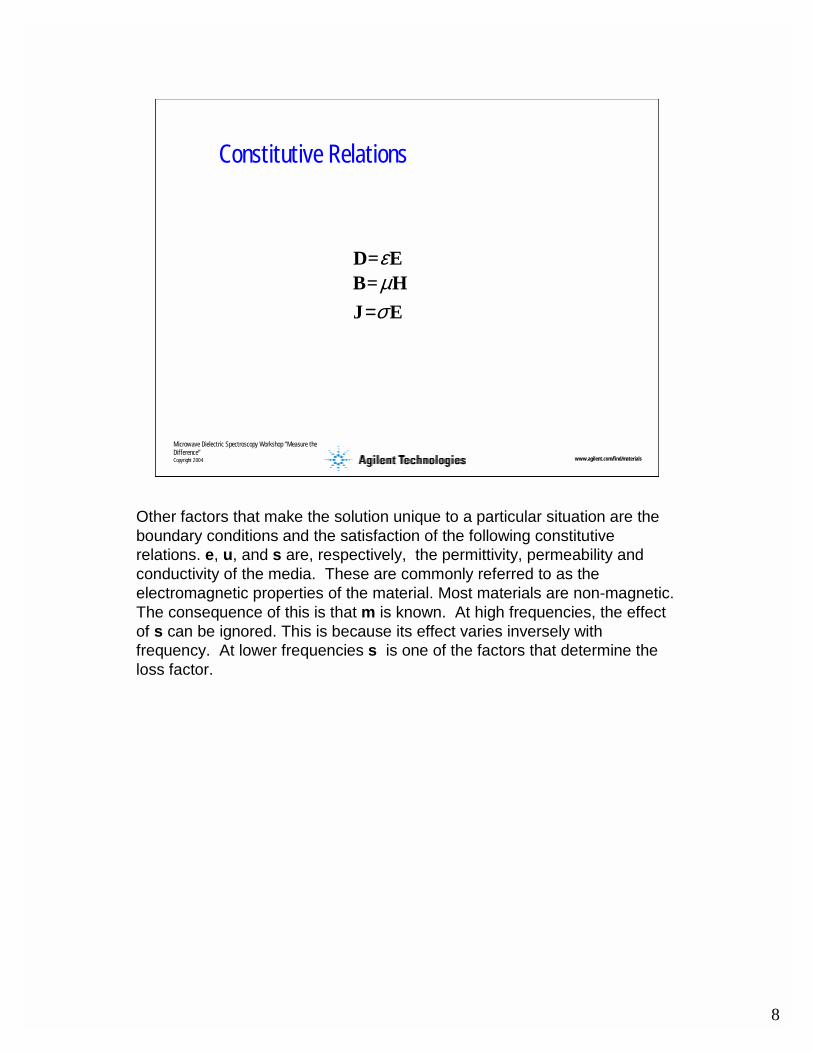
εD E=µB H=σ=J E
Other factors that make the solution unique to a particular situation are the boundary conditions and the satisfaction of the following constitutive relations. e, u, and s are, respectively, the permittivity, permeability and conductivity of the media. These are commonly referred to as the electromagnetic properties of the material. Most materials are non-magnetic. The consequence of this is that m is known. At high frequencies, the effect of s can be ignored. This is because its effect varies inversely withfrequency. At lower frequencies s is one of the factors that determine the loss factor.
9
Microwave Dielectric Spectroscopy Workshop “Measure the Difference”Copyright 2004 www.agilent.com/find/materials
Molecular Structure of Water
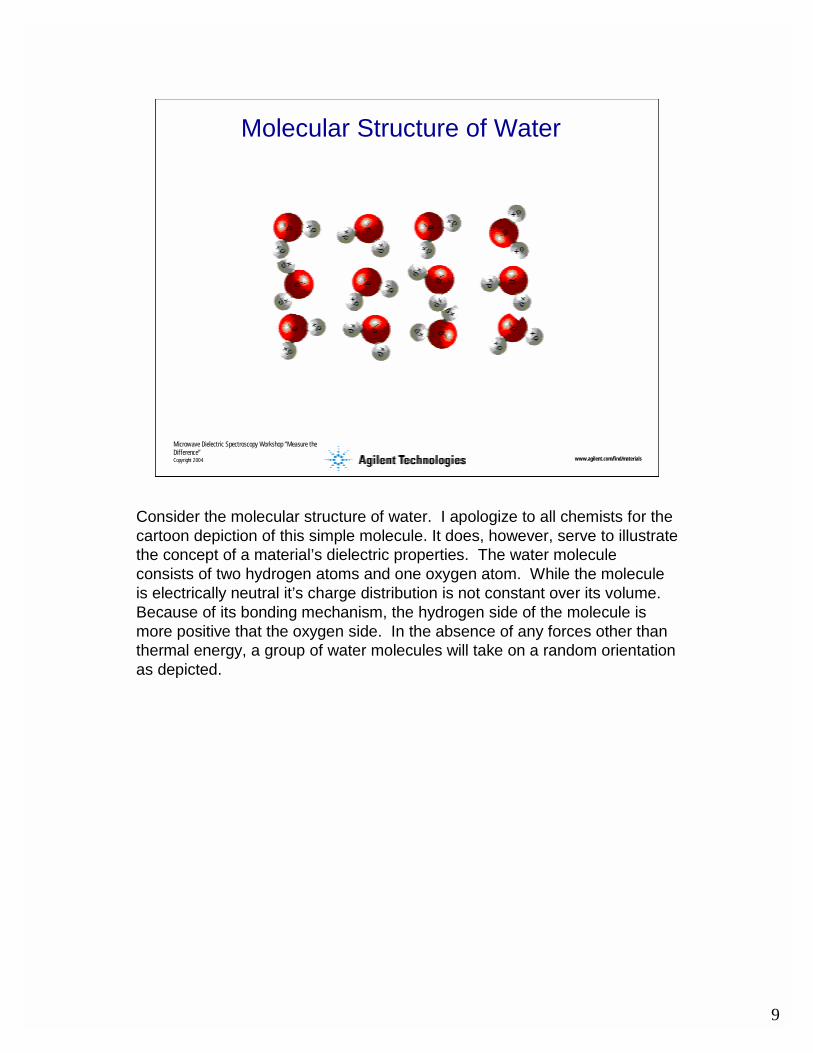
Consider the molecular structure of water. I apologize to all chemists for the cartoon depiction of this simple molecule. It does, however, serve to illustrate the concept of a material’s dielectric properties. The water molecule consists of two hydrogen atoms and one oxygen atom. While the molecule is electrically neutral it’s charge distribution is not constant over its volume. Because of its bonding mechanism, the hydrogen side of the molecule is more positive that the oxygen side. In the absence of any forces other than thermal energy, a group of water molecules will take on a random orientation as depicted.
10
Microwave Dielectric Spectroscopy Workshop “Measure the Difference”Copyright 2004 www.agilent.com/find/materials
Constant Electric Field
E
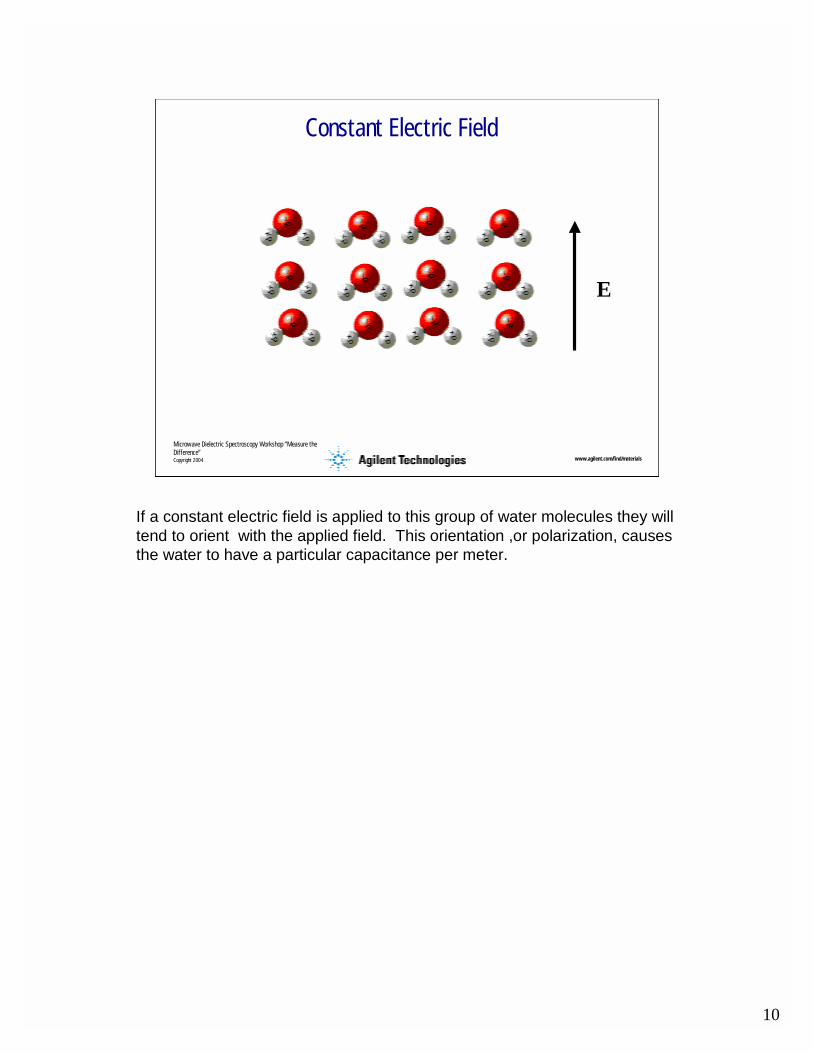
If a constant electric field is applied to this group of water molecules they will tend to orient with the applied field. This orientation ,or polarization, causes the water to have a particular capacitance per meter.
11
Microwave Dielectric Spectroscopy Workshop “Measure the Difference”Copyright 2004 www.agilent.com/find/materials
Water and NaCl
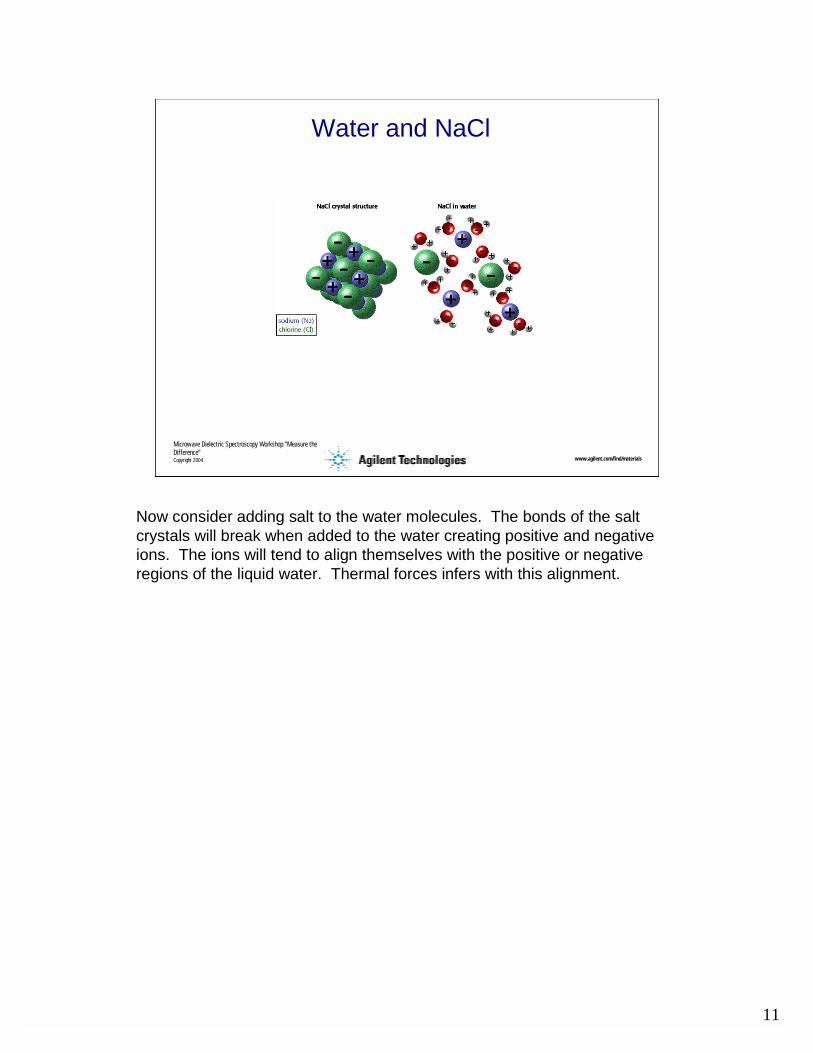
Now consider adding salt to the water molecules. The bonds of the salt crystals will break when added to the water creating positive and negative ions. The ions will tend to align themselves with the positive or negative regions of the liquid water. Thermal forces infers with this alignment.
12
Microwave Dielectric Spectroscopy Workshop “Measure the Difference”Copyright 2004 www.agilent.com/find/materials
Mechanisms vs. Frequency
Dipolar(Rotational)
Atomic Electronic
103
106
109
1012
1015 f, Hz
+
-
-
+
VIRMW UV
+
-
Ionic
'rε
''rε
Ionic Conductivity and Electric PolarizationIonic Conductivity and Electric Polarization
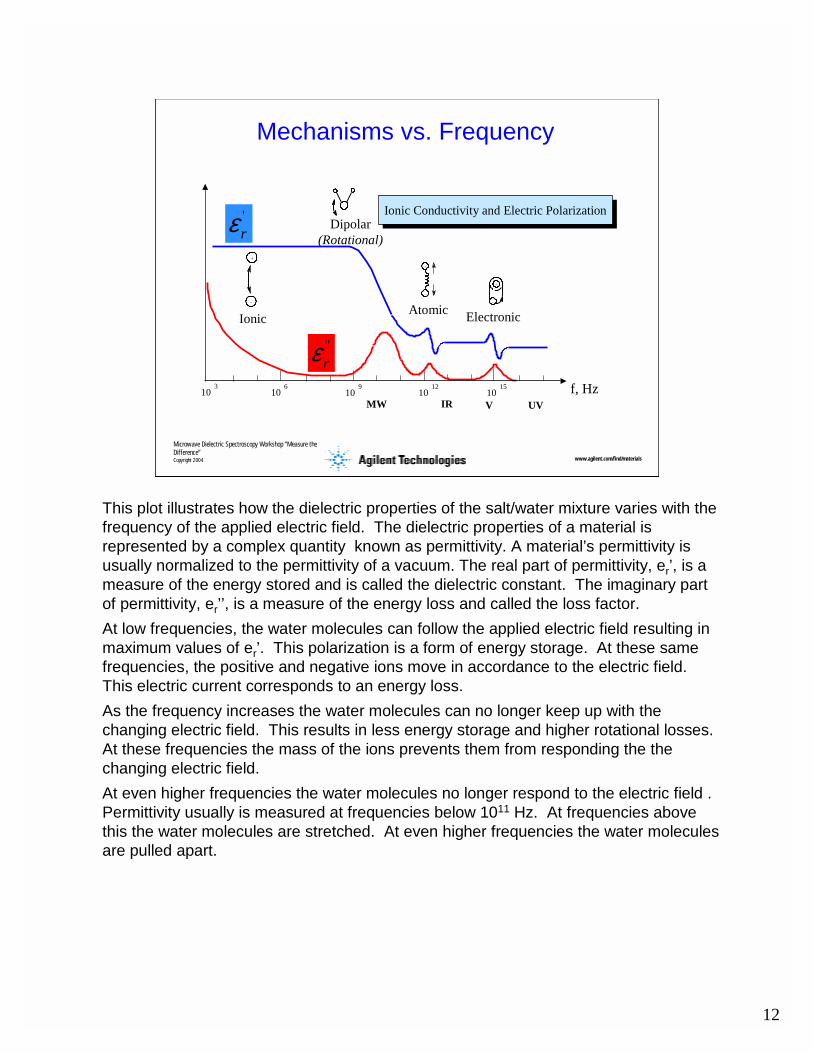
This plot illustrates how the dielectric properties of the salt/water mixture varies with the frequency of the applied electric field. The dielectric properties of a material is represented by a complex quantity known as permittivity. A material’s permittivity is usually normalized to the permittivity of a vacuum. The real part of permittivity, er’, is a measure of the energy stored and is called the dielectric constant. The imaginary part of permittivity, er’’, is a measure of the energy loss and called the loss factor. At low frequencies, the water molecules can follow the applied electric field resulting in maximum values of er’. This polarization is a form of energy storage. At these samefrequencies, the positive and negative ions move in accordance to the electric field. This electric current corresponds to an energy loss.As the frequency increases the water molecules can no longer keep up with the changing electric field. This results in less energy storage and higher rotational losses. At these frequencies the mass of the ions prevents them from responding the the changing electric field.At even higher frequencies the water molecules no longer respond to the electric field . Permittivity usually is measured at frequencies below 1011 Hz. At frequencies above this the water molecules are stretched. At even higher frequencies the water molecules are pulled apart.
13
Microwave Dielectric Spectroscopy Workshop “Measure the Difference”Copyright 2004 www.agilent.com/find/materials
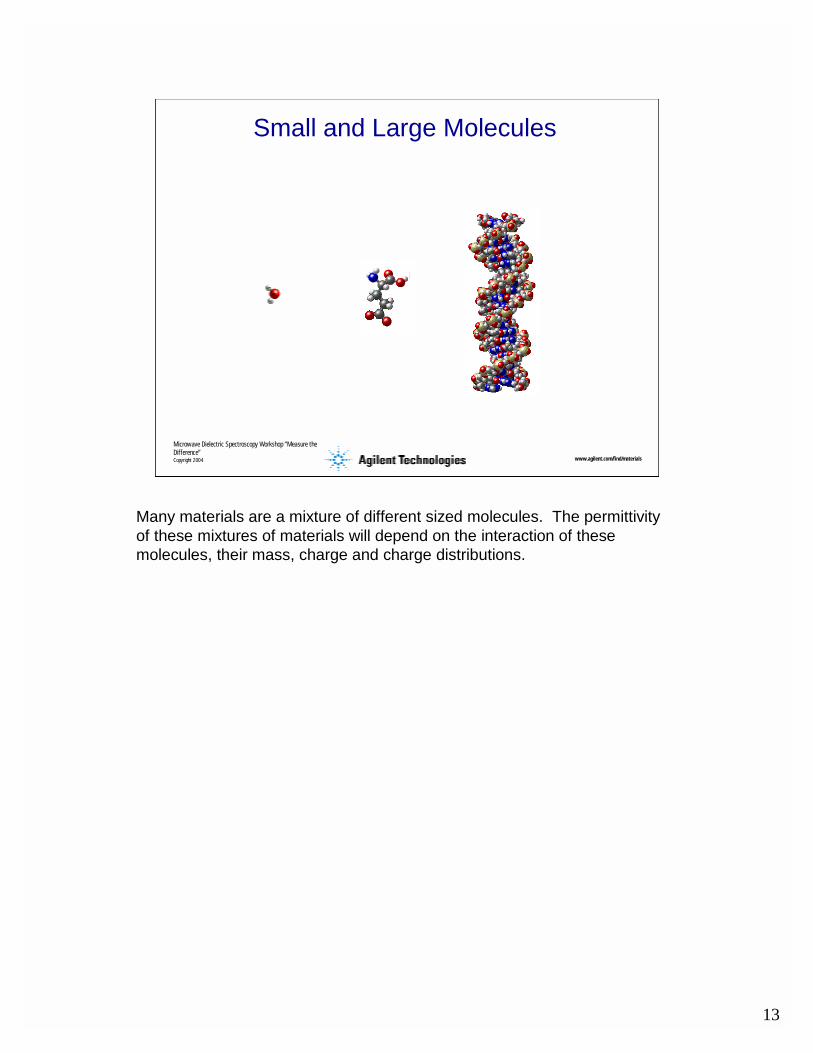
Small and Large Molecules
Many materials are a mixture of different sized molecules. The permittivity of these mixtures of materials will depend on the interaction of these molecules, their mass, charge and charge distributions.
14
Microwave Dielectric Spectroscopy Workshop “Measure the Difference”Copyright 2004 www.agilent.com/find/materials
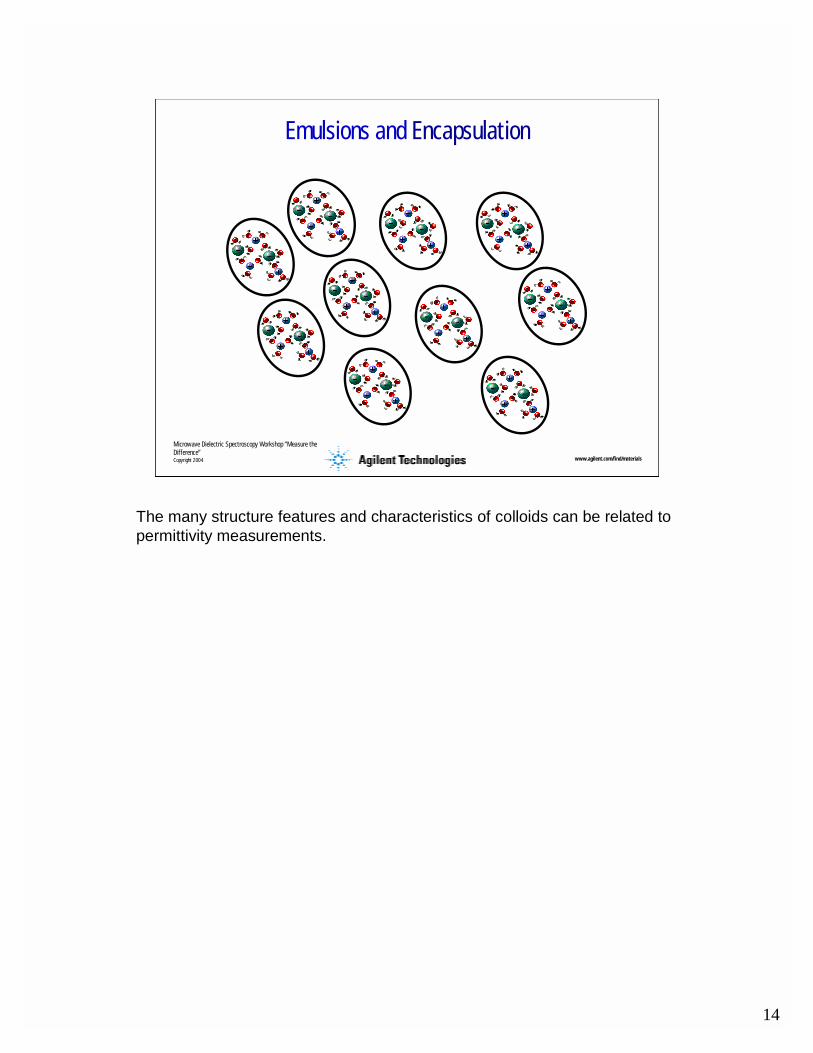
Emulsions and Encapsulation
The many structure features and characteristics of colloids can be related to permittivity measurements.
15
Microwave Dielectric Spectroscopy Workshop “Measure the Difference”Copyright 2004 www.agilent.com/find/materials
• Why Dielectric Spectroscopy? • Definition of dielectric properties! Relationship to other properties• Measurement techniques
“Measure the Difference”
16
Microwave Dielectric Spectroscopy Workshop “Measure the Difference”Copyright 2004 www.agilent.com/find/materials
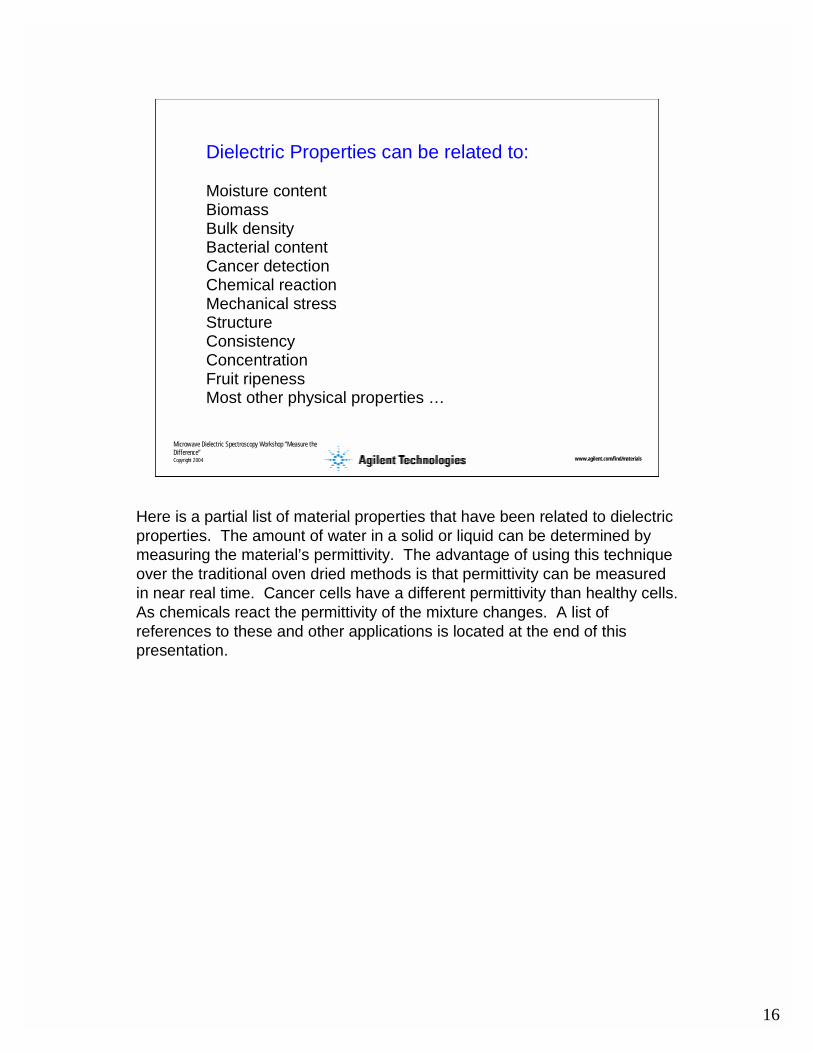
Dielectric Properties can be related to: Moisture content Biomass Bulk density Bacterial content Cancer detection Chemical reaction Mechanical stress Structure Consistency Concentration Fruit ripeness Most other physical properties …
Here is a partial list of material properties that have been related to dielectric properties. The amount of water in a solid or liquid can be determined by measuring the material’s permittivity. The advantage of using this technique over the traditional oven dried methods is that permittivity can be measured in near real time. Cancer cells have a different permittivity than healthy cells. As chemicals react the permittivity of the mixture changes. A list of references to these and other applications is located at the end of this presentation.
17
Microwave Dielectric Spectroscopy Workshop “Measure the Difference”Copyright 2004 www.agilent.com/find/materials
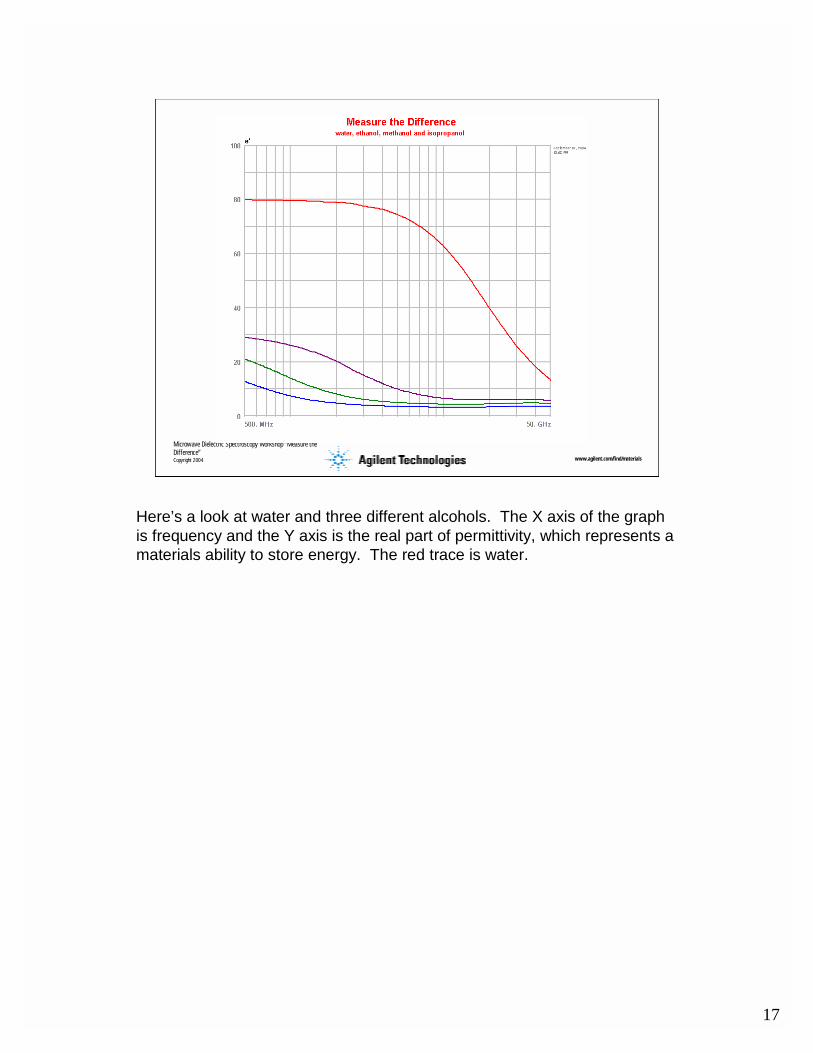
Here’s a look at water and three different alcohols. The X axis of the graph is frequency and the Y axis is the real part of permittivity, which represents a materials ability to store energy. The red trace is water.
18
Microwave Dielectric Spectroscopy Workshop “Measure the Difference”Copyright 2004 www.agilent.com/find/materials
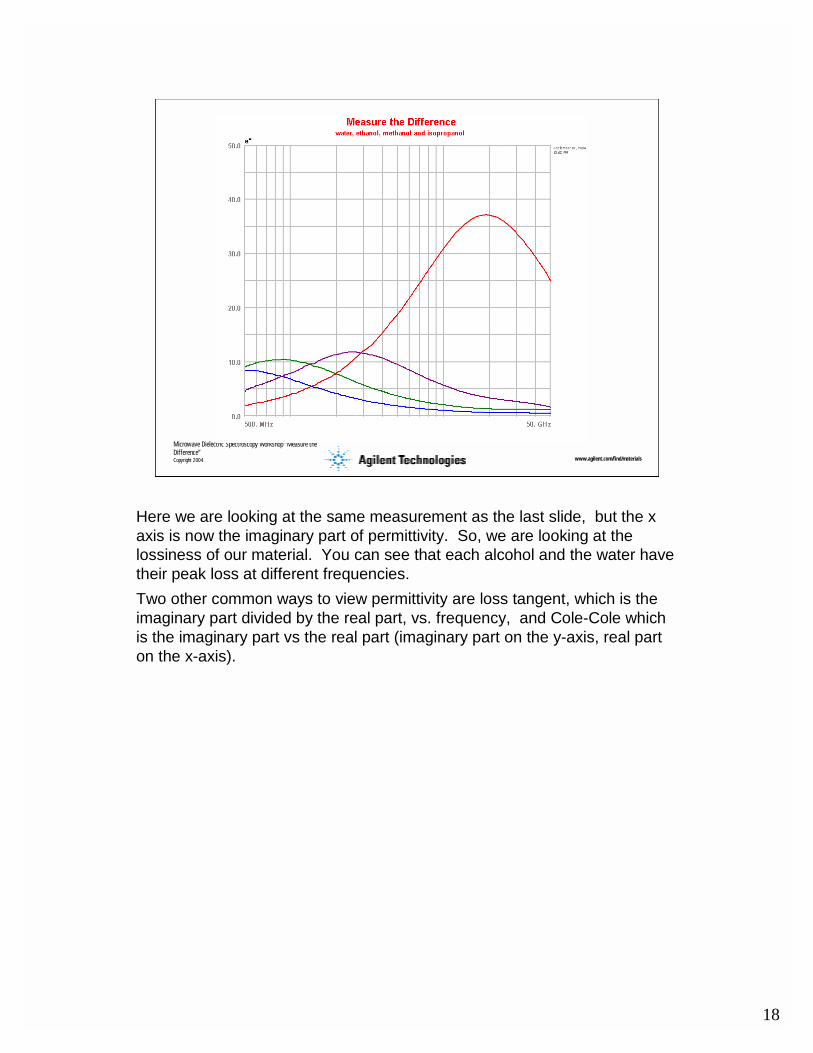
Here we are looking at the same measurement as the last slide, but the x axis is now the imaginary part of permittivity. So, we are looking at the lossiness of our material. You can see that each alcohol and the water have their peak loss at different frequencies. Two other common ways to view permittivity are loss tangent, which is the imaginary part divided by the real part, vs. frequency, and Cole-Cole which is the imaginary part vs the real part (imaginary part on the y-axis, real part on the x-axis).
19
Microwave Dielectric Spectroscopy Workshop “Measure the Difference”Copyright 2004 www.agilent.com/find/materials
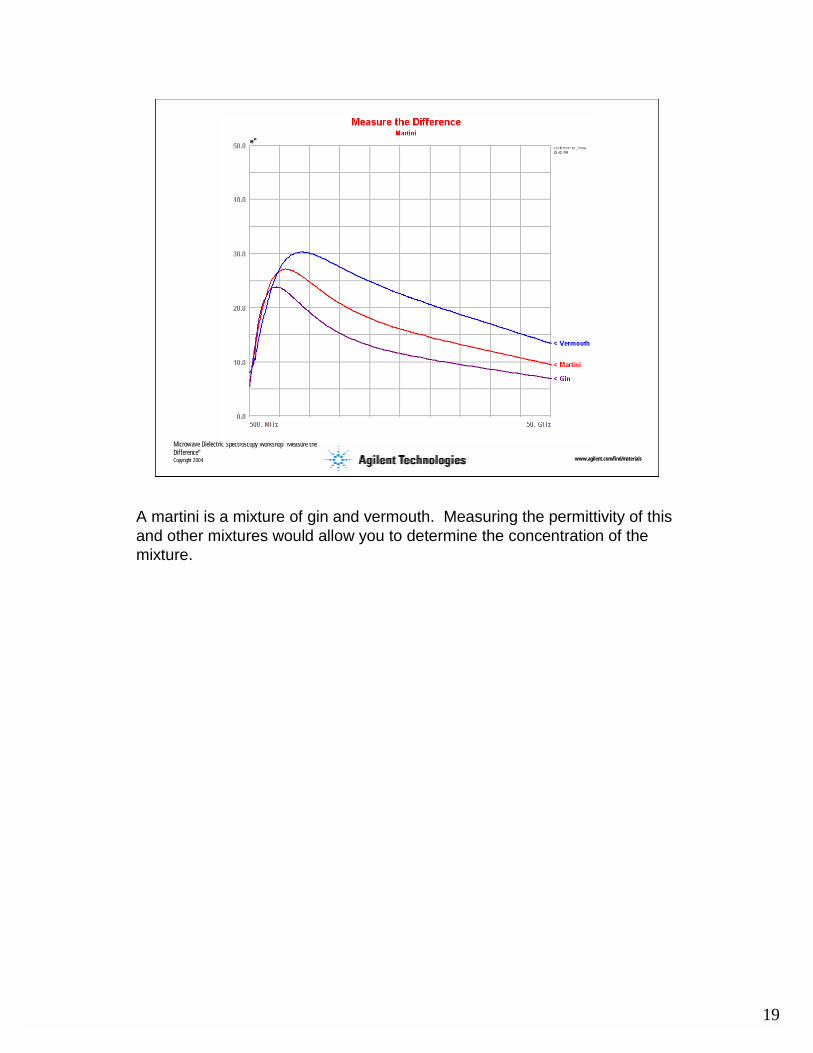
A martini is a mixture of gin and vermouth. Measuring the permittivity of this and other mixtures would allow you to determine the concentration of the mixture.
20
Microwave Dielectric Spectroscopy Workshop “Measure the Difference”Copyright 2004 www.agilent.com/find/materials
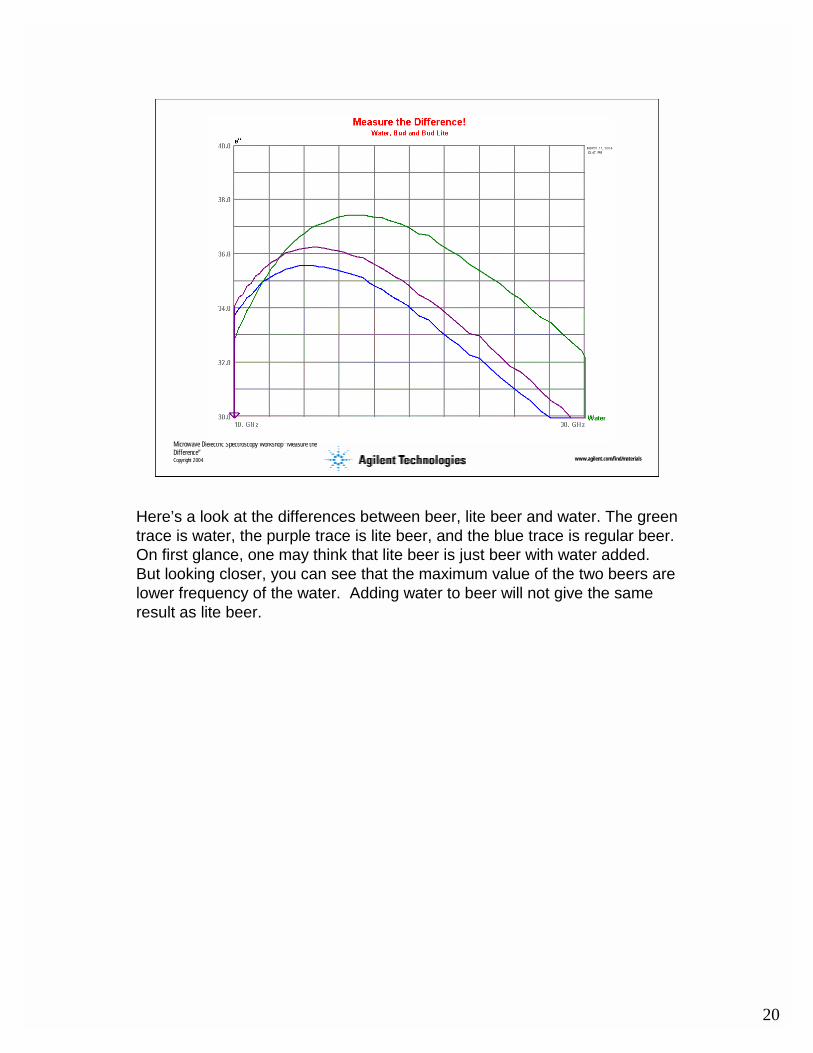
Here’s a look at the differences between beer, lite beer and water. The green trace is water, the purple trace is lite beer, and the blue trace is regular beer. On first glance, one may think that lite beer is just beer with water added. But looking closer, you can see that the maximum value of the two beers are lower frequency of the water. Adding water to beer will not give the same result as lite beer.
21
Microwave Dielectric Spectroscopy Workshop “Measure the Difference”Copyright 2004 www.agilent.com/find/materials
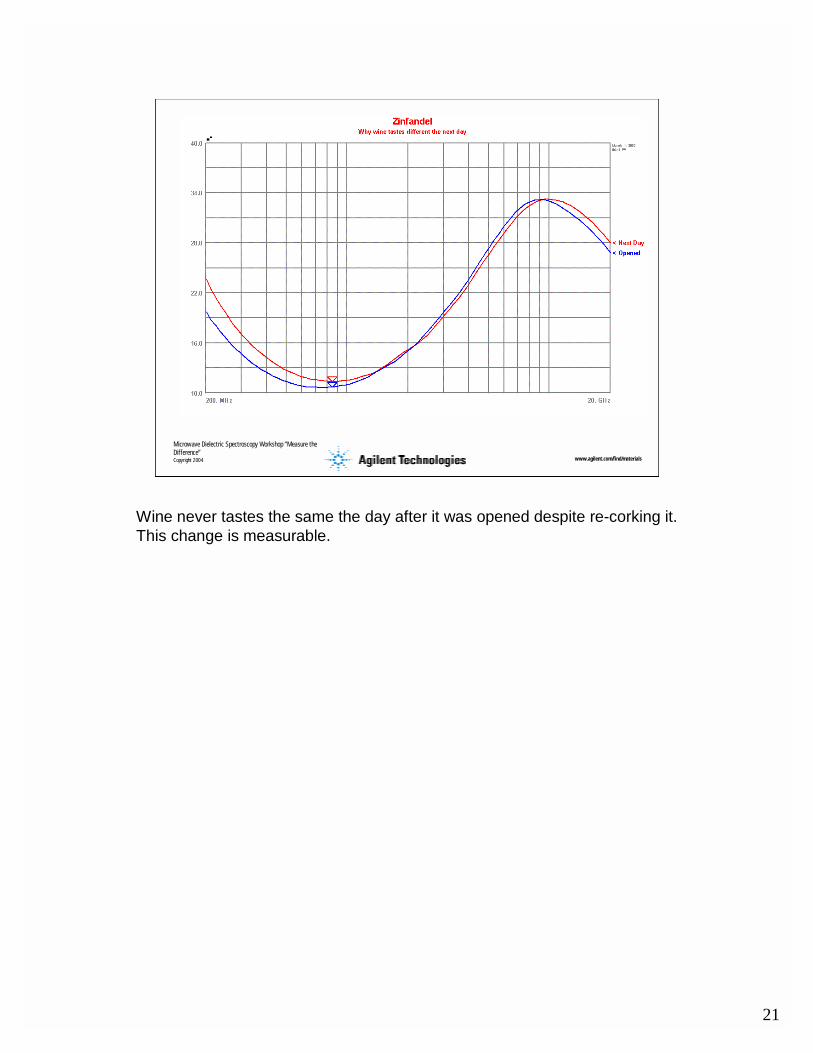
Wine never tastes the same the day after it was opened despite re-corking it. This change is measurable.
22
Microwave Dielectric Spectroscopy Workshop “Measure the Difference”Copyright 2004 www.agilent.com/find/materials
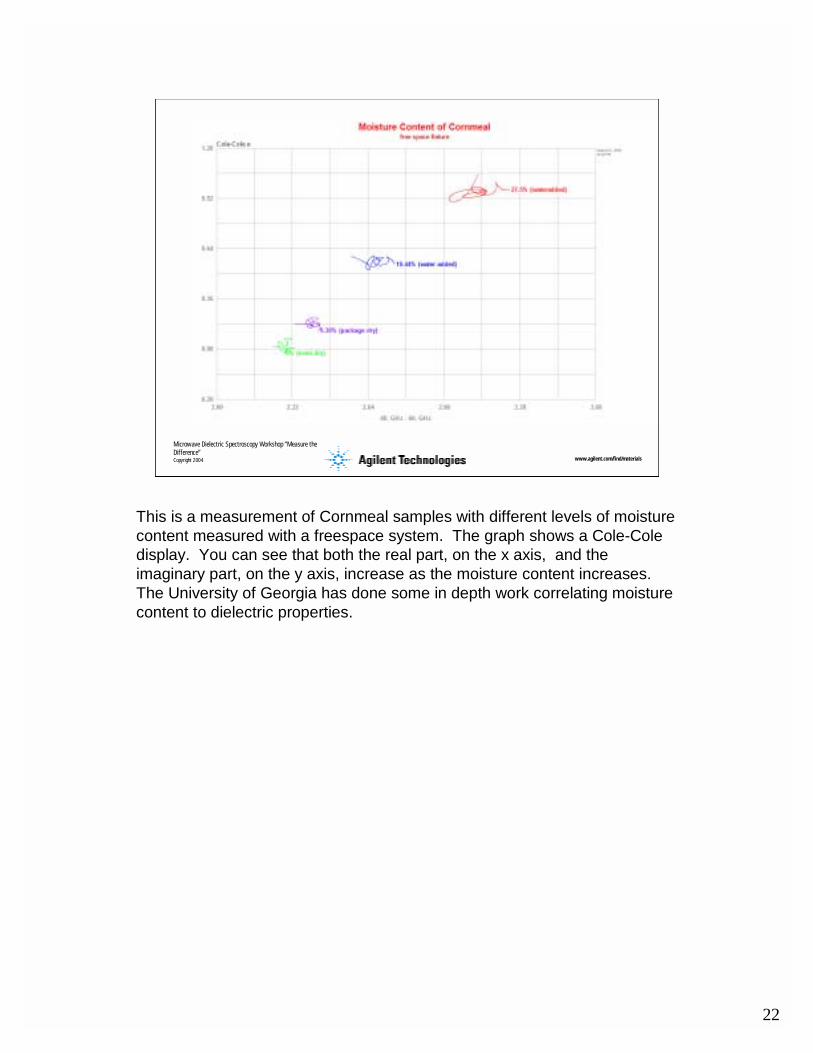
This is a measurement of Cornmeal samples with different levels of moisture content measured with a freespace system. The graph shows a Cole-Cole display. You can see that both the real part, on the x axis, and the imaginary part, on the y axis, increase as the moisture content increases. The University of Georgia has done some in depth work correlating moisture content to dielectric properties.
23
Microwave Dielectric Spectroscopy Workshop “Measure the Difference”Copyright 2004 www.agilent.com/find/materials
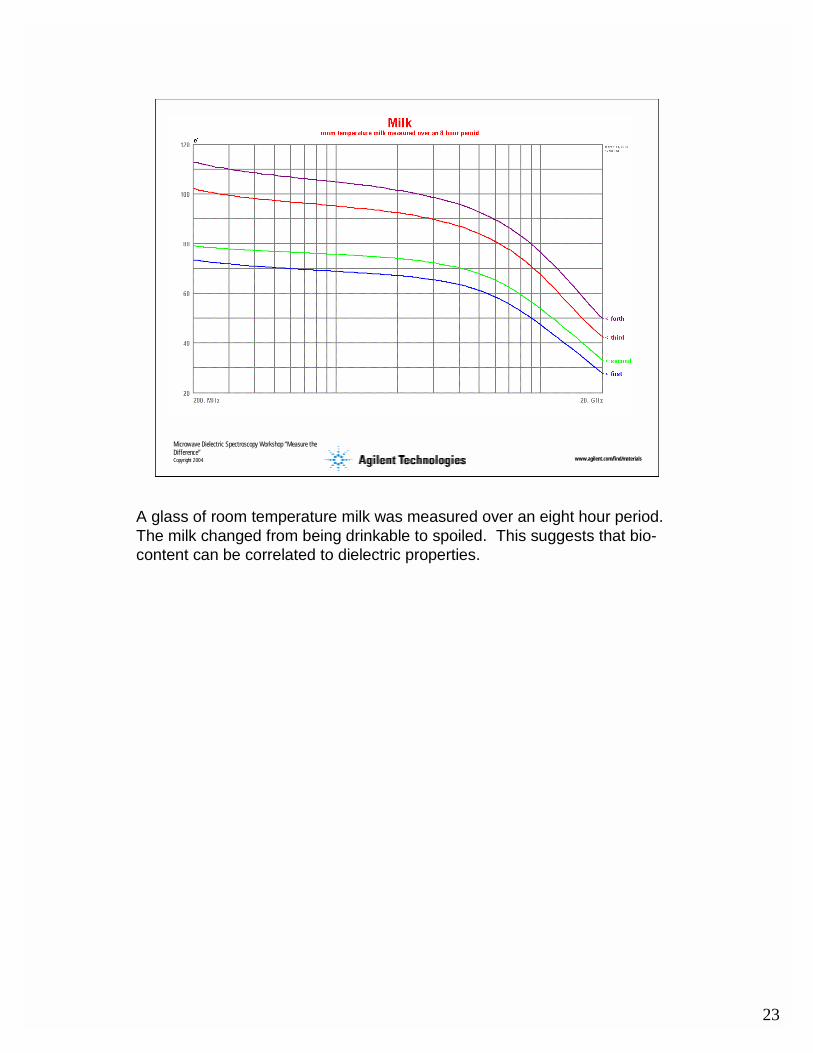
A glass of room temperature milk was measured over an eight hour period. The milk changed from being drinkable to spoiled. This suggests that bio-content can be correlated to dielectric properties.
24
Microwave Dielectric Spectroscopy Workshop “Measure the Difference”Copyright 2004 www.agilent.com/find/materials
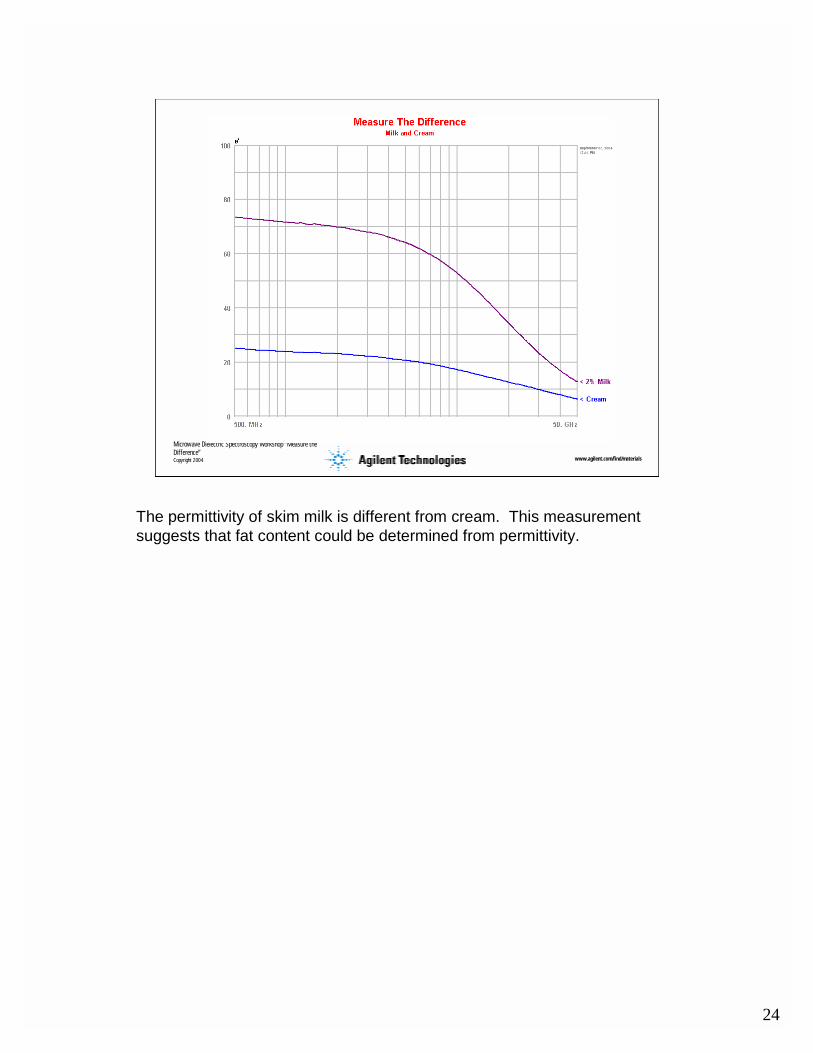
The permittivity of skim milk is different from cream. This measurement suggests that fat content could be determined from permittivity.
25
Microwave Dielectric Spectroscopy Workshop “Measure the Difference”Copyright 2004 www.agilent.com/find/materials
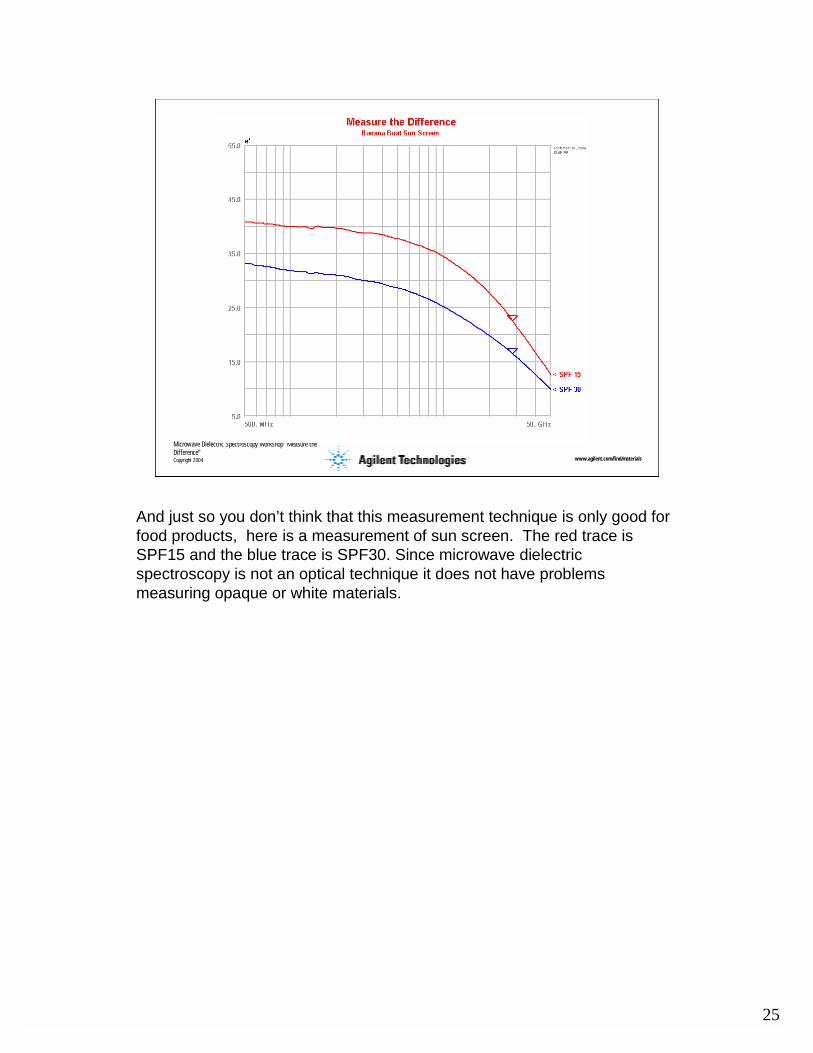
And just so you don’t think that this measurement technique is only good for food products, here is a measurement of sun screen. The red trace is SPF15 and the blue trace is SPF30. Since microwave dielectric spectroscopy is not an optical technique it does not have problems measuring opaque or white materials.
26
Microwave Dielectric Spectroscopy Workshop “Measure the Difference”Copyright 2004 www.agilent.com/find/materials
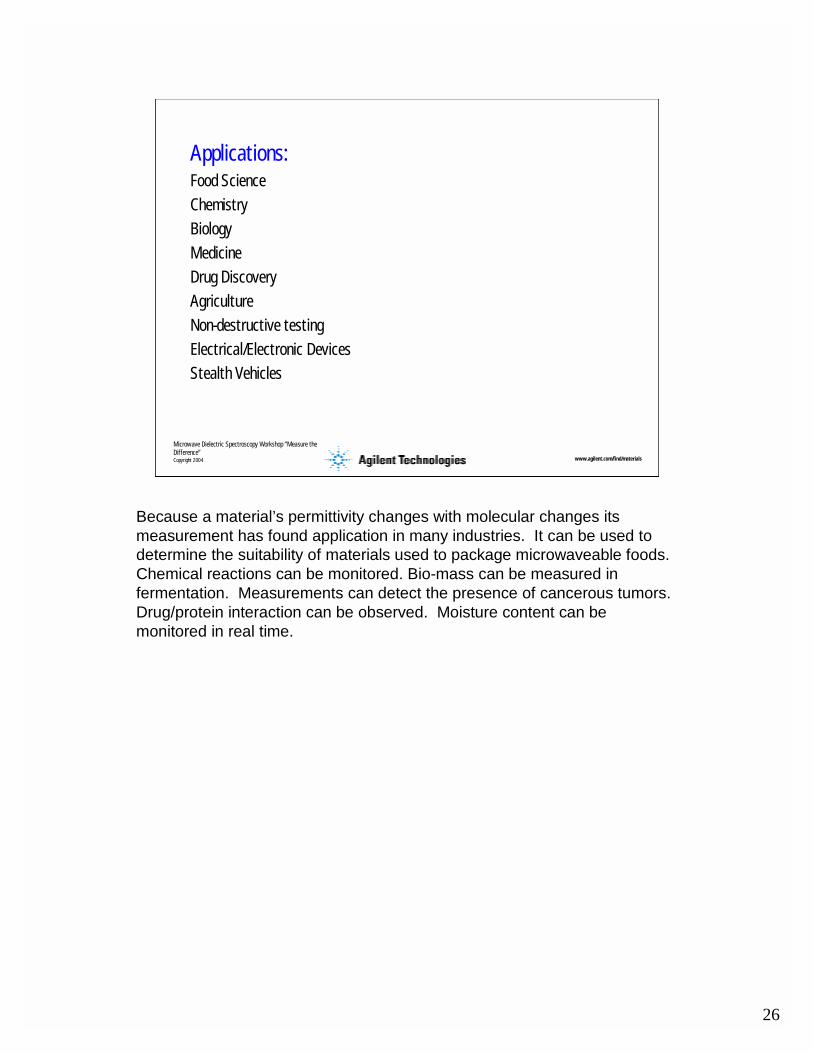
Applications:Food ScienceChemistryBiologyMedicineDrug Discovery Agriculture Non-destructive testingElectrical/Electronic DevicesStealth Vehicles
Because a material’s permittivity changes with molecular changes its measurement has found application in many industries. It can be used to determine the suitability of materials used to package microwaveable foods. Chemical reactions can be monitored. Bio-mass can be measured in fermentation. Measurements can detect the presence of cancerous tumors. Drug/protein interaction can be observed. Moisture content can be monitored in real time.
27
Microwave Dielectric Spectroscopy Workshop “Measure the Difference”Copyright 2004 www.agilent.com/find/materials
• Why Dielectric Spectroscopy? • Definition of dielectric properties• Relationship to other properties! Measurement techniques
“Measure the Difference”
.
28
Microwave Dielectric Spectroscopy Workshop “Measure the Difference”Copyright 2004 www.agilent.com/find/materials
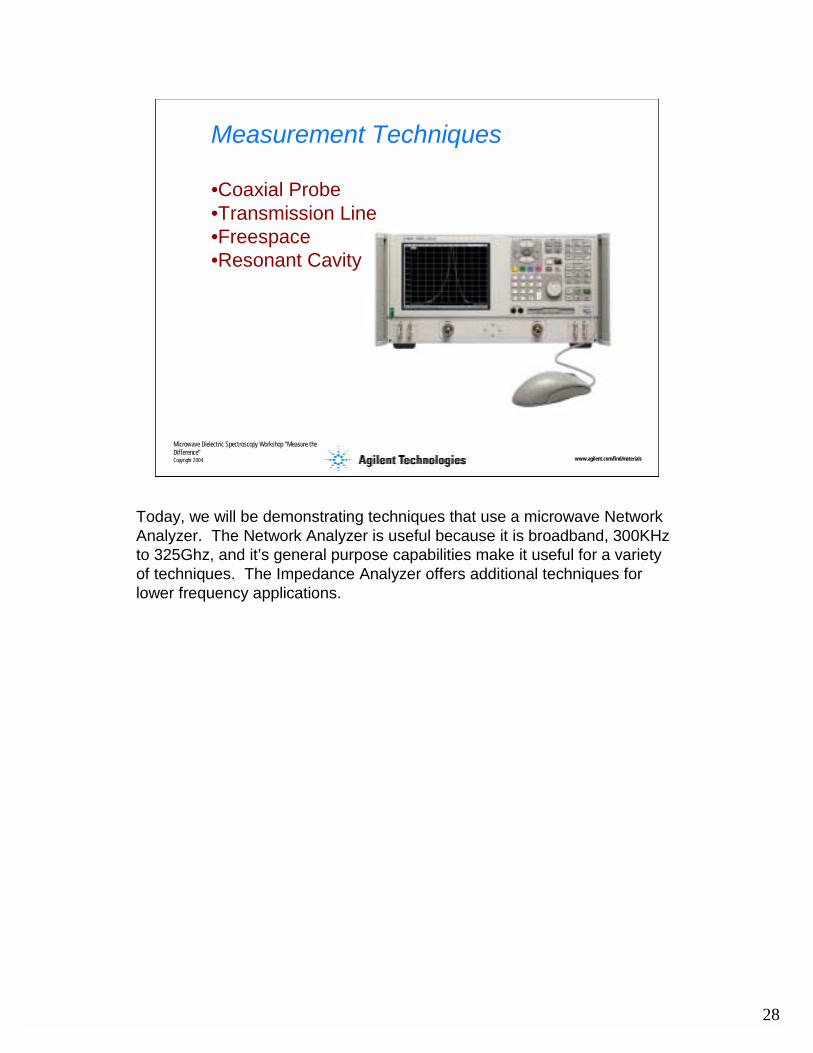
Measurement Techniques
•Coaxial Probe•Transmission Line•Freespace•Resonant Cavity
Today, we will be demonstrating techniques that use a microwave Network Analyzer. The Network Analyzer is useful because it is broadband, 300KHz to 325Ghz, and it’s general purpose capabilities make it useful for a variety of techniques. The Impedance Analyzer offers additional techniques for lower frequency applications.
29
Microwave Dielectric Spectroscopy Workshop “Measure the Difference”Copyright 2004 www.agilent.com/find/materials
Network Analyzer BasicsLightwave Analogy to Microwave Energy
Microwave
Incident
Reflected
Transmitted
Lightwave
MUT
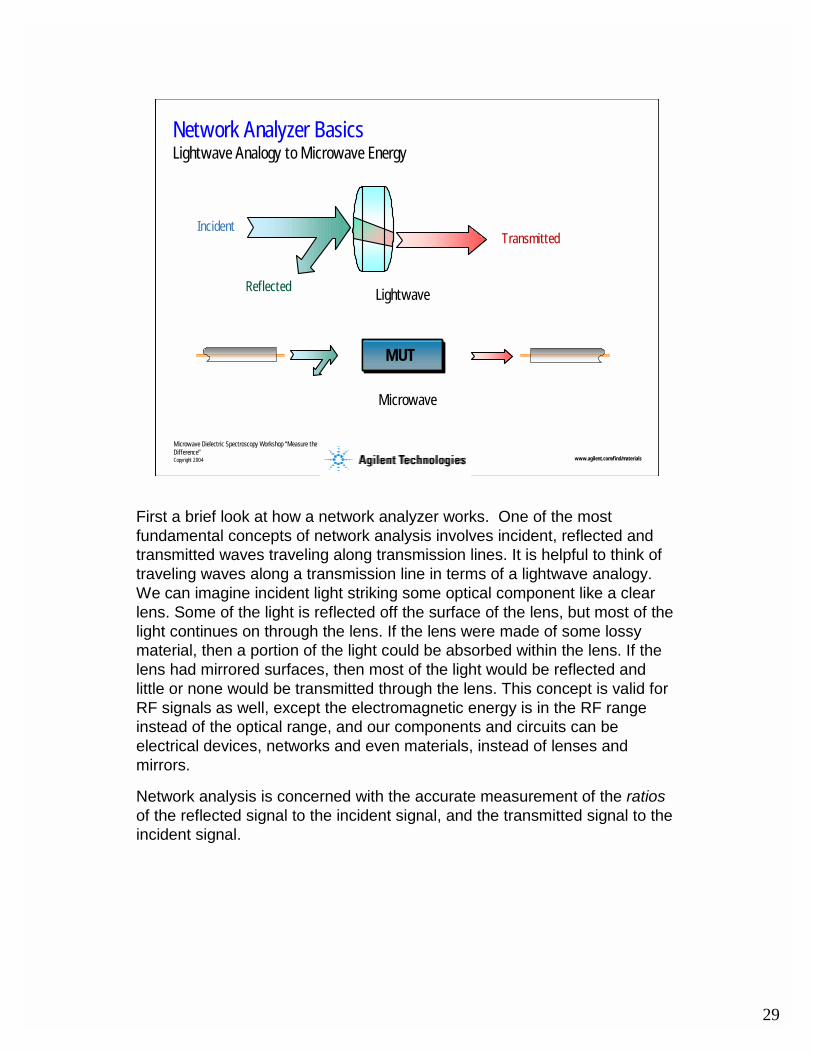
First a brief look at how a network analyzer works. One of the most fundamental concepts of network analysis involves incident, reflected and transmitted waves traveling along transmission lines. It is helpful to think of traveling waves along a transmission line in terms of a lightwave analogy. We can imagine incident light striking some optical component like a clear lens. Some of the light is reflected off the surface of the lens, but most of the light continues on through the lens. If the lens were made of some lossy material, then a portion of the light could be absorbed within the lens. If the lens had mirrored surfaces, then most of the light would be reflected and little or none would be transmitted through the lens. This concept is valid for RF signals as well, except the electromagnetic energy is in the RF range instead of the optical range, and our components and circuits can be electrical devices, networks and even materials, instead of lenses and mirrors.
Network analysis is concerned with the accurate measurement of the ratiosof the reflected signal to the incident signal, and the transmitted signal to the incident signal.
30
Microwave Dielectric Spectroscopy Workshop “Measure the Difference”Copyright 2004 www.agilent.com/find/materials
Generalized Network Analyzer Block Diagram
RECEIVER / DETECTOR
PROCESSOR / DISPLAY
REFLECTED(A)
TRANSMITTED(B)INCIDENT (R)
SIGNALSEPARATION
SOURCE
Incident
Reflected
Transmitted
MUT
Fixture
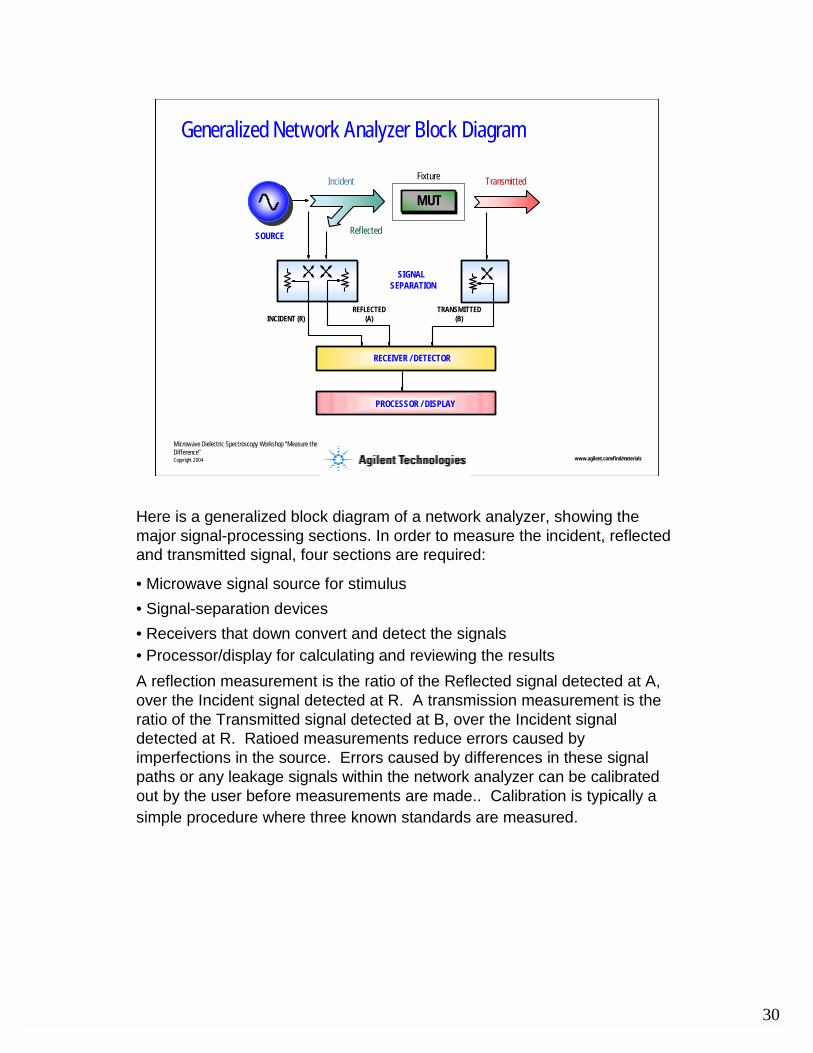
Here is a generalized block diagram of a network analyzer, showing the major signal-processing sections. In order to measure the incident, reflectedand transmitted signal, four sections are required:
• Microwave signal source for stimulus• Signal-separation devices• Receivers that down convert and detect the signals• Processor/display for calculating and reviewing the resultsA reflection measurement is the ratio of the Reflected signal detected at A, over the Incident signal detected at R. A transmission measurement is the ratio of the Transmitted signal detected at B, over the Incident signal detected at R. Ratioed measurements reduce errors caused by imperfections in the source. Errors caused by differences in these signal paths or any leakage signals within the network analyzer can be calibrated out by the user before measurements are made.. Calibration is typically a simple procedure where three known standards are measured.
31
Microwave Dielectric Spectroscopy Workshop “Measure the Difference”Copyright 2004 www.agilent.com/find/materials
Coaxial Probe SystemComputer
(not required for PNA)Network Analyzer
(or E4991A Impedance Analyzer)
85070EDielectric Probe
GP-IB
85070E Software(Included with probe kit)
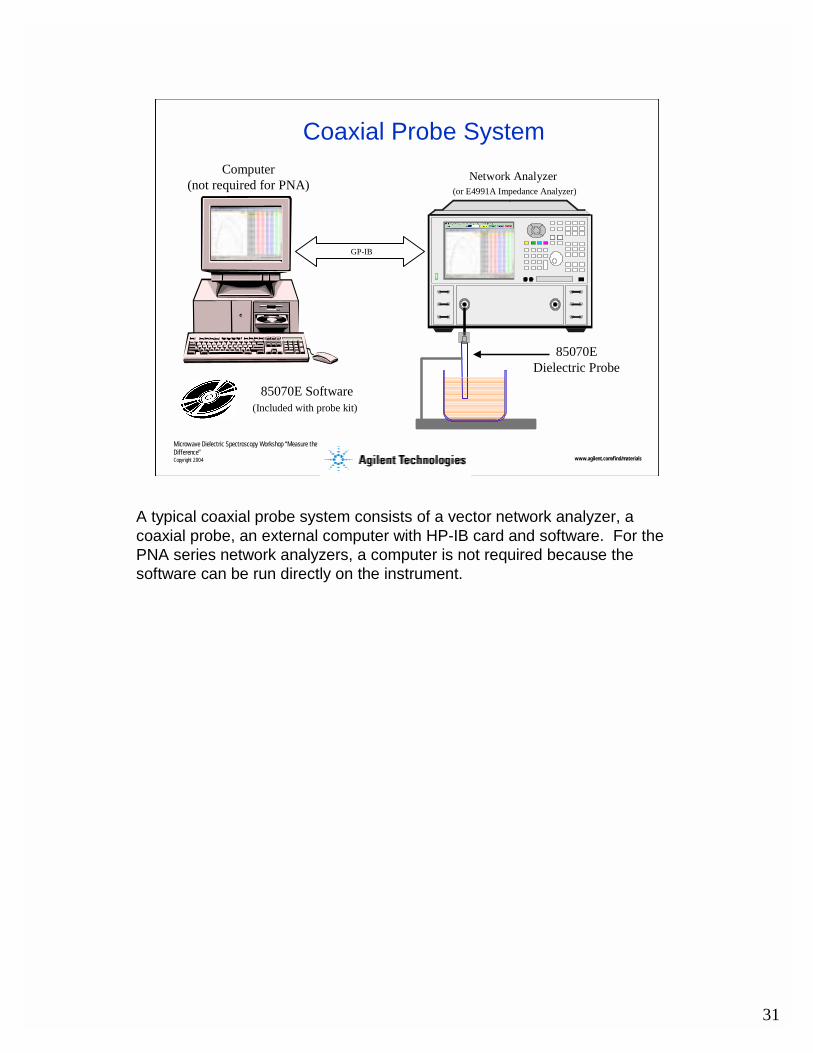
A typical coaxial probe system consists of a vector network analyzer, a coaxial probe, an external computer with HP-IB card and software. For the PNA series network analyzers, a computer is not required because the software can be run directly on the instrument.
32
Microwave Dielectric Spectroscopy Workshop “Measure the Difference”Copyright 2004 www.agilent.com/find/materials
Coaxial Probe TechniqueTwo Probe Designs
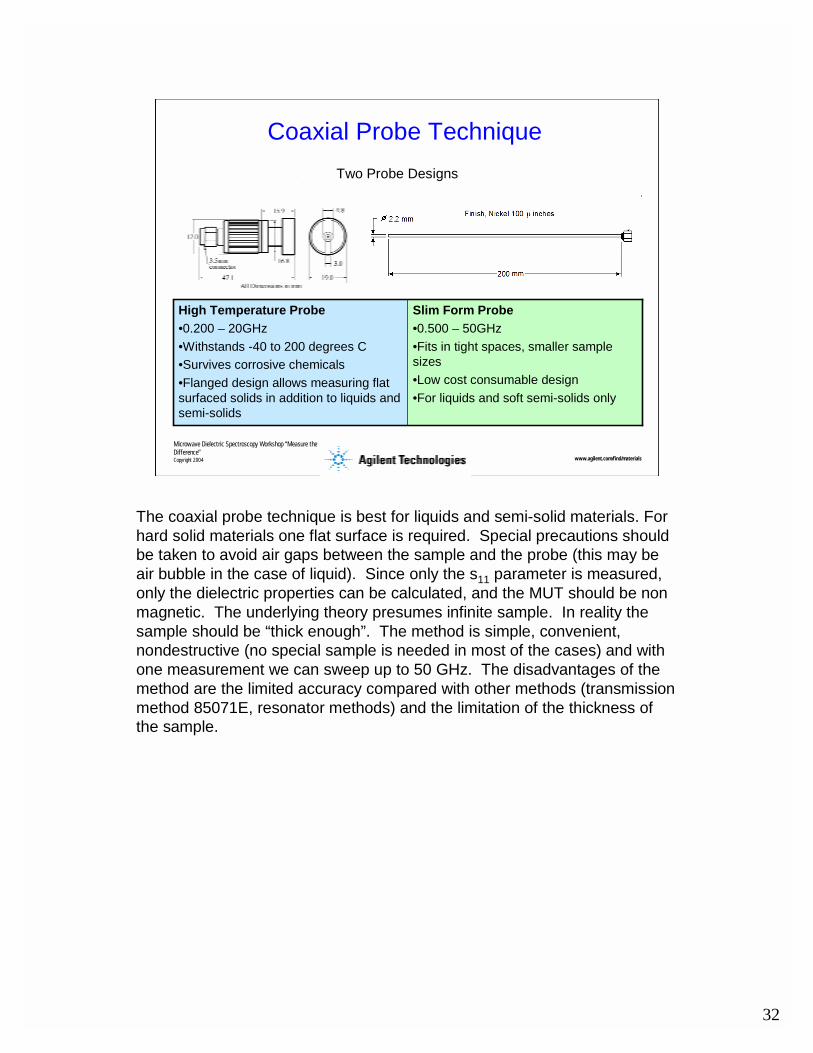
Slim Form Probe•0.500 – 50GHz•Fits in tight spaces, smaller sample sizes•Low cost consumable design•For liquids and soft semi-solids only
High Temperature Probe•0.200 – 20GHz•Withstands -40 to 200 degrees C •Survives corrosive chemicals•Flanged design allows measuring flat surfaced solids in addition to liquids and semi-solids
The coaxial probe technique is best for liquids and semi-solid materials. For hard solid materials one flat surface is required. Special precautions should be taken to avoid air gaps between the sample and the probe (this may be air bubble in the case of liquid). Since only the s11 parameter is measured, only the dielectric properties can be calculated, and the MUT should be non magnetic. The underlying theory presumes infinite sample. In reality the sample should be “thick enough”. The method is simple, convenient, nondestructive (no special sample is needed in most of the cases) and with one measurement we can sweep up to 50 GHz. The disadvantages of the method are the limited accuracy compared with other methods (transmission method 85071E, resonator methods) and the limitation of the thickness of the sample.
33
Microwave Dielectric Spectroscopy Workshop “Measure the Difference”Copyright 2004 www.agilent.com/find/materials
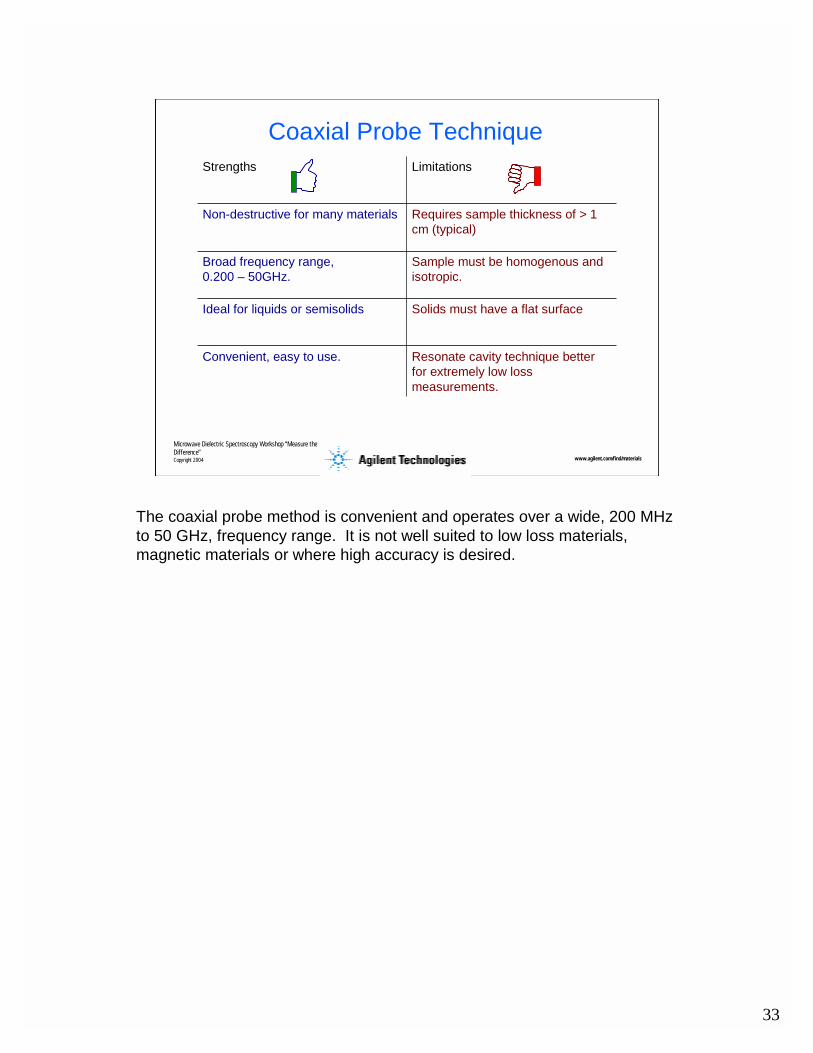
Coaxial Probe Technique
Resonate cavity technique better for extremely low loss measurements.
Convenient, easy to use.
Solids must have a flat surfaceIdeal for liquids or semisolids
Sample must be homogenous and isotropic.
Broad frequency range,0.200 – 50GHz.
Requires sample thickness of > 1 cm (typical)
Non-destructive for many materials
LimitationsStrengths
The coaxial probe method is convenient and operates over a wide, 200 MHz to 50 GHz, frequency range. It is not well suited to low loss materials, magnetic materials or where high accuracy is desired.
34
Microwave Dielectric Spectroscopy Workshop “Measure the Difference”Copyright 2004 www.agilent.com/find/materials
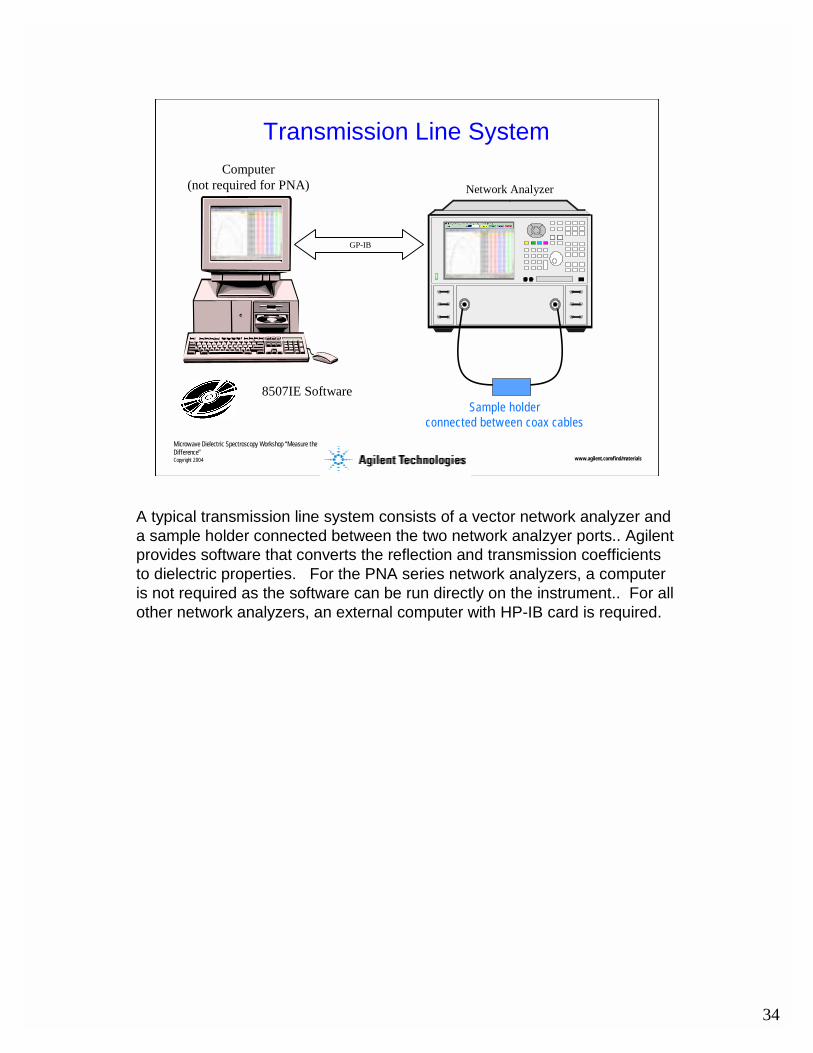
Transmission Line SystemComputer
(not required for PNA) Network Analyzer
GP-IB
8507IE SoftwareSample holder
connected between coax cables
A typical transmission line system consists of a vector network analyzer and a sample holder connected between the two network analzyer ports.. Agilentprovides software that converts the reflection and transmission coefficients to dielectric properties. For the PNA series network analyzers, a computer is not required as the software can be run directly on the instrument.. For all other network analyzers, an external computer with HP-IB card is required.
35
Microwave Dielectric Spectroscopy Workshop “Measure the Difference”Copyright 2004 www.agilent.com/find/materials
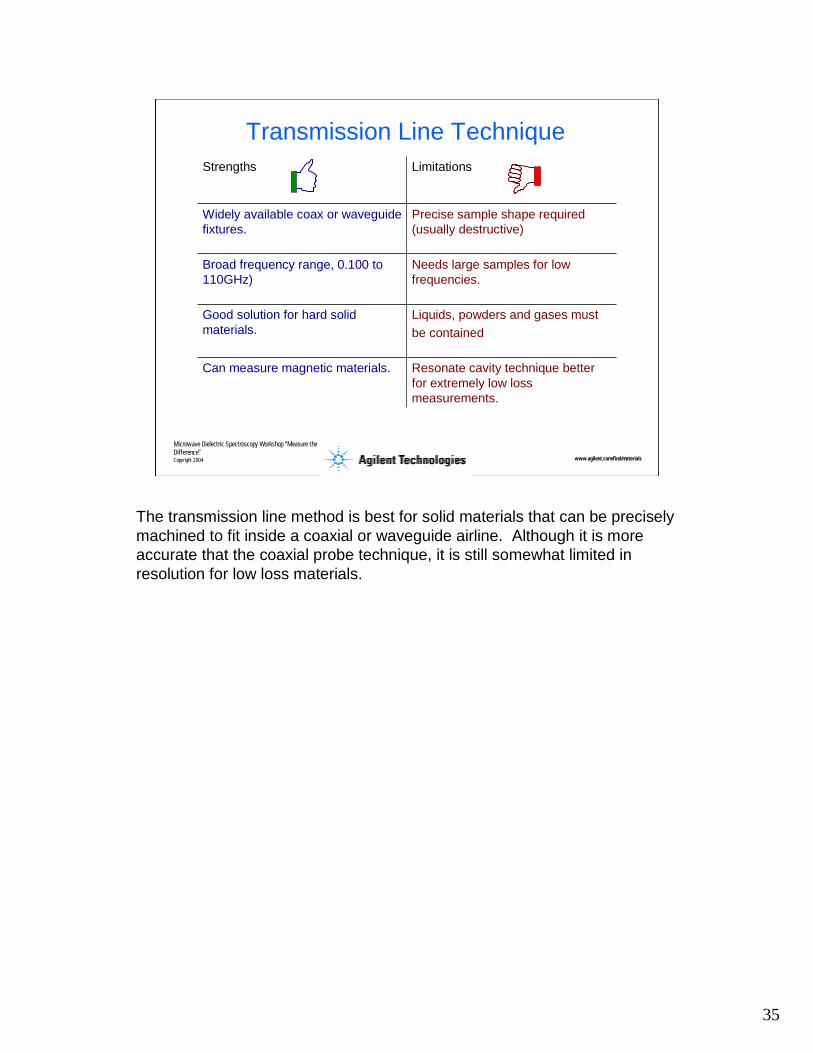
Transmission Line Technique
Resonate cavity technique better for extremely low loss measurements.
Can measure magnetic materials.
Liquids, powders and gases mustbe contained
Good solution for hard solid materials.
Needs large samples for low frequencies.
Broad frequency range, 0.100 to110GHz)
Precise sample shape required (usually destructive)
Widely available coax or waveguide fixtures.
LimitationsStrengths
The transmission line method is best for solid materials that can be precisely machined to fit inside a coaxial or waveguide airline. Although it is more accurate that the coaxial probe technique, it is still somewhat limited in resolution for low loss materials.
36
Microwave Dielectric Spectroscopy Workshop “Measure the Difference”Copyright 2004 www.agilent.com/find/materials
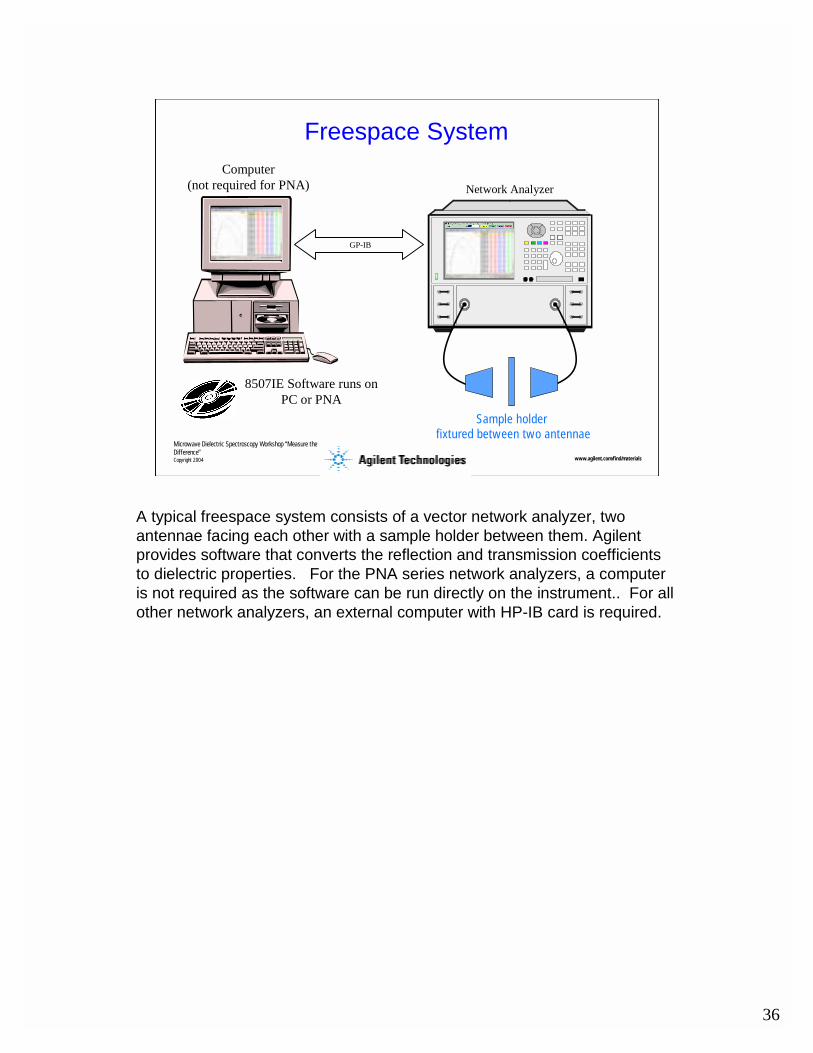
Freespace SystemComputer
(not required for PNA) Network Analyzer
GP-IB
8507IE Software runs on PC or PNA
Sample holder fixtured between two antennae
A typical freespace system consists of a vector network analyzer, two antennae facing each other with a sample holder between them. Agilentprovides software that converts the reflection and transmission coefficients to dielectric properties. For the PNA series network analyzers, a computer is not required as the software can be run directly on the instrument.. For all other network analyzers, an external computer with HP-IB card is required.
37
Microwave Dielectric Spectroscopy Workshop “Measure the Difference”Copyright 2004 www.agilent.com/find/materials
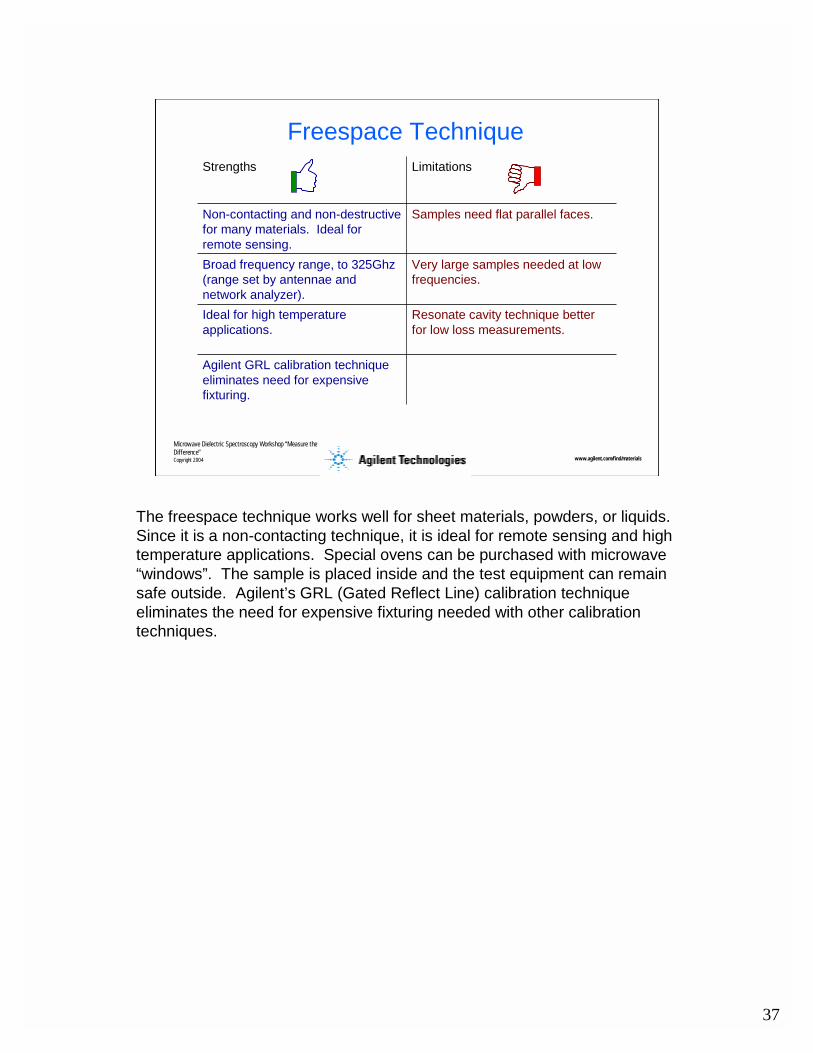
Freespace Technique
Agilent GRL calibration technique eliminates need for expensive fixturing.
Resonate cavity technique better for low loss measurements.
Ideal for high temperature applications.
Very large samples needed at low frequencies.
Broad frequency range, to 325Ghz (range set by antennae and network analyzer).
Samples need flat parallel faces. Non-contacting and non-destructive for many materials. Ideal for remote sensing.
LimitationsStrengths
The freespace technique works well for sheet materials, powders, or liquids. Since it is a non-contacting technique, it is ideal for remote sensing and high temperature applications. Special ovens can be purchased with microwave “windows”. The sample is placed inside and the test equipment can remainsafe outside. Agilent’s GRL (Gated Reflect Line) calibration technique eliminates the need for expensive fixturing needed with other calibration techniques.
38
Microwave Dielectric Spectroscopy Workshop “Measure the Difference”Copyright 2004 www.agilent.com/find/materials
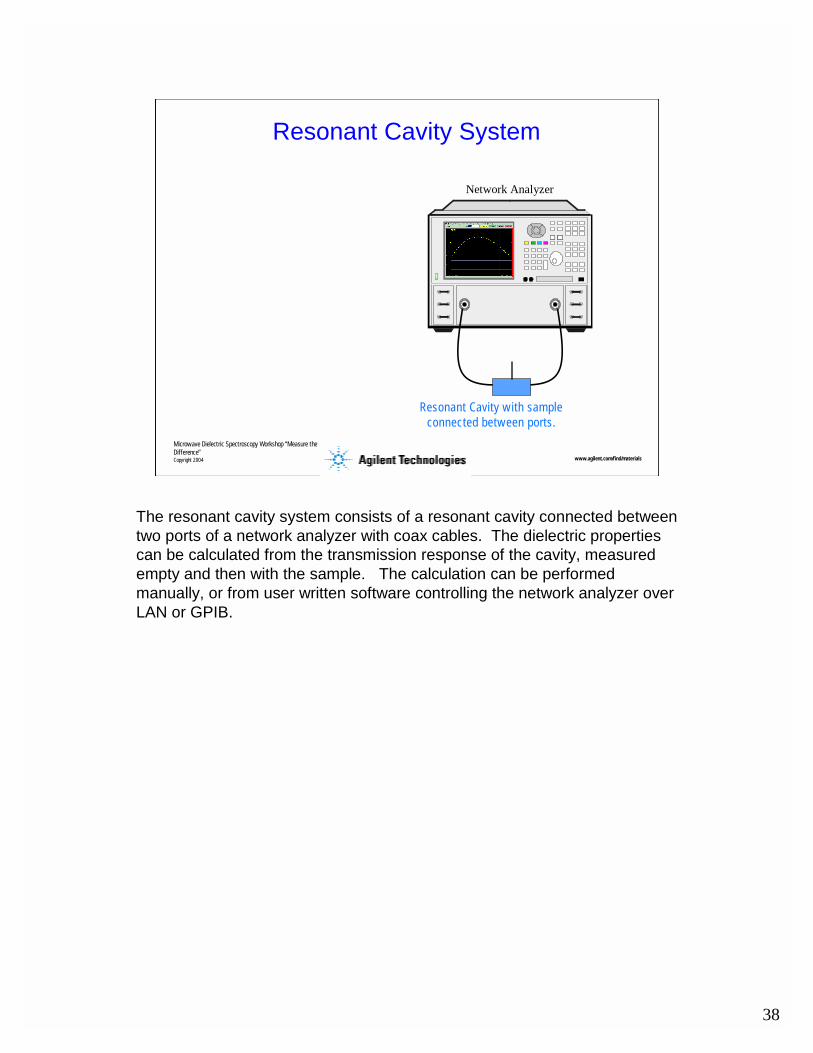
Resonant Cavity System
Network Analyzer
Resonant Cavity with sampleconnected between ports.
The resonant cavity system consists of a resonant cavity connected between two ports of a network analyzer with coax cables. The dielectric properties can be calculated from the transmission response of the cavity, measured empty and then with the sample. The calculation can be performed manually, or from user written software controlling the network analyzer over LAN or GPIB.
39
Microwave Dielectric Spectroscopy Workshop “Measure the Difference”Copyright 2004 www.agilent.com/find/materials
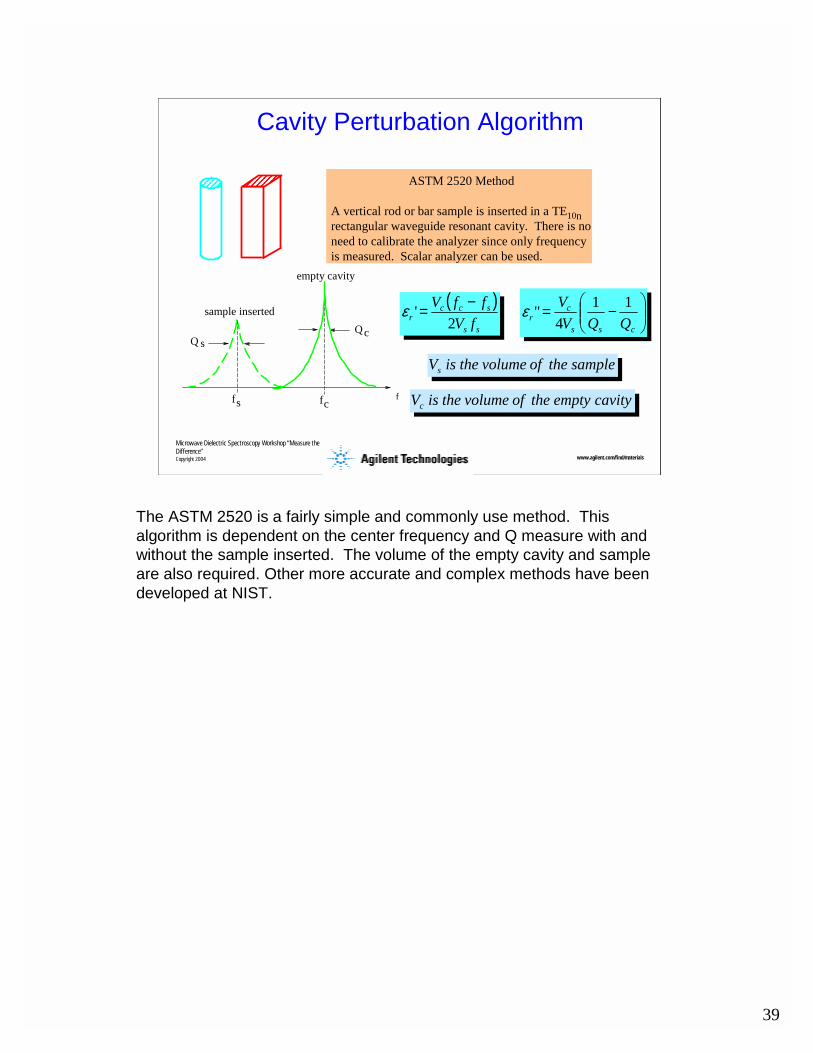
Cavity Perturbation Algorithm
Q
fs ffc
sQc
ASTM 2520 Method
A vertical rod or bar sample is inserted in a TE10nrectangular waveguide resonant cavity. There is no need to calibrate the analyzer since only frequency is measured. Scalar analyzer can be used.
empty cavity
sample inserted
−=
css
cr QQV
V 114
"ε( )ss
sccr fV
ffV2
' −=ε
sampletheofvolumetheisVs
cavityemptytheofvolumetheisVc
The ASTM 2520 is a fairly simple and commonly use method. This algorithm is dependent on the center frequency and Q measure with and without the sample inserted. The volume of the empty cavity and sample are also required. Other more accurate and complex methods have been developed at NIST.
40
Microwave Dielectric Spectroscopy Workshop “Measure the Difference”Copyright 2004 www.agilent.com/find/materials
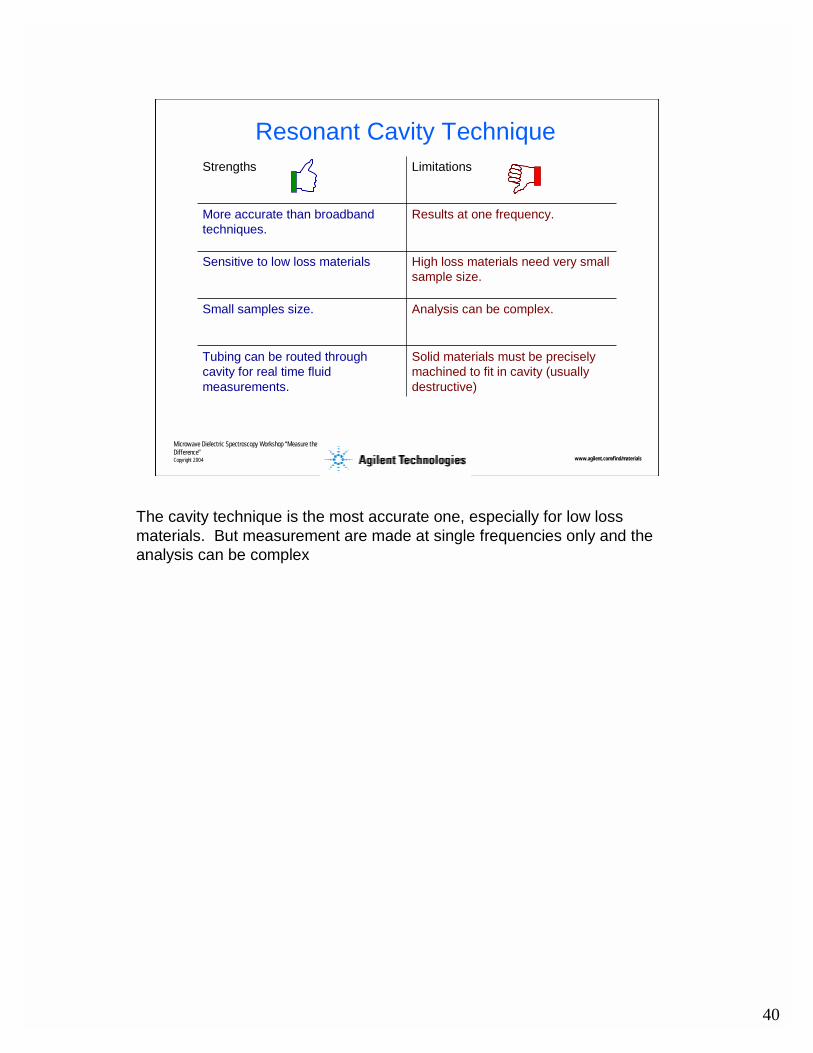
Resonant Cavity Technique
Solid materials must be preciselymachined to fit in cavity (usually destructive)
Tubing can be routed throughcavity for real time fluidmeasurements.
Analysis can be complex.Small samples size.
High loss materials need very small sample size.
Sensitive to low loss materials
Results at one frequency.More accurate than broadband techniques.
LimitationsStrengths
The cavity technique is the most accurate one, especially for low loss materials. But measurement are made at single frequencies only and the analysis can be complex
41
Microwave Dielectric Spectroscopy Workshop “Measure the Difference”Copyright 2004 www.agilent.com/find/materials
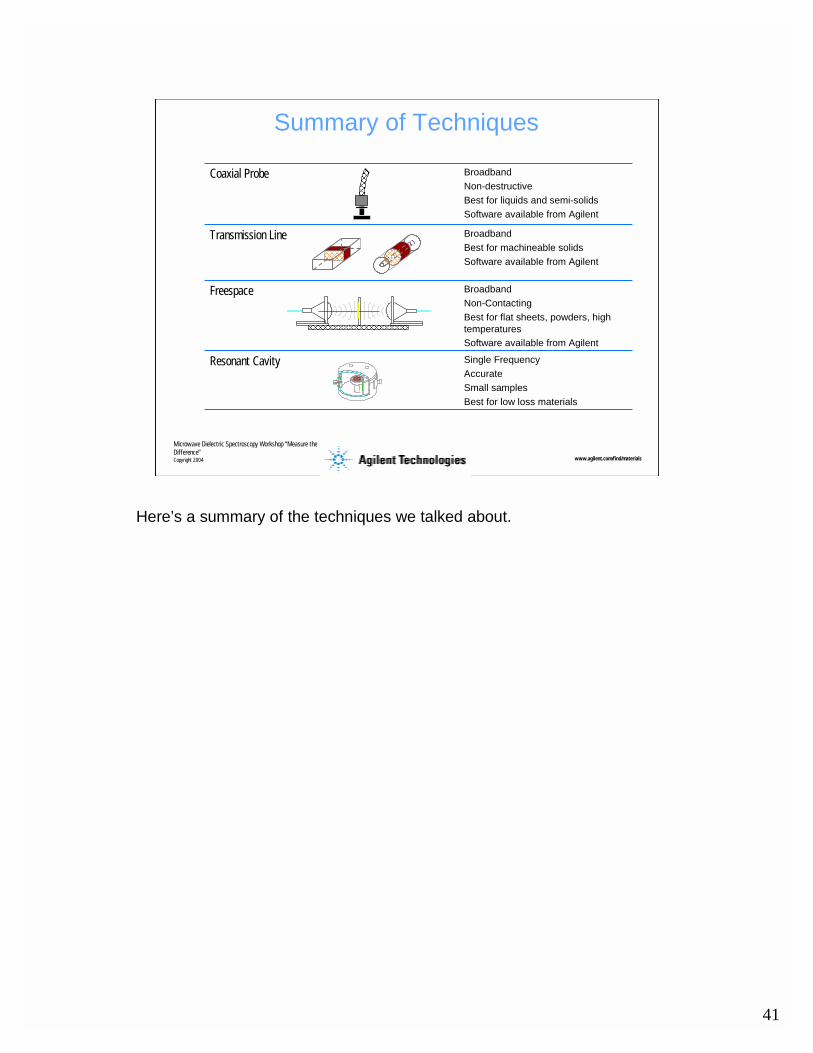
Summary of Techniques
Single FrequencyAccurateSmall samplesBest for low loss materials
Resonant Cavity
BroadbandNon-ContactingBest for flat sheets, powders, high temperaturesSoftware available from Agilent
Freespace
BroadbandBest for machineable solidsSoftware available from Agilent
Transmission Line
BroadbandNon-destructive Best for liquids and semi-solidsSoftware available from Agilent
Coaxial Probe
Here’s a summary of the techniques we talked about.

42
Microwave Dielectric Spectroscopy Workshop “Measure the Difference”Copyright 2004 www.agilent.com/find/materials
Check out our web site at:Check out our web site at:Check out our web site at:Check out our web site at: www/agilent.com/find/materialswww/agilent.com/find/materialswww/agilent.com/find/materialswww/agilent.com/find/materials
Call us at:Call us at:Call us at:Call us at:
+1 (800) 829+1 (800) 829+1 (800) 829+1 (800) 829----4444444444444444
Email us at:Email us at:Email us at:Email us at: [email protected]@[email protected]@agilent.com
For More Information
Agilent technologies is interested in working with you to determine if microwave/dielectric spectroscopy can be used to solve your measurement problem. If you have any questions or would like to discuss your measurement problems with us please drop us an email or contact your local Agilent representative. If practical we would like to make arrangements to measure your material to see if microwave/dielectric spectroscopy would be useful.