microwave dielectric heating of drops in...
TRANSCRIPT
PAPER www.rsc.org/loc | Lab on a Chip
Microwave dielectric heating of drops in microfluidic devices
David Issadore,a Katherine J. Humphry,b Keith A. Brown,a Lori Sandberg,c David A. Weitzab andRobert M. Westervelt*ab
Received 12th December 2008, Accepted 2nd March 2009
First published as an Advance Article on the web 19th March 2009
DOI: 10.1039/b822357b
We present a technique to locally and rapidly heat water drops in microfluidic devices with microwave
dielectric heating. Water absorbs microwave power more efficiently than polymers, glass, and oils due
to its permanent molecular dipole moment that has large dielectric loss at GHz frequencies. The
relevant heat capacity of the system is a single thermally isolated picolitre-scale drop of water, enabling
very fast thermal cycling. We demonstrate microwave dielectric heating in a microfluidic device that
integrates a flow-focusing drop maker, drop splitters, and metal electrodes to locally deliver microwave
power from an inexpensive, commercially available 3.0 GHz source and amplifier. The temperature
change of the drops is measured by observing the temperature dependent fluorescence intensity of
cadmium selenide nanocrystals suspended in the water drops. We demonstrate characteristic heating
times as short as 15 ms to steady-state temperature changes as large as 30 �C above the base
temperature of the microfluidic device. Many common biological and chemical applications require
rapid and local control of temperature and can benefit from this new technique.
Introduction
The miniaturization of the handling of liquid and biological
samples has enabled great advances in fields such as drug
discovery, genetic sequencing and synthesis, cell sorting, single
cell gene expression studies, and low-cost portable medicine.1–7 At
the forefront of this technology are the micro-fabricated pipes,
valves, pumps, and mixers of microfluidics that are leading to
integrated lab-on-a-chip devices. These integrated microfluidic
devices are causing a paradigm shift in fluid handling that is
analogous to what integrated circuit technology did for elec-
tronics half of a century ago.6 A growing library of elements for
lab-on-a-chip systems have been developed in recent years for
tasks such as the mixing of reagents, detecting and counting of
cells, sorting cells, genetic analysis, and protein detection.1–7 There
is one function, however, that is crucial to many applications and
which has remained a challenge: the local control of temperature.
The large surface area to volume ratios found in micrometre-scale
channels and the close proximity of microfluidic elements make
temperature control in such systems a unique challenge.8,9
Much work has been done in the last decade to improve local
temperature control in microfluidic systems. The most common
technique uses Joule heated metal wires and thin films to conduct
heat into fluid channels.10–13 The thermal conductivity of
microfluidic devices control the localization of the temperature
change and tends to be in the order of centimetres.9,11 Temporal
control is limited by the heat capacity and thermal coupling of
the microfluidic device to the environment and thermal relaxa-
tion times tend to be in the order of seconds.9,11 Alternative
aSchool of Engineering and Applied Sciences, Harvard University,Cambridge, MA, 02138, USA. E-mail: [email protected] of Physics, Harvard University, Cambridge, MA, 02138,USAcCollege of Engineering and Applied Sciences, University of Wyoming,Laramie, WY, 82071, USA
This journal is ª The Royal Society of Chemistry 2009
techniques to improve the localization and response time have
been developed, such as those that use non-contact infrared
heating of water in glass microfluidic systems14 and integrated
micrometre size Peltier Junctions to transfer heat between two
channels containing fluid at different temperatures.15 Fluids have
also been cooled on millisecond time scales with evaporative
cooling by pumping gasses into the fluid channels.16
The focus of our research is to integrate electronics with
microfluidics to bring new capabilities to lab-on-a-chip
systems.6,7 In this paper we present a technique to locally and
rapidly heat water in drop based microfluidic systems with
microwave dielectric heating. The devices are fabricated using
soft lithography and are connected to inexpensive commercially
available microwave electronics. This work builds on previous
work in which microwaves have been used to heat liquid in
microfluidic devices17–20 by achieving significantly faster thermal
response times and a greater temperature range. In our device,
drops of water are thermally isolated from the bulk of the
device and this allows exceptionally fast heating and cooling
times ss ¼ 15 ms to be attained and the drops’ temperature to be
increased by 30 �C. The coupling of microwave electronics with
microfluidics technology offers an inexpensive and easily inte-
grated technique to locally and rapidly control temperature.
Theory of dielectric heating
Dielectric heating describes the phenomenon by which a material
is heated with a time-varying electric field. Induced and intrinsic
dipole moments within an object will align themselves with
a time-varying electric field. The energy associated with this
alignment is viscously dissipated as heat into the surrounding
solution. The power density P absorbed by a dielectric material is
given by the frequency u of the applied electric field, the loss
factor 300 of the material, the vacuum permittivity 30, and the
electric field strength |E| with the expression:21
Lab Chip, 2009, 9, 1701–1706 | 1701
P ¼ u3o300|E|2 (1)
The loss factor of the material is dependent on the frequency of
the electric field and the characteristic time s of the dielectric
relaxation of the material, with the expression:
300 ¼ ð3s � 3NÞus
1þ ðusÞ2(2)
where 3s ¼ 78.430 is the low frequency dielectric constant of
water, 3N ¼ 1.7830 is the optical dielectric constant, and s ¼ 9.55
ps is the dielectric relaxation time of water at T ¼ 25 �C.22,23
Due to water’s large dielectric loss at GHz frequencies,
microwave power is absorbed much more strongly by water
rather than PDMS or glass. Our device operates at 3.0 GHz,
a frequency very close to that of commercial microwave
ovens (2.45 GHz), that is below the frequency associated with
the relaxation time of water but where water still readily
absorbs power. It is inexpensive to engineer electronics to
produce and deliver 3.0 GHz frequencies because it is near
the well-developed frequencies of the telecommunications
industry.
Model of dielectric heating of drops
Two independent figures of merit describe the heater, the steady-
state change in temperature DTss that the drops attain and the
characteristic time ss that it takes to change the temperature. The
steady-state temperature occurs when the microwave power
entering the drop equals the rate that heat leaves the drop into
the thermal bath. The thermal relaxation time depends only on
the geometry and the thermal properties of the drops and the
channel and is independent of the microwave power.
To describe our heater we use a simplified model in which the
temperature of the channel walls do not change. The thermal
conductivity of the glass and PDMS channel walls is much larger
than that of the fluorocarbon (FC) oil in which the drops are
suspended, which allow the glass and PDMS mold to act as
a large thermal reservoir that keeps the channel walls pinned to
the base temperature.
The drop is modelled as having a heat capacity that connects
to the thermal reservoir through a thermal resistance. The
drop has a heat capacity C ¼ VCw that connects to the thermal
reservoir with a thermal resistance R ¼ L/Akoil, where V is the
volume and A is the surface area of the drop, Cw is the heat
capacity per volume of water, L is the characteristic length
between the drop and the channel wall, and koil is the
thermal conductivity of the oil surrounding the drop. A steady-
state temperature DTss is reached when the microwave
power PV entering the drop is equal to the power leaving
the drop DTsskoilA/L. We find the steady-state temperature
DTss ¼ PVR to be:
DTss ¼V
A
L
koil
P (3)
The system has a characteristic time scale ss ¼ RC that describes
the thermal response time of the system,
ss ¼V
A
L
koil
Cw (4)
1702 | Lab Chip, 2009, 9, 1701–1706
The characteristic time scale ss describes the thermal relaxation
time, the time it takes for the drop to reach an equilibrium
temperature when the microwave power is turned on and the
time that it takes for the drop to return to the base temperature of
the device when the microwaves are turned off.
This simplified model describes several key features of the
microwave heater. The steady-state temperature is linearly
proportional to the microwave power, whereas the characteristic
thermal relaxation time is independent of the microwave power.
The characteristic time and the steady-state temperature are both
proportional to the volume to surface ratio of the drops. A trade-
off relation exists between the rate of heating 1/ss and the steady-
state temperature, whereby a larger volume to surface ratio
reduces the thermal relaxation time of the heater but decreases its
steady-state temperature for a given microwave power, and vice
versa. Similarly an increase in the ratio of the characteristic
length between the drop and the channel wall and the thermal
conductivity of the oil L/koil increases the thermal relaxation time
and increases the steady-state temperature.
Methods
The devices are fabricated using poly(dimethylsiloxane)
(PDMS)-on-glass drop-based microfluidics. A schematic of the
device is shown in Fig. 1a. Microwave power is locally delivered
via metal electrodes that are directly integrated into the micro-
fluidic device and that run parallel to the fluid channel. The drops
are thermally insulated from the bulk by being suspended in low
thermal conductivity oil. Syringe pumps provide the oil and
water at constant flow rates to the microfluidic device. A drop
maker and two drop splitters in series create drops that are
properly sized for the microwave heater. The microwave power is
created off chip using inexpensive commercial components.
Drops are created using a flow-focusing geometry24 as is shown
in Fig. 1b. A fluorocarbon oil (Fluorinert FC-40, 3M) is used as
the continuous phase and the resulting drops contain 0.1 mM of
carboxyl coated CdSe nanocrystal (Invitrogen) suspended in
a phosphate buffered saline (PBS) solution. A surfactant
comprised of a polyethyleneglycol (PEG) head group and
a fluorocarbon tail (RainDance Technologies) is used to stabilize
the drops.25 The walls of the microfluidic channels are coated
with Aquapel� (PPG Industries) to ensure that they are prefer-
entially wet by the fluorocarbon oil. Fluid flow is controlled via
syringe pumps.
To make drops smaller than the channel height, and thus
separated from the walls of the channel to ensure adequate
thermal isolation, we use drop splitters26 as is shown in Fig. 1c.
The drop splitters are designed to break each drop into two drops
of equal volume. Passing a spherical drop through two drop
splitters in series decreases the radius of a drop by a factor of
(½)2/3 ¼ 0.63. Drop splitters allow the device to be made in
a single fabrication step, because they remove the necessity of
making the drop maker with a channel height smaller than the
rest of the device.24
The metal electrodes are directly integrated into the PDMS
device using a low-melt solder fill technique.27 The masks for the
soft lithography process are designed to include channels for
fluid flow and a set to be filled with metal to form electrodes.
After inlet holes have been punched into the PDMS and the
This journal is ª The Royal Society of Chemistry 2009
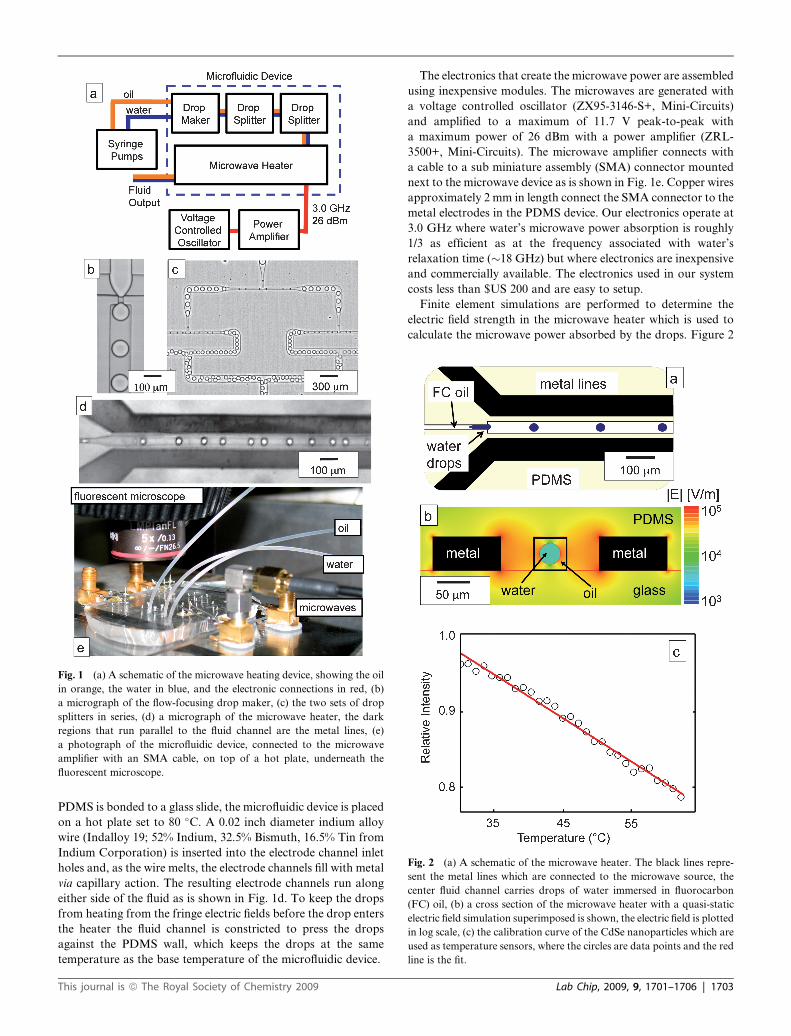
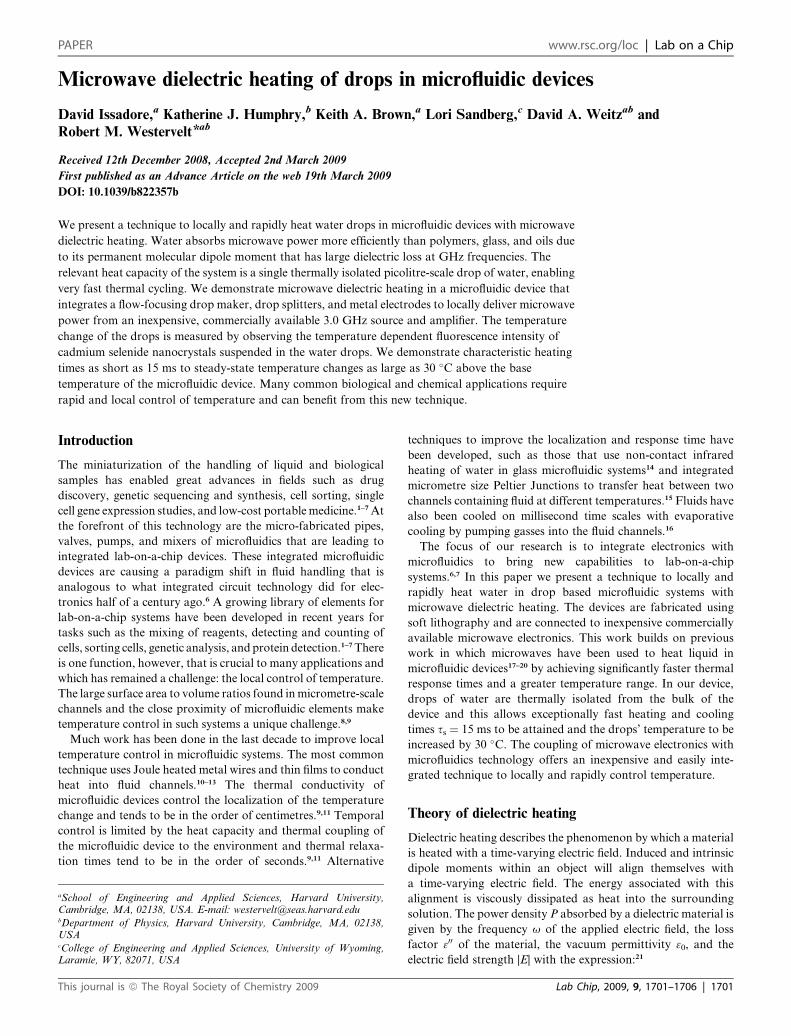
Fig. 1 (a) A schematic of the microwave heating device, showing the oil
in orange, the water in blue, and the electronic connections in red, (b)
a micrograph of the flow-focusing drop maker, (c) the two sets of drop
splitters in series, (d) a micrograph of the microwave heater, the dark
regions that run parallel to the fluid channel are the metal lines, (e)
a photograph of the microfluidic device, connected to the microwave
amplifier with an SMA cable, on top of a hot plate, underneath the
fluorescent microscope.
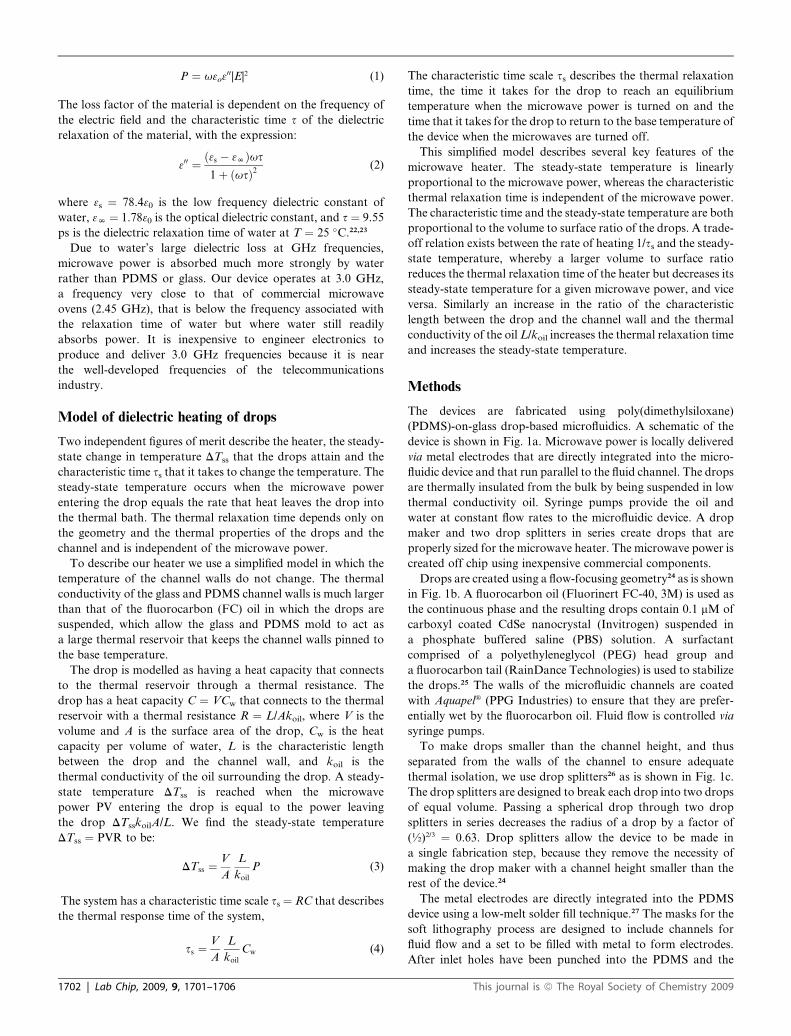
Fig. 2 (a) A schematic of the microwave heater. The black lines repre-
sent the metal lines which are connected to the microwave source, the
center fluid channel carries drops of water immersed in fluorocarbon
(FC) oil, (b) a cross section of the microwave heater with a quasi-static
electric field simulation superimposed is shown, the electric field is plotted
in log scale, (c) the calibration curve of the CdSe nanoparticles which are
used as temperature sensors, where the circles are data points and the red
line is the fit.
PDMS is bonded to a glass slide, the microfluidic device is placed
on a hot plate set to 80 �C. A 0.02 inch diameter indium alloy
wire (Indalloy 19; 52% Indium, 32.5% Bismuth, 16.5% Tin from
Indium Corporation) is inserted into the electrode channel inlet
holes and, as the wire melts, the electrode channels fill with metal
via capillary action. The resulting electrode channels run along
either side of the fluid as is shown in Fig. 1d. To keep the drops
from heating from the fringe electric fields before the drop enters
the heater the fluid channel is constricted to press the drops
against the PDMS wall, which keeps the drops at the same
temperature as the base temperature of the microfluidic device.
This journal is ª The Royal Society of Chemistry 2009
The electronics that create the microwave power are assembled
using inexpensive modules. The microwaves are generated with
a voltage controlled oscillator (ZX95-3146-S+, Mini-Circuits)
and amplified to a maximum of 11.7 V peak-to-peak with
a maximum power of 26 dBm with a power amplifier (ZRL-
3500+, Mini-Circuits). The microwave amplifier connects with
a cable to a sub miniature assembly (SMA) connector mounted
next to the microwave device as is shown in Fig. 1e. Copper wires
approximately 2 mm in length connect the SMA connector to the
metal electrodes in the PDMS device. Our electronics operate at
3.0 GHz where water’s microwave power absorption is roughly
1/3 as efficient as at the frequency associated with water’s
relaxation time (�18 GHz) but where electronics are inexpensive
and commercially available. The electronics used in our system
costs less than $US 200 and are easy to setup.
Finite element simulations are performed to determine the
electric field strength in the microwave heater which is used to
calculate the microwave power absorbed by the drops. Figure 2
Lab Chip, 2009, 9, 1701–1706 | 1703
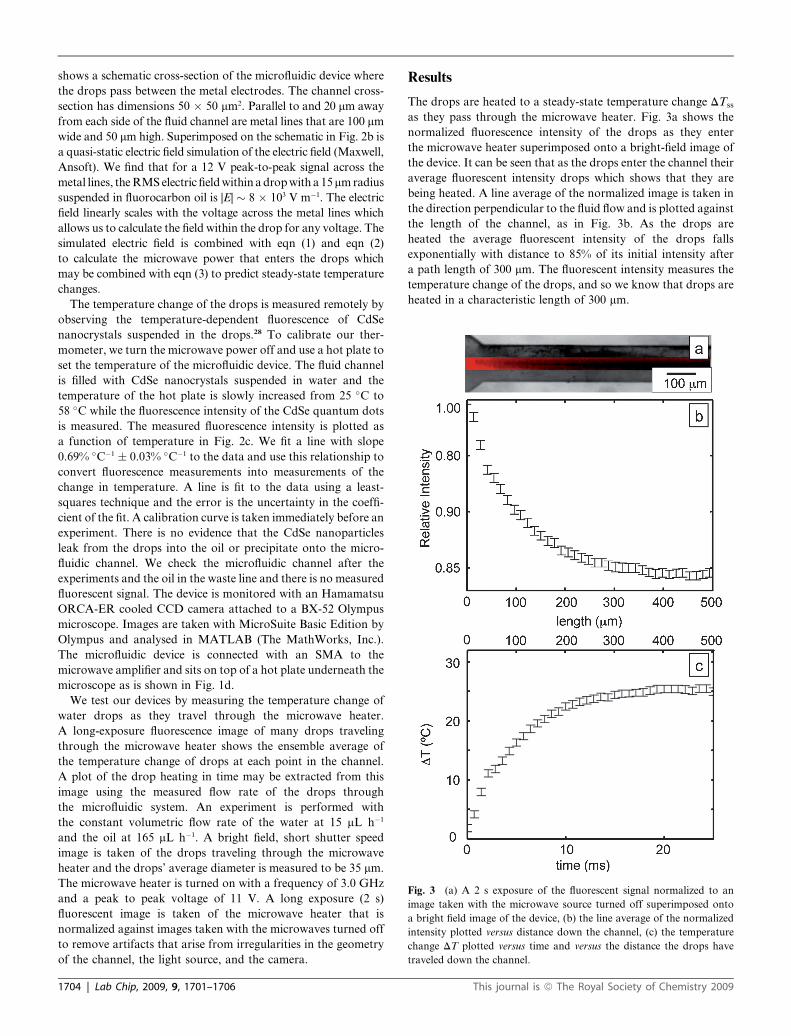
Fig. 3 (a) A 2 s exposure of the fluorescent signal normalized to an
image taken with the microwave source turned off superimposed onto
a bright field image of the device, (b) the line average of the normalized
intensity plotted versus distance down the channel, (c) the temperature
change DT plotted versus time and versus the distance the drops have
traveled down the channel.
shows a schematic cross-section of the microfluidic device where
the drops pass between the metal electrodes. The channel cross-
section has dimensions 50 � 50 mm2. Parallel to and 20 mm away
from each side of the fluid channel are metal lines that are 100 mm
wide and 50 mm high. Superimposed on the schematic in Fig. 2b is
a quasi-static electric field simulation of the electric field (Maxwell,
Ansoft). We find that for a 12 V peak-to-peak signal across the
metal lines, the RMS electric field within a drop with a 15 mm radius
suspended in fluorocarbon oil is |E| � 8 � 103 V m�1. The electric
field linearly scales with the voltage across the metal lines which
allows us to calculate the field within the drop for any voltage. The
simulated electric field is combined with eqn (1) and eqn (2)
to calculate the microwave power that enters the drops which
may be combined with eqn (3) to predict steady-state temperature
changes.
The temperature change of the drops is measured remotely by
observing the temperature-dependent fluorescence of CdSe
nanocrystals suspended in the drops.28 To calibrate our ther-
mometer, we turn the microwave power off and use a hot plate to
set the temperature of the microfluidic device. The fluid channel
is filled with CdSe nanocrystals suspended in water and the
temperature of the hot plate is slowly increased from 25 �C to
58 �C while the fluorescence intensity of the CdSe quantum dots
is measured. The measured fluorescence intensity is plotted as
a function of temperature in Fig. 2c. We fit a line with slope
0.69% �C�1 � 0.03% �C�1 to the data and use this relationship to
convert fluorescence measurements into measurements of the
change in temperature. A line is fit to the data using a least-
squares technique and the error is the uncertainty in the coeffi-
cient of the fit. A calibration curve is taken immediately before an
experiment. There is no evidence that the CdSe nanoparticles
leak from the drops into the oil or precipitate onto the micro-
fluidic channel. We check the microfluidic channel after the
experiments and the oil in the waste line and there is no measured
fluorescent signal. The device is monitored with an Hamamatsu
ORCA-ER cooled CCD camera attached to a BX-52 Olympus
microscope. Images are taken with MicroSuite Basic Edition by
Olympus and analysed in MATLAB (The MathWorks, Inc.).
The microfluidic device is connected with an SMA to the
microwave amplifier and sits on top of a hot plate underneath the
microscope as is shown in Fig. 1d.
We test our devices by measuring the temperature change of
water drops as they travel through the microwave heater.
A long-exposure fluorescence image of many drops traveling
through the microwave heater shows the ensemble average of
the temperature change of drops at each point in the channel.
A plot of the drop heating in time may be extracted from this
image using the measured flow rate of the drops through
the microfluidic system. An experiment is performed with
the constant volumetric flow rate of the water at 15 mL h�1
and the oil at 165 mL h�1. A bright field, short shutter speed
image is taken of the drops traveling through the microwave
heater and the drops’ average diameter is measured to be 35 mm.
The microwave heater is turned on with a frequency of 3.0 GHz
and a peak to peak voltage of 11 V. A long exposure (2 s)
fluorescent image is taken of the microwave heater that is
normalized against images taken with the microwaves turned off
to remove artifacts that arise from irregularities in the geometry
of the channel, the light source, and the camera.
1704 | Lab Chip, 2009, 9, 1701–1706
Results
The drops are heated to a steady-state temperature change DTss
as they pass through the microwave heater. Fig. 3a shows the
normalized fluorescence intensity of the drops as they enter
the microwave heater superimposed onto a bright-field image of
the device. It can be seen that as the drops enter the channel their
average fluorescent intensity drops which shows that they are
being heated. A line average of the normalized image is taken in
the direction perpendicular to the fluid flow and is plotted against
the length of the channel, as in Fig. 3b. As the drops are
heated the average fluorescent intensity of the drops falls
exponentially with distance to 85% of its initial intensity after
a path length of 300 mm. The fluorescent intensity measures the
temperature change of the drops, and so we know that drops are
heated in a characteristic length of 300 mm.
This journal is ª The Royal Society of Chemistry 2009
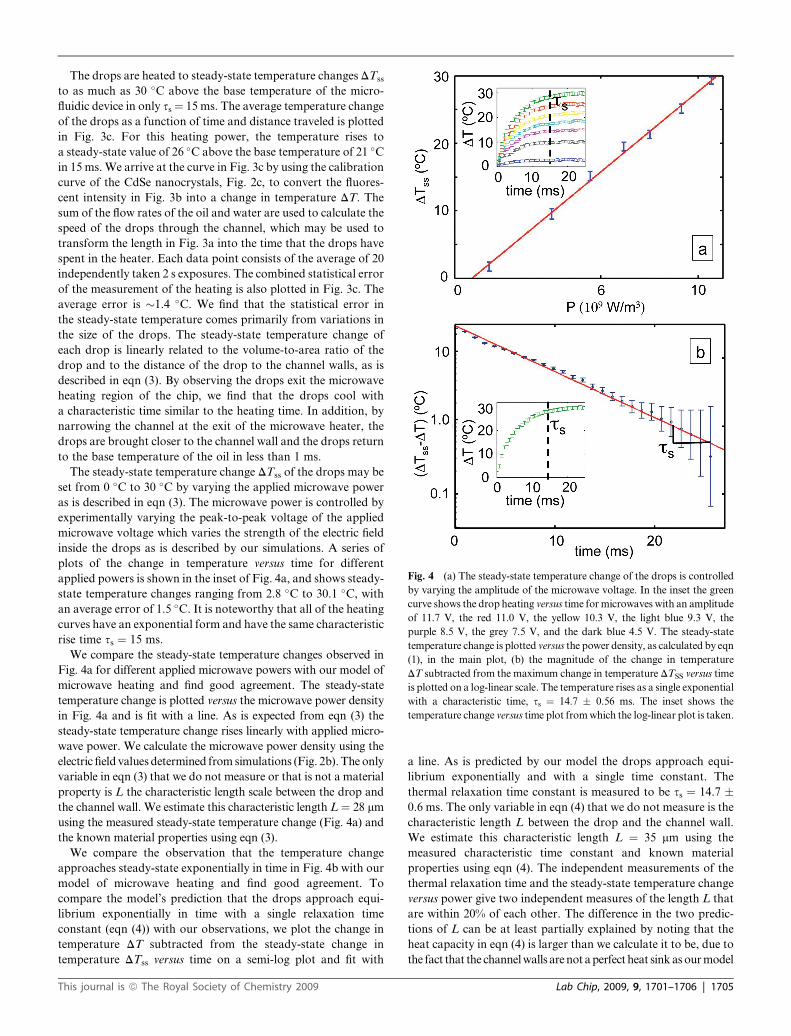
Fig. 4 (a) The steady-state temperature change of the drops is controlled
by varying the amplitude of the microwave voltage. In the inset the green
curve shows the drop heating versus time for microwaves with an amplitude
of 11.7 V, the red 11.0 V, the yellow 10.3 V, the light blue 9.3 V, the
purple 8.5 V, the grey 7.5 V, and the dark blue 4.5 V. The steady-state
temperature change is plotted versus the power density, as calculated by eqn
(1), in the main plot, (b) the magnitude of the change in temperature
DT subtracted from the maximum change in temperature DTSS versus time
is plotted on a log-linear scale. The temperature rises as a single exponential
with a characteristic time, ss ¼ 14.7 � 0.56 ms. The inset shows the
temperature change versus time plot from which the log-linear plot is taken.
The drops are heated to steady-state temperature changes DTss
to as much as 30 �C above the base temperature of the micro-
fluidic device in only ss¼ 15 ms. The average temperature change
of the drops as a function of time and distance traveled is plotted
in Fig. 3c. For this heating power, the temperature rises to
a steady-state value of 26 �C above the base temperature of 21 �C
in 15 ms. We arrive at the curve in Fig. 3c by using the calibration
curve of the CdSe nanocrystals, Fig. 2c, to convert the fluores-
cent intensity in Fig. 3b into a change in temperature DT. The
sum of the flow rates of the oil and water are used to calculate the
speed of the drops through the channel, which may be used to
transform the length in Fig. 3a into the time that the drops have
spent in the heater. Each data point consists of the average of 20
independently taken 2 s exposures. The combined statistical error
of the measurement of the heating is also plotted in Fig. 3c. The
average error is �1.4 �C. We find that the statistical error in
the steady-state temperature comes primarily from variations in
the size of the drops. The steady-state temperature change of
each drop is linearly related to the volume-to-area ratio of the
drop and to the distance of the drop to the channel walls, as is
described in eqn (3). By observing the drops exit the microwave
heating region of the chip, we find that the drops cool with
a characteristic time similar to the heating time. In addition, by
narrowing the channel at the exit of the microwave heater, the
drops are brought closer to the channel wall and the drops return
to the base temperature of the oil in less than 1 ms.
The steady-state temperature change DTss of the drops may be
set from 0 �C to 30 �C by varying the applied microwave power
as is described in eqn (3). The microwave power is controlled by
experimentally varying the peak-to-peak voltage of the applied
microwave voltage which varies the strength of the electric field
inside the drops as is described by our simulations. A series of
plots of the change in temperature versus time for different
applied powers is shown in the inset of Fig. 4a, and shows steady-
state temperature changes ranging from 2.8 �C to 30.1 �C, with
an average error of 1.5 �C. It is noteworthy that all of the heating
curves have an exponential form and have the same characteristic
rise time ss ¼ 15 ms.
We compare the steady-state temperature changes observed in
Fig. 4a for different applied microwave powers with our model of
microwave heating and find good agreement. The steady-state
temperature change is plotted versus the microwave power density
in Fig. 4a and is fit with a line. As is expected from eqn (3) the
steady-state temperature change rises linearly with applied micro-
wave power. We calculate the microwave power density using the
electric field values determined from simulations (Fig. 2b). The only
variable in eqn (3) that we do not measure or that is not a material
property is L the characteristic length scale between the drop and
the channel wall. We estimate this characteristic length L ¼ 28 mm
using the measured steady-state temperature change (Fig. 4a) and
the known material properties using eqn (3).
We compare the observation that the temperature change
approaches steady-state exponentially in time in Fig. 4b with our
model of microwave heating and find good agreement. To
compare the model’s prediction that the drops approach equi-
librium exponentially in time with a single relaxation time
constant (eqn (4)) with our observations, we plot the change in
temperature DT subtracted from the steady-state change in
temperature DTss versus time on a semi-log plot and fit with
This journal is ª The Royal Society of Chemistry 2009
a line. As is predicted by our model the drops approach equi-
librium exponentially and with a single time constant. The
thermal relaxation time constant is measured to be ss ¼ 14.7 �0.6 ms. The only variable in eqn (4) that we do not measure is the
characteristic length L between the drop and the channel wall.
We estimate this characteristic length L ¼ 35 mm using the
measured characteristic time constant and known material
properties using eqn (4). The independent measurements of the
thermal relaxation time and the steady-state temperature change
versus power give two independent measures of the length L that
are within 20% of each other. The difference in the two predic-
tions of L can be at least partially explained by noting that the
heat capacity in eqn (4) is larger than we calculate it to be, due to
the fact that the channel walls are not a perfect heat sink as our model
Lab Chip, 2009, 9, 1701–1706 | 1705
assumes. The agreement between the two independent measure-
ments supports our simple model for microwave heating of drops.
Discussion
We have demonstrated an integrated microfluidic microwave
dielectric heater that locally and rapidly increases the tempera-
ture of drops of water in oil. The large absorption of microwave
power by water relative to oil, glass, and PDMS allows local and
rapid heating in microfluidic devices without difficult fabrication.
Both improving the insulation of drops from the channel walls
and increasing the volume to surface area ratio of the drops
would allow for larger temperature changes. The statistical error
in the steady-state temperature of the drops can be improved by
reducing variations in the drop size that arise from fluctuations in
the flow from the syringe pumps.
Microwave dielectric heating of drops is well suited for inte-
gration with hybrid integrated circuit (IC)/microfluidic
systems.6,7 Dielectrophoresis chips use arrays of 11 � 11 mm2
electrodes to trap and move drops or cells inside a microfluidic
chamber.7 If electrodes on the chip can be driven with voltages at
GHz frequencies, then one can use the chip to locally heat single
drops using the technique outlined in this paper. Chip based
thermal control on pL drops would prove to be a valuable tool
for a number of applications, including DNA analysis.6
Microwave dielectric heating has many exciting scientific and
technological applications. One noteworthy potential application
for rapid, localized heating in microfluidic devices is PCR.11–16
Our heater can raise the temperature of drops up to 30 �C above
the base temperature of the oil in which the drops are suspended.
By setting the base temperature of the oil in our device to 65 �C
and appropriately setting the microwave power, a 30 �C change in
temperature could cycle the temperature from 65 �C to 95 �C as
required for PCR. Drop-based PCR, which would be especially
well suited for our technique, allows for the rapid analysis of large
populations of genes and enzymes. Our technique might also be
used to set temperatures rapidly and controllably in biological
and chemical assays, such as for protein denaturing studies29 and
enzyme optimization assays,30 where observations of thermal
responses are made on the millisecond time scale.
Acknowledgements
We would like to acknowledge generous support from the Har-
vard-MIT Center for Cancer Nanotechnology Excellence
(CCNE), the Department of Defense (DoD) through the
National Defense Science & Engineering Graduate Fellowship
(NDSEG) Program, the National Science Foundation (NSF)
through the Research Experience for Undergraduates (REU)
program, and NSF grants (DMR-0602684 and DBI-0649865),
and the Harvard Materials Research Science and Engineering
Center at Harvard (DMR-0820484).
1706 | Lab Chip, 2009, 9, 1701–1706
References
1 G. M. Whitesides, E. Ostuni, S. Takayama, X. Jiang and D. Ingber,Annu. Rev. Biomed. Eng., 2001, 3, 335, and references therein.
2 H. A. Stone, A. D. Stroock and A. Ajdari, Annu. Rev. Fluid Mech.,2004, 36, 381, and references therein.
3 P. Tabeling, Introduction to Microfluidics, Oxford University Press,2005, and references therein.
4 P. Yager, T. Edwards, E. Fu, K. Helton, K. Nelson, M. R. Tam andB. H. Weig, Nature, 2006, 442, 412.
5 A. W. Martinez, S. T. Phillips, B. J. Wiley, M. Gupta andG. M. Whitesides, Lab Chip, 2008, 8, 2146.
6 H. Lee, D. Ham and R. M. Westervelt eds. CMOS Biotechnology,Springer, New York, 2007.
7 T. P. Hunt, D. Issadore and R. M. Westervelt, Lab Chip, 2008, 8, 81.8 G. Maltezos, M. Johnston and A. Scherer, Appl. Phys. Lett., 2005, 87,
154105.9 J. Lee and I. Mudawar, Int. J. Heat Mass Transfer, 2005, 48, 928.
10 H. Nakano, K. Matsuda, M. Yohda, T. Nagmune, I. Endo andT. Yamane, Biosci. Biotechnol. Biochem., 1994, 58, 349.
11 E. T. Lagally, P. C. Simpson and R. A. Mathies, Sens. Actuators,2000, B63, 138.
12 J. Liu, M. Enzelberger and S. R. Quake, Electrophoresis, 2002, 23,1531.
13 J. Khandurina, T. E. McKnight, S. C. Jacobson, L. C. Waters,R. S. Foote and J. M. Ramsey, Anal. Chem., 2000, 72, 2995.
14 R. P. Oda, M. A. Strausbauch, A. F. R. Huhmer, N. Borson,S. R. Jurrens, J. Craighead, P. J. Wettstein, B. Eckloff, B. Klineand J. P. Landers, Anal. Chem., 1998, 70, 4361.
15 G. Maltezos, M. Johnston and A. Scherer, Appl. Phys. Lett., 2005, 87,154105.
16 G. Maltezos, A. Rajagopal and A. Scherer, Appl. Phys. Lett., 2006,89, 074107.
17 J. J. Shah, S. G. Sundaresan, J. Geist, D. R. Reyes, J. C. Booth,M. V. Rao and M. Gaitan, J. Micromech. Microeng., 2007, 17, 2224.
18 S. G. Sundaresan, B. J. Polk, D. R. Reyes, M. V. Rao and M. Gaitan,Proc. Micro Total Anal. Syst., 2005, 1, 657–659.
19 A. Sklavounos, D. J. Marchiarullo, S. L. R. Barker, J. P. Landers andN. S. Barker, Proc. Micro Total Anal. Syst., 2006, 2, 1238.
20 J. Geist, J. J. Shah, M. V. Rao and M. Gaitan, J. Res. Natl. Inst.Stand. Technol., 2007, 112, 177.
21 N. E. Bengtsson and T. Ohlsson, Proc. IEEE, 1974, 62, 44.22 J. N. Murrell, A. D. Jenkins, Properties of Liquids and Solutions, 2nd
edn, John Wiley & Sons, Chichester, England, 1994.23 The dielectric loss factor is affected by the conductivity of the solution
s, which depends on the concentration of electrolytes.17,22 Theconductivity leads to a correction s/30u that is added to thedielectric loss. At the frequency f ¼ 3 GHz used in this paper, thecorrection is a z10% change to the loss factor and does not affectthe conclusions of this paper.
24 S. L. Anna, N. Bontoux and H. A. Stone, Appl. Phys Lett., 2003, 82,364.
25 C. Holtze, A. C. Rowat, J. J. Agresti, J. B. Hutchison, F. E. Angile,C. H. H. Schmitz, S. Koester, H. Duan, K. J. Humphry,R. A. Scanga, J. S. Johnson, D. Pisigano and D. A. Weitz, LabChip, 2008, 8, 1632.
26 D. R. Link, S. L. Anna, D. A. Weitz and H. A. Stone, Phys. Rev.Lett., 1994, 92, 54503.
27 A. C. Siegel, S. S. Shevkoplyas, D. B. Weibel, D. A. Bruzewicz,A. W. Martinez and G. M. Whitesides, Angew. Chem., 2006, 45, 6877.
28 H. Mao, T. Yang and P. S. Cremer, J. Am. Chem. Soc., 2002, 124,4432–4435.
29 H. F. Arata, F. Gillot, T. Nojima, T. Fujii and H. Fujita, Lab Chip,2008, 8, 1436–1440.
30 D. E. Robertson and B. A. Steer, Curr. Opin. Chem. Biol., 2004, 8,141.
This journal is ª The Royal Society of Chemistry 2009