(microsoft powerpoint - transition towards efficient used water
TRANSCRIPT

Transition towards efficient “used water ‘ treatment
Willy Verstraete
Lab Microbial Ecology and Technology
LabMET - Ghent University

Overview
• 1.The energy facts from the water industry
• 2. Incremental appraoches
• 3.Mavericks in the old line of used water treatment
• 4. The real step forward : closing the water cycle entirely – the “used water factory” and development of the pull side
• 5.Conclusions

World Cities exceeding 5 million residents
The energy facts from the water industry
• The water industry consumes about 1% of the overall electricity (Caldwell 2009; 3e
Eur Water and Wastewater Conf )
• The energy costs are increasing and rise to some 20% of those of the water company
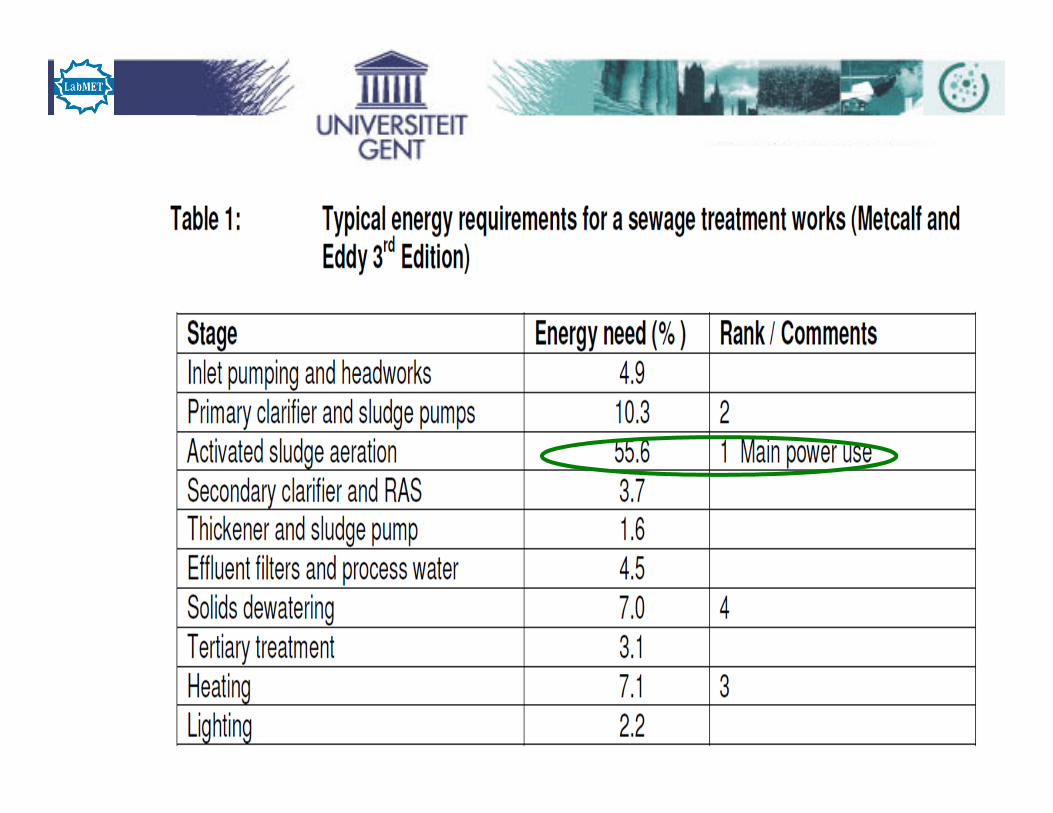
• Activatated sludge is the Major energy consumer

World Cities exceeding 5 million residents
The energy facts from the water industry

• Good STP housekeeping can help a lot ; up to 40% saving is possible ( Caldwell 2009)
• Yet , overall the nagging problem is that STPs simply dissipate ‘used water ‘ , rather than re-use the resources it contains – STP do waste resources
• In this way , it is the indirect contribution to climate change of the STPs , -and not their energy use as such -, which is the key challenge .
The overall facts from the water industry

• Heat recovery at the house / underground thermal energy storage (Frijns et al. 2013; Energy Conv Mang. 65: 357-363)
• FOG / Fryer oil : use as biodiesel on the STP
• Sieve out the cellulose : up to 40% less sludge production ; payback 7 yrs (Ruiken et al .2013; Water Res. 47: 43-48)
• Microbial fuel cells and BioElectrochemical Systems : thus far only at mL or L scale ( Arends &Verstraete 2012;Microbial Biotech 5: 333-346)
Incremental appraoches :5 examples

Bio Electrochemical Systems (BES)

• Conventional thinking
– ‘Gratuit’ energy from wastewater
BES from wastewater 0.1 kWelm-3
Benchmarks:
Batteries 30-90 kWelm-3
Chemical fuel cells 140 kWelm-3
Anaerobic digestion 4 kWelm-3
Take home: Plenty of energy-dense competitor systems exist ;added value must be sought outside the ‘energy’ aspect of BES

Conventional thinking :
-‘Gratuit’ products from wastewatersuch as caustic, peroxide,ammonia, organic
acids & alcoholsYet
• Extra energy must be supplied to the anodic harvested electrons
• Biological current is the limiting factor !
• Conventional production lines must be faced
Take home: Production is about-Rates (>100 kg m-3 d-1)
-Quality (specification is essential)-Quantities ( 10 000 tonnes per year to start)

Incremental approaches :example 5: Improved digestion

*Sludge pretreatment such as
-Thermal Pressure Hydrolysis
-Sonication
-Milling (Halalsheh et al. 2011;Biores Technol 102:748-752)
-Peroxide treatment of digestate :up to 13% more energy and 11% less residual solids ; net economic benefit of about some 1 USD per Inh per yr (Lozano 2010 ; WEFTEC Session 61-76: 4885-4897 )
Incremental approaches :Improved digestion

Mavericks in the ‘old’ line of sewage treatment
• 1.Nereda
• 2.Demon
• 3.Integration of renewable energy
• 4.Operating as ‘energy buffer ‘
• 5.Upgrading to green gas
• 6. Struvite recovery

Mavericks in the ‘old’ line 1.Nereda
Take home : 20% lower construction costs ; 30% less energy consumption but no recovery

Mavericks in the ‘old’ line :2. Demon (Wett 2007; Wat Sci Tech 56:81-86)

Macao (Egypt): sewage treatment plant
INESS® Integrated New Energy Solutions & Services wastewater treatment plant powered by the sun
Wind turbine
Anaerobic digester
Photovoltaic roof
Towards minimal external power consumption
Mavericks in the ‘old line’ : 3. Addition of renewable energy / Retrofitting of CAS-design

Mavericks in the ‘old’ line :4. Energy buffer
• During rush hours of electricity use by the public , stop the aeration of STW : up to 1% on the overall consumption
- Can be of economic signifcance but may provoke plenty of process adjustment

• During valley hours , use the electricity to to produce by electrolysis H2 and enrich the biogas :
The Electrochea concept
Green energy Electrolysis
Hydrogenotrophic Methanogens
CO2 rich gas
Green gas (100% CH4)
Mavericks in the ‘old’ line :5. Upgrading to green gas

Mavericks in the ‘old’ line :6. Struvite recovery
• Various industrial processes : (Cornel & Schaum 2009:Water Sci Techn 59: 1069-1076)
-The Pearl Ostara process
-The Nuresys process

THE POINT OF INTEREST : THE QUALITY AND THE QUANTITIES OF THE MAP PRODUCED

THE REAL STEP FORWARD :The old and the new water cycle
OLD NEWNatural system
Purification
Transport
USER
Transport
Dissipative treatment
Natural system
Natural system
Purification
Transport
Natural system
USER
Transport & centralized re-use
Localre-use

The water cycle
A. Decentralized
* 20% of the world population struggles with a
‘sanitation taboo ‘
* Education to re-use the resources present in
wastewater is key for progress in this domain
Note: Deep down in our crocodile brain , we all are
abhored by fecal matter and hence the reuse of
materials which have been in contact with it
(The Bill Gates foundation )

(Vlaeminck et al. 2007; Appl. Microbiol. Biotechnol. 74: 1376-1384; LabMET)
The water cycle
MgCl2
N2 gas
Plant growth products
Biogas kWh
Stabilized solids
Struvite
UASB Septic Tank
Sorption
To surface water
Black water
Decantor
OLAND
A. Decentralized: Autonomic treatment

Case study (Sneek, Netherland): Pioneer project of 32 houses with vacuum toilets (flushing with 1L in stead of 7L)
net energy production of 5 kWhel IE-1 year -1
The water cycle
(Zeeman et al. 2008; Water Sci. & Techn. 57, 1207-1212)
A. Decentralized: Autonomic treatment of black water
Discharge
OLAND Struvite
precipitatio
nB
iogas
recovery
Reuse
Grey water
Sewer
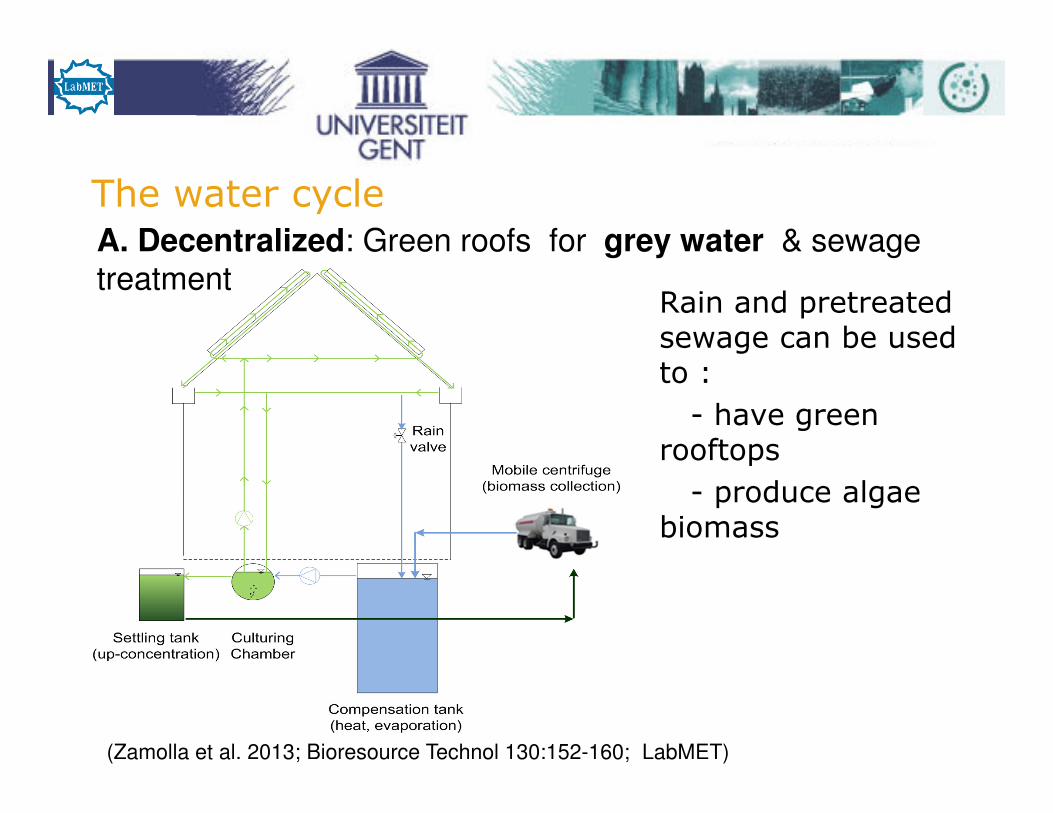
Rain and pretreated sewage can be used to :
- have green rooftops
- produce algae biomass
The water cycleA. Decentralized: Green roofs for grey water & sewage
treatment
(Zamolla et al. 2013; Bioresource Technol 130:152-160; LabMET)

27
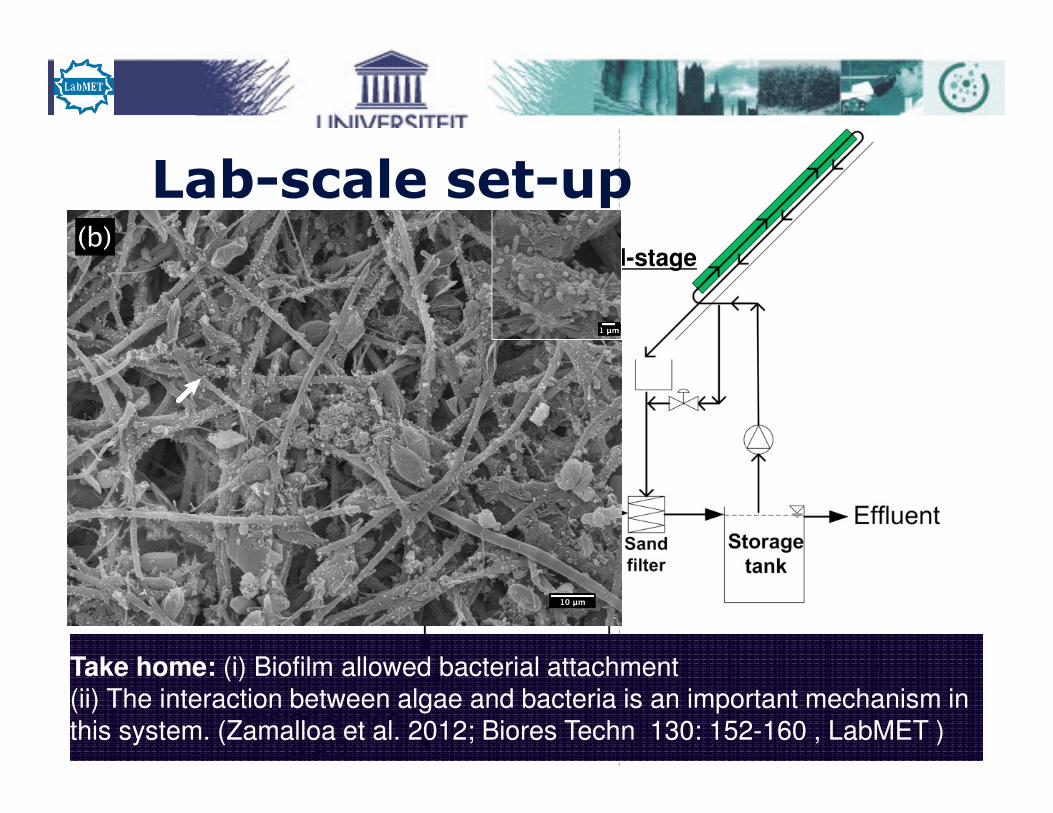
A-stage I-stage
Take home: (i) Biofilm allowed bacterial attachment(ii) The interaction between algae and bacteria is an important mechanism in this system. (Zamalloa et al. 2012; Biores Techn 130: 152-160 , LabMET )
Take home: (i) Biofilm allowed bacterial attachment(ii) The interaction between algae and bacteria is an important mechanism in this system. (Zamalloa et al. 2012; Biores Techn 130: 152-160 , LabMET )
Lab-scale set-up

Overall performanceParameter
Raw sewage
EffluentRemoval
efficiency (%)EU discharge limits (mg/L)
COD (mg/L) 143 ±49 36 ±±±±8 73 ±12 125
Ntotal (mg/L) 41±9 14 ±±±±7 66 ±12 15
TAN (mg/L) 33 ±9 1.9 ±±±±1.9 94 ±6 -
NO3-N (mg/L) 0.2 ±0.8 9.3 ±±±±6.9 - -
NO2-N (mg/L) 0.5 ±1.2 0.7 ±±±±0.5 - -
Ptotal (mg/L) 5 ±2 0.2 ±±±±0.1 96 ±4 2
pH 7.8 ±0.3 7.5 ±±±±0.6 - 6.5-9.5
Take home: COD and Ptotal meet EU discharge limits. But Ntotal needs to be lowered still with some 25%.
Take home: COD and Ptotal meet EU discharge limits. But Ntotal needs to be lowered still with some 25%.

29
Preliminary cost assessment
Capital cost €/m3sewage treated
A-stage; CSTR 9
A-stage; Settler + thickener 38
I-stage; PBR 150
A/I-stage; instrumentation 78
Total capital cost 313
Annualized cost (€/m3.year) 84
(€/m3.day) 0.23
Operational costs €/m3
Electricity 0.001
Flocculant 0.02
Total cost (€/m3) 0.25Take home: Considering a factor 2 for practical upscaling,
a projected value can be around 0.5 €/m3
Take home: Considering a factor 2 for practical upscaling,
a projected value can be around 0.5 €/m3

Mass balance
I-stage∼66 kgCOD/I.E. year∼5 kgN/I.E. year∼0.7 kgP/I.E. year
Domestic sewage
Treated water
∼18 kgCOD/I.E. year∼1.7 kgN/I.E. year∼0.03 kgP/I.E. year
A-stage
Organic sludge∼40 kgCOD/I.E. year∼0.5 kgN/I.E. year∼0.5 kgP/I.E. year
Flocculant
6-12 kgFeSO4/I.E. year
Algal sludge
∼31 kgCOD/I.E. year∼1.9 kgN/I.E. year∼0.16 kgP/I.E. year
∼ 0.9 kgN/I.E. year∼ 0.01 kgP/I.E. year
Loss
Fit for bio-refinery
Fit for re-use

B. Centralized: Conventional activated sludge (CAS) design
� Capex + Opex: 17 - 40 EUR IE-1 year-1
� Energy use: 20-35 kWhel IE−1 year−1
� Energy recovery via sludge digestion is limited
◊ Theor.: 30-40 kWh IE-1 year-1
◊ Pract.: 15-20 kWh IE-1 year-1
� N, P, K � no recovery
� All organic C via biology + sludge incineration to CO2
� Water � hardly re-used
Take home: The centralized wastewater treatment must be
redesigned entirely!
The water cycle

Food wastes must be properly re-used
• Food consumes 15% of the US overall energy budget
• About 20% of food is wasted, i.e. 2-3% of
the total energy budget (Webber & Cuellar, 2010; EST; DOI 10:1021)
New Urban Metabolism
Take home:
• Co-digestion can recover a major part of this energy
• Food and kitchen wastes can be a driver of a new type of
wastewater treatment

Resources
Production IE−1 year−1
Market price
Value (EUR IE−1 year−1)
SewageKitchen
wasteSewage
Sewage +
Kitchen waste
Potable water 54 m3 1.2 EUR m−3 65.4 65.4
Heat recovered (5°cooling)
• Electricity consumption
• Heat recovered
-179 kWhel
496 kWhth
0.10 EUR kWhel−1
0.05 EUR kWhth−1
6.9 6.9
Anaerobic digestion
• Electricity produced
• Heat generated
23 kWhel
24 kWhth
16 kWhel
17 kWhth
0.10 EUR kWhel−1
0.05 EUR kWhth−1
3.5 5.9
Biochar production 5.7 kg 3.9 kg 0.14 EUR kg−1 0.8 1.3
Recovered nitrogen 2.4 kg 0.2 kg 1.15 EUR kg−1 N 2.7 2.9
Recovered phosphorus 0.82 kg 0.66 kg 1.35 EUR kg−1 P 1.1 2.0
Overall 80.4 84.5
Sewage as a resource
(Verstraete & Vlaeminck, 2010; Keynote Paper 2nd Xiamen International Forum on Urban Environment; LabMET)

CAPEX + OPEX = 0.46 €/m³ RO permeate
0.33 €/m³ influent(Van Houtte and Verbauwhede 2008;
Desalination 218, 198-207)
Discharge in the sea0.060 €/m³ RO concentrate
0.017 €/m³ influent
Benefit = reusable water1.20 €/m³ RO permeate
0.86 €/m³ influent
CAS1 m³ 0.90 m³ 0.72 m³
0.10 m³ 0.18 m³
UF
(R = 90%)
RO
(R = 80%)
Sewage as a resource of water
Balance (m³ influent): - 0.600 for CAS- 0.330 for UF/RO polishing- 0.017 for concentrate discharge+ 0.860 for water valorization
-0.087 €/m³ influent
CAS complemented with UF & RO paysfor itself !!!
CAPEX + OPEX of CAS = 0.60 €/m³ influent(Van Haandel and Van der Lubbe 2007;
Handbook biological waste water treatment)
(Verstraete et al. 2009; Bioresource Techn. 100, 5537-5545;LabMET)

Sewage as a resource of water
Case study: Koksijde, Belgium (IWVA)
(Dewettinck et al., 2001; Water Sci. Technol. 43: 31-38; LabMET)
Take home: This technology was upscaled in Singapore � NEWater

UF/RO NEWaterPRE-
CONCENTRATIONSCREENINGSEWAGE
COARSE MINERALS
ANAEROBICDIGESTER
FILTER PRESS
P-RICH CAKE
BIOGAS
NITROGEN-RICH WATER
COMBINED HEAT AND POWER
UNIT. THE CO2 GOES TO THE ALGAL FARM
NATURAL STABLE
FERTILIZER (NSF)
PYROLYSIS BIOCHAR
BRINE
(Verstraete et al. 2009; Bioresource Techn. 100, 5537-5545; LabMET)
“The A&B Line Technology” /The “Used Water” Factory
B-lineMinor flow (max 10 %)
A-line (Major flow)
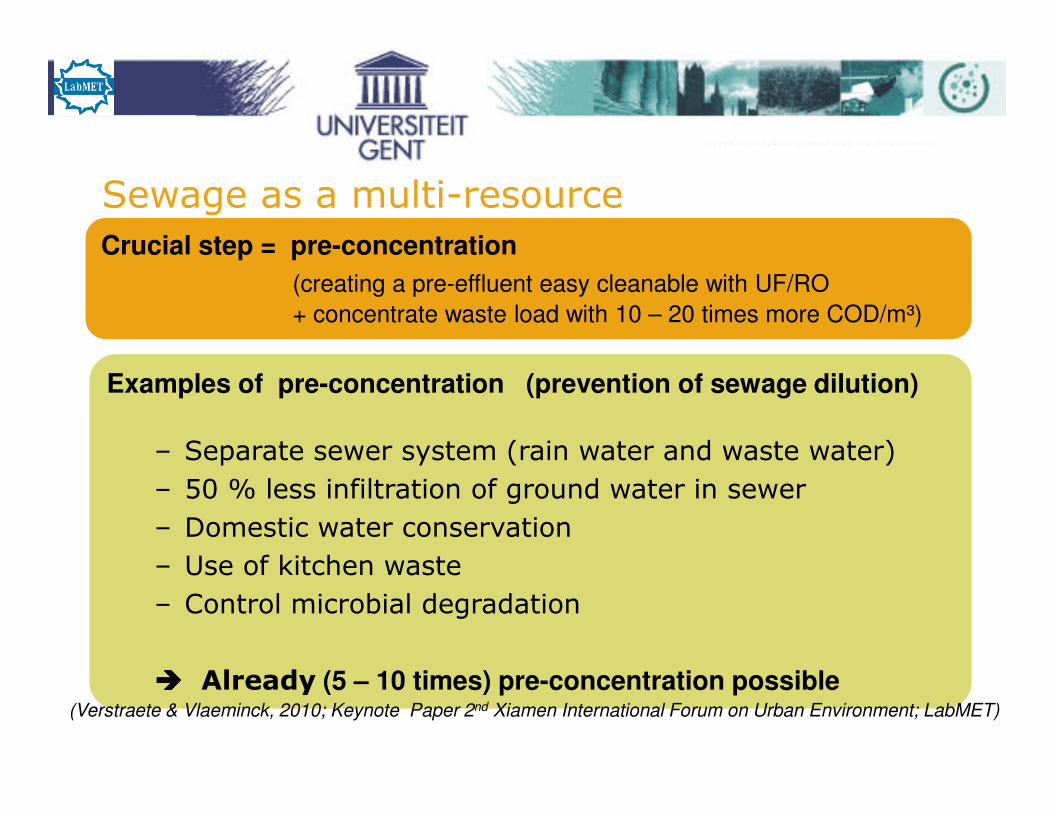
Examples of pre-concentration (prevention of sewage dilution)
– Separate sewer system (rain water and waste water)
– 50 % less infiltration of ground water in sewer
– Domestic water conservation
– Use of kitchen waste
– Control microbial degradation
���� Already (5 – 10 times) pre-concentration possible
Crucial step = pre-concentration
(creating a pre-effluent easy cleanable with UF/RO
+ concentrate waste load with 10 – 20 times more COD/m³)
Sewage as a multi-resource
(Verstraete & Vlaeminck, 2010; Keynote Paper 2nd Xiamen International Forum on Urban Environment; LabMET)

Examples of pre-concentration (Physical/Chemical)
• (Direct) filtration
= filtration with or without coagulant
e.g. - Dynamic sand filtration (DSF)
- Membrane filtration
e.g. FMX and VSEP
• Dissolved Air Flotation (DAF)
Crucial step = pre-concentration
(creating a pre-effluent easy cleanable with UF/RO
+ concentrate waste load with 10 – 20 times more COD/m³)
Sewage as a multi-resource

Examples of pre-concentration (Biological)
• Adsorption Bio-Aeration or Boehnke concept
Crucial step = pre-concentration
(creating a pre-effluent easy cleanable with UF/RO
+ concentrate waste load with 10 – 20 times more COD/m³)
Sewage as a multi-resource
(Boehnke et al. 1998; Water-Engineering & Management 145, 31-34)

Cost consideration for the proposed sewage recycling technology (according to C2C) � the major flow: directly to reuse� the minor flow (= a concentrate): produced at the entry of the plant,
subjected to advanced recovery for energy and fertilizers
Sewage as a multi-resource
Major flow
Dissolved air flotation 0.02-0.03 €/m3
Dynamic sand filtration 0.05-0.06 €/m3 0.53-1.15 €/m3
Ultra filtration and Reverse Osmosis 0.46-1.06 €/m3
Minor flow
Anaerobic digestion Break even
Mechanical separation 0.08-0.10 €/m3 0.08-0.10 €/m3
Pyrolysis Break-even
Total costs*: 0.61-1.25 €/m3
* this is the estimated total cost(Verstraete et al. 2009; Bioresource Techn. 100, 5537-5545; LabMET)
Take home: Total bruto costs of about 1 €/m3 for the A&B line technology are comparable with those of CAS

Sewage as a multi-resource
(Verstraete & Vlaeminck, 2011;Int J Sust Development and World Ecol 18: 253-264 LabMET)
The overall biorefinery / ““““used water ““““ factory :

Life Cycle Assessment or LCA
is a process to evaluate the
environmental burdens
associated with a product,
process or activity by identifying,
quantifying and assessing energy
and materials used and wastes
released to the environment
Evaluate sewage treatment plant with LCA

Evaluate sewage treatment plant with LCA
Take home: Wastewater treatment still has a relatively largeshare in the environmental pollution; this can be
decreased significantly by better ‘Urban mining’
Some mPE’’’’s of waste water treatment
ConventionalUsed water factory
Eutrofication 115 mPE
Ecotoxicity 85 mPE
Acidification 30 mPE
Global warming potential 18 mPE
(Clauwaert et al 2010; WT-Afvalwater 10, 186-195; Aquafin)

Sewage as a multi-resource
Energy gain (kWh IE−1 year−1) Avoided CO2 emission (kg CO2 IE-1 year-1)Electricity Heat
Kitchen grinder -1.4 -0.9
Advanced concentrator -6.0 -3.6
OLAND 12.8 6.6
Heat recovery -179 496 41.7
Anaerobic digestion 38.9 23.3
Sludge dewatering 1.8 1.1
N recovery -9.6 40.8 4.5
P recovery 1.2 2.0
Biochar 13.3
sum -141 537 88
Take home: The A&B line factory’’’’cuts 1-4 % of the CO2 emissions per IE
(Verstraete & Vlaeminck, 2010; Keynote Paper 2nd Xiamen Intern. Forum on Urban Environment; LabMET)

Take home:
The C2C design of the A& B line technology can already be achieved at equal costs of the CAS + it holds plenty of extra potentials
C2C designSewage as a multi-resource: Economically
CAS design: - Total cost without water recovery
≈ 1.0 €/m³ - Net costs upon sale of RO-permeate = 0.0 €/m3
A&B line design: - Total cost with up-recycling of energy &
nutrients ≈ 1.0 €/m³- Net costs upon sale of RO-permeate = 0.0 €/m3
Perspective: - CO2 recycling via algae
- Recovery of struvite
- C-storage as biochar

Overview • 1.The facts from the water industry
• 2. Incremental appraoches
• 3.Mavericks in the old line of used water treatment
• 4. The real step forward : closing the water cycle entirely – the “used water factory” and the development of the demand side
REE / P / FEED &FOOD + The Clearance Concept
• 5 .Conclusions
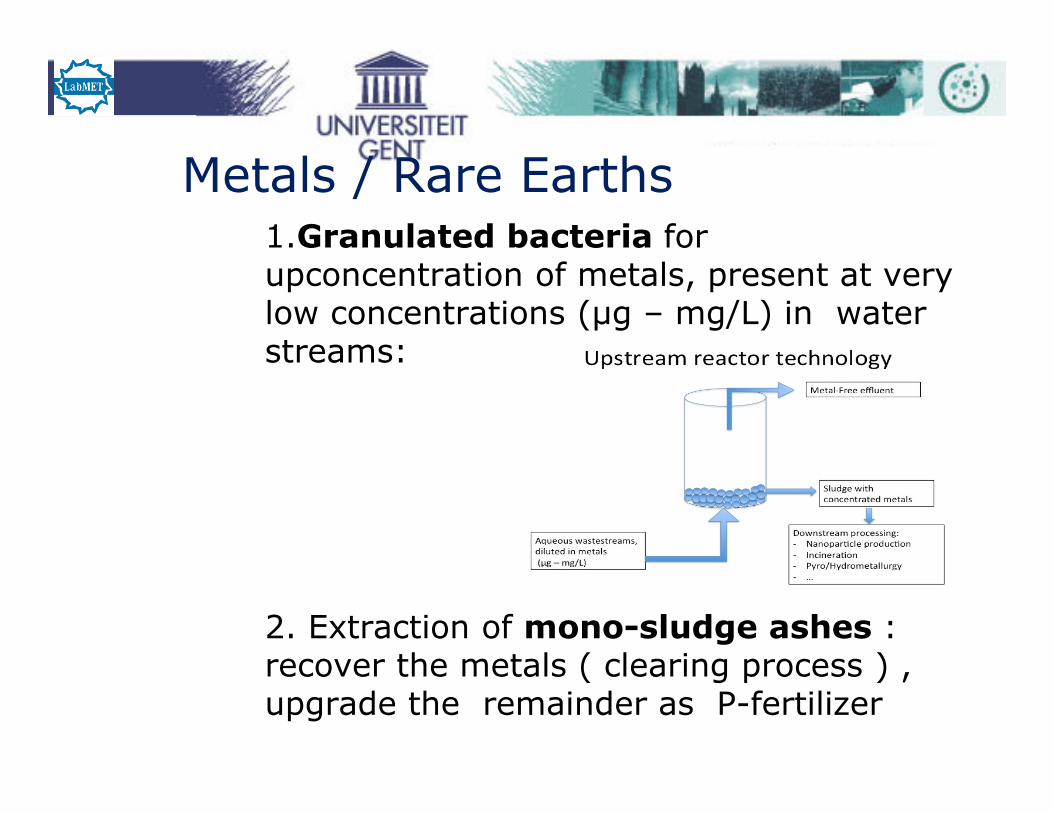
Metals / Rare Earths1.Granulated bacteria for upconcentration of metals, present at very low concentrations (µg – mg/L) in water streams:
2. Extraction of mono-sludge ashes : recover the metals ( clearing process ) , upgrade the remainder as P-fertilizer

C:\Users\Willy\Pictures\2014-01-
24_0813.png

3 .Food /Feed : Valuable biomass polymers
*Plenty of bacteria have ca 20% PHA on dry matter under
anaerobic conditions
* Can be increased to 60% under micro-aerophilic
conditions
(Salehizadeh & van Loosdrecht, 2004; Biotechnol. Adv. 22:
261-279)
* Can be used for
a) PHA : to produce plastics ( Veolia /Brussels )
b) PHB : as a prebiotic for animal feed
Patent Ugent / LabMET / Kemin(Defoirdt et al. 2007; FEMS Microbiol Ecol 60: 363-369; LabMET)

+ Carbohydrate
+ Aeration
Fish feed with
20-40% protein
Protein
Carbohydrates
About 20%
becomes fish
protein
Waste N, P, …
Microbial SCP
Fish (Talapia) Extra 25% recovered as
fish protein
80%
= BFT
Direct recycling of fecal N as feed in aquaculture
(Crab et al., 2007; Aquaculture 270: 1-14; LabMET; (De Schryver et al. 2008; Water Res. 42: 1-12; LabMET )
► Fecal cycles in short loop can work
Production of SCP in intensive husbandry aquaculture
The BioFloc Technology is a fact . Taboo’s can change !

Anaerobic
Digestion
Organic waste
streams
Digestate
‘Liquid’
Additional nutrients
LFOS(Liquid fertilizer on spec)
‘Solids ’ P-Carbon(Better humus in agricultural soils)
Biogas
Green gas (eg car fuel)
CO2
Hydrogeno
Trophic
BioreactorElectrolysis
Excess
(Green)
Power
Water
Torrification
O2
H2
Carbon DioxydeCDprotein(Feed/Food)
4.AD Clearance

IWA -RRfW : the clusterListing the issues
• Resources possibly recovered from water & sludge– Heat / energy (gases , liquids , solids )– Nutrients N , P , K– Fats , oils , greases (FOGs)– Fibers / Carboxylates / PHA /….– Amino acids chelated trace elements fertilizer ( Liu et al 2009 , J
Hazard Mater 15:1159-1167– Rare earth elements (REE ) (Zan lin etal . ACS Apllied Materials
and Interfaces ….)– Heavy metals : Cu by the BioSulphide process (Saniedanesh et
al .2013; PSE ASIA 25-27 june Kuala Lumpur )– Char for soil amendment – Proteins for feed or for adhesives (Pervaiz 2012; Unvi of
Toronto) )
– ……..

IWA Resource Recovery Cluster • The launch : IWA World Congress Lisboa 2014 ; you can register already
• The concept :
*Plenty of actions on the push side
but
Particularly the pull side must be developed
To achieve this , we need 3 things
- Paradigm shift : recovery can be conceptually ‘cleared‘ if we call a spade a spade
- Dimensions of scale shift : think markets of
10 000 tons per year
- Delivery on spec
• The energy consumpton by the water industry is important ( up to 1% of national electricity ) and is increasing
• Good housekeeping in conventional WTP can cut the energy costs by 20-40%
• Plenty of incremental approaches are underway ; each penny counts ….
• Mavericks such as Nereda , Demon .. are welcome
• We really must dare to go for the ‘used water factory fully focussed on recovery ‘
Recap on RRfW

Conclusions
* The driver for transition is to help to decrease climate change
* We have to redesign the sewage system entirely-Separation at source : clever ‘at home treatment’
-Separation at STP : conventional CAS is outdated !!!!Go for the A&B Line Technology
*Pre-concentration is a crucial step ;AD is a key process in the recovery of Energy and Nutrients
*Resource Recovery from used water is all about organizing the DEMAND side