microsatellite mutations and inferences about human demography
TRANSCRIPT

Copyright 2000 by the Genetics Society of America
Microsatellite Mutations and Inferences About Human Demography
Rusty Gonser,* Peter Donnelly,† George Nicholson† and Anna Di Rienzo*
*Department of Human Genetics, University of Chicago, Chicago, Illinois 60637 and †Department of Statistics,University of Oxford, Oxford OX1 3TG, United Kingdom
Manuscript received July 29, 1999Accepted for publication November 29, 1999
ABSTRACTMicrosatellites have been widely used as tools for population studies. However, inference about popula-
tion processes relies on the specification of mutation parameters that are largely unknown and likely todiffer across loci. Here, we use data on somatic mutations to investigate the mutation process at 14tetranucleotide repeats and carry out an advanced multilocus analysis of different demographic scenarioson worldwide population samples. We use a method based on less restrictive assumptions about themutation process, which is more powerful to detect departures from the null hypothesis of constantpopulation size than other methods previously applied to similar data sets. We detect a signal of populationexpansion in all samples examined, except for one African sample. As part of this analysis, we identify an“anomalous” locus whose extreme pattern of variation cannot be explained by variability in mutation size.Exaggerated mutation rate is proposed as a possible cause for its unusual variation pattern. We evaluatethe effect of using it to infer population histories and show that inferences about demographic historiesare markedly affected by its inclusion. In fact, exclusion of the anomalous locus reduces interlocus varia-bility of statistics summarizing population variation and strengthens the evidence in favor of demographicgrowth.
INTEREST in the use of microsatellites as tools for Valdes et al. 1993; Kimmel et al. 1998; Reich and Gold-stein 1998; Reich et al. 1999).the study of population processes followed soon
after their discovery (Litt and Luty 1989; Weber and As a step toward an improved characterization of themutation process on a locus-by-locus basis, we devised anMay 1989; Burke 1991; Pena 1993; Bowcock et al.
1994; Di Rienzo et al. 1994). Population genetics theory approach based on the analysis of somatic microsatellitemutations in cancer patients, which allows the estima-can be used to relate aspects of the patterns of variation
at microsatellite loci, in samples from a population, to tion of the distribution of mutation sizes for each locus(Di Rienzo et al. 1998). It transpires that one particularthe history of the population and the details of the
mutation process generating variability. All attempts to feature of this distribution, namely the average squaredchange in repeat number, or mutation mean square, playsinfer population history from microsatellite data rely on
assumptions, notably about the nature of the mutation a central role in the behavior of commonly used summa-ries of population variation such as the variance of theprocesses at the loci involved (Valdes et al. 1993; Direpeat number in a population sample. Our earlierRienzo et al. 1994; Zhivotovsky and Feldman 1995;study (Di Rienzo et al. 1998) suggested that locus-by-Pritchard and Feldman 1996; Feldman et al. 1997;locus estimates of the mutation mean square from so-Reich and Goldstein 1998). While the results of suchmatic mutations are informative for the germ-line muta-analyses can depend critically on the assumptions made,tion processes, and in addition, that these processes canthere has been little experimental work aimed at observ-differ across loci in important respects.ing directly the products of these mutation processes to
Here, we report on three results and a subsequentprovide an empirical foundation for population studies.population analysis. First, we extend our previous find-Moreover, the validity of most methods or their powerings to a broader range of human populations byto detect population expansion relies on strong as-applying the same approach to a second data set on 14sumptions about the mutation mechanism: typically thatadditional microsatellite loci. The results further vali-both the mutation rate and the process that changesdate the use of microsatellite instability as a means ofallele length are the same at each locus and/or that allcharacterizing the mutation process of microsatellites.changes to allele length are equally likely to involve theSecond, we investigate the variability of mutation ratesgain or loss of a single repeat unit (Shriver et al. 1993;across loci by using our locus-specific estimates of thedistributions of mutation size. The purpose of this analy-sis is to identify loci that are “anomalous” in that their
Corresponding author: Anna Di Rienzo, Department of Human Genet-extreme pattern of population variation cannot be ac-ics, University of Chicago, JFK Rm. 116, 924 E. 57th St., Chicago, IL
60637. E-mail: [email protected] counted for solely by mutation size variability. We iden-
Genetics 154: 1793–1807 (April 2000)
Dow
nloaded from https://academ
ic.oup.com/genetics/article/154/4/1793/6048066 by guest on 01 January 2022

1794 R. Gonser et al.
TABLE 1tify one such locus and conclude that its inclusion maycompromise the inference about population histories. Microsatellite instability screeningThird, we extend a result of Slatkin (1995) to showthat a linear relationship between the population vari- Locus Patients with Patients Rate of
name somatic mutations tested instability (%)ance and the mutation mean square would be expectedunder any demographic scenario for any generalized D1S407 10 156 6.41stepwise mutation model, even if there is a bias in the D1S399 26 194 13.40direction of the mutational change. D3S1537 11 176 6.25
The amount of variation expected at a particular locus D4S1530 20 146 13.70D6S393 15 179 8.38in a population increases with the variability (measuredD8S384 16 204 7.84by the mutation mean square) of the mutation process.D8S499 22 194 11.34Interlocus variability in the mutation mean square isD10S516 39 189 20.63effectively another source of noise in an already very D10S525 21 162 12.96
noisy system. Locus-specific estimates of the mutation D10S526 18 81 22.22mean square can be used to correct for this effect before D14S119 31 199 15.58combining information across loci. Di Rienzo et al. D17S919 17 191 8.90
D19S400 22 179 12.29(1998) introduced a new statistic, called the normalizedD20S161 19 201 9.45population variance (NPV), defined as the ratio of the
population variance at a locus to (an estimate of) themutation mean square at that locus. Inferences basedon population data from a single locus are typically very of unrelated individuals selected from the general population.imprecise, even if the genetic mechanisms at the locus The remaining population data analyzed in this article were
published in Jorde et al. (1995). We typed the 14 loci in Tableare completely understood (e.g., Donnelly and Tavare1 in the same Sardinian sample examined by Di Rienzo et al.1995). In making inferences about population history,(1998) to allow the direct comparison across data sets. Weit is thus desirable to use data from many unlinked loci. then calculated the population variance for these loci in Sar-
In the case of multilocus microsatellite analyses, the use dinia and in three major ethnic groups (Africans, Asians, andof NPV values, rather than just the observed population Europeans; second data set) on the basis of a published report
( Jorde et al. 1995). Because each sample in the second datavariance, considerably improves the quality of the infer-set was made up of several subpopulations, we analyzed theence: tests of particular scenarios about population his-data by also using only the most numerous subpopulationtory will have greater power, and estimates of popula- sample for each ethnic group, i.e., Sotho for Africa, Japanese
tion parameters will be more precise. The better the for Asia, and French for Europe, to control for the effect ofestimates of the mutation mean square at each locus, admixture on the pattern of microsatellite variation. In all
the analyses performed in this article, the results for eachthe more marked this effect will be.subpopulation (not shown) were always consistent with thoseAs a result, we are in a position to allow for most offor the overall population sample.the complexities of the mutation process at microsatel- Typing protocol: For both population and patient tissue
lite loci and, thus, carry out an advanced multilocus samples, we used previously described typing protocols basedanalysis of different demographic scenarios. Because on radioactively endlabeling one of the PCR primers (Di
Rienzo et al. 1994, 1998). PCR conditions for each microsatel-of our less restrictive assumptions about the mutationlite locus were obtained through the Genome Database. Sam-process, our method is more powerful to detect depar-ples from the CEPH database that have been widely used astures from the null hypothesis of constant population size markers were run on each gel to ensure consistent allele
size than other methods that have been applied to simi- identification across gels. Every instance of instability was am-lar datasets (Kimmel et al. 1998; Reich and Goldstein plified and electrophoresed twice and classified as a somatic
mutation only when a consistent pattern was obtained in at1998). Our analysis shows evidence for historical popula-least two assays.tion expansions in all the populations examined with
the exception of Africa in the second data set.
RESULTS
MATERIALS AND METHODS Microsatellite instability and patterns of somatic mu-tations: Fourteen out of the 30 tetranucleotide repeatSubjects: Study subjects included 219 patients with sporadicloci described in Jorde et al. (1995) were typed in nor-colorectal cancer diagnosed and treated at the Northwesternmal and tumor DNA extracted from surgical specimensMemorial Hospital, Chicago, Illinois, as described in Di
Rienzo et al. (1998). Sections of tumor and normal tissue were of patients with sporadic colorectal cancer. A somaticcut from paraffin-embedded tissue blocks and the DNA was mutation was determined to have occurred when oneextracted from the tissue sections as described in Wright and or more bands appeared in the tumor tissue in additionManos (1990).
to those observed in the normal tissue of the same pa-The Sardinia (Italy) population sample was randomly se-tient. The rate of microsatellite instability per locus,lected from previously described samples (Di Rienzo and
Wilson 1991). The DNAs were extracted from placental tissue calculated as the proportion of loci with somatic muta-
Dow
nloaded from https://academ
ic.oup.com/genetics/article/154/4/1793/6048066 by guest on 01 January 2022

1795Mutation Process at Microsatellites
Figure 1.—Maximum-likelihood estimates of themutation sizes at 14 micro-satellite loci.
tions over the total number of patients tested, was mutations involving one or two repeat units. However,as in our previous analysis of somatic mutations, a minor-12.10% on average, in line with our previous estimates
of the instability rate for tetranucleotide repeats (Table ity of loci, such as D10S526, have a broader range ofmutations asymmetrically distributed around the mean.1; Di Rienzo et al. 1998). To assess the pattern of somatic
mutations for each locus, we estimated the distributions To infer accurately population parameters, it is impor-tant to take this interlocus variability of mutation sizeof mutation size based on the mutations observed in
tumor tissue. Because the typing results do not allow into account. The estimated values of the mutationmean square can be found on the website of the Depart-one to determine unequivocally which allele was hit by
a somatic mutation, we used the expectation maximiza- ment of Human Genetics of the University of Chicago(http://www.genes.uchicago.edu).tion (EM) algorithm to produce maximum-likelihood
estimates of the distributions of mutation sizes for each For 8 out of 14 loci, the mean of the estimated distri-bution of mutation size was above zero, showing nolocus (Dempster et al. 1977; Di Rienzo et al. 1998).
These distributions, shown in Figure 1, show a moderate evidence for a mutational bias toward an increase ofrepeat size.degree of interlocus variability and have on average
a relatively narrow range of mutation sizes with most Validating the use of somatic mutations for estimating
Dow
nloaded from https://academ
ic.oup.com/genetics/article/154/4/1793/6048066 by guest on 01 January 2022

1796 R. Gonser et al.
TABLE 2
Rank correlation between population variance (S 2) and mutation mean square (h2)
All loci Without D19S244
Population r P value r P value
First data setLuo (Africa) 0.815 0.0016 0.850 0.0015Sardinia (Europe) 0.744 0.0040 0.868 0.0012Kaingang (S. America) 0.662 0.0104 0.689 0.0099Pooled sample 0.850 0.0010 0.911 0.0007
Second data setAfricans 0.297 0.2847Asians 0.574 0.0386Europeans 0.710 0.0105Pooled sample 0.635 0.0220Sardinia (Europe) 0.736 0.0079
germ-line mutation parameters: In appendix a, we show stochastic nature of the evolutionary process. If informa-that a linear relationship is expected between the vari- tive at all, the cancer data will be equally informativeance of repeat number in a population sample and for all populations. In the light of the other results, wethe mutation mean square for each microsatellite locus are thus inclined to view the lack of significance of thefor any demographic scenario. This extends earlier re- rank correlation for the African sample as a reflectionsults of Roe (1992), Slatkin (1995), Zhivotovsky and of the low power of the test, rather than on the utilityFeldman (1995), Kimmel and Chakraborty (1996), of the cancer data.Pritchard and Feldman (1996), Chakraborty et al. Bootstrap resampling was used to assess the sampling(1997), and Di Rienzo et al. (1998). Therefore, regard- error in our estimates of mutation mean square. Theless of the demographic history of the population, the bootstrap distributions are shown in Figure 3. We discusspopulation variance is expected to be linearly related below the consequences of this sampling variability forto the mutation mean square estimated from somatic estimation of demographic parameters and testing ofmutations in cancer patients, if the latter is similar to demographic scenarios.that underlying the observed population variability. Identifying “anomalous” loci: Equation A1 in appen-These findings imply that the validation of our approach dix a shows that at a given locus the expected popula-through the analysis of population variability does not tion variance depends linearly on features of the muta-depend on making the correct assumption about a par- tion mechanism (the mutation mean square, h2, andticular demographic model. the mutation rate, m) and a feature of the population
The fit of the data to the general expectation of a demographic history [the expected coalescence timelinear relationship between population and mutation for a pair of genes at the locus, E(T12)]. As noted above,parameters can be tested by assessing the significance the use of the NPV facilitates interlocus comparison byof the rank correlation between them. As shown in Table “correcting” for an estimate of mutation mean square2, all the population samples, with the exception of the at the locus. For example, microsatellites with large vari-African sample, have a significant rank correlation. A ability in mutation size, such as D10S526, are expectedgraphical representation of the relationship between to show greater population variance, and allowancethe population variance and the mutation mean square should be made for this effect when pooling resultsis also shown in Figure 2. across loci. However, reliable empirical estimates of lo-
We regard the significance for all populations other cus-specific mutation rates are not available and an anal-than the African sample as evidence that the somatic ogous correction is not feasible. We now utilize themutations in cancer are indeed informative for the mu- estimated distributions of mutation size to investigatetation process generating population variation. Recall the interlocus variability of mutation rate.that if it were, we would expect a linear relationship Write NPV(l, p) for the NPV value at locus l in pop-between population variance and mutation mean square. ulation p, and writing kp for the number of loci testedThe test based on rank correlation examines the null in population p, definehypothesis of no association. Whether or not such a testwill detect a linear relationship if one is present depends
NPV(1, p) 51kp
okp
l51
NPV(l, p),on the power of the test, which in turn will depend onthe variability of the data around the linear relationship.This variability is considerable for our data, due to the the average NPV value across loci within population p.
Dow
nloaded from https://academ
ic.oup.com/genetics/article/154/4/1793/6048066 by guest on 01 January 2022

1797Mutation Process at Microsatellites
Figure 2.—Relationshipbetween the mutation meansquare (h2) and the popula-tion variance (S 2). The datafrom the second data setare shown for the African,Asian, and European sam-ples. The slope of the linewas determined as the aver-age NPV for each popula-tion sample. For the Sardin-ian sample, the NPV wasaveraged across loci for thefirst and second data setswithout the outlier D19S244(indicated by an arrow).
Now, writing T (p)12 for the mean pairwise coalescence time conclusion that D19S244 is unusual, is valid regardless
of the magnitude of such variability.at an autosomal locus in population p, ml for the muta-We propose three possible explanations for this obser-tion rate at locus l, and m for the average mutation rate
vation. The first is that this locus has a substantiallyacross these loci,larger mutation rate than the other loci in the first data
E(NPV(l, p)) 5 mlT(p)12 and E(NPV(1, p)) 5 mT (p)
12 , set. The second is that it has been affected by naturalselection: if natural selection acted at or near the locusso thatin all populations, it may systematically increase (balanc-ing selection) or decrease the expected average coales-
g(l, p) ; NPV(l, p)NPV(1, p) cence time (background selection or a selective sweep;
Smith and Haigh 1974; Hudson and Kaplan 1988;is a natural ratio estimator of ml/m [the use of g(l, p) Kaplan et al. 1988; Charlesworth et al. 1995 ). Thewas suggested to us by M. Stephens, personal communi- former case would tend to manifest itself as large g(l,cation]. Figure 4 plots the values of g(l, p) for the data p) values for that locus in all populations, and henceset of Di Rienzo et al. (1998; first data set) and the in a large bar in Figure 4, as for D19S244. (The lattersecond data set reported here. Under selective neutral- forms of selection would have the opposite effect, lead-ity and the generalized stepwise mutation model, the ing to a small bar in Figure 4.) A third potential explana-height of each bar in Figure 4 is an estimate of the tion is that the mutation mean square at that locus wasmutation rate at the relevant locus relative to the average substantially underestimated, hence inflating the NPVmutation rate across loci. values in all populations.
The most striking feature of Figure 4 is that the bar A high rate of de novo mutations has been observed atfor locus D19S244 is much higher than that for any the D19S244 locus in family studies (Weber and Wongother locus in the corresponding samples. The differ- 1993). Further, a search of the Human Transcript Mapence is significant: a permutation test (Good 1994) of database did not reveal any gene known to evolve underthe null hypothesis of exchangeability of g(l, p) values balancing selection in the neighborhood of this marker,across loci within populations has P 5 0.02. The variabil- and the number of mutations from which the mutationity of the estimator g(l, p) will depend on the true mean square was estimated was larger than for mostdemographic scenario. It could be substantial, especially other loci (29 instances of microsatellite instability werein a population of constant size. We note, however, observed at D19S244). Thus, while we cannot be defini-
tive, we propose that the increased g(l, p) value for thethat the use of the permutation test, and hence our
Dow
nloaded from https://academ
ic.oup.com/genetics/article/154/4/1793/6048066 by guest on 01 January 2022

1798 R. Gonser et al.
Dow
nloaded from https://academ
ic.oup.com/genetics/article/154/4/1793/6048066 by guest on 01 January 2022

1799Mutation Process at Microsatellites
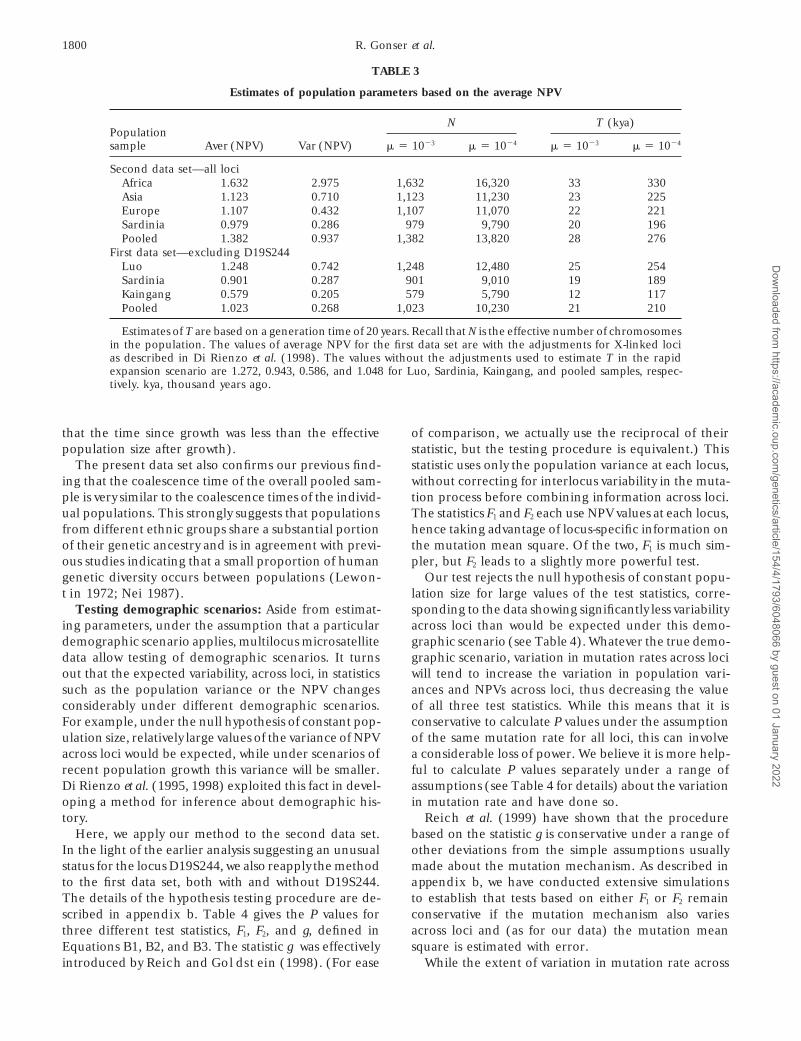
Using the NPV to make inferences about human evo-lution: Parameters of natural interest include the effec-tive population size, in the case of a constant-sized popula-tion, or the timing or rate of changes in population size,under other demographic scenarios. It follows fromEquation A1 in appendix a that the average NPV valueacross loci within a population is an unbiased estimatorof the product mE(T12), where m is the average mutationrate of the loci in the study, and E(T12) is the expectedcoalescence time of a pair of genes at the locus. For aconstant-sized population, the expected average coales-cence time equals the effective number of chromosomesin the population, N, while for a population that wasinitially very small before undergoing a rapid and sub-stantial growth in size T generations ago, it equals thetime since the expansion (T) (e.g., Donnelly andTavare 1995). For these respective demographic sce-narios, our data can thus be used to provide estimatesof N and T, respectively, under various assumptionsabout the average mutation rate for the loci. These aregiven in Table 3. The uncertainty in these estimates ofpopulation parameters results principally from stochas-tic variation in the evolutionary process and uncertaintyin the estimation of the mutation mean square. Thestochastic variation can be substantial (see discussion)and will depend on the nature of, and parameters in,
Figure 4.—Values of g(l, p) for the first and second data the (unknown) demographic scenario. The effect ofsets. uncertainty resulting from the estimation of mutation
mean square can be assessed through the bootstrapprocedure described in Figure 3 legend. The distribu-D19S244 locus reflects a substantially higher mutationtion of the error in estimating the NPV at each locusrate for that locus. While the second data set (Figuremay then be approximated (Figure 5). When the mean4) also suggests heterogeneity across loci, no locus ap-NPV is calculated across loci, the component of its stan-pears to be markedly different from the others.dard error stemming from this source alone is z20% ofAs shown in Di Rienzo et al. (1998; Equations A7the estimated value (data not shown). For more realisticand A15), the precision of estimators of demographicdemographic scenarios, the relationship between theparameters based on average NPV values is decreasingexpected average coalescence time and parameters ofin the variance, across loci, of the mutation rate. So toointerest is less clear, though it could of course be studiedis the power of tests of demographic scenarios basedfor particular scenarios of interest.on interlocus variability of NPV values. Having identified
One scenario of interest in connection with humanD19S244 as an “anomalous” locus, it is thus most effi-evolution would be a population of nontrivial size thatcient to ignore this locus in subsequent statistical analy-grows rapidly to become quite large. Then the expectedses. To evaluate the effect of this locus on populationaverage coalescence time would be larger than the timeinferences, we compared the results from the first datasince growth, so that it would provide an upper boundset by including and excluding it from all the population
samples. on that time (provided, as seems plausible for humans,
Figure 3.—Bootstrap estimates of the sampling error in our estimates of mutation mean square for each locus. For each locus,the following procedure was repeated 50,000 times: (1) A new data set was generated by choosing randomly one of the twonormal alleles in each individual with a somatic mutation at the locus and then “mutating” it by adding a (positive or negative)mutation size chosen randomly according to the maximum-likelihood estimate of the mutation size distribution at that locus.(If this resulted in an allele of the same length as the other normal allele, the result was discarded and the procedure repeatedfor that pair.) The resulting bootstrap data set then had two normal alleles and one mutant allele for each individual. (2) Foreach bootstrap data set, the EM algorithm was used to calculate the maximum-likelihood estimate of mutation size distribution,and so of mutation mean square. A histogram is plotted of the 50,000 bootstrap values of the estimated mutation mean squarefor each locus. The procedure was vacuous for D20S161 because in the estimated distribution of mutation sizes mutations werealways of size 61, and so all bootstrap estimates of the mutation mean square were also 1.
Dow
nloaded from https://academ
ic.oup.com/genetics/article/154/4/1793/6048066 by guest on 01 January 2022
1800 R. Gonser et al.
TABLE 3
Estimates of population parameters based on the average NPV
N T (kya)Populationsample Aver (NPV) Var (NPV) m 5 1023 m 5 1024 m 5 1023 m 5 1024
Second data set—all lociAfrica 1.632 2.975 1,632 16,320 33 330Asia 1.123 0.710 1,123 11,230 23 225Europe 1.107 0.432 1,107 11,070 22 221Sardinia 0.979 0.286 979 9,790 20 196Pooled 1.382 0.937 1,382 13,820 28 276
First data set—excluding D19S244Luo 1.248 0.742 1,248 12,480 25 254Sardinia 0.901 0.287 901 9,010 19 189Kaingang 0.579 0.205 579 5,790 12 117Pooled 1.023 0.268 1,023 10,230 21 210
Estimates of T are based on a generation time of 20 years. Recall that N is the effective number of chromosomesin the population. The values of average NPV for the first data set are with the adjustments for X-linked locias described in Di Rienzo et al. (1998). The values without the adjustments used to estimate T in the rapidexpansion scenario are 1.272, 0.943, 0.586, and 1.048 for Luo, Sardinia, Kaingang, and pooled samples, respec-tively. kya, thousand years ago.
that the time since growth was less than the effective of comparison, we actually use the reciprocal of theirstatistic, but the testing procedure is equivalent.) Thispopulation size after growth).
The present data set also confirms our previous find- statistic uses only the population variance at each locus,without correcting for interlocus variability in the muta-ing that the coalescence time of the overall pooled sam-
ple is very similar to the coalescence times of the individ- tion process before combining information across loci.The statistics F1 and F2 each use NPV values at each locus,ual populations. This strongly suggests that populations
from different ethnic groups share a substantial portion hence taking advantage of locus-specific information onthe mutation mean square. Of the two, F1 is much sim-of their genetic ancestry and is in agreement with previ-
ous studies indicating that a small proportion of human pler, but F2 leads to a slightly more powerful test.Our test rejects the null hypothesis of constant popu-genetic diversity occurs between populations (Lewon-
tin 1972; Nei 1987). lation size for large values of the test statistics, corre-sponding to the data showing significantly less variabilityTesting demographic scenarios: Aside from estimat-
ing parameters, under the assumption that a particular across loci than would be expected under this demo-graphic scenario (see Table 4). Whatever the true demo-demographic scenario applies, multilocus microsatellite
data allow testing of demographic scenarios. It turns graphic scenario, variation in mutation rates across lociwill tend to increase the variation in population vari-out that the expected variability, across loci, in statistics
such as the population variance or the NPV changes ances and NPVs across loci, thus decreasing the valueof all three test statistics. While this means that it isconsiderably under different demographic scenarios.
For example, under the null hypothesis of constant pop- conservative to calculate P values under the assumptionof the same mutation rate for all loci, this can involveulation size, relatively large values of the variance of NPV
across loci would be expected, while under scenarios of a considerable loss of power. We believe it is more help-ful to calculate P values separately under a range ofrecent population growth this variance will be smaller.
Di Rienzo et al. (1995, 1998) exploited this fact in devel- assumptions (see Table 4 for details) about the variationin mutation rate and have done so.oping a method for inference about demographic his-
tory. Reich et al. (1999) have shown that the procedurebased on the statistic g is conservative under a range ofHere, we apply our method to the second data set.
In the light of the earlier analysis suggesting an unusual other deviations from the simple assumptions usuallymade about the mutation mechanism. As described instatus for the locus D19S244, we also reapply the method
to the first data set, both with and without D19S244. appendix b, we have conducted extensive simulationsto establish that tests based on either F1 or F2 remainThe details of the hypothesis testing procedure are de-
scribed in appendix b. Table 4 gives the P values for conservative if the mutation mechanism also variesacross loci and (as for our data) the mutation meanthree different test statistics, F1, F2, and g, defined in
Equations B1, B2, and B3. The statistic g was effectively square is estimated with error.While the extent of variation in mutation rate acrossintroduced by Reich and Goldstein (1998). (For ease
Dow
nloaded from https://academ
ic.oup.com/genetics/article/154/4/1793/6048066 by guest on 01 January 2022

1801Mutation Process at Microsatellites
Fig
ure
5.—
Eff
ects
ofth
esa
mpl
ing
erro
ron
the
calc
ulat
ion
ofth
eN
PVat
each
locu
sin
the
pool
edpo
pula
tion
sam
ple.
Ah
isto
gram
ispl
otte
dof
50,0
00va
lues
ofth
eN
PV;e
ach
valu
eco
rres
pon
dsto
the
sam
ple
vari
ance
ofth
eal
lele
len
gth
obse
rved
ata
locu
sdi
vide
dby
abo
otst
rap
valu
eof
the
esti
mat
edm
utat
ion
mea
nsq
uare
for
that
locu
s.
Dow
nloaded from https://academ
ic.oup.com/genetics/article/154/4/1793/6048066 by guest on 01 January 2022

1802 R. Gonser et al.
TABLE 4
Estimated P values for the three F-statistic-based tests of the null hypothesis of constantpopulation size for various levels of variability in m
Level of variability in m
None Moderate Medium High
Data set Population g F1 F2 g F1 F2 g F1 F2 g F1 F2
First Luo 0.81 0.16 0.14 0.51 0.06 0.05 0.32 0.03 0.02 0.12 0.00 0.00Sardinia 0.77 0.83 0.81 0.46 0.54 0.50 0.27 0.34 0.31 0.08 0.14 0.11Kaingang 0.81 0.49 0.40 0.51 0.23 0.18 0.32 0.10 0.07 0.12 0.01 0.01Pooled 0.70 0.25 0.21 0.39 0.10 0.08 0.21 0.04 0.03 0.05 0.00 0.00
Second Africa 0.75 0.74 0.72 0.45 0.45 0.42 0.27 0.26 0.24 0.09 0.08 0.07Asia 0.91 0.34 0.29 0.66 0.15 0.12 0.50 0.07 0.05 0.31 0.01 0.00Europe 0.93 0.11 0.08 0.70 0.04 0.03 0.53 0.01 0.01 0.35 0.00 0.00Sardinia 0.91 0.06 0.04 0.67 0.02 0.01 0.49 0.01 0.00 0.31 0.00 0.00Pooled 0.84 0.25 0.22 0.57 0.11 0.09 0.38 0.04 0.03 0.17 0.00 0.00
First* Luo 0.82 0.20 0.17 0.53 0.08 0.06 0.35 0.03 0.02 0.14 0.00 0.00Sardinia 0.83 0.07 0.05 0.53 0.02 0.02 0.35 0.01 0.00 0.14 0.00 0.00Kaingang 0.84 0.35 0.26 0.55 0.16 0.11 0.37 0.06 0.04 0.16 0.01 0.00Pooled 0.75 0.02 0.02 0.45 0.01 0.00 0.25 0.00 0.00 0.08 0.00 0.00
Significance levels of tests of the null hypothesis of constant population size based on three test statistics, g(effectively introduced by Reich and Goldstein 1998), which uses only population variance at each locus,and F1 and F2, introduced in this article, based on NPV at each locus. The first and first* data sets refer to thedata reported in Di Rienzo et al. (1998), including and excluding, respectively, the locus D19S244. The seconddata set refers to that reported in this article. Significance levels are given under a range of assumptions aboutthe extent to which the mutation rate varies across loci: no variability, moderate variability (5% of loci havingmutation rates 1023 and 1025, respectively, with the remainder having rate 1024), medium variability (10% ofloci having mutation rates 1023 and 1025, respectively, with the remainder having rate 1024), and high variability(20% of loci having mutation rates 1023 and 1025, respectively, with the remainder having rate 1024). Significancelevels are based on 30,000 values simulated under the null hypothesis, with N 5 10,000. (Changes in the valueof N in the range 5,000 to 20,000 have little effect on the significance level; data not shown.) As described inappendix b, tests based on F1 and F2 are shown to be conservative under variation in the mutation mechanismacross loci and error in the estimation of mutation mean square.
DISCUSSIONmicrosatellite loci has not been well documented, eitherour “medium” or “high” variability scenarios may be Somatic and germ-line mutations: An understandingmost realistic (Weber and Wong 1993; Seielstad et al. of microsatellite mutation patterns is central to their use1999). In this case, excluding D19S244 from the analysis, for the accurate reconstruction of population processes.all populations in the first data set show significant evi- We have developed and validated an experimental ap-dence for departure from the assumption of constant proach to estimate the distribution of mutation sizes forpopulation size. The same is true for all populations, each individual microsatellite locus. These distributionsexcept Africa (in fact the Sotho) in the second data set. were estimated from somatic mutations observed in theUnder the scenario of high variability in mutation rate, tumor tissue of sporadic patients with colorectal cancer.the data are almost significant (P 5 0.07). It is not known whether such mutations arise from
All three test statistics lead to valid tests. The differ- the same events that produce variation in the normalences in P values on the same data are due to differences population. Microsatellite instability in some cancer pa-in their power to detect departures from the null hy- tients may reflect defects in mismatch repair; but, inpothesis. The statistic F2 is slightly more powerful than other patients, it may be a consequence of the higherF1. We should expect the statistics based on NPV (F1 number of cell divisions that occurs in the tumor com-and F2) to be more powerful than one based simply on pared to the normal tissue. Nevertheless, in the absencepopulation variance (g), exactly because the normaliza- of specific mechanistic or genetic information on thetion (division by mutation mean square) corrects for source of these mutations, it is still possible to testone source of variation before combining data across whether they reflect the mutation process in the generalloci. Nonetheless, the difference in power between g population by using population theory. Here, we de-and the two F statistics is striking, particularly if one mostrate that under the generalized stepwise modelwere to use the procedure based on g without making with arbitrary distribution of mutation sizes, the rela-
tionship between the variance of repeat number at aallowance for variation in mutation rate.
Dow
nloaded from https://academ
ic.oup.com/genetics/article/154/4/1793/6048066 by guest on 01 January 2022

1803Mutation Process at Microsatellites
given locus in a population sample and the mutation mutations, another approach to understanding the mu-tation processes is to examine the variation at tightlymean square for the same locus is expected to be linear
regardless of assumptions about the demographic his- linked microsatellite loci. For example, the analysis ofmultilocus haplotypes carrying the CCR5-D32 alleletory of the population (see appendix a). Therefore, if
the mutation mean square estimated in cancer patients showed that 9.5% of the alleles at locus D3S4580, located28 kb from CCR5, differ from the most common oneparallels that of the “real” mutation process, one expects
it to be linearly related to the variance of repeat number by 4–10 repeat units. Detailed haplotype analysis re-vealed that this pattern cannot be easily explained byof different population samples. Three out of the four
population samples examined in this article conform to recombination and is more consistent with occasionallarge mutations (J. Martinson, personal communica-this expectation. This observation extends our previous
findings of a linear relationship between the population tion; Martinson et al. 1998).Overall, our finding in this and the preceding articlevariance and the mutation mean square for an addi-
tional three population samples. Taken together, the of a significant rank correlation between populationvariance and mutation mean square estimated from theresults of these two studies indicate that the somatic
mutations observed in sporadic colorectal cancer pa- cancer data in five of the six population/loci pairs wehave examined would seem extraordinarily unlikely if,tients are a useful approach to the characterization of
the mutation process of microsatellite loci on a locus- in fact, the cancer data were uninformative for the germ-line processes. Further, the results of our analyses ofby-locus basis.
Even though most of the loci show a preponderance human demography, utilizing the mutation mean squaresestimated from the cancer data, are in broad agreementof short mutations, i.e., gain or loss of one or two repeat
units, our estimated distributions of mutation sizes (Fig- with those of analyses of other genetic systems.Identifying anomalous loci: Here, we developed aure 1) are relatively broad for a small subset of the
loci examined. To investigate whether mismatch repair method for identifying loci that are anomalous, eitherin the sense of having a different mutation rate fromdefects result in unusually large mutation sizes, we parti-
tioned the patients into two groups. The first group others in the study or because their evolution is notgoverned by the class of (neutral, generalized stepwise)includes patients with high levels of microsatellite insta-
bility (at least 20% of loci tested had somatic mutations). models on which the analysis is based.We identified one such locus in our studies, D19S244.These patients are more likely to have mismatch re-
pair defects, and this was recently confirmed by staining In the light of independent evidence as to its unusuallyhigh mutation rate, we regard this as the most likelytheir tumor tissue with antibodies against MSH2 and
MLH1 (A. Di Rienzo, K. Halling and S. Thibodeau, explanation for its status as an outlier (Weber andWong 1993). Whatever the reason for the anomaly,unpublished results; Thibodeau et al. 1998). The sec-
ond group includes patients with low levels of microsa- such loci should be excluded from population analyses.An important consequence of the ability to detect suchtellite instability; the somatic mutations observed in
these patients may well be “normal” mutations probably loci is thus the potential for improved inferences as topopulation parameters and population history. In ourreflecting the large number of cell divisions in tumor
tissue. In this analysis we pooled classes of loci to main- study, excluding D19S244 led to clear differences in thepopulation inferences obtained.tain reasonable sample sizes. There were 123, 89, and
163 instances of somatic mutation at di-, tri-, and tetra- More generally, this method has the potential to de-tect loci at or near which natural selection has acted.nucleotide repeats in the high instability group, respec-
tively, and 47, 24, and 53 instances in the low instability Recall that balancing selection, respectively backgroundselection or a selective sweep, acting near a locus willgroup in the corresponding groups of loci. The prepon-
derance of short mutations, with some larger mutations, increase, respectively decrease, the observed g(l, p)value at that locus relative to others in the same popula-was apparent in both the high and low microsatellite
instability groups, and estimates of mutation mean tion. In our analysis the effect of natural selection isconfounded with a higher mutation rate at the locus.squares were similar in each group (data not shown).
Furthermore, a similar broad range of mutation sizes One way of distinguishing between the effects of selec-tion and mutation rate changes would be to examine(e.g., from 212 to 111 repeat units) was observed in
the largest survey reported to date of de novo mutations tightly linked microsatellite loci near the anomalousone. Selection should have an effect in the same direc-in family studies (1107 events over 952,962 parent-off-
spring transmissions; Seielstad et al. 1999). In contrast, tion on all such loci. If the original outlier results froman unusually high or low mutation rate, the effect shouldearlier, smaller studies observe predominantly one-step
mutations (e.g., Weber and Wong 1993; Brinkmann et not extend to linked loci.Inferences for population parameters and populational. 1998). These findings suggest that large samples are
necessary to observe mutations of large amplitude and history: Under general assumptions, the average NPVvalue across loci within a population is an unbiasedfurther support our inference of concordant patterns
in somatic and germ-line mutations. estimator of mE(T12), the product of the average muta-tion rate for the loci and the mean pairwise coalescenceIn addition to the study of germ-line de novo or somatic
Dow
nloaded from https://academ
ic.oup.com/genetics/article/154/4/1793/6048066 by guest on 01 January 2022

1804 R. Gonser et al.
time. For the two simplified demographic scenarios of second data set also becomes highly suggestive of popu-lation expansion (P 5 0.07).constant population size and sudden expansion from a
small size, this leads naturally to estimators for the effec- The mutation process at microsatellite loci is clearlycomplex. Accordingly, we chose to use an analyticaltive population size and the time since expansion, re-
spectively. The estimates shown in Table 3 are in line approach that takes into account most of these complex-ities. There are related recent approaches that use mi-with those obtained based on other studies suggesting
an ancient expansion of the human population (Har- crosatellite data to estimate demographic histories (Kim-mel et al. 1998; Reich and Goldstein 1998). Thesepending et al. 1998). In this regard, it should be noted
that methods that assume that all mutations involve only methods typically make the restrictive assumption thatall mutations involve a gain or loss of one repeat unita single repeat unit will lead to an overestimate of the
population parameters. Thus, in the presence of multi- and do not allow for heterogeneities across loci in pa-rameters of the mutation process. In the presence ofstep mutations, our estimates based on the NPV will
result in comparatively lower, and more accurate, values. such heterogeneities, and possible larger step sizes, esti-mates of parameters describing population history maySeveral points about this estimation procedure are
noteworthy. The first is that recovery of time or popula- be biased, and while tests for population expansion maybe conservative, this will be at the cost of a loss of powertion size estimates is dependent on assumptions about
the average mutation rate for the loci used. Direct em- to detect an expansion. Assuming, as seems plausiblefrom the rank correlation results (Table 2), that ourpirical evidence is scanty, yet a change by a factor of
two, for example, in this average rate will change esti- estimates of mutation mean square are related to therelevant germ-line processes, our approach to the recon-mated times or sizes by a factor of one-half. This prob-
lem, effectively one of calibrating mutational events into struction of demographic histories will have substan-tially more power to detect expansion. In particular,numbers of generations, afflicts all estimates of such
parameters from microsatellite data. Particularly in view our analysis (see Table 4) has shown that a method thatdoes not use locus-specific information on the mutationof the current speculative nature of such calibrations,
the actual value of such estimates should be interpreted mean square is much less powerful than those devel-oped here.with caution. We have presented point estimates with
no attempt at assessing the precision of the estimates A signal of population expansion has been observedin virtually all major ethnic groups for mtDNA (Har-or, equivalently, of giving confidence intervals. In large
part, this is because of the difficulty with the calibration pending et al. 1993; Rogers 1995). However, based onmicrosatellite analyses, other authors have detected ajust described. In addition, while the estimator is un-
biased for the compound parameter mE(T12) rather significant signal only in nonoverlapping subsets ofhuman populations (Kimmel et al. 1998; Reich andgenerally, its sampling properties, and in particular its
precision, will depend sensitively on the underlying Goldstein 1998). Our results are in broad agreementwith those based on mtDNA and those obtained bydemographic scenario. Finally, in our approach we have
estimated the mutation mean square at each locus. This Kimmel and colleagues on microsatellites: all but oneof our signals result in unmistakable rejection of the nullestimation also carries uncertainty, in the usual way
through sampling, but in addition because we are only hypothesis of constant population size; in a directionconsistent with expansion, only one (Luo) of the twomeasuring a surrogate for the germ-line parameter.
While we have used the bootstrap to quantify the former African populations results in rejection of this null hy-pothesis. In this regard, it is interesting to note that theuncertainty, the latter is problematical. It thus does not
seem straightforward to quantify the uncertainty in inclusion of a single “anomalous” locus in our data set,D19S244, renders the Sardinian population sample con-these kinds of estimates of population parameters. On
the other hand, it is clear that the uncertainty is large, sistent with a constant population size without variabilityof mutation rates. Thus, failure to identify and allowand in the absence of further relevant data any point
estimate based on microsatellite data should be inter- for heterogeneity in the mutation process even at asingle locus may dramatically affect the power to detectpreted with great caution.
We performed significance tests of the null hypothesis population expansion. With regard to microsatelliteanalyses, our methods provide more powerful tests inof constant population size for both data sets. Taking the
effective population size as 10,000 individuals, allowing the presence of departures from the simple one-stepmutation model or interlocus heterogeneity in eithermedium variability in mutation rate across loci, and
ignoring the locus D19S244 shown above to be anoma- mutation rates or step size distributions. Thus, a morelikely explanation for the discrepancies across microsa-lous, the null hypothesis would be rejected, in favor of
scenarios involving population growth, for all popula- tellite analyses is the different power of the statisticaltests employed to detect population expansion. The facttions in the first data set and for all but the African
population in the second data set. If there were more that the null hypothesis of constant population size isnot rejected by a particular test does not mean that thevariation in mutation rates across loci (our “high” vari-
ability scenario), then the African population in the hypothesis is true. While some scenarios proposed for
Dow
nloaded from https://academ
ic.oup.com/genetics/article/154/4/1793/6048066 by guest on 01 January 2022

1805Mutation Process at Microsatellites
Kimmel, M., R. Chakraborty, J. P. King, M. Bamshad, W. S. Watkinsexpansion, say, in Africa but not in other regions (Reichet al., 1998 Signatures of population expansion in microsatellite
and Goldstein 1998), are not without interest, our repeat data. Genetics 148: 1921–1930.Lewontin, R. C., 1972 The apportionment of human diversity. Evol.results suggest that they are not needed.
Biol. 6: 381–398.We thank D. Barch, G. K. Haines, and B. Sisk for help in sample Litt, M., and J. A. Luty, 1989 A hypervariable microsatellite re-
collection; R. R. Hudson and C. Ober for comments on the manu- vealed by in vitro amplification of a dinucleotide repeat withinscript; M. Stephens for helpful discussions; and L. Jorde for providing the cardiac muscle actin gene. Am. J. Hum. Genet. 44: 397–401.
Martinson, J. J., E. C. Lawrence, M. J. Alexander, M. Sweeneya file containing the original population data. This work was supportedand R. E. Ferrell, 1998 A population-based survey of STRin part by grants from the National Science Foundation (SBR-9317266allelic association at the chemokine receptor gene CCR5. Am. J.to A.D. and DMS-9505129 to P.D.) and the American Cancer Society,Hum. Genet. 63 (Suppl.): A216.Illinois Division, and Digestive Disease Research Center (DK-42086)
Nei, M., 1987 Molecular Evolutionary Genetics. Columbia Universityto A.D. and a UK Engineering and Physical Sciences Research CouncilPress, New York.
Advanced Fellowship (B/AF1255) to P.D. Pena, S. D. J. (Editor), 1993 DNA Fingerprinting: State of the Science.Birkhauser Verlag, Basel/Boston.
Pritchard, J. K., and M. W. Feldman, 1996 Statistics for microsatel-lite variation based on coalescence. Theor. Popul. Biol. 50: 325–
LITERATURE CITED 344.Reich, D., and D. Goldstein, 1998 Genetic evidence for a Paleo-
Bowcock, A. M., L. A. Ruiz, J. Tomfohrde, E. Minch, J. R. Kidd lithic human population expansion in Africa. Proc. Natl. Acad.et al., 1994 High resolution of human evolutionary trees with Sci. USA 95: 8119–8123.polymorphic microsatellites. Nature 368: 455–457. Reich, D. E., M. W. Feldman and D. B. Goldstein, 1999 Statistical
Brinkmann, B., M. Klintschar, F. Neuhuber, J. Huhne and B. Rolf, properties of two tests that use multilocus data sets to detect1998 Mutation rate in human microsatellites: influence of the population expansions. Mol. Biol. Evol. 16: 453–466.structure and length of the tandem repeat. Am. J. Hum. Genet. Roe, A., 1992 Correlations and interactions in random walks and62: 1408–1415. population genetics, Ph.D. Thesis, University of London.
Burke, T. (Editor), 1991 DNA Fingerprinting: Approaches and Applica- Rogers, A. R., 1995 Genetic evidence for a Pleistocene populationtions. Birkhauser Verlag, Basel/Boston. explosion. Evolution 49: 608–615.
Chakraborty, R., M. Kimmel, D. N. Stivers, L. J. Davison and R. Seielstad, M., X. Xu and X. Xu, 1999 Direct observations of micro-Deka, 1997 Relative mutation rates at di-, tri-, and tetranucleo- satellite mutations, p. 57 in Human Evolution, edited by L. L.tide microsatellite loci. Proc. Natl. Acad. Sci. USA 94: 1041–1046. Cavalli-Sforza, S. Paabo and D. Wallace. Cold Spring Harbor
Charlesworth, D., B. Charlesworth and M. T. Morgan, 1995 Laboratory Press, Cold Spring Harbor, NY.The pattern of neutral molecular variation under the background Shriver, M. D., L. Jin, R. Chakraborty and E. Boerwinkle, 1993selection model. Genetics 141: 1619–1632. VNTR allele frequency distributions under the stepwise mutation
Dempster, A. P., N. M. Laird and D. B. Rubin, 1977 Maximum model: a computer simulation approach. Genetics 134: 983–993.likelihood estimation from incomplete data via the EM algorithm. Slatkin, M., 1995 A measure of population subdivision based onJ. R. Stat. Soc. Ser. B 39: 1–38. microsatellite allele frequencies. Genetics 139: 457–462.
Di Rienzo, A., and A. C. Wilson, 1991 Branching pattern in the Smith, J. M., and J. Haigh, 1974 The hitch-hiking effect of a favour-evolutionary tree for human mitochondrial DNA. Proc. Natl. able gene. Genet. Res. 23: 23–35.Acad. Sci. USA 88: 1597–1601. Thibodeau, S. N., A. J. French, J. M. Cunningham, D. Tester,
Di Rienzo, A., A. C. Peterson, J. C. Garza, A. M. Valdes, M. Slatkin L. J. Burgart et al., 1998 Microsatellite instability in colorectalet al., 1994 Mutational processes of simple-sequence repeat loci cancer: different mutator phenotypes and the principal involve-in human populations. Proc. Natl. Acad. Sci. USA 91: 3166–3170. ment of hMLH1. Cancer Res. 58: 1713–1718.
Di Rienzo, A., C. Toomajian, B. Sisk, K. Haines, D. Barch et al., Valdes, A. M., M. Slatkin and N. B. Freimer, 1993 Allele frequen-1995 STRP variation in human populations and their patterns cies at microsatellite loci: the stepwise mutation model revisited.of somatic mutations in cancer patients. Am. J. Hum. Genet. 57 Genetics 133: 737–749.(Suppl.): A41. Weber, J. L., and P. E. May, 1989 Abundant class of human DNA
Di Rienzo, A., P. Donnelly, C. Toomajian, B. Sisk, A. Hill et al., polymorphisms which can be typed using the polymerase chain1998 Heterogeneity of microsatellite mutations within and be- reaction. Am. J. Hum. Genet. 44: 388–396.tween loci, and implications for human demographic histories. Weber, J. L., and C. Wong, 1993 Mutation of human short tandemGenetics 148: 1269–1284. repeats. Hum. Mol. Genet. 2: 1123–1128.
Donnelly, P., and S. Tavare, 1995 Coalescents and genealogical Wright, D. K., and M. Manos, 1990 Sample preparation from paraf-structure under neutrality. Annu. Rev. Genet. 29: 401–421. fin-embedded tissues, pp. 153–158 in PCR Protocols, edited by
Feldman, M. W., A. Bergman, D. D. Pollock and D. B. Goldstein, M. A. Innis, D. H. Gelfand and T. J. White. Academic Press,1997 Microsatellite genetic distances with range constraints: an- San Diego.alytic description and problems of estimation. Genetics 145: 207– Zhivotovsky, L. A., and M. W. Feldman, 1995 Microsatellite vari-216. ability and genetic distances. Proc. Natl. Acad. Sci. USA 92: 11549–
Good, P., 1994 Permutation Tests. Springer-Verlag, New York. 11552.Harpending, H. C., C. S. T. Sherry, A. R. Rogers and M. Stoneking,
Communicating editor: N. Takahata1993 The genetic structure of ancient human populations.Curr. Anthropol. 34: 483–496.
Harpending, H. C., M. A. Batzer, M. Gurven, L. B. Jorde, A. R.Rogers et al., 1998 Genetic traces of ancient demography. APPENDIX AProc. Natl. Acad. Sci. USA 95: 1961–1967.
Hudson, R. R., and N. L. Kaplan, 1988 The coalescent process in Writing S 2 for the sample variance of allele length inmodels with selection and recombination. Genetics 120: 831–840.a sample from a population at a particular locus, weJorde, L. B., M. J. Bamshad, W. S. Watkins, R. Zenger, A. E. Fraley
et al., 1995 Origins and affinities of modern humans: a compari- show here that, for any demographic scenario,son of mitochondrial and nuclear genetic data. Am. J. Hum.Genet. 57: 523–538. E(S 2) 5 h2mE(T12), (A1)
Kaplan, N. L., T. Darden and R. R. Hudson, 1988 The coalescentprocess in models with selection. Genetics 120: 819–829. where h2 is the mutation mean square (the expected
Kimmel, M., and R. Chakraborty, 1996 Measures of variation atsquared size of the change in allele length caused byDNA repeat loci under a general stepwise mutation model. Theor.
Popul. Biol. 50: 345–367. mutation), m is the mutation rate at the locus, and E(T12)
Dow
nloaded from https://academ
ic.oup.com/genetics/article/154/4/1793/6048066 by guest on 01 January 2022

1806 R. Gonser et al.
is the expected coalescence time (in generations) for a Further,pair of genes at the locus. The effect of the demographic
Var(W1) 5 E(Var(W1|T12)) 1 Var(E(W1|T12))scenario enters through its effect on E(T12). This extendsa result of Slatkin (1995) to an arbitrary generalized 5 E(mT12) 1 Var(mT12)stepwise mutation process.
5 mE(T12) 1 m2Var(T12). (A6)Note that for a population with constant effective
size N chromosomes, E(T12) 5 N, and for one that has Analogously,expanded rapidly from a very small size T generations
E(W12) 5 2mE(T12) and Var(W12) 5 2mE(T12) 1 4m2 Var(T12).ago, E(T12) ≈ T. The general result (A1) thus reducesto known results [for example, Di Rienzo et al. (1998, (A7)Equation A2, and the equation below A11)] in these
The result (A1) now follows on substituting (A5) andcases.(A6) into (A3) and (A7) into (A4), before substitutingThroughout, we assume the generalized stepwisethe resulting expressions into (A2). (Recall that h2 5model for mutation, namely that neither the mutationm2 1 s2.)rate nor the distribution of the change in allele length
caused by mutation will depend on the length of theprogenitor allele, and we assume selective neutrality. APPENDIX BAside from this, we allow arbitrary distribution of muta-
We describe here the details of the significance teststion sizes and, as we have noted, an arbitrary demo-of demographic scenarios used in the article. Write S 2graphic scenario.and V, respectively, for the population variance and theRecall from Equation A9 of Di Rienzo et al. (1998)normalized population variance, L for the number ofthat we can writeloci in the data, and h2 and h4, respectively, for themutation mean square and the fourth moment of the
E(S 2) 5 2Var(Y1) 212Var(Y1 1 Y2), (A2) distribution of mutation size. We use an overbar to de-
note the average of a quantity across loci in the datawhere Y1 and Y2, respectively, are the differences be- set, and Var to denote its variance across loci. Thus, fortween the lengths of two sampled copies of the locus example, S 2 and Var(S 2) denote the average value andand the length of their most recent common ancestor. variance of S 2 across loci.
The three test statistics we consider areNow, write W1 for the number of mutations on thelineage to the first sampled chromosome since its com-mon ancestor with the second, and W12 for the total F1 ; 343 (V)24/Var(V), (B1)number of mutations along either lineage since theircommon ancestor. Conditional on T12, the number of
F2 ; 343 (V)2 1 116 22
9L 1h4
h2222V4/Var(V) , (B2)generations since this common ancestor, W1 and W12
have binomial distributions with parameters (T12, m)and (2T12, m), respectively. In particular, conditional andon T12, the means of W1 and W12 are mT12 and 2mT12,respectively, and their respective variances are mT12(1 2 g ; (4/3)(S 2)2 1 (1/6)S 2
Var(S 2). (B3)
m) and 2mT12(1 2 m). Since m is small, we approximatethese conditional variances by mT12 and 2mT12, respec-
The statistic g is the reciprocal of the g statistic intro-tively.duced by Reich and Goldstein (1998), and so useAs in Di Rienzo et al. (1998, equations preceding A10of either statistic for testing is equivalent. To removeand A11), we can writedependence of the numerator on (h4/h2
2), the statisticF1 does not include a linear term in V. The reason forVar(Y1) 5 s2E(W1) 1 m2Var(W1), (A3)the somewhat involved definition of F2 is that we areaiming to rid the numerator of any dependence onand(h4/h2
2), and under the assumption of constant popula-Var(Y1 1 Y2) 5 s2E(W12) 1 m2Var(W12), (A4) tion size,
where m and s2 are, respectively, the mean and varianceE((V )2) 5 N 2m2 1
1L 143N 2m2 1
16Nm(h4/h2
2)2.of the distribution of mutation size.Now,
For each statistic the null hypothesis is rejected forE(W1) 5 E(E(W1|T12)) 5 E(mT12) 5 mE(T12).large values of the test statistic, corresponding to smallervariation across loci in the normalized or unnormalized(A5)
Dow
nloaded from https://academ
ic.oup.com/genetics/article/154/4/1793/6048066 by guest on 01 January 2022

1807Mutation Process at Microsatellites
population variance than would be expected under the servative, in understating the probability of a type Ierror, under more general assumptions about the pro-null hypothesis of constant population size.cesses involved.For the values of L and n (the number of chromo-
First, we simulated from the null distribution of thesomes in the sample) appropriate for each part of ourF statistics under exactly the same assumptions as for g.data sets, we evaluated the null distribution of g byNext, we weakened the assumption of simple stepwisesimulating 30,000 realizations of evolution with constantmutation at each locus, simulating instead using thepopulation size, u ; 2Nm 5 4 (where N is the number“two-phase” model introduced in Di Rienzo et al.of chromosomes in the population), a simple stepwise(1994). Initially we assumed that all loci had the samemutation model, and no variation in either the mutationtwo-phase distribution of mutation size, varying the pa-rate or the mutation mechanism across loci. For eachrameters (notation as in Di Rienzo et al. 1994) in theof the scenarios in which there is variation across locirangein the mutation rate, we found the null distribution of g
by repeating these simulations, except that a population p P (0.0, 1.0), s2g P (0, 200), u P (0.01, 100).
size of N 5 10,000 was assumed, and in the simulationsFor each of several sets of parameters spanning thisthe mutation rate for each locus was chosen randomlyrange, 1000 data sets were simulated (with L 5 15, n 5according to100).
Moderate variability: Next, we introduced possible variation in the muta-tion mechanism across loci by choosing parameters forP(m 5 1025) 5 P(m 5 1023) 5 0.05, P(m 5 1024) 5 0.90the two-phase model independently for each locus, withp being chosen uniformly over various ranges ((0,1),Medium variability:(0.5, 1), (0.8, 1), and (0.9, 1)) for each of which s2
g wasP(m 5 1025) 5 P(m 5 1023) 5 0.10, P(m 5 1024) 5 0.80 chosen uniformly over (0, 50), (0, 100), and (0, 200).
We also tried several discrete distributions on p andHigh variability:s2
g in these ranges.Finally, we allowed for uncertainty in the estimationP(m 5 1025) 5 P(m 5 1023) 5 0.20, P(m 5 1024) 5 0.60.
of the mutation mean square at each locus by repeating(If variation in mutation rate across loci is assumed, the the simulations described in the previous paragraph,null distribution of g depends explicitly on N. With no but, in addition, using a value of h2 for the locus thatsuch variation, it depends only on u.) is chosen from a normal distribution, with mean given
In each case, the simulated null distribution for g by the true value of h2 (which is specified once the(under the appropriate assumption about variability in parameters for the mutation model are chosen) andm) was also used as the null distribution for F1 and F2. variance (h2 2 1)2/4, independently for each locus. TheSignificance levels for each of the three statistics were choice of distribution for the sampling error in ourcalculated as the percentage of times in the relevant estimates of mutation mean square is motivated by thesimulation that the simulated value of g was larger than bootstrap estimates of the sampling variability describedthe observed value of the test statistic. in this article.
Our principal interest focuses on the use of the statis- Each of these sets of simulations was performed undertics F1 and F2. To establish the validity of our procedure each of the assumptions about variation in mutationwe carried out extensive simulations to check that the rate, with the nominal level of the test set at 0.05. On
no occasion was the actual type I error .0.05.nominal P values calculated as just described were con-
Dow
nloaded from https://academ
ic.oup.com/genetics/article/154/4/1793/6048066 by guest on 01 January 2022