microkinetic analysis of catalytic reactions · 242 chapter 7 microkinetic analysis of catalytic...
TRANSCRIPT

__~_7
Microkinetic Analysisof Catalytic Reactions
7.1 I IntroductionA catalytic reaction consists of many elementary steps that comprise an overallmechanistic path of a chemical transformation. Although rigorous reaction mechanisms are known for simple chemical reactions, many catalytic reactions have beenadequately described by including only the kinetically significant elementary steps.This approach was used in Chapter 5 to simplify complex heterogeneous catalyticreaction sequences to kinetically relevant surface reactions. The next step in furthering our understanding of catalytic reactions is to consolidate the available experimental data and theoretical principles that pertain to elementary steps in orderto arrive at quantitative models. This is the role of microkinetic analysis, which isdefined as an examination of catalytic reactions in terms of elementary steps andtheir relation with each other during a catalytic cycle (1. A. Dumesic, D. F. Rudd,L. M. Aparicio, J. E. Rekoske, and A. A. Trevino, The Microkinetics of Heterogeneous Catalysis, American Chemical Society, Washington, D.C., 1993, p. 1). In thischapter, three catalytic reactions will be examined in detail to illustrate the conceptof microkinetic analysis and its relevance to chemical reaction engineering. The firstexample is asymmetric hydrogenation of an olefin catalyzed by a solubleorganometallic catalyst. The second and third examples are ammonia synthesis andolefin hydrogenation, respectively, on heterogeneous transition metal catalysts.
7.2 I Asymmetric Hydrogenationof Prochiral Olefins
The use of soluble rhodium catalysts containing chiral ligands to obtain high stereoselectivity in the asymmetric hydrogenation of prochiral olefins represents one ofthe most important achievements in catalytic selectivity, rivaling the stereoselectivity of enzyme catalysts [1. Halpern, Science, 217 (1982) 401]. Many chiralligands
240

C H A PT E R 7 Microkinetic Analysis of Catalytic Reactions 241
Methyl-(Z)-a-acetamidocinnamate(MAC)
H
'"~C
V
oIi
/,C-O-CH3
c'" + H2
N-C-CH3H II
o
H 0I If II
H3C~ ~ ~ N ----'--Y):C.~ 0 ~.. CH
3
o ~
I
~ N-acetYI-(R)-PhenYlalanine-::thYI ester(R)
(Rh catalyst)
N-acetyl-(S)-phenylalanine methyl ester(8)
Figure 7.2.1 IHydrogenation of MAC catalyzed by a homogeneous Rh catalyst to give Rand Senantiomers of N-acetylphenylalanine methyl ester.
have been used to create this class of new asymmetric hydrogenation catalysts. Inaddition, stereoselectivity has been observed with a variety of olefins during hydrogenation reactions in the presence of these chiral catalysts, demonstrating the generalutility of the materials. As an example of microkinetic analysis, the asymmetric hydrogenation of methyl-(Z)-a-acetamidocinnamate, or MAC, to give the enantiomers(R and S) of N-acetylphenylalanine methyl ester will be discussed in detail. Theoverall reaction is illustrated in Figure 7.2.1.
C. R. Landis and J. Halpern found that cationic rhodium, Rh(I), with the chiralligand R,R-l,2-bis[(phenyl-o-anisol)phosphino]ethane, or DIPAMP (see Figure7.2.2), was very selective as a catalyst for the production of the S enantiomer of
OpQHoCOe OCH
3
6:~ Prj'f ~
R.R-DIPAMP
R,R-I ,2-bis[(phenyl-o-anisol)phosphino]ethane
Figure 7.2.2 IChiral ligand for enantioselectiverhodium catalyst

242 CHAPTER 7 Microkinetic Analysis of Catalytic Reactions
N-acetylphenylalanine methyl ester during MAC hydrogenation in methanol solvent [CO R. Landis and J. Halpern, 1. Am. Chern. Soc., 109 (1987) 1746]. The DIPAMP coordinates to the rhodium through the phosphorus atoms and leaves plentyof space around the Rh cation for other molecules to bind and react. The uniquefeature of this system is that the chirality of the DIPAMP ligand induces the highstereoselectivity of the product molecules. An analogous nonchiral ligand on theRh cation produces a catalyst that is not enantioselective.
To understand the origin of enantioselectivity in this system, the kinetics of therelevant elementary steps occurring during hydrogenation had to be determined. Thecatalytic cycle can be summarized as: (a) reversible binding of the olefin (MAC) tothe Rh catalyst, (b) irreversible addition of dihydrogen to the Rh-olefin complex,(c) reaction of hydrogen with the bound olefin, and (d) elimination of the productinto the solution to regenerate the original catalyst. Landis and Halpern have measured the kinetics of step (a) as well as the overall reactivity of the adsorbed olefinwith dihydrogen [CO R. Landis and J. Halpern, 1. Am. Chern. Soc., 109 (1987) 1746].Figure 7.2.3 shows two coupled catalytic cycles that occur in parallel for the production of Rand S enantiomers from MAC in the presence of a common rhodiumcatalyst, denoted as *. Since the catalyst has a chiral ligand, MAC can add to thecatalyst in two different forms, one that leads to the R product, called MAC*R, andone that leads to the S product, called MAC*s. The superscripts refer to the catalytic cycles that produce the two enantiomers.
MAC
Major\1AC·
Rintermediate
k R-I
•
k S-I
Minorintermediate
RMinor
product
SMajor
product
Figure 7.2.3 IScheme of the coupled catalytic cycles for the asymmetric hydrogenation of MAC.

CHAPTER 7 Microkinetic Analys;s of Catalytic Reactions 243
Expressions for relative concentrations of the intermediates and products aredeveloped from concepts discussed in earlier chapters, namely, the use of a totalcatalytic site balance and the application of the steady-state approximation. The total amount of rhodium catalyst in the reactor is considered constant, [*]0, so thatthe site balance becomes:
(7.2.1)
The steady-state approximation indicates that the concentrations of reactive intermediates remain constant with time. In other words, the net rate of MAC bindingto the catalyst to form an intermediate must be the same as the rate of hydrogenation (or disappearance) of the intermediate. The steady-state approximation for thecoupled catalytic cycles is expressed mathematically as:
drMAc*R], - 0 - rR - r R - r R
dt - - 1 -I 2
d[MAC*S]----= 0 = rS r~1 - r~
dt 1
or in terms of the rate expressions as:
o = kf[MAC][*]-k~I[MAC*R]-k~[MAC*R][H2]
o = knMAC][*]-k~I[MAC *S]-k~ [MAC*S][H2]
(7.2.2)
(7.2.3)
(7.2.4)
(7.2.5)
Rearranging Equations (7.2.4 and 7.2.5) gives the concentrations of reactiveintermediates:
kR rMAC][*][MAC *R] = _I_L _
k~1 + k~[H2]
kS [MAC][*][MAC *S] = _I _k~1 + kHH2]
that can be used to derive an equation for their relative concentration:
(7.2.6)
(7.2.7)
(7.2.8)
The ratio of concentrations of the products R and S can be derived in a similar fashion:
rR rf - r~1 r~ (7.2.9)
rs = rf r~1 r~ (7.2.10)
rs r~ k~ [MAC *S][H2] C~) ,[MAC *S] (7.2.11)[R] rR rf k~[MAC k~ ~MAC *R]
244 CHAPTER 7 Microkinetic Analysis of Catalytic Reactions
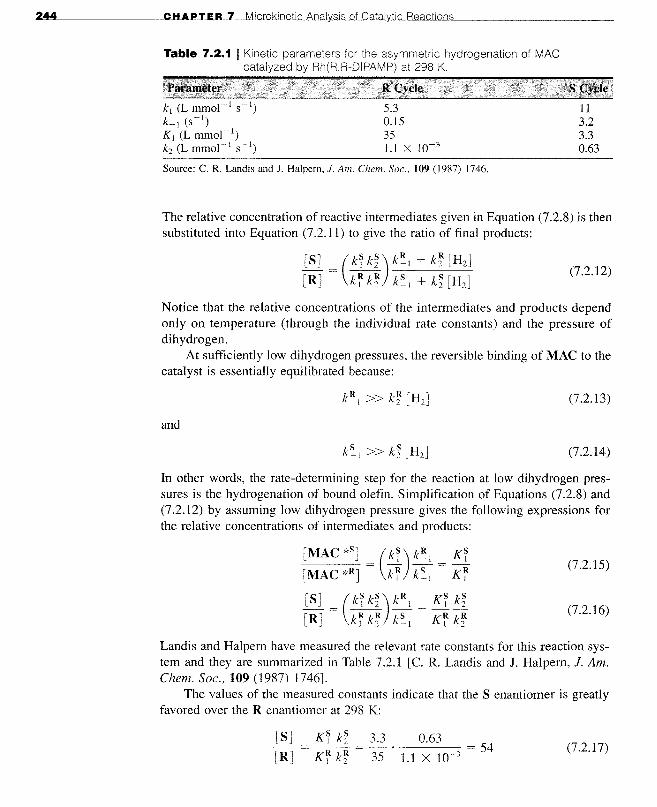
Table 7.2.1 I Kinetic parameters for the asymmetric hydrogenation of MACcatalyzed by Rh(R,R-DIPAMP) at 298 K,
k1 (L mmol- I S-l)
L 1 (S-l)
KI (L mmol- I)
k2 (L mmol- 1 S-I)
5.30.15351.1 x 10-3
113.23.30.63
(7.2.12)
Source: C. R. Landis and J. Halpern, 1. Am, Chem, Soc., 109 (1987) 1746.
The relative concentration of reactive intermediates given in Equation (7.2.8) is thensubstituted into Equation (7.2.11) to give the ratio of final products:
[S] = (k~ k~) k~l + k~ [H2 ]
[R] k~ k~ k~l + kHH2 ]
Notice that the relative concentrations of the intermediates and products dependonly on temperature (through the individual rate constants) and the pressure ofdihydrogen.
At sufficiently low dihydrogen pressures, the reversible binding of MAC to thecatalyst is essentially equilibrated because:
(7.2.13)
and
(7.2.14)
In other words, the rate-determining step for the reaction at low dihydrogen pressures is the hydrogenation of bound olefin. Simplification of Equations (7.2.8) and(7.2.12) by assuming low dihydrogen pressure gives the following expressions forthe relative concentrations of intermediates and products:
[MAC *S] = (k~) k~l = K~[MAC *R] k~ k~l K~
[S] (k~ k~) k~l _ K~ k~
[R] \k~ k~ kSI - K~ k~
(7.2.15)
(7.2.16)
Landis and Halpern have measured the relevant rate constants for this reaction system and they are summarized in Table 7.2.1 [C. R. Landis and 1. Halpern, J. Am.Chern. Soc., 109 (1987) 1746].
The values of the measured constants indicate that the S enantiomer is greatlyfavored over the R enantiorner at 298 K:
[S][R]
K~ k~
K~ k~
3.3
35__0_.6_3_ = 541.1 X 10⁻³
(7.2.17)

CHAPTER 7 Microkinetic Analysis Qf Catalytic RAactiQos 245
This result is rather surprising since the reactive intennediate that leads to the S enantiomer is in the minority. Equation (7.2.15) illustrates the magnitude of this difference:
K~R = 0.094K 1
(7.2.18)
The reason that the minor reactive intennediate leads to the major product is due tothe large rate constant for hydrogenation (k2) associated with the S cycle comparedto the R cycle. Clearly, the conventional "lock and key" analogy for the origin ofenantioselectivity does not apply for this case since the selectivity is determined bykinetics of hydrogenation instead of thennodynamics of olefin binding.
A microkinetic analysis of this system also adequately explains the dependence ofenantioselectivity on dihydrogen pressure. At sufficiently high pressures of dihydrogen,
(7.2.19)
and
(7.2.20)
Since the binding of olefin is not quasi-equilibrated at high pressure, the subsequenthydrogenation step cannot be considered as rate-detennining. The relative concentrations of reactive intennediates and products are now given as:
and
[MAC *s] = (k~) k~ = (~) l.l X 10-3
= 3.6 X 10⁻³
[MAC *R] kf k~ 5.3 0.63
~ = (k~) = (~) =[R]
R 2.1k] 5.3
(7.2.21)
(7.2.22)
The effect of dihydrogen is to lower the enantioselectivity to the S product from[S]/[R] = 54 at low pressures to [S]/[R] = 2.1 at high pressures. The reason forthe drop in selectivity is again a kinetic one. The kinetic coupling of the olefin binding and hydrogenation steps becomes important at high dihydrogen pressure [M.Boudart and G. Djega-Mariadassou, Caral. Lett., 29 (1994) 7]. In other words, therapid hydrogenation of the reactive intennediate prevents quasi-equilibration of theolefin binding step. The relative concentration of the minor intennediate MAC*s(that leads to the major product S) decreases significantly with increasing dihydrogen pressure since k~ » k~. In this example, the kinetic coupling on the S cycleis much stronger than that on the R cycle, and that leads to an overall reduction inselectivity with increasing dihydrogen pressure.
It should be pointed out that selectivity does not depend on dihydrogen in thelimit of very high or very low pressure. For intennediate dihydrogen pressures, Equations (7.2.8) and (7.2.12)-that depend on dihydrogen-should be used to calculateselectivity. The microkinetic methodology satisfactorily explains the surprising

246 CHAPTER 7 MicrQkinetic Analysis Qf Catalytic ReactiQns
inverse relationship between intermediate and product selectivity and the unusualeffect of dihydrogen pressure on product selectivity observed during asymmetrichydrogenation of prochiral olefins with a chiral catalyst.
7.3 I Ammonia Synthesis onTransition Metal Catalysts
The ammonia synthesis reaction is one of the most widely studied reactions and it hasbeen discussed previously in this text. (See Example 1.1.1, Table 5.2.1, and Section5.3.) In this section, results from the microkinetic analysis of ammonia synthesis overtransition metal catalysts containing either iron or ruthenium will be presented.
A conventional ammonia synthesis catalyst, based on iron promoted with Al20 3
and K20, operates at high temperatures and pressures in the range of 673-973 Kand 150-300 bars to achieve acceptable production rates. Metallic iron is the activecatalytic component while A120 3 and K20 act as structural and chemical promoters, respectively. The goal of microkinetic analysis in this case is to study the conditions under which data collected on single crystals in ultrahigh vacuum or onmodel powder catalysts at ambient pressures can be extrapolated to describe the performance of a working catalyst under industrial conditions of temperature and pressure. Unfortunately, the kinetic parameters of all possible elementary steps are notknown for most heterogeneous catalytic reactions. Thus, a strategy adopted byDumesic et al. involves construction of a serviceable reaction path that captures theessential surface chemistry, and estimation of relevant parameters for kinetically significant elementary steps (J. A. Dumesic, D. F. Rudd, L. M. Aparicio, J. E. Rekoske,and A. A. Trevino, The Microkinetics ofHeterogeneous Catalysis, American Chemical Society, Washington, D.C., 1993, p. 145).
In the case of ammonia synthesis on transition metal catalysts, a variety ofreasonable paths with various levels of complexity can be proposed. For the sakeof clarity, only one such path will be presented here. Stolze and Norskov successfully interpreted the high-pressure kinetics of ammonia synthesis based on amicroscopic model established from fundamental surface science studies [Po Stolzeand J. K. Norskov, Phys. Rev. Lett., 55 (1985) 2502; P. Stolze and J. K. Norskov,J. Catal., 110 (1988) 1]. Dumesic et al. re-analyzed that sequence of elementarysteps, which is presented in Table 7.3.1, for ammonia synthesis over iron catalysts[1. A. Dumesic and A. A. Trevino, 1. Catal.. 116 (1989) 119]. The rate constants foradsorption and desorption steps were estimated from results obtained on iron single crystal surfaces at ultrahigh vacuum conditions. The surface hydrogenation rateswere estimated from the relative stabilities of surface NHx species. In the following microkinetic analysis, an industrial plug flow reactor was modeled as a seriesof 10,000 mixing cells (see Example 3.4.3) in which the steady-state rate equations,the catalyst site balance, and the material balances for gaseous species were solvedsimultaneously. Thus, no assumptions with respect to a possible rate-determiningstep and a most abundant reaction intermediate were needed to complete the model.
The conditions chosen for the microkinetic analysis correspond to an industrialreactor with 2.5 cm3 of catalyst operating at 107 bar with a stoichiometric feed of
____________-"CLlH:LAOU"P'-JTLE....,RLL7--.JMlYillicdr\.lQ"'kilJn"'elltic~filla4'1:>s'"is'-'Q.l1f-'C..ua:lJt.aa""ly'lJtiJ..,cJB:lle:«allc-.itLLiQlJJn"'s ~__~2"'4~7
Table 7.3.1 I A proposed mechanism of ammonia synthesis over iron catalysts~ a
2
3
4
5
6
7
2 X 1O I PN/I,
4 X 10⁹ e -29/(R,T)()N2(),
2 X 10ge- 81 /(R,T)()H()N
1 X 10¹³ e- 36/(R,T) ()NH ()H
4 X 10¹³ e- 39/(R,T)()NH2()H
4 X 10¹² e-39/(R,T)()NH3
7X
N2* + * ( ) 2N*
H* + N* ( ) NH* + *
NH* + H* ( ) NH2* + *
NH2* + H* ( ) NH3* + *
NH3* ( ) NH3 + *
H2 + 2* ( ) 2H*
X 109 e- 155/(RJ)(()N?
X 107 e-23/(R,T)()NH ()*
X 1012()NH, (),
2 X 10¹³()NH, ()*
2 X 10³ P NH , ()*
3 X 10¹³ e-94/(R,T) (()H?
a Rates are in units of molecules per second per site, pressures (P) are in pascals, and activation energies are in kilojoules per mole.Concentrations of surface species are represented by fractional surface coverages as discussed in Chapter 5. Kinetic parametersare adapted from the data of Stolze and Norskov [Po Stolze and J. K. Norskov, Phys. Rev. Lett., 55 (1985) 2502; P. Stolze andJ. K. Norskov, Surf Sci. Lett., 197 (1988) L230; P. Stolze and J. K. Norskov, J. Catal., 110 (1988) 1].
20
'"15
'a088
10'"E'"e'"0-
S
o0.00 0.20 0.40 0.60 0.80 1.00
Dimensionless distance
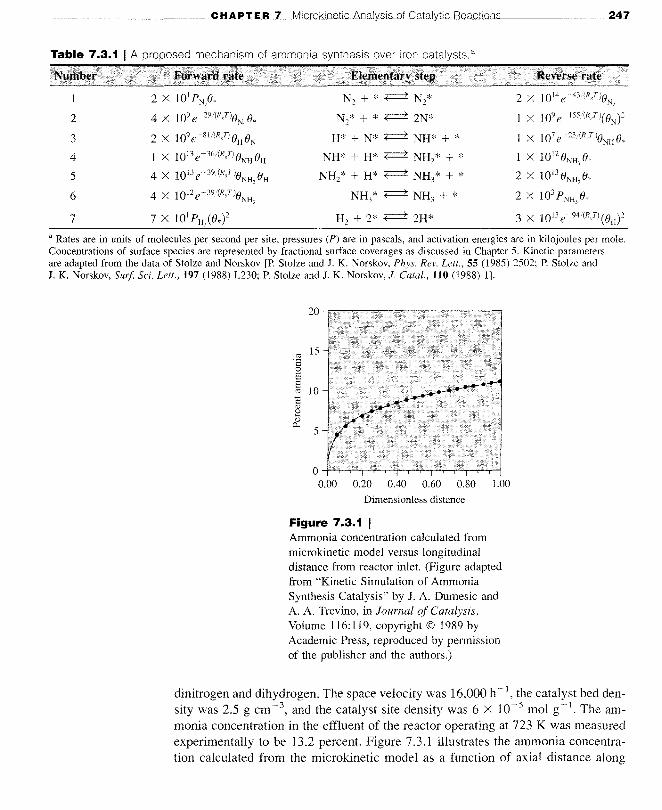
Figure 7.3.1 IAmmonia concentration calculated frommicrokinetic model versus longitudinaldistance from reactor inlet. (Figure adaptedfrom "Kinetic Simulation of AmmoniaSynthesis Catalysis" by J. A. Dumesic andA. A. Trevino, in Journal of Catalysis,Volume I 16: 119, copyright © 1989 byAcademic Press, reproduced by permissionof the publisher and the authors.)
dinitrogen and dihydrogen. The space velocity was 16,000 h-1, the catalyst bed density was 2.5 g cm -3, and the catalyst site density was 6 X 10⁻⁵ mol g-1. The ammonia concentration in the effluent of the reactor operating at 723 K was measuredexperimentally to be 13.2 percent. Figure 7.3,1 illustrates the ammonia concentration calculated from the microkinetic model as a function of axial distance along

248 CHAPTER 7 Microkinetic Analysis of Catalytic Reactions
1.0
0.8(£:::Jt::"c:. 0.6'""0
§'j:;
0.4~~
U.I
0.2
0.00.0 0.2 0.4 0.6 0.8 1.0
Dimensionless distance
Figure 7.3.2 IDeparture from equilibrium for the two slowestelementary steps in ammonia synthesis. Squares are forstep 2 and circles are for step 3. (Figure adapted from"Kinetic Simulation of Ammonia Synthesis Catalysis"by J. A. Dumesic and A. A. Trevino, in Journal ofCatalysis, Volume 116: 119, copyright © 1989 byAcademic Press, reproduced by permission of thepublisher and the authors.)
the reactor. The effluent concentration approached the experimental value of 13.2percent, which illustrates the consistency of the model with observation. The utility of a microkinetic model, however, is that it allows for a detailed understandingof the reaction kinetics. For example, a rate-determining step can be found, if oneexists, by examining the departure of the elementary steps from equilibrium undersimulated reaction conditions. Figure 7.3.2 presents the departure from equilibrium,(forward rate reverse rate)/forward rate, for the slowest steps as the reactionproceeds through the reactor. Step 2, the dissociation of dinitrogen, is clearly therate-determining step in the mechanism throughout the reactor. All of the other stepsin Table 7.3.1 are kinetically insignificant. Thus, the turnover frequency of ammonia synthesis depends critically on the kinetics of dissociative adsorption of dinitrogen (steps 1 and 2), as discussed earlier in Section 5.3. As long as the individualquasi-equilibrated elementary steps can be summed to one overall quasi-equilibratedreaction with a thermodynamically consistent equilibrium constant, small errors inthe individual pre-exponential factors and activation energies are irrelevant. A microkinetic model also allows for the determination of relative coverages of variousintermediates on the catalyst surface. Figure 7.3.3 illustrates the change in fractionalsurface reaction of N* and H* through the reactor. Adsorbed nitrogen is the mostabundant reaction intermediate throughout the iron catalyst bed except at the entrance.

____________..Ccl:HI.JA.u=PJ.T-"E"-'B"-'7'--lYMJjjic..dr'-'OLkiLUnJ;;;9JJ'tic~,Analysisof Catalytic Reactions 249
1.0
0.01.00.80.60.40.20.001 0.002 0.003 0.004 0.005 0.01
1.0
0.0
0.8 0.8
"OJ)
"..."> 0.6 0.60u
"uiJ::>en.,<:: 0.4 0.40
';:l
al.t
0.2 0.2
Dimensionless distance
Figure 7.3.3 IFractional surface coverages of predominant adsorbed species versus dimensionlessdistance from the reactor inlet. (Figure adapted from "Kinetic Simulation of AmmoniaSynthesis Catalysis" by J. A. Dumesic and A. A. Trevino, in Journal of Catalysis,Volume 116:119, copyright © 1989 by Academic Press, reproduced by permission of thepublisher and the authors.)
Since the formation of N* is the rate-determining step, its high coverage duringsteady-state reaction on iron results from the equilibrium of H2 and NH3. Thus, thehigh coverage of H* instead of N* at the entrance to the reactor (Figure 7.3.3) resultsfrom the vanishingly low pressure of ammonia at that point.
Another test of validity is to check the performance of the model against experimental rate data obtained far from equilibrium. The microkinetic model presented in Table 7.3.1 predicts within a factor of 5 the turnover frequency of ammonia synthesis on magnesia-supported iron particles at 678 K and an ammoniaconcentration equal to 20 percent of the equilibrium value. This level of agreementis reasonable considering that the catalyst did not contain promoters and that thesite density may have been overestimated. The model in Table 7.3.1 also predictswithin a factor of 5 the rate of ammonia synthesis over an Fe( Ill) single crystal at20 bar and 748 K at ammonia concentrations less than 1.5 percent of the equilibriumvalue.
It should be emphasized that since the rate of ammonia synthesis on iron depends critically on the dissociative adsorption of dinitrogen (steps I and 2), any

250 CHAPTER 7 Microkine>tic Analysis of Catalytic Reactions
Table 7.3.2 I A proposed mechanism of ammonia synthesis over ruthenium catalysts, a
1
2
3
4
5
6
6 X 1O-Ze-33;(R,JiPN2(8*?
6 X 10¹³ e-86/(R/J8H8N
5 X 10¹³e-60/(R/i8NH8H
3 X 10¹³e-17/(RJ!8NH28H
6 X lOI3 e -84/(R/)8NH
,
6 X (8*f
Nz + 2* ( ) 2N*
H* + N* ( ) NH* + *
NH* + H* ( ) NH2* + *
NHz* + H* ( ) NH3* + *NH3* ( ) NH3 + *
Hz + 2* ( ) 2H*
2 X lOJOe-137/(RJ!(8N?
3 X 10¹⁴e-41/(R/7J8NH8*
2 X 1OI3e-9/(R,7)8NH28*
9 X 10 IZ e-65/(R/7) 8NH, 8*
2 X 103 PNHj 8*
2 X 1013 e-89/(R,7)
a Rate8 are in unit8 of molecules per second per site, pressures (P) are in pascals, and activation energies are in kilojoules permole, Concentrations of surface species are represented by fractional surface coverages as discussed in Chapter 5, Kineticsparameters are adapted from the data of Hinrichsen et aL [0, Hinrichsen, E Rosowski, M, Muhler, and G, Ertl, Chern, Eng, Sci"51 (1996) 1683,]
microkinetic model that properly accounts for those steps and that is thermodynamically consistent with the overall reaction will effectively describe the kineticsof ammonia synthesis. This feature explains the success of the microkinetic modelused to describe an industrial reactor even though the kinetic parameters for dinitrogen adsorption/desorption match those obtained from studies on iron singlecrystals in ultrahigh vacuum.
Ammonia synthesis on supported ruthenium catalysts has also been the subject of microkinetic analysis. Table 7.3.2 presents the kinetic parameters for onemodel of ammonia synthesis catalyzed by cesium-promoted ruthenium particlessupported on MgO [0. Hinrichsen, F. Rosowski, M. Muhler, and G. Ertl, Chern.Eng. Sci., 51 (1996) 1683]. In contrast to the model in Table 7.3.1, the dissociative adsorption of dinitrogen is represented by a single step. Many of the rate constants in Table 7.3.2 were determined from independent steady-state and transientexperiments on the same catalyst. The experiments included temperatureprogrammed adsorption and desorption of dinitrogen, isotopic exchange of labeledand unlabeled dinitrogen, and temperature-programmed reaction of adsorbednitrogen atoms with gaseous dihydrogen. The unknown rate constants were estimated by regression analysis of the experimental data and checked to ensure thatthey were within physically reasonable limits. As in the previous example withthe iron catalyst, the steady-state reactor containing the supported Ru catalystwas modeled as a series of mixing cells in which the steady-state rate equations,the catalyst site balance and the material balances for gaseous species were solvedsimultaneously.
Similar to the results found with iron catalysts, the rate-determining step during ammonia synthesis on ruthenium catalysts is the dissociative adsorption ofdinitrogen. However, the overall reaction rate is strongly inhibited by dihydrogen,indicating that adsorbed hydrogen is the most abundant reaction intermediate thatcovers most of the surface [B. C. McClaine, T. Becue, C. Lock, and R. J. Davis,

CHAPTER 7 Microkinetic Analysis of Gataly.uticI.-LBu:e"'a.L<clUtio..l1nEsL.- -"2""5u.1
J. Mol. Catal. A: Chern., 163 (2000) 105]. In the example using iron catalysts,inhibition by dihydrogen was observed only at extremely low pressures of ammonia.The reaction on ruthenium is quite different, since the equilibrium involving dihydrogen and ammonia on the catalyst surface continues to favor hydrogen atoms instead of nitrogen atoms, even at reasonable pressures of ammonia. The microkineticmodel in Table 7.3.2 accounts for the ammonia effluent concentration from a reactoroperating at both atmospheric pressure and elevated pressure, over a wide temperature range and at exit conditions near and far from equilibrium. Figure 7.3.4 compares
4000
S 30000.5c:
.S~b 2000c:0)uc:0u
£' 1000Z
0
500 550 600 650
8
&:'0 6~c:0.~
b 4c:0)uc:0u
£' 2Z
0
500 550 600 650 700 750 800
Temperature (K)
Figure 7.3.4 IComparison of calculated and measured ammonia concentrations at the effluent of asteady-steady ammonia synthesis reactor containing ruthenium particles supported onmagnesia and promoted by cesium. [Adapted from O. Hinrichsen. F. Rosowski. M. Muhler.and G. Ertl. "The Microkinetics of Ammonia Synthesis Catalyzed by Cesium-PromotedSupported Ruthenium." Chern. Eng. Sci., 51 (1996) 1683. copyright 1996. with permissionfrom Elsevier Science.]

252 CHAPTER 7 Microkinetic Analysis of Catalytic Reactions
the results from the model to those measured experimentally. The decrease in ammonia effluent concentration at the highest temperatures indicates that equilibriumwas reached in the reactor. The essential features of the reaction (i.e., proper temperature dependence of the rate appropriate level of ammonia produced near and farfrom equilibrium, and inhibition of the rate by dihydrogen) were well reproducedby the kinetic model.
7.4 I Ethylene Hydrogenationon Transition Metals
Hydrogenation is an important industrial reaction that often requires the presenceof a heterogeneous catalyst to achieve commercial yields. Ethylene, C2H4 , is thesmallest olefin that can be used to investigate the addition of hydrogen atoms to acarbon-carbon double bond. Even though many experiments and theoretical studieshave been carried out on this simple system, the reaction is still not completely understood. Microkinetic analysis provides insights into the relevant elementary stepsin the catalytic cycle.
A simple mechanism that has been proposed for ethylene hydrogenation onmetal catalysts is that of Horiuti and Polanyi [1. Horiuti and M. Polanyi, 1. Chem.Soc., Faraday Trans., 30 (1934) 1164]:
Step I
Step 2
Step 3
Step 4
Overall
H2 + 2* ( ) 2H*
C2H4 + 2* ( ) *C2H4*
*C2H4* + H* ( ) *C2Hs + 2*
*C2Hs* + H* ( ) *C2H6 + 2*
In this sequence, ethylene and dihydrogen compete for active sites on the transitionmetal surface. While this basic mechanism has been used to describe olefin hydrogenation kinetics for many years, it does not adequately account for the observedreaction characteristics over a wide range of conditions. For example, ethylene hydrogenation on a platinum catalyst at temperatures less than 300 K is zero-orderwith respect to ethylene and half-order with respect to dihydrogen. The zero-orderdependence on C2H4 indicates that the surface is nearly covered with carbon containing species, whereas the half-order dependence on H2 suggests that step 1, dissociative adsorption of dihydrogen, is an equilibrated process. If the adsorption stepswere truly competitive, then increasing the ethylene pressure should decrease thevacant site concentration and thus the hydrogen surface coverage. In other words,the rate of hydrogenation should decrease with increasing ethylene pressure, whichis not observed at low temperature.
One way to explain the observed reaction orders is to also allow for a noncompetitive dihydrogen adsorption step in the sequence. This added complexitymakes sense because more surface sites are available to dihydrogen than ethylene because of the very small size of a H2 molecule. The catalytic cycle for ethylene
CHAPTER 7 Microkinetic Analysis of Catalytic Reactions
hydrogenation with both competitive and noncompetitive adsorption is now:
283
Step 1
Step la
Step 2
Step 3
Step 3a
Step 4
Step 4a
Overall
Hz + 2* ( ) 2H*
Hz + 2*' ( ) 2H*'
CZH4 + 2* ( ) *CZH4*
*CZH4* + H* ( ) *CzHs + 2*
*CZH4* + H*' ( ) *CzHs + * + *'
*CzHs + H* ( ) CZH6 + 2*
*CzHs + H*' ( ) CZH6 + * + *'
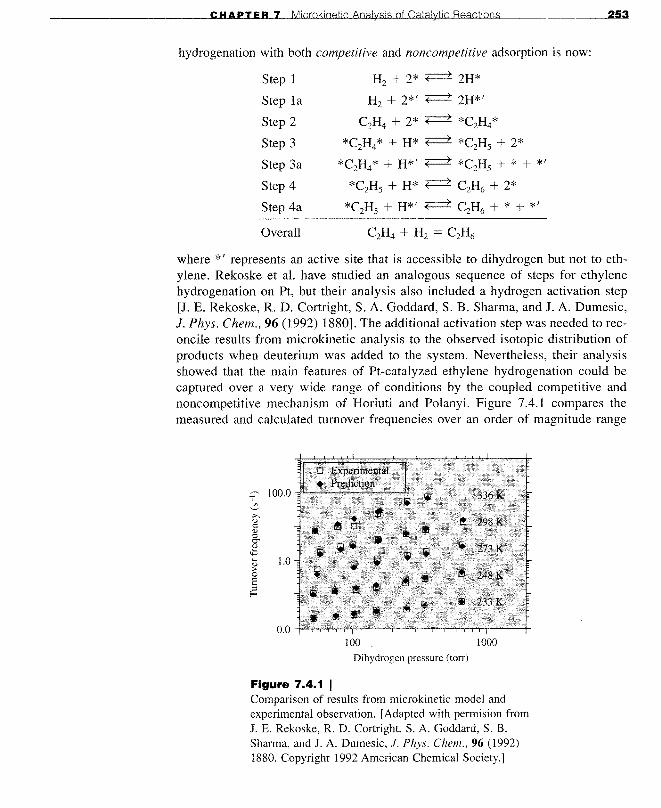
where *' represents an active site that is accessible to dihydrogen but not to ethylene. Rekoske et al. have studied an analogous sequence of steps for ethylenehydrogenation on Pt, but their analysis also included a hydrogen activation step[J. E. Rekoske, R. D. Cortright, S. A. Goddard, S. B. Sharma, and J. A. Dumesic,J. Phys. Chern., 96 (1992) 1880]. The additional activation step was needed to reconcile results from microkinetic analysis to the observed isotopic distribution ofproducts when deuterium was added to the system. Nevertheless, their analysisshowed that the main features of Pt-catalyzed ethylene hydrogenation could becaptured over a very wide range of conditions by the coupled competitive andnoncompetitive mechanism of Horiuti and Polanyi. Figure 7.4.1 compares themeasured and calculated turnover frequencies over an order of magnitude range
~ 100.0.,~>-,u
'"<I)::l0-<I)
¢:
~ 1.0>0
'"'-~
0.0100
Dihydrogen pressure (torr)
1000
Figure 7.4.1 IComparison of results from microkinetic model andexperimental observation. [Adapted with permision fromJ. E. Rekoske, R. D. Cortright, S. A. Goddard, S. B.Sharma, and J. A. Dumesic, J. Phys. Chern., 96 (1992)1880. Copyright 1992 American Chemical Society.]

254 CHAPTER 7 Microkinetic Analysis of Catalytic Reactions
of dihydrogen pressure and a 100 K span in temperature. The observed order ofreaction with respect to dihydrogen increases from 0.47 at 223 K to 1.10 at 336 K.Clearly, the kinetic model reproduces the observed rates at all of the conditionstested. The model also predicted the order of reaction with respect to ethylene (notshown) quite well. This microkinetic analysis suggests that ethylene hydrogenatesmostly through the noncompetitive route at low temperatures whereas the competitive route dominates at high temperatures.
The rapid increase in computing power and the advent of new quantum chemical methods over the last decade allow kinetic parameters for surface reactions tobe estimated from ab initio quantum chemical calculations and kinetic simulationschemes. Indeed, the adsorption enthalpies of gas-phase species can be calculated, theactivation barriers to form transition states from surface bound species can be predicted, and the evolution of surface species with time can be simulated. Figure 7.4.2shows, for example, the transition state for the hydrogenation of adsorbed ethylene(step 3) on a model palladium surface consisting of 7 Pd atoms arranged in a plane.The activation energy associated with ethyl formation on a Pd(lll) metal surfacewas calculated from first principles quantum mechanics to be about 72 kJ mol-I[M. Neurock and R. A. van Santen, J. Phys. Chern. B, 104 (2000) 11127]. The configuration of the adsorbed ethyl species, the product of step 3, is illustrated for twodifferent Pd surfaces in Figure 7.4.3. The energies for chemisorption of this reactiveintermediate on a Pd l9 cluster and a semi-infinite Pd(lll) slab are -130 and -140 kJmol-I, respectively, and are essentially the same within the error of the calculation.Results involving adsorbed ethylene, adsorbed hydrogen and adsorbed ethyl indicate
Figure 7.4.2 IThe isolated transition state structure for the fonnation ofethyl from ethylene and hydrogen on a model Pd7 cluster.The vectors correspond to the motion along the reactioncoordinate. [Adapted with pennission from M. Neurockand R. A. van Santen, J. Phys. Chern. B, 104 (2000)11127. Copyright 2000 American Chemical Society.]

CHAPTER 7 Microkinetic Analysis of Catalytic Reac'"'t.n.ioLLnws~ ....2"",5"",5
LiE =-130 kllmol
(a)
LiE=-140kllmol
(b)
Figure 7.4.3 IStructures and energies for the chemisorption of ethyl on (a) a Pd 19 cluster model and(b) a model Pd(lll) surface. [Reproduced with permission from M. Neurock and R. A. vanSanten, J. Phys. Chem. B, 104 (2000) 11127. Copyright 1992 American Chemical Society.]
256 CHAPTER 7 Microkinetic Analysis of Catalytic Reactions
that the overall heat of reaction for step 3 is about 3 kJ mol- J endothermic on a Pdsurface. In principle, these types of calculations can be performed on all of thespecies in the Horiuti-Polanyi mechanism, and the results can be used in a subsequent kinetic simulation to ultimately give a reaction rate. Rates obtained in thisfashion are truly from first principles since regression of experimental data is notrequired to obtain kinetic parameters.
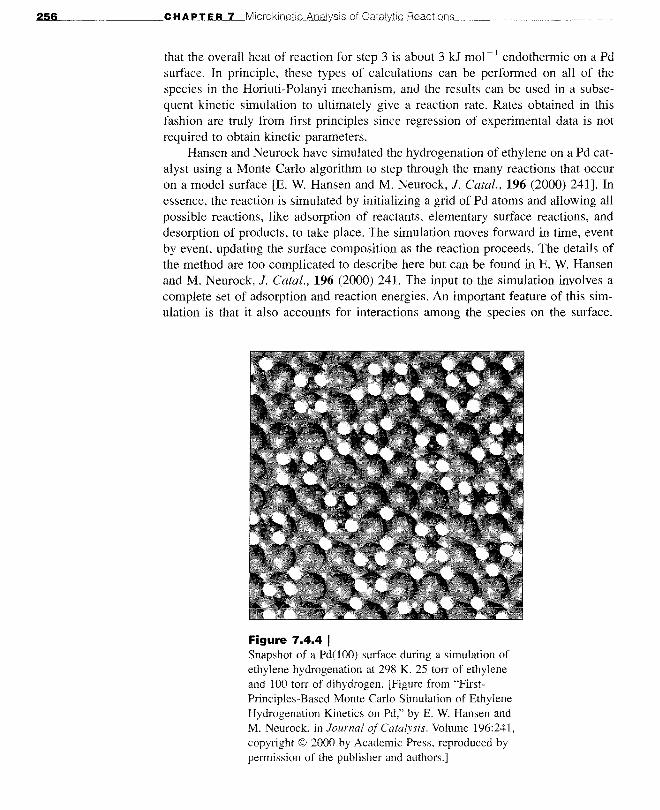
Hansen and Neurock have simulated the hydrogenation of ethylene on a Pd catalyst using a Monte Carlo algorithm to step through the many reactions that occuron a model surface [E. W. Hansen and M. Neurock, 1. Catal., 196 (2000) 241]. Inessence, the reaction is simulated by initializing a grid of Pd atoms and allowing allpossible reactions, like adsorption of reactants, elementary surface reactions, anddesorption of products, to take place. The simulation moves forward in time, eventby event, updating the surface composition as the reaction proceeds. The details ofthe method are too complicated to describe here but can be found in E. W. Hansenand M. Neurock, 1. Catal., 196 (2000) 241. The input to the simulation involves acomplete set of adsorption and reaction energies. An important feature of this simulation is that it also accounts for interactions among the species on the surface.
Figure 7.4.4 ISnapshot of a Pd( 100) surface during a simulation ofethylene hydrogenation at 298 K, 25 torr of ethyleneand 100 torr of dihydrogen. [Figure from "FirstPrinciples-Based Monte Carlo Simulation of EthyleneHydrogenation Kinetics on Pd," by E. W. Hansen andM. Neurock, in Journal of Catalysis. Volume 196:241,copyright © 2000 by Academic Press, reproduced bypermission of the publisher and authors.)

___________-'C>LI:IHLliAuP~T.......EnRL7L~~l'f.lyliJtic..cDRJ;;1eC.'acvJtlJ..iollJn"'"s_~ ~2...5'.L7
Although many kinetic models assume that the catalyst is an ideal Langmuir surface (all sites have identical thermodynamic properties and there are no interactionsamong surface species), modern surface science has proven that ideality is often notthe case.
Results from the simulation reproduced the experimentally observed kinetics(activation energy, turnover frequency, and orders of reaction) for ethylene hydrogenation on a Pd catalyst. A snapshot of the Pd surface during a simulation of ethylene hydrogenation is given in Figure 7.4.4. At this point in the simulation, highlymobile hydrogen atoms moved rapidly around the surface and reacted with fairlystationary hydrocarbons. In this model, no distinction was made between the competitive and noncompetitive adsorption steps in the mechanism. The results suggestthat lateral interactions among species can explain some of the experimental observations not easily accounted for in the Horiuti-Polanyi mechanism.
7.5 I Concluding RemarksThis chapter illustrated the concepts involved in microkinetic analysis of catalyticreactions. The first example involving asymmetric hydrogenation ofprochiral olefinswith a chiral homogeneous catalyst illustrated how precise rate measurements ofcritical elementary steps in a catalytic cycle can yield a kinetic model that describesthe overall performance of a reaction in terms of enantioselectivity and response toreaction conditions. The second example regarding ammonia synthesis showed howkinetic parameters of elementary steps measured on single crystals under ultrahighvacuum conditions can be incorporated into a kinetic model that applies to reactorsoperating under industrial conditions of high pressure. The last example involvingethylene hydrogenation revealed how quantum chemical calculations provide estimates of the energies associated with elementary steps on catalytic surfaces that canbe subsequently used in reaction simulations. Finally, microkinetic analysis is clearlymoving toward the routine use of quantum chemical calculations as inputs to kinetic models, with the ultimate goal of describing industrial chemical reactors.
In Section 7.2, the reaction paths of the Rh-catalyzed asymmetric hydrogenationof MAC were described in detail. The ratio of the S product to the R product,[S]/[R], was expressed in the limit of low [Equation (7.2.16)] and high[Equation (7.2.22)] pressure (or concentration) of dihydrogen. Use the rateconstants in Table 7.2.1 to plot [S]/[R] as a function of H2 concentration. Atwhat concentrations are Equation (7.2.16) and Equation (7.2.22) valid?
Landis and Halpern studied the temperature dependence of the various rateconstants in Table 7.2.1 [CO R. Landis and J. Halpern, 1. Am. Chem. Soc., 109(1987) 1746]. The values of the individual activation energies and preexponential factors are:
Exercises for Chapter 71.
2.

258 CHAPTER 7 Microkinetic Analysis of Catalytic Reactions
Kinetic parameters for the asymmetric hydrogenation of MAC catalyzed byRh(R,R-DIPAMP).
k l (L mmo!-I 5- 1)k- I (5- 1)
k2 (L mmo!-I 5- 1)
4.913.310.7
2.32 X 10⁴
8.53 X 10⁸
7.04 X 10⁴
6.913.07.5
1.21 X 10⁶
9.94 X 10⁹
1.84 X 10⁵
a Activation energy, kcal mol-I.b Pre-exponential factor in the units of the rate constant.
Source: C. R. Landis and J. Halpern, 1. Am. Chern. Soc., 109 (1987) 1746.
Detennine the ratio of the S product to the R product, [S]/[R], as a functionof temperature, over the range of 0 to 37°C. Keep the H2 concentration at aconstant value between the limits of high and low pressure as discussed inExercise 1.
3. A microkinetic analysis of ammonia synthesis over transition metals ispresented in Section 7.3. Use the results of that analysis to explain howadsorbed nitrogen atoms (N*) can be the most abundant reaction intennediateon iron catalysts even though dissociative chemisorption of N2 is consideredthe rate-detennining step.
4. Describe the main differences in the kinetics of ammonia synthesis over ironcatalysts compared to ruthenium catalysts.
5. The Horiuti-Polanyi mechanism for olefin hydrogenation as discussed inSection 7.4 involves 4 steps:
Step 1
Step 2
Step 3
Step 4
Overall
H2 + 2* ( ) 2H*
C2H4 + 2* ( ) *C2H4*
*C2H4* + H* ( ) *C2Hs + 2*
*C2Hs + H* ( ) C2H6 + 2*
Derive a rate expression for the hydrogenation of ethylene on Pt assumingsteps 1, 2, and 3 are quasi-equilibrated, step 4 is virtually irreversible, and*C2Hs is the most abundant reaction intennediate covering almost the entiresurface ([*]0 - [*C 2Hs]). Discuss why the rate expression cannot properlyaccount for the experimentally observed half order dependence in H2 and zeroorder dependence in ethylene. Could the observed reaction orders be explainedif adsorbed ethylene (*C2H4*) were the most abundant reaction intennediate?Explain your answer.
6. Read the paper entitled "Microkinetics Modeling of the Hydroisomerization ofn-Hexane," by A. van de Runstraat, J. van Grondelle, and R. A. van Santen,Ind. Eng. Chem. Res., 36 (1997) 3116. The isomerization of n-hexane is a classic

CHAPTER 7 Microkinetic Analysis of Catalytic Reactions 259
example of a reaction involving a bifunctional catalyst, where a transition metalcomponent facilitates hydrogenation/dehydrogenation and an acidic componentcatalyzes structural rearrangement. Section 5.3 illustrates the importantreactions involved in hydrocarbon isomerization over bifunctional catalysts.Summarize the key findings of the microkinetic analysis by van de Runstraatet al.