microfinance india: state of the sector report 2010 book value cab college of agricultural banking...
TRANSCRIPT
Microfinance India


Microfinance IndiaState of the Sector Report 2010
N. Srinivasan
Copyright ©ACCESS Development Services, 2010
All rights reserved. No part of this book may be reproduced or utilized in any form or by any means, electronic or mechanical, including photocopying, recording or by any information storage or retrieval system, without permission in writing from the publisher.
First published in 2010 by
Sage Publications India Pvt Ltd aCCeSS Development Services B1/I-1 Mohan Cooperative Industrial Area 28, Houz Khas Village Mathura Road, New Delhi 110 044, India New Delhi 110 016www.sagepub.in www.accessdev.org
Sage Publications Inc2455 Teller RoadThousand Oaks, California 91320, USA
Sage Publications Ltd1 Oliver’s Yard55 City RoadLondon EC1Y 1SP, United Kingdom
Sage Publications asia-Pacific Pte Ltd33 Pekin Street#02-01 Far East SquareSingapore 048763
Published by Vivek Mehra for SAGE Publications India Pvt Ltd, Phototypeset in 10/12 pt Minion Pro by Diligent Typesetter, Delhi and printed at Artxel, New Delhi.
Library of Congress Cataloging-in-Publication Data available
ISBN: 978-81-321-0588-6 (PB)
The Sage Team: Rekha Natarajan, Vikas Jain, Rajib Chatterjee and Umesh Kashyap
Photo credit: Nagender Chikkara/Rajender Shaw/Ranjan Rahi/Oxfam India.

Contents
List of Tables, Figures, Boxes, Abbreviations and Annexes viiForeword xiiiPreface xvii
1. Overview—the juggernaut decelerates 1
2. Self-help group bank linkage programme—in search of leadership and direction 13
3. Microfinance institutions—moderation dictated by market 31
4. Investment climate—getting better 53
5. Microfinance in the global context 63
6. Savings, investments and pension 71
7. Policy environment and regulation 83
8. Technology in microfinance 89
9. Social performance, transparency and responsible finance 95
10. Financial inclusion—reasons for hope 109
11. An agenda for the future 127
Appendix 131Bibliography 137About the Author 141

List of Tables, Figures, Boxes, Abbreviations and Annexes
Tables 1.1. Client outreach—Borrowers with outstanding accounts (millions) 2 1.2. Comparison of average loan size 3 1.3. Estimate of microfinance credit clients 3 1.4. Concentration of financing in some states 4 2.1. Growth trends in SBLP 13 2.2. Savings performance of SHGs 14 2.3. Regional shares in linkage 15 2.4. Top states in SHG linkage in 2009–10 15 2.5. Ranking of select states based on MPI and MPPI 16 2.6. Bank loans outstanding against SHGs 17 2.7. Comparison of net wealth of households 2004–09 21 2.8. MFDEF sanctions (` lakh) 22 3.1. Indian MFIs in the MIX top 100 list 31 3.2. The top 10 MFIs by outreach (` billion) 32 3.3. Comparative performance of top five MFIs 32 3.4. Growth in client outreach—a frequency distribution 32 3.5. Form-wise distribution of MFIs—loan portfolio 33 3.6. Size of institutions and yield on portfolio 35 3.7. Age of institutions and yield on portfolio 35 3.8. Age of institutions and operational cost 35 3.9. Financial ratios of select MFIs, 2009 35 3.10. Districts with the highest and lowest loan averages in Karnataka 37 3.11. Client outreach is only 65 per cent of number of accounts 38 3.12. Usage of loan money by lender type 39 4.1. Equity deals in Indian MFIs 53 4.2. Listing of investors based on domicile 54 4.3. Equity deals in 2009–10 by class of investors 54 4.4. Major NCD deals 55 4.5. Major securitization deals in 2009–10 55 6.1. Reasons for not opening a bank account 72 6.2. Different institutional and semi-formal savings mechanisms 72 9.1. SPM measurement tools 100 9.2. Mission orientation and alignment of financial performance 103 9.3. Comparison of scores of social content of mission ranks and financially aligned
performance ranks 104

viii MICROFINANCE INDIA
10.1. What remains to be included? 110 10.2. Financial inclusion funds—accumulating or investing? 114
Appendix Tables A.1. Fact sheet on coverage and growth of SHGs and MFIs, March 2010 131 A.2. Bank loans to MFIs 132 A.3. UN Solutions Exchange—State of the Sector Report Query—Summary of Responses 134 A.4. List of SOS specific activities 136
Figures 1.1. New client acquisition under SHG and MFI models—a comparison 2 1.2. Growth in outstanding loans—SHG and MFI models comparison 3 1.3. Comparison of outstanding loans—SHG and MFI models 3 2.1. Shares of different types of banks in number of savings SHGs 14 2.2. Shares of different types of banks in amounts saved by SHGs 14 2.3. Regional comparisons of MPI and MPPI 16 2.4. Shares of different types of banks in SHG loan outstanding by number of groups 17 2.5. Shares of different types of banks in SHG loan outstanding by amount of loans 17 3.1. Client outreach by size of MFIs 33 3.2. Share of loan volumes—size wise 33 3.3. Market share of different forms of institutions—loan volumes 33 3.4. ROA range wise distribution of MFIs 34 3.5. ROE range wise distribution of MFIs 34 3.6. Region wise shares—client outreach 36 3.7. Region wise shares—loan portfolio 36 3.8. High competition leads to high default? 38 5.1. Client outreach across regions 63 5.2. Loan portfolio across regions (US$) 63 5.3. Earnings performance (ROA) of different regions 64 5.4. Comparison of Return on Equity 64 5.5. Comparison of PAR across regions (%) 64 5.6. Average loan size and cost per borrower—comparison across regions (US$) 64 5.7. Operating efficiency (OCR%) 65 5.8. Country comparison of client outreach 65 5.9. Country comparison of loan portfolio 65 8.1. Process-wise use of software solutions 92 8.2. Process-wise use of software solutions 92 8.3. Process-wise use of software solutions 92 8.4. Process-wise use of software solutions 92 8.5. Branch-office infrastructure 93 8.6. MIS solutions 93 8.7. Satisfaction ratings with MIS 93 9.1. Response of institutions to changes in cost 97 9.2. Reduction in yield more than reduction in OCR 97 9.3. Yield increased when OCR declined (1) 97 9.4. Yield increased when OCR declined (2) 97 9.5. Increase in yield lower than increase in OCR 97 9.6. Increase in yield higher than increase in OCR 97 9.7. Reduction in yield/no change—less than reduction in OCR 97

BoxesChapter 2
MPI and MPPI 16Findings of A2F study in Andhra Pradesh relating to SHGs 19Post-office and SHGs—a NABARD linkage 23Indira Kranti Patham 24Swayanshree—an autonomous federation 25
Chapter 3Competition and lending levels 38Does ascertainment of loan purpose and monitoring help? 39Innovative products: Sangam stores model of SKS 40Customer friendly repayment structure 41Kerala Moneylending Act implications 42Anjali Microfinance 43
Chapter 4Press note 2 of DIPP 54I. NABARD Grant Assistance for MFI Ratings 57II Rating/Grading support to MFIs seeking Capital Support and/or RFA under MFDEF from NABARD 57
Chapter 5Bosnia-Herzegovina—a case in microfinance 67
Chapter 6South Indian Federation of Fishermen Societies (SIFFS) Saving Schemes 74What is the World Gold Council doing in microfinance! 75Assam—Semi-formal sector going informal 75
Chapter 7Regulation in India—A global comparison 84
Chapter 8Do it yourself networking technology! 90Microfinance computing in the cloud 91
Chapter 9Grameen Foundation PPI work in India 101Information for analysing Social performance—SPTF indicators 101Not by loans alone—by jobs too 105
Chapter 10Managing BC network is a specialized job 114Who will be willing to work as BC staff? 116UIDAI’s micro-payment solution 117The mammoth moves nimble with technology 118HDFC Bank and inclusion 118BC/BF initiative of IDF Sujeevana—beyond financial inclusion 119
AbbreviationsABCO Average Business per Credit OfficerAP Andhra PradeshAPMACS Andhra Pradesh Mutually Aided Cooperative Societies
List of Tables, Figures, Boxes, Abbreviations and Annexes ix
x MICROFINANCE INDIA
APMAS Andhra Pradesh Mahila Abhivruddhi SocietyAPR Annualized Percentage RateBC Business CorrespondentBDS Business Development ServiceBF Business FacilitatorBIRD Bankers Institute of Rural DevelopmentBPL Below Poverty LineBV Book ValueCAB College of Agricultural BankingCASHE Credit and Savings for Household EnterpriseCASHPOR Credit and Savings for the Hardcore PoorCBS Core Banking SolutionCDF Cooperative Development FoundationCGAP Consultative Group to Assist the PoorCIRM Centre for Insurance and Risk ManagementCMF Centre for MicrofinanceCMR Centre for Microfinance ResearchCMRC Community Managed Resource CentresCRAR Capital to Risk (weighted) Assets RatioDCC District Consultative CommitteeDCCB District Central Cooperative BankDFID Department for International DevelopmentDIPP Department of Industrial Policy and PromotionDRDA District Rural Development AuthorityDWCD Department of Women and Child DevelopmentFIF Financial Inclusion FundFITF Financial Inclusion Technology FundFINO Financial Information Network & Operations LtdFLDG First Loss Deficiency GuaranteeFWWB Friends of Women’s World BankingGCC General Purpose Credit CardsGTZ Deutsche Gesellschaft für Technische ZusammenarbeitHDFC Housing Development Finance CorporationHDI Human Development IndexHR Human ResourcesHUDCO Housing Urban Development CorporationICT Information and Communication TechnologyIFAD International Fund for Agricultural DevelopmentIFC International Finance CorporationIFMR Institute for Financial Management and ResearchIGS Indian Grameen ServicesIKP Indira Kranti PathamILFS Infrastructure Leasing and Financial Services LimitedILO International Labour OrganizationIPO Initial Public OfferingIRDA Insurance Regulatory and Development AuthorityJLG Joint Liability GroupKBSLAB Krishna Bhima Samruddhi Local Area BankKDFS Kalanjiam Development and Financial ServicesKFW Kreditanstalt für WiederaufbauKYC Know Your CustomerLAB Local Area BankLIC Life Insurance Corporation of IndiaMACS Mutually Aided Cooperative Society
MBT Mutual Benefit TrustM-CRIL Micro-credit Ratings International LtdMFDC Microfinance Development CouncilMFDEF Micro Finance Development and Equity FundMFI Microfinance InstitutionMFIN Microfinance Institutions NetworkMFO Microfinance OrganizationMFT Microfinance TransparencyMIA Micro-insurance AcademyMIFOS Microfinance Open SourceMIS Management Information SystemMIX Microfinance Information ExchangeMSDF Michael & Susan Dell FoundationNABARD National Bank for Agriculture and Rural DevelopmentNABFINS NABARD Financial ServicesNBFC Non-banking Financial CompanyNBFC ND-SI Non-banking Financial Company—Non-deposit taking-Systemically ImportantNCAER National Council for Applied Economic ResearchNE NortheastNFC Near Field CommunicationNGO Non-governmental OrganizationNHB National Housing BankNOF Net Owned FundNPA Non-performing AssetNPS New Pension SchemeNREGA National Rural Employment Guarantee ActNREGS National Rural Employment Guarantee SchemeNSSO National Sample Survey OrganizationOER Operating Expense RatioOSS Operating Self-sufficiencyPACS Primary Agricultural Credit SocietiesPAR Portfolio at RiskPDA Personal Digital AssistantPE Private EquityPE Ratio Price to Earning RatioPHC Public Health CentrePLF Panchayat Level FederationPLR Prime Lending RatePOS Point of SalePOT Point of TransactionPPP Purchasing Power ParityPRADAN Professional Assistance for Development ActionPSS Payment and Settlement Systems ActRBI Reserve Bank of IndiaRFID Radio Frequency Identification DeviceRGVN Rashtriya Grameen Vikas NidhiRMK Rashtriya Mahila KoshROGLP Return on Gross Loan PortfolioRRB Regional Rural BankSBLP SHG Bank Linkage ProgrammeSC Scheduled CasteSCB State Cooperative BankSEEP Small Enterprise Education and PromotionSERP Society for Elimination of Rural Poverty
List of Tables, Figures, Boxes, Abbreviations and Annexes xi
xii MICROFINANCE INDIA
SEWA Self-employed Women’s AssociationSGSY Swarna Jayanti Gram Swarozgar YojanaSHG Self-help GroupSHPA Self-help Promotion AgencySHPI Self-help Promoting InstitutionSIDBI Small Industries Development Bank of IndiaSIM Subscriber Identity ModuleSKDRDP Shri Kshetra Dharmasthala Rural Development ProjectSNFL Sarvodaya Nano Finance LimitedSOC Sector’s Own controlSPM Social Performance ManagementSPTF Social Performance Task ForceST Scheduled TribeTNCDW Tamil Nadu Corporation for the Development of WomenUCB Urban Cooperative BankUNDP United Nations Development ProgrammeUSP Unique Selling PropositionVO Village Organization
Annexes 1.1. CGAP’s view on microfinance and India—an interview with Stephen Rasmussen 9 2.1. Credit to savings ratio across states 27 2.2. Microfinance Penetration Index 28 (MPI) and Microfinance Poverty Penetration Index (MPPI) 2.3. SHG Federations in India 2010 29 3.1. A quantitative analysis of the Karnataka mass defaults 44 3.2. State-wise performance of MFIs 47 3.3. Housing microfinance—challenges and opportunities 48 4.1. Banker’s round table 58 4.2. Equity deals during the year 2009–10 60 6.1. Savings performance of SHGs, March 2010 78 6.2. Findings of Microsave on No-Frills-Accounts 79 10.1. RBI instructions on Business Correspondents 121 10.2. Projects sanctioned under FIF during 2009–10 124 10.3. Projects sanctioned under FITF during 2009–10 125 10.4. Recommendations of the Expert Committee on harnessing the India Post Network 126

Foreword
After coping with the uncertainties of the global economic crisis, the microfinance sector, in the last one year, started to settle down again. The sector this year added about 10 million new clients in contrast to the 15 million clients added during the previous year. Against ̀ 360 billion, the outstanding microfinance loans stood at about ` 450 billion this year, an increase of ` 90 billion. The microfinance institutions (MFI) chan-nel was seen to be fast catching up with self-help group bank linkage programme (SBLP), with the latter growing at only about 8 per cent compared to the MFI channel which grew at 18 per cent.
The growth of the sector, during the year, witnessed several crests and troughs—good news interspersed with bad news. A big story that rocked the sector was Professor Sriram’s paper on ‘Commercialization of Microfinance in India’, which highlighted issues of governance standards, ethics and transparency among large MFIs. This widely circulated paper, which was also published in the well-read Economic and Political Weekly, badly damaged the sector’s credibility. Ironically, it came out at a time when SKS (among the four institutions that were discussed in the paper) was preparing for the sector’s first Initial Public Offer (IPO). Oversubscribed by over 13 times, the IPO was a huge hit, but generated significant debate: Whether IPOs are the way to go for the sector? Who benefits from the IPO? Should the wealth created be reploughed or repatriated? And questions regarding high and unsustainable valuations, commercialization of the sector, and so on. An important worry for the sector has been the growing unease of the Reserve Bank of India (RBI), particularly on the issue of governance and high interest rates. Responding to an unveiled threat by the regulator, a few MFIs dropped their interest rates overnight by up to 5 per cent. Does this mean that MFIs have high operating margins? RBI, however has set up a committee to recommend whether bulk loans to Non-banking Financial Company (NBFC) MFIs should be included as priority sector lending. Mean-while, to foster interest rate transparency, MFT set up shop in India (and ACCESS feels privileged to house this initiative). On the positive side, some serious efforts were seen to be made to address the issues of client protection as a response to the Kolar crisis of last year, with Mircofinance Institutions Network (MFIN) instituting a Code of Conduct. This time around, hopefully, it will be more than a nice poster on the walls of MFI offices. The year also saw growing awareness on the need for—and significance of—social protec-tion. Many MFIs have begun to report on Social Performance Management (SPM) to the Microfinance Information Exchange (MIX). The regional skew has shown signs of improvement with more resources flowing to the underserved regions, besides a large number of the bigger MFIs expanding operations in these regions. Greater resolve was demonstrated by RBI to push the agenda of financial inclusion through the banking sector. All banks submitted their plans to RBI, which now will be monitored more effectively. The business correspondent (BC) guidelines have been further modified incrementally. Several interlocked issues kept the sector in the news throughout the year. All these issues have been captured in great detail in the 2010 ACCESS State of the Sector Report. The fact that no single organization covers all these diverse and scattered but important issues in its report perhaps highlights the value of the Report as a single point reference document.
This is the fifth year of the ACCESS State of the Sector Report, and the third consecutive one with Pro-fessor N. Srinivasan as its author. Each year, the Report increasingly establishes itself as the single most
xiv MICROFINANCE INDIA
important chronicle of the sector. Each year, the Report responds to the sector’s needs, providing rich insights that are both topical and critical.
At ACCESS, it is a moment of great celebration when Professor Srinivasan hands in the manuscript of the ACCESS State of the Sector Report to the publisher, SAGE Publications; somehow, always before the deadline. It is a tedious, tireless and tough job. There are perennial challenges in synthesizing the Report, such as data availability, generating feedback, extensive travel across the country, first-hand accounts of innovation and operations, interviews and conversations, and much more. It requires the genius, maturity, credibility, clout, and even guile of someone like Professor Srinivasan to bring together the Report. It takes many months of ceaseless effort to compile this high quality document. At ACCESS, we feel very fortunate that Professor Srinivasan remains committed to the State of the Sector Report, despite a spate of several other very important obligations. Thank you Professor Srinivasan.
I feel proud that the Report has increasingly become an important chronicle of all the action within the sector and is respected for its accuracy and objectivity. At ACCESS, we feel this to be our most valuable contribution to the microfinance sector. The Report enhances our position as a knowledge provider and source of critical analysis for the benefit of the sector. Throughout the year, we receive requests for copies of the Report from various quarters including, among others, policymakers, promoters, donors, researchers and students. And it makes my day when I see a copy of the Report on the desk of the NABARD Chairman, or in the Prime Minister’s Office, or when I see it referred to on television programmes on the sector. The Report also helps reinforce and enhance the value and significance of other flagship initiative of ACCESS viz., the annual global event, the Microfinance India Summit. It informs and influences discussions and de-bates across the many sessions organized during the Summit. And the Summit delegates greatly appreciate their complimentary State of the Sector Report as a part of the delegate kits. As a convention, the Report is annually released in the inaugural session of the Microfinance India Summit.
While I can’t thank Professor Srinivasan enough for his effort and commitment, there are several other individuals and institutions who deserve commendation for their excellent support to the Report. Major support has come from Centre for Microfinance (CMF), Chennai and personally from its Executive Direc-tor, Justin Oliver. Justin has been sharing all of CMF resources, studies and research with Professor Srini-vasan to enhance the available content. I’d like to place my special thanks to RBI’s College of Agricultural Banking (CAB), who help organize policy retreats for ACCESS and specific banker roundtables for the Report. I profusely thank Kamala Rajan, Principal, CAB, for her warm hospitality. In one of the meets, we had a wonderful chance for an hour long free-wheeling conversation with Deputy Governor Dr Chakra-vorty on a variety of issues that concern the regulator. I thank NABARD for sharing its provisional data, so critical for the Report. Shri U.C. Sarangi, Chairman, NABARD, has always found time to provide NABARD perspectives on the sector, and I particularly would like to thank Subrato Gupta at MCID, who has been very supportive of the effort. Similarly, I thank Mr N.K. Maini, Executive Director, SIDBI, who is always forthcoming with his views and worries relating to the sector. I would like to thank Navin at UNDP Solu-tions Exchange for running the annual query on the Report to solicit feedback from the sector as well as in offering its forums for discussions on the Report. There are so many that Professor Srinivasan meets and gets support from that it is best that the full acknowledgement of their contribution be made by Professor Srinivasan himself.
Importantly, I would like to place on record my deep appreciation to my own team at ACCESS, which provides all kinds of support to the Report. Most importantly, the Group of Advisors, in each meeting, were constantly keen and concerned on the Report’s progress, provided useful inputs on its themes and content, and enjoyed the discussions on the Report. Particularly, Nanda Saa’b and Mr Brijmohan forever have a very high ambition on the Report’s quality and content. While in the initial stages, it was Yeshu who anchored the support, later it was a full team led by Radhika Agashe with the help of Sudipto, Satya and the young energetic Rohan who filled the gaps in information and data. All states supported his visits by organizing meetings and discussions. And, of course, for the fifth year in a row, Lalitha provided the full logistics and administration support for Professor Srinivasan for his travels and meetings. Everyone at ACCESS is so eager to support his effort, as we all consider him a part of ACCESS, joking, talking, counselling, informing the youthful brigade at Hauz Khas, New Delhi.

Foreword xv
I’m happy that the 2010 ACCESS State of the Sector Report is out on time. I hope that once again, it will bring together all the frenzied action that the sector witnessed during the year and be seen as a relevant contribution to the sector.
Vipin Sharma CEO, ACCESS Development Services, New Delhi


Preface
There is a great sense of relief as I write this piece after drafting the rest of the report. I thought that last year was tough and, in fact, mentioned it in the Preface last year, but did not anticipate the problems of the current year. The report has been finalized without Sadhan’s comprehensive quick data. Mix market data of 77 institutions (90 per cent volumes of the sector) was a great source of help. NABARD, as in the last year, provided provisional data in the third week of August 2010. But the cooperation from the sector continued on a grander scale. It was gratifying to see and hear of the report being used at different levels; the utility of the report ensured that stakeholders voluntarily offered information. I have several people and institutions to thank. My thanks are due to CMF Chennai, CAB, UNSE, Unitus, Hand in Hand and SERP for making the extra effort for the purpose of this report. I should thank Justin Oliver of CMF for placing two interns for specific research, full access to their studies and a roundtable discussion with their staff. Arjun Sharma and Shreyas Gopinath from CMF did a user survey on ICT solutionist. Laxman Timilsina did data research on funds flows and Joshua Wan carried out a survey on Mission orientation and financial performance of MFIs. Thanks are due to Milroy Paul for inputs on housing microfinance. UNSE ran a query on practi-tioner’s expectations from the report and information on innovations. UNSE also arranged a session with practitioners in its annual forum in Jaipur on SOS 2010. I owe Anand Kumar, Navin, Ratnesh and Monika a lot for this. CAB, RBI co-hosted with ACCESS a workshop of private and foreign banks that was rich with lender’s perspectives. A service providers’ workshop was also hosted along with Planet Finance. Kamala Rajan, Principal, R.N. Dash and Thyagarajan had been instrumental in arranging these events. Influenced by Ganesh and Gazal, Unitus arranged a roundtable of HR professinals of MFIs and also provided inputs on a variety of aspects. Liz Larson of MIX made available critical information apart from sparing time for discussions. G.V.S. Reddy, Advisor, SERP, enabled an insight in to IKP operations through a field visit. Jeyaseelan HIH, facilitated field visits and meetings in Tamil Nadu. Suresh Gurumani arranged a field visit to one of SKS locations. Ramakrishna, GTZ, spared not only his time for discussions but also study reports relevant for the SOS 2010. C.S. Reddy, Ramalakshmi and Raja Reddy offered study reports from APMAS. AKMI arranged a meeting of members at very short notice in Bengaluru. I cannot thank all of them enough for sparing information, time and other resources.
Chairman of NABARD, U.C. Sarangi in the midst of a very busy day found time for this report. N.K. Maini, Executive Director, SIDBI, found time over dinner at the end of a tiring day and so did Mr Sahu, CGM. Graham Wrigh and Manoj Sharma provided me plenty of rich material from Microsave’s research and consulting work which was invaluable.
There are several orgnizations and people that I had met personally that I owe a lot: Alok Prasad, S.G. Anil, Manohar Raj, R.M. Nair, Kamala Rajan, S.K. Chatterjee, B. Rajashekar, Anna Samos Krishnan, Vikash Kumar, Abhay Kanjikar, K. Natarajan, P. Jeyaseelan, P.N. Vasudevan, Niraj Verma, Achala Savyasaachi, Dr Y.S.P. Thorat, Mrs Usha Thorat, Sanjay Sinha, Frances Sinha, Alok Sinha, Navin Anand, Samit Ghosh, Suresh Krishna, Vivekanand Salimath, Monika Khanna, Ratnesh, V. Tagat, M.V. Patro, Harish Java, R. Narayan, S. Krishnan, R. Tenkil, C.R. Patnaik, M.K. Mudgil, John Mayne, Praseeda Kunam, Amul Urdawareshe, N.K. Amin, Hemant Pamarthy and many others that I am unable to name for want of space. I am thankful to all of them for their keen interest in the report. I seek forgiveness from those whose names might have been left out; their contributions have been no less.

xviii MICROFINANCE INDIA
Sadhan’s consent for using their publications in the preparation of the report has been invlauable. MIX market was a treasure house of MFI specific information used in this year’s report. NABARD had made available the provisional information earlier than in the previous year. The advisory group of Microfinance India comprising Y.C. Nanda, Brij Mohan, Malcolm Harper, Vijayalakshmi Das, Jayshree Vyas, Justin Oliver and Vipin Sharma kept me on course with sound advice, without being editorially intrusive. I thank the do-nors for offering total support to the Report. I thank CMF-IFMR and UNSE for being the research partner and knowledge partner, respectively. Yeshu Bansal initially and later Radhika Aghase untiringly anchored my work from ACCESS. Rohan Trivedi, intern with ACCESS was incredibly fast in learning and doing. He provided data analysis and charts for two chapters and provided incisive comments on initial drafts of some chapters. Lalitha as in the past years was a pillar of support. Vipin got his way in overcoming my reluctance to do the report for the third year running. He was a source of good ideas relating to coverage. Despite per-sonal difficulties and privation, he never compromised on his support. Pravin Shende keyed in the initial draft from voice files this year too. Girija Srinivasan extensively reviewed the report and provided critical inputs for which I am very grateful.
This year’s report carries 11 chapters, the new additions being a chapter on savings and another on Glob-al Context. Social performance makes a strong comeback in the light of current developments in the sector. Microinsurance and human resources have not been covered this year in exclusive chapters. The issues relating to insurance and HR have been integrated in the relevant places. Most of the data sets of last year have been continued. The data set on individual MFI specific information (that appeared in Appendix Table 2 in the last two years) is not carried as the Sadhan quick report which is the basis has not been released till finalisation of this manuscript. All expectations on coverage from many of you may not have been fulfilled on account of constraint of space and time. I seek your understanding.
My thanks to many over there who had read the report last year and gave me brickbats and bouquets. Your comments have influenced some sections of the report. The views in the report are all personal and as such I alone am responsible for errors of omission, commission and interpretation. Any critical comments that you might find have been made without malice or ill will towards anyone. Please continue to provide feedback.
N. Srinivasan
1Chapter
Overview—the juggernaut decelerates
The MacrO cOnTexT
The growth of the mircofinance sector in alignment with the rest of the economy continued in the year 2010 but less vigorously than in the previous years. The macroeconomic environment changed mar-ginally for the better during 2010 as compared to the previous year. Across the world, reports were of painful and slow recovery from the financial sector meltdown of the previous year, and there was a con-tinuing flow of bad and some good news. The bail-outs of financial institutions elaborately designed by different governments had run their course and gave way to a great deal of attention for improving regulation and supervision of the financial sector, and especially of the conglomerates. Pessimism and distrust gave way to cautious attention to set things right. The impact, if any, on the mircofinance sector had not been overly negative. Of course, the initial withdrawal of funds—both of equity and of loans—was a predictable knee-jerk reaction of investors to consolidate their liquidity to minimize risks. With the passage of time, both loan and capital funds have started to flow to the sector but with more cir-cumspection and caution. It is only a matter of time before the investors return to the marketplace with full force.
The Indian economic environment recovered from slower growth rate of the previous year to post a GDP growth of 7.4 per cent in 2009–10.1 Indus-trial production continued to record double digit growth with year on year (YOY) growth at 14 per cent during April–May 2010. Agriculture, plagued by a deficient monsoon,2 did not fare as well as the secondary and tertiary sector, and posted a growth of 0.2 per cent. The prospect of a normal monsoon and heightened initial rainfall activity in the current year has led to a significant increase in area sown
across all major crop categories. The prognosis for the agricultural sector in the current year is positive. However, the inflation scenario according to the Re-serve Bank of India (RBI) is a cause for concern. As mentioned in Microfinance India: State of the Sector Report 2009, inflation did play a major role pushing up food prices as also different commodity prices. The freeing of retail prices of oil from state control saw a spike in the price of fuel which led to down-stream effects on the prices of other commodities, either on account of increased manufacturing cost or transportation cost. The continuing rise in the prices of food articles places the poor under consid-erable stress. Though inflation rates have moderat-ed, they are still in double digits, reflecting a strong upward pressure on prices and, thereby, affordabil-ity of food for the consumers. The forecast for the current year by RBI is a growth rate of 8.5 per cent in the gross domestic product (GDP) riding on the back of better industrial production and its favour-able impact on the services sector. The forecast for inflation in the Wholesale Price Index (WPI) terms has been raised to 6 per cent by RBI, reflecting infla-tionary conditions during the year.
Credit flow to the economy did improve especial-ly from the second quarter onwards. The non-food credit reached a level of 17 per cent YOY growth in March 2010. Banks had fulfilled their priority sec-tor lending mandates, ensuring that credit flow to vulnerable sectors was more than the previous year. Despite inflationary conditions and tightening of the monetary stance by RBI, the Prime Lending Rates (PLR) of banks remained more or less stable. From 1 July 2010, RBI has introduced the Base Rate sys-tem among banks and removed the cap on interest rates on small loans (up to ̀ 200000). This is expect-ed to improve transparency in pricing and enhance efficiency. The overall monetary policy direction of
2 MICROFINANCE INDIA
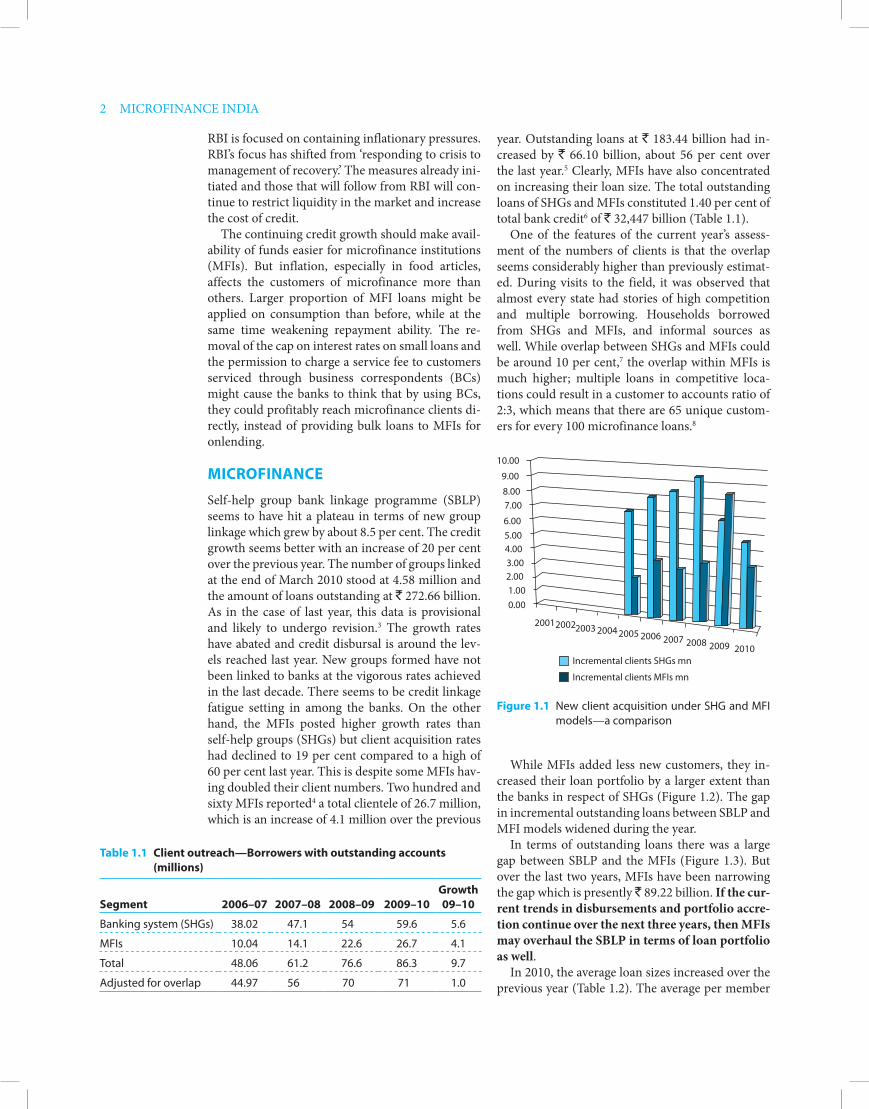
year. Outstanding loans at ` 183.44 billion had in-creased by ` 66.10 billion, about 56 per cent over the last year.5 Clearly, MFIs have also concentrated on increasing their loan size. The total outstanding loans of SHGs and MFIs constituted 1.40 per cent of total bank credit6 of ` 32,447 billion (Table 1.1).
One of the features of the current year’s assess-ment of the numbers of clients is that the overlap seems considerably higher than previously estimat-ed. During visits to the field, it was observed that almost every state had stories of high competition and multiple borrowing. Households borrowed from SHGs and MFIs, and informal sources as well. While overlap between SHGs and MFIs could be around 10 per cent,7 the overlap within MFIs is much higher; multiple loans in competitive loca-tions could result in a customer to accounts ratio of 2:3, which means that there are 65 unique custom-ers for every 100 microfinance loans.8
RBI is focused on containing inflationary pressures. RBI’s focus has shifted from ‘responding to crisis to management of recovery.’ The measures already ini-tiated and those that will follow from RBI will con-tinue to restrict liquidity in the market and increase the cost of credit.
The continuing credit growth should make avail-ability of funds easier for microfinance institutions (MFIs). But inflation, especially in food articles, affects the customers of microfinance more than others. Larger proportion of MFI loans might be applied on consumption than before, while at the same time weakening repayment ability. The re-moval of the cap on interest rates on small loans and the permission to charge a service fee to customers serviced through business correspondents (BCs) might cause the banks to think that by using BCs, they could profitably reach microfinance clients di-rectly, instead of providing bulk loans to MFIs for onlending.
MicrOfinance
Self-help group bank linkage programme (SBLP) seems to have hit a plateau in terms of new group linkage which grew by about 8.5 per cent. The credit growth seems better with an increase of 20 per cent over the previous year. The number of groups linked at the end of March 2010 stood at 4.58 million and the amount of loans outstanding at ` 272.66 billion. As in the case of last year, this data is provisional and likely to undergo revision.3 The growth rates have abated and credit disbursal is around the lev-els reached last year. New groups formed have not been linked to banks at the vigorous rates achieved in the last decade. There seems to be credit linkage fatigue setting in among the banks. On the other hand, the MFIs posted higher growth rates than self-help groups (SHGs) but client acquisition rates had declined to 19 per cent compared to a high of 60 per cent last year. This is despite some MFIs hav-ing doubled their client numbers. Two hundred and sixty MFIs reported4 a total clientele of 26.7 million, which is an increase of 4.1 million over the previous
Table 1.1 client outreach—Borrowers with outstanding accounts (millions)
Segment
2006–07
2007–08
2008–09
2009–10
Growth 09–10
Banking system (SHGs) 38.02 47.1 54 59.6 5.6
MFIs 10.04 14.1 22.6 26.7 4.1
Total 48.06 61.2 76.6 86.3 9.7
Adjusted for overlap 44.97 56 70 71 1.0
200120022003 20042005 2006 2007 2008 2009 2010
0.001.002.003.004.005.006.00
7.008.00
9.00
10.00
Incremental clients SHGs mn
Incremental clients MFIs mn
figure 1.1 New client acquisition under SHG and MFI models—a comparison
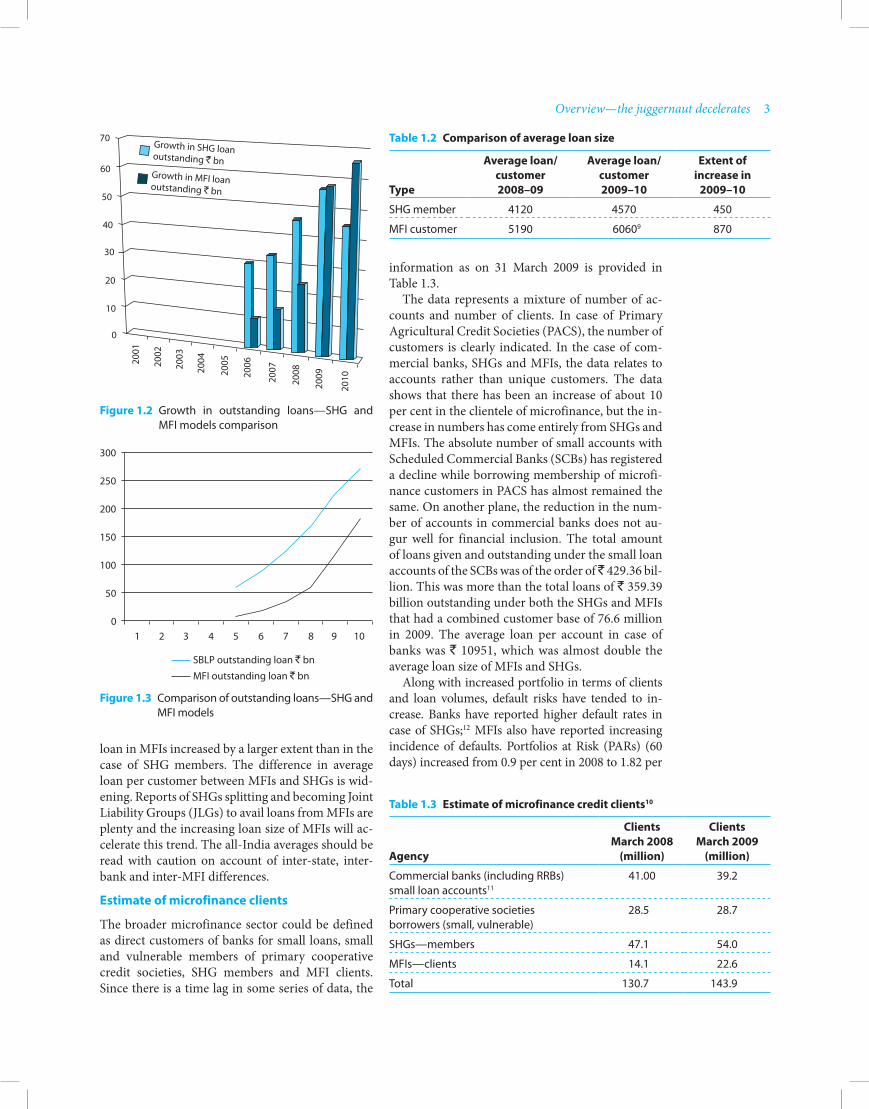
While MFIs added less new customers, they in-creased their loan portfolio by a larger extent than the banks in respect of SHGs (Figure 1.2). The gap in incremental outstanding loans between SBLP and MFI models widened during the year.
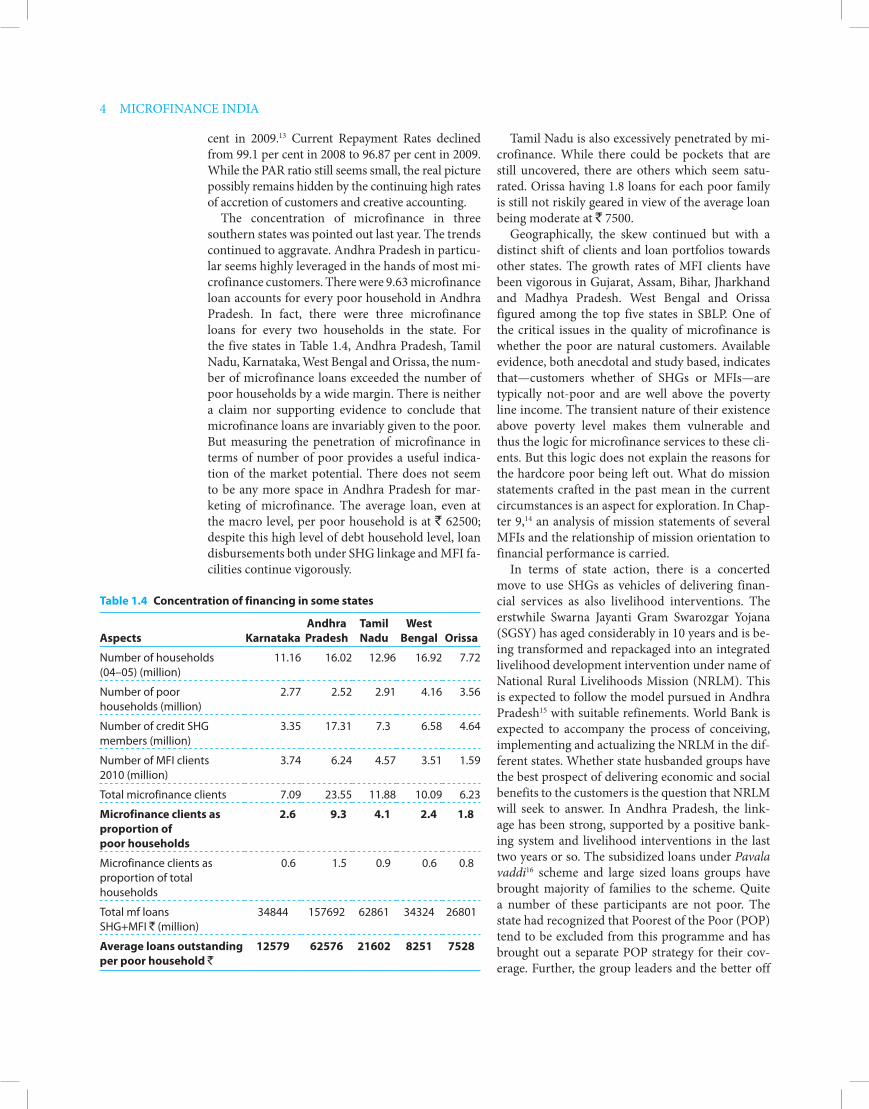
In terms of outstanding loans there was a large gap between SBLP and the MFIs (Figure 1.3). But over the last two years, MFIs have been narrowing the gap which is presently ` 89.22 billion. If the cur-rent trends in disbursements and portfolio accre-tion continue over the next three years, then MFIs may overhaul the SBLP in terms of loan portfolio as well.
In 2010, the average loan sizes increased over the previous year (Table 1.2). The average per member
Overview—the juggernaut decelerates 3
information as on 31 March 2009 is provided in Table 1.3.
The data represents a mixture of number of ac-counts and number of clients. In case of Primary Agricultural Credit Societies (PACS), the number of customers is clearly indicated. In the case of com-mercial banks, SHGs and MFIs, the data relates to accounts rather than unique customers. The data shows that there has been an increase of about 10 per cent in the clientele of microfinance, but the in-crease in numbers has come entirely from SHGs and MFIs. The absolute number of small accounts with Scheduled Commercial Banks (SCBs) has registered a decline while borrowing membership of microfi-nance customers in PACS has almost remained the same. On another plane, the reduction in the num-ber of accounts in commercial banks does not au-gur well for financial inclusion. The total amount of loans given and outstanding under the small loan accounts of the SCBs was of the order of ̀ 429.36 bil-lion. This was more than the total loans of ` 359.39 billion outstanding under both the SHGs and MFIs that had a combined customer base of 76.6 million in 2009. The average loan per account in case of banks was ` 10951, which was almost double the average loan size of MFIs and SHGs.
Along with increased portfolio in terms of clients and loan volumes, default risks have tended to in-crease. Banks have reported higher default rates in case of SHGs;12 MFIs also have reported increasing incidence of defaults. Portfolios at Risk (PARs) (60 days) increased from 0.9 per cent in 2008 to 1.82 per
loan in MFIs increased by a larger extent than in the case of SHG members. The difference in average loan per customer between MFIs and SHGs is wid-ening. Reports of SHGs splitting and becoming Joint Liability Groups (JLGs) to avail loans from MFIs are plenty and the increasing loan size of MFIs will ac-celerate this trend. The all-India averages should be read with caution on account of inter-state, inter-bank and inter-MFI differences.
estimate of microfinance clients
The broader microfinance sector could be defined as direct customers of banks for small loans, small and vulnerable members of primary cooperative credit societies, SHG members and MFI clients. Since there is a time lag in some series of data, the
Table 1.2 comparison of average loan size
Type
average loan/ customer 2008–09
average loan/ customer 2009–10
extent of increase in
2009–10
SHG member 4120 4570 450
MFI customer 5190 60609 870
Table 1.3 estimate of microfinance credit clients10
agency
clients March 2008
(million)
clients March 2009
(million)
Commercial banks (including RRBs) small loan accounts11
41.00 39.2
Primary cooperative societies borrowers (small, vulnerable)
28.5 28.7
SHGs—members 47.1 54.0
MFIs—clients 14.1 22.6
Total 130.7 143.9
figure 1.2 Growth in outstanding loans—SHG and MFI models comparison
figure 1.3 Comparison of outstanding loans—SHG and MFI models
70
60
50
40
30
20
10
0
2001
2002
2003
2004
2005
2006
2007
2008
2009
2010
Growth in SHG loanoutstanding ` bnGrowth in MFI loanoutstanding ` bn
01 2 3 4 5 6 7 8 9 10
SBLP outstanding loan ` bn
MFI outstanding loan ` bn
50
100
150
200
250
300
4 MICROFINANCE INDIA
Tamil Nadu is also excessively penetrated by mi-crofinance. While there could be pockets that are still uncovered, there are others which seem satu-rated. Orissa having 1.8 loans for each poor family is still not riskily geared in view of the average loan being moderate at ` 7500.
Geographically, the skew continued but with a distinct shift of clients and loan portfolios towards other states. The growth rates of MFI clients have been vigorous in Gujarat, Assam, Bihar, Jharkhand and Madhya Pradesh. West Bengal and Orissa figured among the top five states in SBLP. One of the critical issues in the quality of microfinance is whether the poor are natural customers. Available evidence, both anecdotal and study based, indicates that—customers whether of SHGs or MFIs—are typically not-poor and are well above the poverty line income. The transient nature of their existence above poverty level makes them vulnerable and thus the logic for microfinance services to these cli-ents. But this logic does not explain the reasons for the hardcore poor being left out. What do mission statements crafted in the past mean in the current circumstances is an aspect for exploration. In Chap-ter 9,14 an analysis of mission statements of several MFIs and the relationship of mission orientation to financial performance is carried.
In terms of state action, there is a concerted move to use SHGs as vehicles of delivering finan-cial services as also livelihood interventions. The erstwhile Swarna Jayanti Gram Swarozgar Yojana (SGSY) has aged considerably in 10 years and is be-ing transformed and repackaged into an integrated livelihood development intervention under name of National Rural Livelihoods Mission (NRLM). This is expected to follow the model pursued in Andhra Pradesh15 with suitable refinements. World Bank is expected to accompany the process of conceiving, implementing and actualizing the NRLM in the dif-ferent states. Whether state husbanded groups have the best prospect of delivering economic and social benefits to the customers is the question that NRLM will seek to answer. In Andhra Pradesh, the link-age has been strong, supported by a positive bank-ing system and livelihood interventions in the last two years or so. The subsidized loans under Pavala vaddi16 scheme and large sized loans groups have brought majority of families to the scheme. Quite a number of these participants are not poor. The state had recognized that Poorest of the Poor (POP) tend to be excluded from this programme and has brought out a separate POP strategy for their cov-erage. Further, the group leaders and the better off
cent in 2009.13 Current Repayment Rates declined from 99.1 per cent in 2008 to 96.87 per cent in 2009. While the PAR ratio still seems small, the real picture possibly remains hidden by the continuing high rates of accretion of customers and creative accounting.
The concentration of microfinance in three southern states was pointed out last year. The trends continued to aggravate. Andhra Pradesh in particu-lar seems highly leveraged in the hands of most mi-crofinance customers. There were 9.63 microfinance loan accounts for every poor household in Andhra Pradesh. In fact, there were three microfinance loans for every two households in the state. For the five states in Table 1.4, Andhra Pradesh, Tamil Nadu, Karnataka, West Bengal and Orissa, the num-ber of microfinance loans exceeded the number of poor households by a wide margin. There is neither a claim nor supporting evidence to conclude that microfinance loans are invariably given to the poor. But measuring the penetration of microfinance in terms of number of poor provides a useful indica-tion of the market potential. There does not seem to be any more space in Andhra Pradesh for mar-keting of microfinance. The average loan, even at the macro level, per poor household is at ` 62500; despite this high level of debt household level, loan disbursements both under SHG linkage and MFI fa-cilities continue vigorously.
Table 1.4 concentration of financing in some states
aspects Karnatakaandhra Pradesh
Tamil nadu
West Bengal Orissa
Number of households (04–05) (million)
11.16 16.02 12.96 16.92 7.72
Number of poor households (million)
2.77 2.52 2.91 4.16 3.56
Number of credit SHG members (million)
3.35 17.31 7.3 6.58 4.64
Number of MFI clients 2010 (million)
3.74 6.24 4.57 3.51 1.59
Total microfinance clients 7.09 23.55 11.88 10.09 6.23
Microfinance clients as proportion of poor households
2.6
9.3
4.1
2.4
1.8
Microfinance clients as proportion of total households
0.6
1.5
0.9
0.6
0.8
Total mf loans SHG+MFI ` (million)
34844 157692 62861 34324 26801
average loans outstanding per poor household `
12579 62576 21602 8251 7528
Overview—the juggernaut decelerates 5
entail longer maturity loans given by the MFIs with a significant residual maturity at the time of secu-ritization and assignment in favour of banks. The revised securitization norms, if applied, might ad-versely impact issuance of different securitized debt instruments by MFIs for resource mobilization. On the other hand, RBI has made incremental changes to the norms relating to enrolment of different enti-ties as business correspondents by banks. Individual owners of shops, establishments and petrol pumps are now permitted to be engaged as BCs by banks with a view to push the pace of inclusion. Along with this, RBI has also made it possible for banks to charge the extra costs of using BCs directly from customers. The issues relating to viability gap that adversely impacted banks so far are close to a solu-tion. In a move that surprised the sector, RBI has re-cently come out with a discussion paper on permit-ting for-profit corporates with their retail networks to become BCs of banks. This move will have far reaching consequences in terms of its potential to accelerate the pace of inclusion. However, there are views that look at this development as not being a positive one, especially for the very poor clients who are the targets of financial inclusion initiatives.
The landscape of mircofinance continued to change in 2010. MFIs have forayed into states where previously they had very limited presence. The ex-pansion, however, was confined to cities and towns, and not into the hinterland. Competition has be-come more intense than ever in the past. Even in very small towns, there were reports that more than five MFIs competed for business. The resultant del-uge of loan funds available has fuelled excessive borrowing by clientele and emergence of undesir-able practices. Even within the short time period for which MFIs have been in the market in states likes Chhattisgarh, Rajasthan and Madhya Pradesh, they have experienced the effects of unhealthy competi-tion. The emergence of ring leaders as key interme-diaries between MFIs and the potential customers has distorted market discipline, as also the MFI lending processes. There have been cases of high defaults where ring leaders were involved in procur-ing loans for their clients and also ghost loans which have become epidemic in certain states. Some MFIs have had to scale down operations from specific lo-cations and, in some cases, even from entire states where they had entered very recently. The default rates have been climbing in some of these locations. The manner of accounting for defaults and default-ers in several MFIs has so far failed to bring out the magnitude of the problem. In some areas, the
capture larger share of loans and benefits, as was found during the study carried out by the Nation-al Bank for Agricultural and Rural Development (NABARD). Deep Joshi, in his review of the work of Andhra Pradesh Mahila Abhivruddhi Society (APMAS) and Indira Kranti Patham,17 also found this tendency in programme coverage.
Some state governments’ attitude towards MFIs ranged from apathy to hostility. Andhra Pradesh government took the view that MFIs are not play-ing a positive role and needed to be policed. District level task forces comprising bureaucrats and bank-ers have been set up to monitor MFIs and look into complaints that might be received against MFIs. Andhra Pradesh and Kerala governments have required the Non-Banking Financial Company (NBFC) MFIs operating in their states to register under the state money lending statute. In Andhra Pradesh, the statute is limited to tribal areas and, in Kerala, it is valid throughout the state. The Kolar mass default problem continued to plod on without any end in sight. The apathy of the state government is palpable in letting a problem of this magnitude fester for more than 18 months. There had been a clear violation of law in inciting people to renege on a validly executed loan contract, using religion as the trigger. MFIs have stopped lending in Kolar and similar other locations. The MFIs are also acutely conscious of the concentration risks in financing to religious minorities. There are attempts to limit loan exposure to Muslims fearing Kolar-like problems elsewhere. The religious leadership has to rethink its position: whether it causes more misery and less benefit to its flock in issuing such edicts in a facile and unthinking manner.
On the policy environment side, RBI had indicat-ed that if the existing inclusion initiatives through banking system fail to deliver results, it might permit alternate institutions to come up. The Union Bud-get18 had announced that RBI would consider issu-ing new licenses for setting up of more banks. Some large MFIs have been enthused by the announce-ment and are actively working towards securing a banking licence. RBI has made its concerns over the sector amply clear. The possibility that banks would cease to enjoy priority sector lending status19 in respect of their lending to MFIs has made a large number of players anxious. This was in response to negative vibes arising from pricing of loans, as also client acquisition and recovery processes employed by different MFIs. In a subsequent development, RBI has brought out a discussion paper on refining the norms for securitization of loans. The new norms

6 MICROFINANCE INDIA
Public sector banks had taken a major share of new exposures. A larger number of banks are willing to support MFIs as compared to a couple of years ago. Most private sector and foreign banks have limited their exposure by and large to previously existing levels with a few exceptions. The funders’ comfort has been derived from the entry of new, more or-ganized and professional promoters. The entry of large corporate houses such as Mahindra and Mahi-ndra, Larsen & Toubro, and Reliance has been seen as a testimony to the inherent strength of the busi-ness model of MFI. The banking sector has fewer reservations in financing MFIs, particularly those in company form, from a business and risk point of view. However, regulatory concerns would continue to influence credit decisions of banks especially in the current year.
On the technology front, there have not been too many ground breaking developments. The mainline software solutions providers do not still consider MFIs as significant clients. The demands of the sec-tor have not been taken seriously enough as there are a mere handful of large players who require invest-ments in technology. The small and medium MFIs do suffer from lack of viable and scalable technolo-gies that would help them grow from their current size to a much larger size in accordance with their organizational plans. Their disinclination to spend reasonable amounts on technology is also a factor in the low motivation among technology solution providers. The existing technologies in use are a combination of stand-alone accounting solutions bought off the shelf (such as Tally) and usage of specific MIS packages such as Microfinance Open Source (MIFOS). The smaller MFIs use common softwares such as Microsoft Excel to compute and report information on an ongoing basis. With lim-ited capacities to archive, retrieve and manipulate the data, these software applications pose risks of a kind that are not acceptable in financial sector. In a majority of small and medium MFIs, the realization that MIS should not only serve the purpose of re-porting to external stake holders and regulators but should also serve decision and business planning requirements is yet to sink in.
There are initial signs of product innovations tak-ing place. MFIs20 have recognized that a diversified basket of products makes sense as a competitive tool, as also a risk mitigant. Education loans, revolving loans for trade, longer duration loans for livelihood investment and housing loans are being tested out in different locations. Pension products are offered in partnership with either insurance companies or
MFIs did not seem to have a clear perception of the way the business is growing. The absence of qual-ity Management Information System (MIS) and re-porting processes have caused a critical information gap that hinders informed decisions. Decentralized operational processes and centralized MIS do not go well together in widely distributed business op-erations.
Small and medium MFIs continue to aspire to grow big. There are several cases of transforma-tion still in the works. These transformation cases typically involve an NGO/MFI seeking to become a non-profit company or a for-profit company in the NBFC mode. But the issues involved in the transformation to an incorporated company have not been fully understood. The level of ignorance and misinformation surrounding transformation process is high. Some of the technical advice pro-vided to institutions show that an institutional view of transformation is missing. Oftentimes, transfor-mations are looked through the lens of capital mo-bilization, investor access, retaining control after bringing investors, and so on. Issues relating to how the organization will be positioned after the trans-formation, how to ensure mission fulfilment, how to ensure that governance balances the needs of customers and investors, and the legal/procedural compliances involved are by and large ignored.
On the funding side, more equity funds were available to the sector compared to the previous year and to a larger number of MFIs. Some small-er MFIs also received equity funding. Mainstream private equity investors outnumbered focused mi-crofinance investors in the Indian market. One of the watershed events in the recent past has been the successful float of the initial public offer of equity of SKS mircofinance. A less than five year old institu-tion mobilizing $350 million from the capital market at a price that is more than six times its book value is a major milestone in the sector’s journey. There are differing views on the high valuation achieved and the future difficulties in defending the equity price in an unforgiving marketplace. But it cannot be denied that the mircofinance sector has grown in maturity to a level sufficient to attract capital market funds. More institutions are expected to follow suit and approach the bourses in a quest for high enter-prise valuation and not necessarily equity funds.
Banks have been cautiously optimistic in con-tinuing to support the sector with bulk loans and buying out portfolios. Small Industries Develop-ment Bank of India (SIDBI) almost doubled its out-standing microfinance loan portfolio to ` 38 billion.

Overview—the juggernaut decelerates 7
as a reaction to the problems arising from multiple lending in a competitive market in Kolar, limits on lending to same borrower have been thought of. But most reported efforts on social performance are ini-tiatives on responsible finance. There is still a long road to traverse on social performance.
The rural cooperative reform after the hectic pace of initial work has entered a consolidation phase. The hard part of the reform process, that is, making the cooperatives vibrant, customer focused entities with a diversified and viable business base has com-menced. This phase could make or break the reform agenda of the cooperative sector and consequently the future of the cooperative banking in the country. In the case of post-offices, a high powered commit-tee has come out with recommendations for mak-ing much greater and intense use of the post-office infrastructure for extending financial services to a large number of excluded people. While RBI still does not count the clients of post-offices, coopera-tives and MFIs in its financial inclusion arithmetic, the fact remains that these three sets of institutions together cater to a much larger proportion of the vulnerable people than the formal banking system.
The new initiatives during the year saw Mirco-finance Transparency (MFT)—an international non-profit body that seeks to promote transparent pricing in the mircofinance sector—setting up op-erations in India. Its early work is being incubated by Access Development Services (ADS). More than 80 MFIs have already agreed to report pricing data which would be processed and displayed on a web-site providing real prices paid by customers to the MFIs. The power of information available in public domain in a transparent manner to moderate the in-terest rates and introduce fair competition practices will be harnessed to provide benefits to the custom-ers. The further agenda of MFT is to promote cus-tomer literacy relating to prices and use of informa-tion generated by MFIs to drive down costs.
The multilaterals have been quite active in the sector with the anticipated World Bank loan com-ing through in favour of SIDBI during the year. The World Bank loan is intended to promote good practices across the sector and bring in self-regula-tion and lender supervision of different types. In-ternational Finance Corporation (IFC) has taken leadership in the equity investment space. It is ex-pected to bring in a measure of social orientation as an antidote to the commercial business orien-tations of investee companies that are controlled by Venture Capital and Private Equity players. The Department for International Development
Asset Management Companies21. The Pension Fund Regulation and Development Authority (PFRDA) introduced the ‘NPS Lite’22 recently for the poor households.
reSearch and STudieS
There have been a number of focused studies into detailed aspects of mircofinance operations and access to finance issues. The interest in studying various aspects of mircofinance has been growing. The Centre for Microfinance (CMF)23 had carried out a few interesting studies which are discussed in the latter sections of the report. One of the more interesting studies that looked at access to finance in Andhra Pradesh brought out significant findings on the nature of multiple borrowing by the custom-ers as also the clear thinking on use of these loans for different purposes. The emergence of money lending by the poor people as an enterprise activ-ity came to the fore from the findings of the study. Ujjivan24 had carried out a study of the impact of its lending operations on a large sample of more than 3000 clients over three cycles. The study concluded that there is a discernible income effect but not sig-nificant enough to influence poverty level; mircofi-nance alone cannot impact incomes sufficiently to bring people out of poverty and that MFIs cannot replace the money lenders totally.
There was much more interest on social perfor-mance and responsible finance from different seg-ments of the mircofinance sector. The continuing adverse news reports that seem to indicate that mir-cofinance does not in any way positively deal with poor people seemed to warrant an effective counter from the sector. The rise in number of institutions and practitioners focusing on social performance and responsible financing aspects has been com-mensurate with the increased negative stories in the media. The Microfinance Information Exchange (MIX) market introduced social performance re-porting and has received encouraging response. The Smart Campaign with its core principles has been trying to extend the frontiers of social performance. EDA Rural Systems reported increased interest in social ratings by MFIs in India and abroad. In the Indian context, the Mircofinance Institutions Net-work25 (MFIN) has taken upon itself the task of regu-lating the behaviour of members in terms of pricing, dealing with customers and installing a grievance redress mechanism. The code of conduct that has already been accepted by members is in the process of being institutionalized and enforced. Further,
8 MICROFINANCE INDIA
it difficult to take large exposures in such institu-tions. The typical loan exposure to a federation ex-pected by the governments in Andhra Pradesh is around ` 20–30 million and in Tamil Nadu around ` 5 million to begin with. These levels of anticipated lending would imply banking exposures running to hundreds of billions of rupees with very weak systems of risk mitigation and inexperienced staff. NABARD has a role in navigating these hurdles and laying down norms for support to such institu-tions and also in designing due diligence and rat-ing exercises for arriving at a sound basis for credit exposures. Such federations could become useful financial intermediaries, but a lot of hard work and investments are involved to make them the appro-priate intermediaries in finance.
Microfinance in India is better organized than elsewhere in the world. The global survey by Econ-omist Intelligence Unit (EIU)27 placed India at the fourth position among 54 countries. The number of Indian MFIs making it to Mix Top 10028 had doubled to 20 in 2009, from 10 in the previous year. The cost efficiencies and continuing social orienta-tions have ensured that deviant behaviour in parts of the sector remains under control. However, with a substantial part of the sector having chosen a commercial model and that too with investment bankers funding equity there is a distinct move-ment towards higher profits and growth at any cost. While profit is not a dirty word (millions of customers thankful for continued access to main-stream funds made possible by equity investors), the question is ‘what is the right price for these in-vestments?’ Available evidence on costs, yields and return-on-assets reveal that external equity drives loan price upwards even when there is reduction in costs. If the customer is not to get the promised benefit of growth and consolidation, why do we call it microfinance? If a handful of investors are enabled to make windfall profits and, at the same time, the MFI struggles to refrain from increasing interest rates, it is high time to revisit the mission of microfinance and confirm for ourselves we are in the right business for the right reasons.
Thanks to the market, growth rates have moder-ated in both the streams of microfinance. In the last three years, the sector seemed like a juggernaut powering ahead but not much in control. With the slowing down, the sector has the time and oppor-tunity to revisit the mission and regain control. It has the ability. The question is: does it have the willingness?
(DFID) had prioritized four states for a project on inclusive growth of poor which comprises ‘access to finance’ and ‘access to markets’ as two important legs of a major initiative.
The national apex development banks have been active in the development finance space. As stated above, SIDBI has doubled its loan portfolio and ex-panded equity investments through private place-ments. However, some of the issues surrounding the SKS IPO26 have led to a slowing down of equity investment decisions from SIDBI caused by an in-creased regulatory oversight of such investments. SIDBI, in collaboration with other lenders in the sec-tor, is forging an alliance in order to have a uniform approach towards MFI financing and the minimum disciplines. The initial rounds of meetings have been positive with enthusiasm for collaborating on portfolio audits and information sharing. One of the concerns of SIDBI has been the interest pricing and the lack of transparency. It intends to carry out sev-eral measures during the year to rectify the situation on the ground. NABARD had provided refinance of ` 31.7 billion to banks covering their SHG loan portfolios. SHG refinance constituted 26 per cent of NABARD’s annual disbursements in 2009–10. NABARD continued with its development efforts for the sector, such as support to MFIs to get rated by accredited rating agencies, grants to Self-Help Promoting Institutions (SHPIs), special projects in priority states and the Northeast, and enterprise de-velopment programmes for mature SHGs. NABARD had promoted the concept of farmers’ joint liability groups in an effort to improve the agricultural loan flows to small and marginal farmers, as also lease holders of farmland. This programme reportedly has been gathering pace and is likely to result in a significant number of men groups borrowing direct-ly from banks. However, the leadership of the SHG Bank Linkage Programme (SBLP) held by NABARD for long seems to be weakening. The ceding of lead-ership to state governments where they had large programmes had not been a strategic move on the part of NABARD.
The emergence of state sponsored federations in different states has been a cause of some concern. Andhra Pradesh with 1100 mandal level federations and Tamil Nadu with its 12000 panchayat level fed-erations have created disquiet among banks with demands for high levels of financing to federations. Federations being newly created entities without a past record and, in many cases, without professional manpower are loosely structured. Banks would find
Overview—the juggernaut decelerates 9
annex 1.1 cGaP’s view on microfinance and india—an interview with Stephen rasmussen, Senior advisor- cGaP
Stephen has for long been associated with development finance. In his current position at a senior level with CGAP, he manages South Asia and also the technology initiatives in branchless banking and MIS. CGAP has been active on several fronts across the world, supporting innovations and experiments in India apart from dis-semination of information. SOS tries to capture CGAP’s perspective on Indian Market in the context of global trends and get an external view on domestic trends.
1. How does CGAP view the developments in the Indian Market in the context of global developments in microfinance?
A. India is probably the largest microfinance market in the world. It has a long history of financial inclusion initiatives that have used a wide array of approaches to address the access challenge, for example, coopera-tives, RRBs, SHGs, MFIs and, most recently, the business correspondent approach. In recent years, India’s MFIs have attracted substantial attention because of their rapid growth and the investment opportunities they present. The wide range of approaches and the performance of the microfinance sector are positives, but at the same time, outreach is still small and concentrated when considering India as a whole, and the focus has been on a narrow range of credit services with less progress on savings products and other finan-cial services for poor people. The microfinance sector, the larger financial sector and policymakers are well aware of how much more needs to be done. What makes India so important and interesting for the global microfinance community are all the ideas and initiatives to address the financial inclusion challenge. To cite just one example that is being discussed outside India, given India’s strong banking and technology histo-ries, will business correspondents and technology driven branchless banking make a big impact?
2. For long CGAP had been stressing the need for commercialization of microfinance and market-based approaches. Is there any rethinking on this in the last one year?
A. CGAP has always held a balanced view—commercialization is not a goal but a means of achieving sus-tainable outreach to larger numbers of the poor. We have always said there should be an appropriate balance between commercialization and serving more poor people responsibly. Recent global experience shows us that microfinance is at its best when outreach and responsibility objectives are well-balanced and reinforce each other. Microfinance outreach has grown significantly during the past five years, largely driven by sus-tainable institutions that are increasingly able to take advantage of opportunities offered by participation in mainstream financial markets. At the same time, there has been growing attention on a comprehensive re-sponsible finance agenda, the need for which has been reinforced by a few examples of microfinance crises in which growth, financial performance and responsibility to poor clients have not been well balanced.
3. The first ever IPO by a microfinance company was successfully completed by SKS. What does it hold out for the future of the sector?
A. The SKS IPO is a milestone event which marks a further step down a path of attracting commercial capital to microfinance. We expect other MFIs will follow down this path. In the process, the microfinance sector is almost certain to grow considerably. It is also possible there could be consolidation of the industry with a few large MFIs having most of the outreach. It remains to be seen what all of this will mean to reach-ing much larger numbers of poor people with a range of financial services that improve their lives. We hope this access to new sources of and large sources of capital will contribute significantly towards achieving that goal. But at the same time, it is just as important to energize other approaches such as SHGs and business correspondents. India is fortunate to have multiple ways of extending financial access, and further innova-tion combined with expansion could bring a much richer set of options to the poor over time.
4. There seems to be increased level of attention on Social Performance Management. Is there a fun-damental change in institutional mindsets behind this, or SPM is more a politically correct option articulated by the sector to deflect criticism?
A. Microfinance practitioners and supporters certainly are focusing more these days on questions of impact, responsibility and ethics. This is partly fuelled by increased scrutiny from journalists, politicians and the general public, leading to concerns in the sector about reputation, and operational and political risks. But the concepts and practice of social performance management are hardly new in our field. For some years now, the Social Performance Task Force (www.sptf.info) has provided space for MFIs, funders, support

10 MICROFINANCE INDIA
organizations and researchers to come together and develop a standardized and comprehensive toolkit. This work seeks to pin down the double bottom line of microfinance, by measuring whether and how MFIs behave responsibly towards their clients, staff and communities, and achieve tangible benefits in the lives of clients. CGAP has joined hands with the MIX to promote social performance reporting, and a rapidly growing number of MFIs are reporting social performance indicators in addition to financial and outreach indicators. Now, many dozens of MFIs are going beyond measurement, using these tools as the basis for social performance management by translating their double (or triple) bottom line mission into practice. Funder expectations and support definitely are playing a key role in this trend in our sector. We believe that all players active in providing financial services to the poor should adhere to basic principles of ‘responsible finance’—client protection, transparency, fair treatment and ethical behaviour. Even purely commercial providers and investors should be held accountable for these minimum standards. The Smart Campaign (www.smartcampaign.org) has mobilized hundreds of retail providers, funders and support organizations to promote responsible products, practices and policies across the globe.
Recently the World Bank has worked closely with SIDBI to design a new Responsible Finance project for which CGAP was requested to provide input. It will offer MFIs a new kind of quasi equity product aimed at strengthening MFI balance sheets. At the same time—and even more important—the project will strengthen responsible microfinance practices. Various initiatives will be taken, including conditions for MFIs to access this capital and a SIDBI convened lenders’ forum that has already been established to improve risk management through sharing of information, strengthen interest rate transparency, improve industry wide data collection and reinforce codes of conduct. One specific aspect of the project will be to increase and improve the use of social performance management. Altogether this project can improve risk management, help MFIs improve customer service, and enhance the growth and long term sustainability of the microfinance market.
5. How do you view the developments in financial inclusion sphere?
A. There is so much that could be said. One recent focus of financial inclusion in India that we think is promising, and which we work with closely, is a push by government to extend banking services through the use of technology aided by deploying business correspondents, what we call branchless banking. India has a wealth of technology and entrepreneurial talent to make this happen. At the same time, current policy puts much of the scope to use business correspondents in the hands of commercial banks. So there is a lot we will learn about the desire and ability of banks to enter this new business. Recent regulatory adjust-ments allowing banks to charge fees for these services and a discussion paper on opening up partnerships between banks and corporate entities (including mobile network operators) offer greater scope for this kind of business. Nevertheless, CGAP’s work in many other parts of the world suggests that branchless banking systems can be difficult to build under the very best of circumstances and the most supportive regulatory frameworks. We are keen to continue and deepen our engagement with players across India to learn more about branchless banking as well as provide ideas that could help India.
6. Last year CGAP had brought out an assessment of Access to Finance across the world. How is this to be followed up?
A. This year’s report, published in the middle of September 2010, adds some new topics, notably data about SME and consumer finance. The encouraging news is that even in the midst of the global financial crisis, when volumes of credit and savings dropped around the world, financial access improved.
7. Impressions from the field and data from a few studies show that with growth, MF sector is moving away from the poor. More non-poor are sought after as clients. In such a situation, when poor are not priority clients of MFIs, how does CGAP see its role in future when it deals with the MF sector?
A. We haven’t seen comprehensive or conclusive data on this for India. We do think there are many more poor people who can be served by sustainable, growing providers. We think poor people can and should be priority clients. At the same time, we recognize the challenges this presents and we think that in addition to the microfinance sector remaining focused on the needs of poor people, new approaches will need to be pioneered and proven and special efforts taken. Again, India has so much to offer the global community in this respect. One thing that CGAP is supporting in India and six other countries is experimentation and learning through pilot projects that identify and work with the very poorest households to build them up to a level where they can join regular microfinance programmes.

Overview—the juggernaut decelerates 11
14. Please see Chapter 9 for an analysis of Mission ori-entation and aligned financial performance.
15. Indira Kranthi Patham, run by Society for Elimina-tion of Rural Poverty (SERP), an autonomous soci-ety set up by the Government of Andhra Pradesh
16. Pavala Vaddi means 0.25 per cent interest per month. The state government has a scheme for pro-viding SHGs with loans at 3 per cent per annum and subsidises the banks for the difference.
17. Indira Kranti Patham is the name of the state gov-ernment programme for poverty alleviation through the SHG mode. This was the sequel to the World Bank supported anti-poverty programme.
18. Refer to the Ministry of Finance website for the text of budget speech.
19. The matter of continuing priority sector lending status for loans given by banks to MFIs has been referred to a committee under the chairmanship of V.K. Sharma, Executive Director of RBI and a report is expected shortly.
20. Samit Ghosh, CEO Ujjivan and Suresh Krishna, CEO of GFSPL during a discussion with AKMI made the point that the weekly instalment product is getting outdated and inconvenient for borrowers. They indicated that new products that fit customers better are required.
21. UTI Asset Management Company has been operat-ing a micropension product for the last three years.
22. New Pension Scheme Lite is a scheme that has no minimum contribution, designed for poor house-holds. More details available in Chapter 6 on savings.
23. Centre for Mircofinance, an academic and research institution, is from the IFMR group, based in Chen-nai.
24. The Social Performance Management—Pilot Im-pact Evaluation Study is carried as part of annual re-port 2009–10 of Ujjiwan Financial Services Private Limited, Bangalore.
25. In the last year’s report, the setting up of this network institution by commercial MFI-NBFCs was referred to. More details regarding its work are available in a later chapter on policy environment and regulation.
26. In fact, the problems related to what preceded the IPO (during the transformation process of SKS so-ciety in to NBFC) rather than the IPO itself.
27. ‘Global microscope on the microfinance business environment 2009’, pilot Study by Economist Intel-ligence Unit (EIU).
28. 2009 MIX Global 100: Ranking of Microfinance In-stitutions, www.themix.org.
nOTeS 1. The macroeconomic data are cited from First Quar-
ter Review of Monetary Policy 2010–11, Reserve Bank of India. July 2010.
2. The rainfall was deficient to the extent of 22 per cent last year.
3. Cited from provisional data of NABARD. The data had not been finalized and nor formally released till the finalization of the manuscript.
4. This data is also provisional, based on a press state-ment released by Mathew Titus, ED of Sadhan, car-ried in Business Standard (2 September 2010).
5. Provisional data made available by Sadhan, pending finalization of Quick Report.
6. ‘Selected Economic Indicators’, RBI Bulletin, August 2010.
7. In an excellent survey based study of Access to Fi-nance in Andhra Pradesh (2010), CMF has found that 13 per cent of SHG members had loans from MFIs. The SOS assumes the overlap at a lower 10 per cent as MF markets in other states are not as heavily borrowed.
8. The extent of multiple borrowing has been meticu-lously worked out over four locations in Karnataka by Karuna Krishnaswamy and Alejandro Ponce, CGAP. Further calculations based on their work showed that actual borrowers were 45590 for loan accounts reported of 69400, giving a ratio of 65 per cent borrowers to accounts. Details of this analysis are given later in the report Chapter 3.
9. Based on Mix market data for 77 MFIs for march 2010, www.themix.org; Sadhan provisional data car-ried in the press indicates an average of ` 6870, but requires verification. Hence, it has not been taken as the basis for comparison.
10. The data relating to SHG members has been updat-ed on the basis of latest data from NABARD. Com-mercial Banks Small Loan accounts was sourced from Basic Statistical Returns 2009, RBI; PACS data from National Federation of State Coopera-tive Banks dataset (www.nafscob.org) and MFI data from Sa-shan.
11. Loans up to ` 25000 ($550) are classified as small loans by RBI. Data sourced from Basic Statistical Re-turns of Banks 2009, RBI.
12. In Andhra Pradesh, the lead district managers of banks indicated that the default is about 15 per cent on SHG loans.
13. Side by Side Report (2009) of Sadhan.

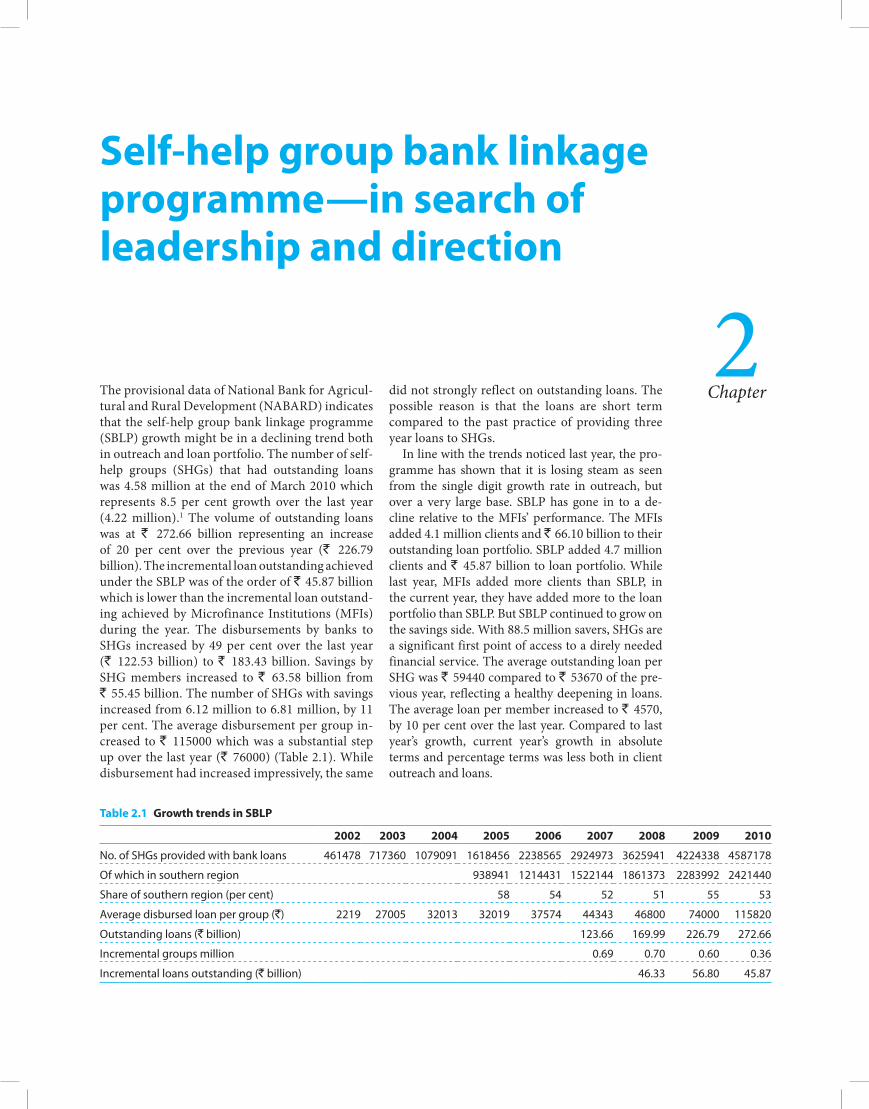
Self-help group bank linkage programme—in search of leadership and direction
The provisional data of National Bank for Agricul-tural and Rural Development (NABARD) indicates that the self-help group bank linkage programme (SBLP) growth might be in a declining trend both in outreach and loan portfolio. The number of self-help groups (SHGs) that had outstanding loans was 4.58 million at the end of March 2010 which represents 8.5 per cent growth over the last year (4.22 million).1 The volume of outstanding loans was at ` 272.66 billion representing an increase of 20 per cent over the previous year (` 226.79 billion). The incremental loan outstanding achieved under the SBLP was of the order of ` 45.87 billion which is lower than the incremental loan outstand-ing achieved by Microfinance Institutions (MFIs) during the year. The disbursements by banks to SHGs increased by 49 per cent over the last year (` 122.53 billion) to ` 183.43 billion. Savings by SHG members increased to ` 63.58 billion from ` 55.45 billion. The number of SHGs with savings increased from 6.12 million to 6.81 million, by 11 per cent. The average disbursement per group in-creased to ` 115000 which was a substantial step up over the last year (` 76000) (Table 2.1). While disbursement had increased impressively, the same
did not strongly reflect on outstanding loans. The possible reason is that the loans are short term compared to the past practice of providing three year loans to SHGs.
In line with the trends noticed last year, the pro-gramme has shown that it is losing steam as seen from the single digit growth rate in outreach, but over a very large base. SBLP has gone in to a de-cline relative to the MFIs’ performance. The MFIs added 4.1 million clients and ` 66.10 billion to their outstanding loan portfolio. SBLP added 4.7 million clients and ` 45.87 billion to loan portfolio. While last year, MFIs added more clients than SBLP, in the current year, they have added more to the loan portfolio than SBLP. But SBLP continued to grow on the savings side. With 88.5 million savers, SHGs are a significant first point of access to a direly needed financial service. The average outstanding loan per SHG was ` 59440 compared to ` 53670 of the pre-vious year, reflecting a healthy deepening in loans. The average loan per member increased to ` 4570, by 10 per cent over the last year. Compared to last year’s growth, current year’s growth in absolute terms and percentage terms was less both in client outreach and loans.
Table 2.1 Growth trends in SBLP
2002 2003 2004 2005 2006 2007 2008 2009 2010
No. of SHGs provided with bank loans 461478 717360 1079091 1618456 2238565 2924973 3625941 4224338 4587178
Of which in southern region 938941 1214431 1522144 1861373 2283992 2421440
Share of southern region (per cent) 58 54 52 51 55 53
Average disbursed loan per group (`) 2219 27005 32013 32019 37574 44343 46800 74000 115820
Outstanding loans (` billion) 123.66 169.99 226.79 272.66
Incremental groups million 0.69 0.70 0.60 0.36
Incremental loans outstanding (` billion) 46.33 56.80 45.87
2Chapter

14 MICROFINANCE INDIA
SavinGS Performance of SHGs
One of redeeming features during the current year was a substantial increase in the number of SHGs that saved with the banking system. As at the end of March 2009, 6.12 million groups had saved their surpluses with banks. At the end of March 2010, the number of groups that saved increased to 6.81 mil-lion. Savings by SHGs increased by ` 81.24 billion, that is, by 14.6 per cent over the last year (Table 2.2). The continuing growth in savings over the years is a reflection of how this opportunity is valued by the poor.
Of the amounts saved, a lion’s share was saved with the commercial banks. 58 per cent of SHGs’ savings were with commercial banks at an average of ` 9060 per group. In case of commercial banks, the average per group savings increased by 16 per cent. Regional Rural Banks (RRBs) had a share of 20 per cent of SHG savings (Figure 2.1). There is a decline in the average savings per group in case of RRBs from the last year’s ` 12400 to ` 7700. Co-operatives put in a good performance, raising their share of SHG savings from 14 per cent last year to 22 per cent in the current year (Figure 2.2). The aver-age savings per group with cooperatives increased by 50 per cent over last year’s level (` 8020).
Among the states, Andhra Pradesh had the maxi-mum savings mobilization at ` 12.54 billion fol-lowed by Tamil Nadu (` 8.97 billion), Karnataka (` 6.27 billion), Maharashtra (` 538.62 billion) and Kerala (` 375.58 billion). The average savings per group among mainstream states (with at least 25000
SHGs) was the highest in Gujarat at ` 19410 fol-lowed by Uttarakhand, Bihar, Karnataka and Tamil Nadu. Andhra Pradesh did not have a high savings average compared to many other states. Part of the reason is that savings made by groups are placed in fixed deposits with banks. The savings data pre-sented is confined to amounts placed in savings ac-counts with banks. Part of the savings of SHGs are used for lending among the group members. This data is not collected and hence it is difficult to get an idea of the total amount of savings of members. Suffice to conclude that savings of SHGs are more than what is seen as placed with banks. In a subse-quent chapter, more analysis of the issues in relation to savings through SHGs are carried.
reGionaL SPread of THe LendinG ProGramme
In the case of borrowing groups, the region-wise distribution has undergone a moderate change. The trends seen in the last year of a more decentralized distribution of growth of SHG credit linkage has continued. Southern region’s share of SHGs declined to 52.8 per cent but still it retained its dominant po-sition. This represented a 1.2 per cent decline in share over the previous year’s level. The central re-gion recorded an increase of 2.9 per cent in share over last year (Table 2.3). Western region recorded a marginal increase in share, but other regions had marginally reduced shares.
North and northeast regions recorded a decline in absolute number of groups that had outstand-ing loans. The reason for this could be that repeat
Commercial Banks
Regional Rural BanksCooperative Banks60%
24%
16%
figure 2.1 Shares of different types of banks in number of saving SHGs
Commercial Banks
Regional Rural BanksCooperative Banks58%
20%
22%
figure 2.2 Shares of different types of banks in amounts saved by SHGs
Table 2.2 Savings performance of SHGs
Savings of SHGs placed with banks
no. of SHGs amount saved (` million) average savings per SHG (`) 2010agency 2008 2009 2010 2008 2009 2010
Commercial Banks 2810750 3549509 4062822 20777.3 27729.9 36812.7 9060
Regional Rural Banks 1386838 1628588 1646059 11664.9 19897.5 12697.7 7714
Cooperative Banks 812206 643050 1108870 5411.7 7828.8 14069.8 12688
Total 5009794 6121147 6817751 37853.9 55456.2 63580.2 9325

Self-help group bank linkage programme—in search of leadership and direction 15
loans are not available to SHGs after repayment of the earlier loans. Comparatively, in southern region, there is considerable pressure from state authori-ties for lending to SHGs. Hence, the repeat loan ratios are higher and could account for the higher share. When groups are initially linked, banks incur costs of establishing familiarity with the group and completing initial documentation. To discontinue services to once linked groups is a loss in material terms to the bank, unless it is for reasons of risk and credit worthiness. Even in a state like Andhra Pradesh, SHG loans tend to be disbursed in the last quarter of the year by banks in pursuit of their prior-ity sector lending targets. The seasonality associated activities of groups is not a consideration in lending. These are aspects that need further study, especially by NABARD. A cross-region comparison of repeat loan processes would be useful and it should be sup-ported by a study of attitudes of branch managers in relation to repeat loans.
A comparison across states throws up no sur-prise. Andhra Pradesh had a marginally higher share of number of groups and loans from banks. It had 29 per cent of groups and 39 per cent of loans outstanding. In terms of number of SHGs, Andhra Pradesh was followed by Tamil Nadu (12 per cent), West Bengal (9 per cent), Maharashtra (7 per cent) and Orissa (7 per cent). Andhra Pradesh had the largest share of SHG loans (Table 2.4). It was fol-lowed by Tamil Nadu (14 per cent), Uttar Pradesh (6 per cent), Karnataka (6 per cent) and Orissa (5 per cent). The average loans were the highest in Andhra Pradesh at ` 79000 per SHG. The lowest average loans were in Gujarat, West Bengal, Tamil Nadu and Maharashtra. The average loan per group in these states was less than ` 30000, implying that the average member loan outstanding was a meagre ` 3000.
Banks normally fix the credit limit on the basis of the savings mobilized by the groups. Credit to savings ratio is useful in understanding the state specific factors in credit decisions. Gujarat had a low ratio of 1, which implied that banks gave loans that were equivalent to savings. West Bengal, Tamil Nadu, Kerala and Maharashtra had low credit to savings ratios of 3 and 4 (see Annex 2.1 for state-wise information of credit to savings ratio). On an average, the loans in these states were up to four multiples of savings of SHGs. Considering that these four states have a long history of linkage banking, the bankers’ approach to credit decisions seems conservative. Andhra Pradesh had a high ra-tio of 9. Northeastern states had even higher credit to savings ratio of more than 10 with some having more than 20.
NABARD had identified 13 priority states and the northeastern region for giving a fillip to mi-crofinance activities. In some of the states, the pro-gramme had paid dividends. The state-wise trends indicate that the year on year (YOY) variability is too high to come to conclusions that SBLP is ma-turing in some of the states outside the southern region. One of the reasons could be the provisional nature of data, which when finalized, could change the direction of analysis and conclusions. But it is
Table 2.4 Top states in SHG linkage (no. of groups) in 2009–10
name of stateGroups with
o/s loansPer cent
shareLoans o/s
(` mn)Per cent
share
Andhra Pradesh 1331596 24.7 105584.9 38.7
Tamil Nadu 562275 12.3 38990 14.3
West Bengal 506496 9.4 13260.8 4.9
Maharashatra 365540 6.8 10555.5 3.9
Orissa 357041 6.6 14797.1 5.4
Table 2.3 regional shares in linkage
SHGs linked 2007
SHGs with o/s loan 2008
SHGs with o/s loan 2009
SHGs with o/s loan 2010
GroupsPer cent
share GroupsPer cent
share GroupsPer cent
share GroupsPer cent
share
Northern Region 182018 6 134783 3.8 166511 3.9 158829 3.5
Northeastern Region 91754 3 103424 2.9 117812 2.8 85276 1.9
Eastern Region 525881 18 753048 20.8 933489 22.1 985094 21.5
Central Region 332729 11 326763 9.0 332116 7.9 497340 10.8
Western Region 270447 9 446550 12.3 393499 9.3 439199 9.6
Southern Region 1522144 52 1861373 51.3 2280911 54 2421440 52.8
All regions 2924973 100 3625941 100 4224338 100 4587178 100
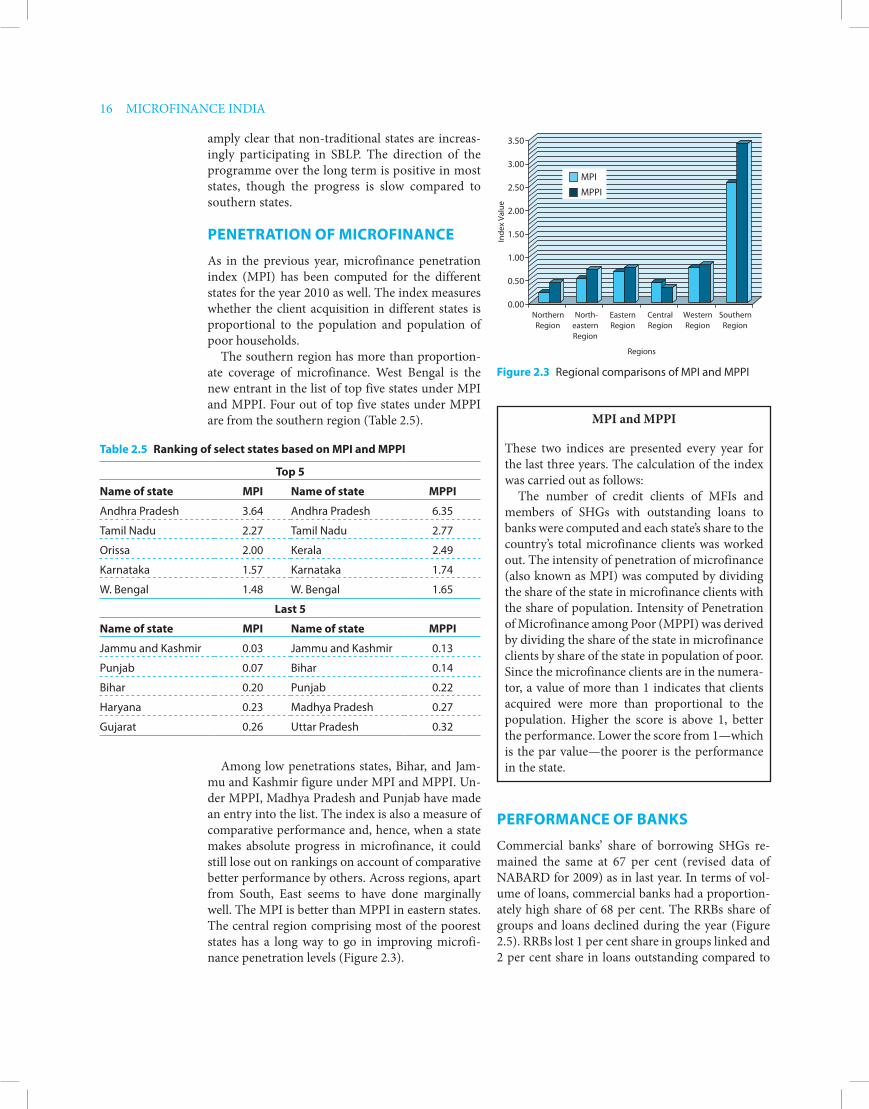
16 MICROFINANCE INDIA
amply clear that non-traditional states are increas-ingly participating in SBLP. The direction of the programme over the long term is positive in most states, though the progress is slow compared to southern states.
PeneTraTion of microfinance
As in the previous year, microfinance penetration index (MPI) has been computed for the different states for the year 2010 as well. The index measures whether the client acquisition in different states is proportional to the population and population of poor households.
The southern region has more than proportion-ate coverage of microfinance. West Bengal is the new entrant in the list of top five states under MPI and MPPI. Four out of top five states under MPPI are from the southern region (Table 2.5).
Performance of BankS
Commercial banks’ share of borrowing SHGs re-mained the same at 67 per cent (revised data of NABARD for 2009) as in last year. In terms of vol-ume of loans, commercial banks had a proportion-ately high share of 68 per cent. The RRBs share of groups and loans declined during the year (Figure 2.5). RRBs lost 1 per cent share in groups linked and 2 per cent share in loans outstanding compared to
MPI and MPPI
These two indices are presented every year for the last three years. The calculation of the index was carried out as follows:
The number of credit clients of MFIs and members of SHGs with outstanding loans to banks were computed and each state’s share to the country’s total microfinance clients was worked out. The intensity of penetration of microfinance (also known as MPI) was computed by dividing the share of the state in microfinance clients with the share of population. Intensity of Penetration of Microfinance among Poor (MPPI) was derived by dividing the share of the state in microfinance clients by share of the state in population of poor. Since the microfinance clients are in the numera-tor, a value of more than 1 indicates that clients acquired were more than proportional to the population. Higher the score is above 1, better the performance. Lower the score from 1—which is the par value—the poorer is the performance in the state.
Table 2.5 ranking of select states based on mPi and mPPi
Top 5
name of state mPi name of state mPPi
Andhra Pradesh 3.64 Andhra Pradesh 6.35
Tamil Nadu 2.27 Tamil Nadu 2.77
Orissa 2.00 Kerala 2.49
Karnataka 1.57 Karnataka 1.74
W. Bengal 1.48 W. Bengal 1.65
Last 5
name of state mPi name of state mPPi
Jammu and Kashmir 0.03 Jammu and Kashmir 0.13
Punjab 0.07 Bihar 0.14
Bihar 0.20 Punjab 0.22
Haryana 0.23 Madhya Pradesh 0.27
Gujarat 0.26 Uttar Pradesh 0.32
Among low penetrations states, Bihar, and Jam-mu and Kashmir figure under MPI and MPPI. Un-der MPPI, Madhya Pradesh and Punjab have made an entry into the list. The index is also a measure of comparative performance and, hence, when a state makes absolute progress in microfinance, it could still lose out on rankings on account of comparative better performance by others. Across regions, apart from South, East seems to have done marginally well. The MPI is better than MPPI in eastern states. The central region comprising most of the poorest states has a long way to go in improving microfi-nance penetration levels (Figure 2.3).
figure 2.3 Regional comparisons of MPI and MPPI
0.00
0.50
1.00
1.50
2.00
2.50
3.00
3.50
Northern
Inde
x Va
lue
RegionNorth-
easternRegion
EasternRegion
Regions
CentralRegion
WesternRegion
SouthernRegion
MPI
MPPI
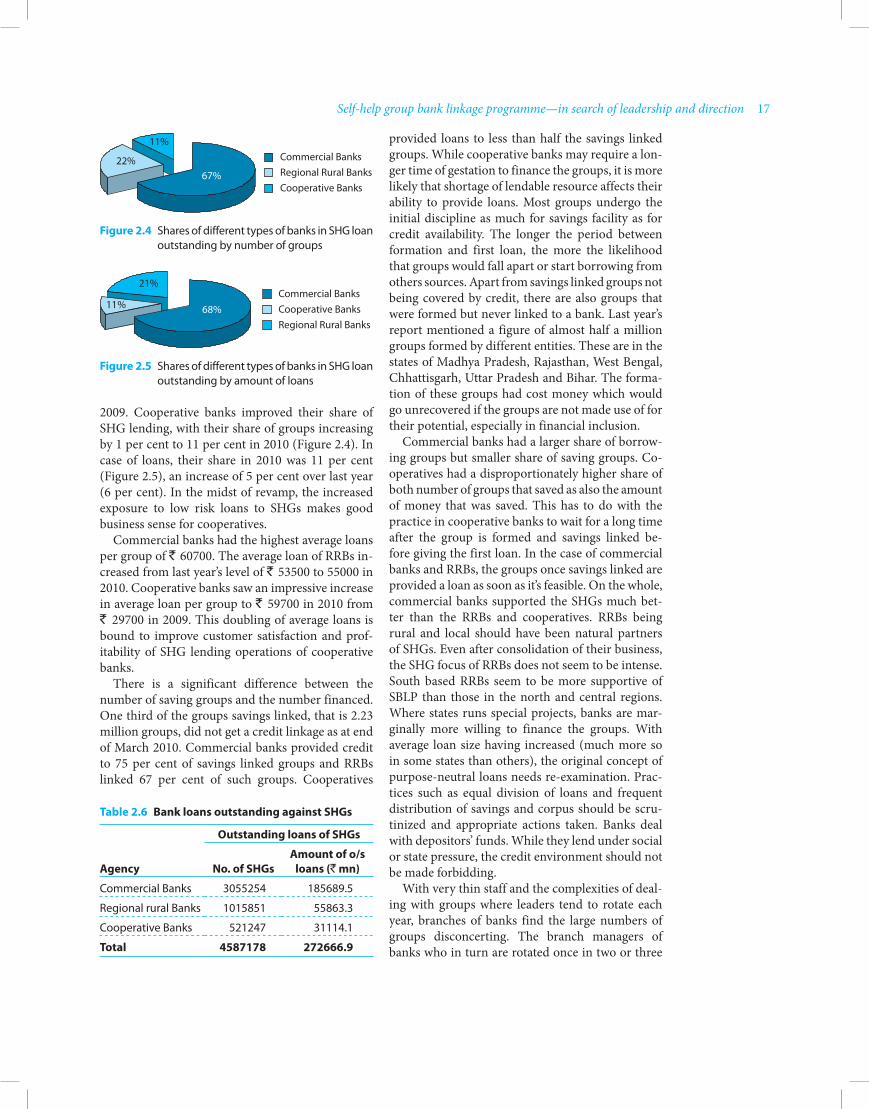
Self-help group bank linkage programme—in search of leadership and direction 17
2009. Cooperative banks improved their share of SHG lending, with their share of groups increasing by 1 per cent to 11 per cent in 2010 (Figure 2.4). In case of loans, their share in 2010 was 11 per cent (Figure 2.5), an increase of 5 per cent over last year (6 per cent). In the midst of revamp, the increased exposure to low risk loans to SHGs makes good business sense for cooperatives.
Commercial banks had the highest average loans per group of ` 60700. The average loan of RRBs in-creased from last year’s level of ` 53500 to 55000 in 2010. Cooperative banks saw an impressive increase in average loan per group to ` 59700 in 2010 from ` 29700 in 2009. This doubling of average loans is bound to improve customer satisfaction and prof-itability of SHG lending operations of cooperative banks.
There is a significant difference between the number of saving groups and the number financed. One third of the groups savings linked, that is 2.23 million groups, did not get a credit linkage as at end of March 2010. Commercial banks provided credit to 75 per cent of savings linked groups and RRBs linked 67 per cent of such groups. Cooperatives
provided loans to less than half the savings linked groups. While cooperative banks may require a lon-ger time of gestation to finance the groups, it is more likely that shortage of lendable resource affects their ability to provide loans. Most groups undergo the initial discipline as much for savings facility as for credit availability. The longer the period between formation and first loan, the more the likelihood that groups would fall apart or start borrowing from others sources. Apart from savings linked groups not being covered by credit, there are also groups that were formed but never linked to a bank. Last year’s report mentioned a figure of almost half a million groups formed by different entities. These are in the states of Madhya Pradesh, Rajasthan, West Bengal, Chhattisgarh, Uttar Pradesh and Bihar. The forma-tion of these groups had cost money which would go unrecovered if the groups are not made use of for their potential, especially in financial inclusion.
Commercial banks had a larger share of borrow-ing groups but smaller share of saving groups. Co-operatives had a disproportionately higher share of both number of groups that saved as also the amount of money that was saved. This has to do with the practice in cooperative banks to wait for a long time after the group is formed and savings linked be-fore giving the first loan. In the case of commercial banks and RRBs, the groups once savings linked are provided a loan as soon as it’s feasible. On the whole, commercial banks supported the SHGs much bet-ter than the RRBs and cooperatives. RRBs being rural and local should have been natural partners of SHGs. Even after consolidation of their business, the SHG focus of RRBs does not seem to be intense. South based RRBs seem to be more supportive of SBLP than those in the north and central regions. Where states runs special projects, banks are mar-ginally more willing to finance the groups. With average loan size having increased (much more so in some states than others), the original concept of purpose-neutral loans needs re-examination. Prac-tices such as equal division of loans and frequent distribution of savings and corpus should be scru-tinized and appropriate actions taken. Banks deal with depositors’ funds. While they lend under social or state pressure, the credit environment should not be made forbidding.
With very thin staff and the complexities of deal-ing with groups where leaders tend to rotate each year, branches of banks find the large numbers of groups disconcerting. The branch managers of banks who in turn are rotated once in two or three
Table 2.6 Bank loans outstanding against SHGs
outstanding loans of SHGs
agency no. of SHGsamount of o/s
loans (` mn)
Commercial Banks 3055254 185689.5
Regional rural Banks 1015851 55863.3
Cooperative Banks 521247 31114.1
Total 4587178 272666.9
Commercial BanksRegional Rural BanksCooperative Banks
22%
11%
67%
figure 2.4 Shares of different types of banks in SHG loan outstanding by number of groups
figure 2.5 Shares of different types of banks in SHG loan outstanding by amount of loans
Commercial Banks
Regional Rural BanksCooperative Banks68%11%
21%

18 MICROFINANCE INDIA
years have a learning curve which is not easily ad-dressed by the training and skill building exercises that are on offer. NABARD has been continuously trying to improve the sensitivity and familiarity of manpower in the rural branches to SHG lending by arranging yearly programmes right from the block level. In fact, Block Level Bankers Committee (BLBC) meetings are many times converted into a training course by taking the branch managers out on a field visit to a good working SHG and follow-ing up the same with a discussion on issues in group formation, financing and monitoring. These exer-cises have been continuing for quite long with the result they have perhaps become routine.
A long running programme involving large num-bers can run only on the shoulders of an enthusiastic and motivated human resource force. Such motivat-ed working is conspicuous neither in NABARD nor in the commercial banking system. This is under-standable because the programme which was once novel and exciting when it brought the power of mobilization to the financial sector is ubiquitous today. The NGOs working in the field with mis-sionary zeal in the early stages of a programme have had several incursions into what they believe to be their exclusive territory. Government agencies and contracted staff of different government depart-ments, banks and others have entered the field to form groups. The quality of such groups is mixed. In most cases, groups formed without professional inputs have not been able to sustain the financial content of the model. Further, after formation and initial linkage the kind of handholding that was re-quired to ensure that the group functioned within the framework of group discipline and financial dis-cipline has been absent. The handholding support was available in the initial stages of programme, when funders and NABARD were able to satisfy the resource needs of the then smaller number of groups. Even as recently as about three years back, NGOs, state governments and banks joined hands together to ensure that the groups remain a strong force. With the advent of several government pro-grammes and the ambitious plans for delivery of development interventions through these groups, the influence of both NGOs and the banks has loos-ened. This loss of professional inputs to SHGs and the increasing hold of government agencies over the groups have cost the programme dearly in terms of lax discipline and rising default rates. The gov-ernment programmes normally involve minimal interaction between the technical personnel of the government and the groups. It has more to do with fulfilling documentation necessary to deliver the benefits that are to be delivered. Even in the best of
programmes run by states, the apathy towards the groups’ needs is evident.
With a large number of groups having come in the existence and linked with the banking system, second order problems of servicing such a large number of accounts on a continuing basis has cropped up. In order to provide more than finan-cial services and enabling groups to take up quality livelihood activities either as groups or as individu-als in accordance with their ability and capacities, higher level institutions are being set up. NABARD has stated that the next generation issues of SHGs would be addressed through establishment of live-lihood generation activities and micro-enterprise integrated with marketing through the mechanism of SHG federations. The SHG federations, accord-ing to NABARD, are a viable exit route for hand-holding NGOs. There is still no policy support for financial intermediation role of federations. For non-financial federations there are very few proven models for cost recovery. Usually, both Myrada2 and Dhan3 models are considered to be difficult to replicate, since the managerial inputs under both these models are of high quality and unique. Suc-cessful models of federations in different states are to be studied so that standardized models that could operate across the country could be designed. But there are states (Madhya Pradesh, for example) where despite separate legislation on Independent Cooperatives (MACS) being in place, it has been difficult to register SHG federations under this law. The federations in many cases are set up as Societ-ies, which is not a suitable form for handling large finances and governance of widely spread member base. Annex 2.3 provides state-wise information on SHG federations.
On the qualitative aspects of SHG lending, the most notable concern has been the increased levels of default. A discussion with the lead district man-gers in Andhra Pradesh4 revealed that there is a huge difference between recovery data reported through government channels and through the banking sys-tems. Banks typically mentioned recovery levels of between 80 per cent and 85 per cent of loans. On an outstanding loan level of more than ` 100 billion in the state of Andhra Pradesh, a 15 per cent de-fault is highly significant. In the case of loans given to Swarna Jayanti Gram Swarozgar Yojana (SGSY) groups, the default levels are even higher. While SHGs maintain a default free track record with their bank, repayment of intra-group loans out of the members’ corpus is frequently defaulted. The repay-ment rates on internal loans within the groups are reported to be as low as 35 per cent to 40 per cent. The tendency to default is alarming. In the current

Self-help group bank linkage programme—in search of leadership and direction 19
year, the data on repayments is yet to be released and, hence, data based analysis of defaults has not been carried in the report. The reason for tolerance of relatively higher defaults should be studied. On agricultural loans, which are a substantial part of the bank’s portfolio (as much as 18 per cent), the repayment rates reported are around 76 per cent. In comparison, SHG loans are better with recover-ies of 85 per cent. Further, the loan volume is much smaller compared to agricultural loans (outstanding SHG loans of banks formed 0.84 per cent of total bank credit as of end March 2010). High defaults in a small portfolio perhaps do not show up in the warning systems of banks.
In Andhra Pradesh, an experiment of total fi-nancial inclusion through the SHGs is being tried out. The groups had been given large loans (up to ` 0.75 million) so that they can discharge all their other loan liabilities and replace it with the low cost loans from the banking system. Loan uti-lization visits showed that SHG members actually discharged the other loans taken at higher rates of interest. A follow-up visit by banks nine to 15 months later revealed that many SHG members have incurred new debts outside the SHGs. The debt intensity in such cases increased beyond rea-sonable levels.
A further problem that came to notice during field visits is the equal distribution of bank loans among members. This equal distribution of loans to all the members results in some members being under-funded and many members receiving exces-sive loans. For want of enterprise ideas, members re-lend these loans to other members as also persons in the village. The implication is that members of SHGs without enterprise ideas turn in to moneylenders. Banks provide loans to SHGs without asking for the purpose in most cases on account of the belief that SHGs take informed credit decisions after examin-ing the members’ requirements as also creditwor-thiness. But equal distribution of loans among all group members rules out the possibility of informed decisions on credit. With neither banks carrying out appraisal of loans to groups (which could be as high as ` 0.75 million) nor the groups exercising their judgement, these loans carry high risk potential. The original idea of providing freedom to the group to decide on credit allocation to members does not seem to be functional anymore due to the large size of loans and groups failing to perform their role. In future, banks would be well advised to enquire in to the purpose and carry out proper appraisal of loans to SHGs if the size exceeds a certain threshold.
A study by the Centre for Microfinance (CMF)5 found that most of the friends’ loans given in Andhra
Pradesh are priced. 57.3 per cent of surveyed house-holds borrowed from friends at a price while 9 per cent households took interest-free loans from friends. The availability of loans through groups has led to emergence of a new class of moneylenders. The need for generating an income out of the loan coming from the SHGs, especially for a large major-ity of members without any other enterprise ideas or skills, has made them take what they saw as an easy option. The CMF study made several interest-ing observations about the SHGs and their members in terms of access to finance (see Box below).
Findings of A2F study in Andhra Pradesh relating to SHGs
Seventy-two per cent households had a member-ship with a SHG.
Eighty-seven per cent groups met regularly.Seventy-four per cent groups reported no drop
outs. The mean age of SHG that had no drop outs was 4.4 years. 11.5 per cent of groups reported having one drop out.
The savings performance was strong. Ninety-nine per cent groups reported regular saving of at least ` 50 per month.
Principal loans availed by members increased significantly with number of years the SHG is in existence.
Seventy-two per cent of SHG members had an outstanding loan.
Eighty-nine per cent of surveyed groups that were ever linked with credit had an outstanding loan.
Within these groups 96 per cent members had a loan from the SHG.
8.6 per cent households had two or more SHG loans.
SHG loans were used mostly for non-income generating purposes. Top uses of loans by SHG members are for repayment of old debt (20.4 per cent), purchase of agricultural inputs (19.3 per cent), health (18 per cent) and home improve-ment (13 per cent). Only 25.4 per cent was ap-plied on income generating activities. Pure con-sumption accounted for 49.9 per cent of loans.
Thirteen per cent of SHG members were also part of at least one JLG. Dual membership seemed to be for immediate loan needs.
Eighty-eight per cent groups reported no de-faulting members.
Ninety-five per cent of the groups were formed by government agencies. But only 2 per cent of the groups had received SGSY subsidy.
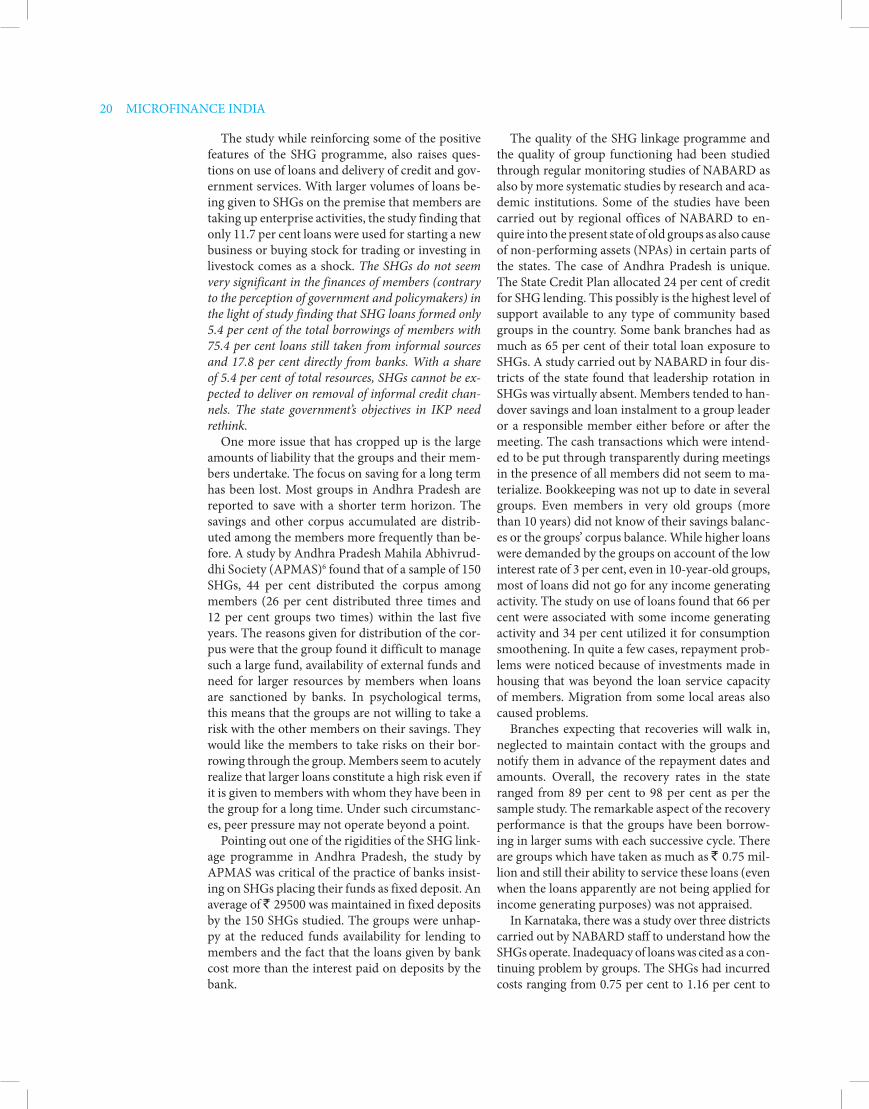
20 MICROFINANCE INDIA
The study while reinforcing some of the positive features of the SHG programme, also raises ques-tions on use of loans and delivery of credit and gov-ernment services. With larger volumes of loans be-ing given to SHGs on the premise that members are taking up enterprise activities, the study finding that only 11.7 per cent loans were used for starting a new business or buying stock for trading or investing in livestock comes as a shock. The SHGs do not seem very significant in the finances of members (contrary to the perception of government and policymakers) in the light of study finding that SHG loans formed only 5.4 per cent of the total borrowings of members with 75.4 per cent loans still taken from informal sources and 17.8 per cent directly from banks. With a share of 5.4 per cent of total resources, SHGs cannot be ex-pected to deliver on removal of informal credit chan-nels. The state government’s objectives in IKP need rethink.
One more issue that has cropped up is the large amounts of liability that the groups and their mem-bers undertake. The focus on saving for a long term has been lost. Most groups in Andhra Pradesh are reported to save with a shorter term horizon. The savings and other corpus accumulated are distrib-uted among the members more frequently than be-fore. A study by Andhra Pradesh Mahila Abhivrud-dhi Society (APMAS)6 found that of a sample of 150 SHGs, 44 per cent distributed the corpus among members (26 per cent distributed three times and 12 per cent groups two times) within the last five years. The reasons given for distribution of the cor-pus were that the group found it difficult to manage such a large fund, availability of external funds and need for larger resources by members when loans are sanctioned by banks. In psychological terms, this means that the groups are not willing to take a risk with the other members on their savings. They would like the members to take risks on their bor-rowing through the group. Members seem to acutely realize that larger loans constitute a high risk even if it is given to members with whom they have been in the group for a long time. Under such circumstanc-es, peer pressure may not operate beyond a point.
Pointing out one of the rigidities of the SHG link-age programme in Andhra Pradesh, the study by APMAS was critical of the practice of banks insist-ing on SHGs placing their funds as fixed deposit. An average of ` 29500 was maintained in fixed deposits by the 150 SHGs studied. The groups were unhap-py at the reduced funds availability for lending to members and the fact that the loans given by bank cost more than the interest paid on deposits by the bank.
The quality of the SHG linkage programme and the quality of group functioning had been studied through regular monitoring studies of NABARD as also by more systematic studies by research and aca-demic institutions. Some of the studies have been carried out by regional offices of NABARD to en-quire into the present state of old groups as also cause of non-performing assets (NPAs) in certain parts of the states. The case of Andhra Pradesh is unique. The State Credit Plan allocated 24 per cent of credit for SHG lending. This possibly is the highest level of support available to any type of community based groups in the country. Some bank branches had as much as 65 per cent of their total loan exposure to SHGs. A study carried out by NABARD in four dis-tricts of the state found that leadership rotation in SHGs was virtually absent. Members tended to han-dover savings and loan instalment to a group leader or a responsible member either before or after the meeting. The cash transactions which were intend-ed to be put through transparently during meetings in the presence of all members did not seem to ma-terialize. Bookkeeping was not up to date in several groups. Even members in very old groups (more than 10 years) did not know of their savings balanc-es or the groups’ corpus balance. While higher loans were demanded by the groups on account of the low interest rate of 3 per cent, even in 10-year-old groups, most of loans did not go for any income generating activity. The study on use of loans found that 66 per cent were associated with some income generating activity and 34 per cent utilized it for consumption smoothening. In quite a few cases, repayment prob-lems were noticed because of investments made in housing that was beyond the loan service capacity of members. Migration from some local areas also caused problems.
Branches expecting that recoveries will walk in, neglected to maintain contact with the groups and notify them in advance of the repayment dates and amounts. Overall, the recovery rates in the state ranged from 89 per cent to 98 per cent as per the sample study. The remarkable aspect of the recovery performance is that the groups have been borrow-ing in larger sums with each successive cycle. There are groups which have taken as much as ` 0.75 mil-lion and still their ability to service these loans (even when the loans apparently are not being applied for income generating purposes) was not appraised.
In Karnataka, there was a study over three districts carried out by NABARD staff to understand how the SHGs operate. Inadequacy of loans was cited as a con-tinuing problem by groups. The SHGs had incurred costs ranging from 0.75 per cent to 1.16 per cent to

Self-help group bank linkage programme—in search of leadership and direction 21
The proportion of financially secure families doubled when compared with 2004. But the number of highly insecure families that were existent in 2004 more than doubled by 2009. In 2004, the highest pro-portion of families was on the dividing line between poor and non-poor.
By 2009 the people who were on the border in 2004 (wealth range between ` [–] 1999 and [+] 1999) had moved either up or down leaving very few people stranded on the margin. One of the main reasons why the poor families could not eas-ily come above the poverty line is the incidence of bulky expenditures related to lifecycle. There were ceremonies to celebrate (birth, death or religious functions) or major health related problems requir-ing prolonged and expensive treatment. Twenty-six per cent families had such big problems within the previous five years. Fourty-eight per cent of these families reported that they had to perform ceremo-nies costing an average of ` 66720. Eleven per cent families reported that they made investments on an average to the tune of ` 31440 per household. Nine per cent of the interviewed households had taken loans for education of their children. Of 35.4
get their loans sanctioned. What was heartening was the fact that 96 per cent of the members covered by the study reported that they do not borrow from moneylenders any more. An in-depth study of how the groups managed their finances might reveal valu-able insights. The repayment ranged from 82 per cent in Bagalkot district to 100 per cent in Mysore at the time of maturity of loan. But maintaining repayment on due dates of instalments was difficult for the groups on account of their uneven cash flows. The SHGs expressed that lack of a meeting place was a major problem. Twenty-two per cent SHGs in Mysore felt that the regular meetings are not useful and do not serve any purpose. As in the case of Andhra Pradesh, bookkeeping was neither regular nor up to date and not verified. Many members took to moneylending as an activity with the help of loans obtained from the groups.
The NABARD Regional Office in Karnataka had also carried out a study of defaults by SHGs in seven districts. While the NPA levels were not alarmingly high according to the study, there were very good reasons why the repayments were not at a higher level. The office bearers of the groups tended to cor-ner a larger proportion of the loans and later default. Some members with the past history of default took loans in the name of their friends and relatives af-ter persuading them to enrol into groups. In a few locations, households clearly above the poverty line and spouses of government officials joined the groups and cornered the loans. Subsequently they failed to repay, putting pressure on the group and the bank. In some locations, the loans were being distributed equally because of insufficiency of the loan sanc-tioned by the bank. This led to under-financing of a large number of borrowers who in turn could not generate cash flows sufficient to meet repayment instalments. Banks on their part have been giving larger loans (as much as four times of the savings) in the initial period itself without an assessment of the groups’ strengths. An expectation of loan waiver kept some of the groups from repaying their dues. On account of multiple lending that existed in these locations, people were asked as to which loans they prioritize for repayment. MFIs loans were priori-tized for early repayment on account of its higher interest rates. The reasons offered for default in re-payments were lack of follow up from bank and mi-gration of borrowers.
There were a few impact studies carried out by ex-ternal agencies. An interesting study was carried out by a group of researchers on behalf of RuMe.7 The study covered 495 households in Tamil Nadu over a five-year period with surveys at three intervals (in
2004, in 2006 and in 2009). The study tried to make a comparison of the wealth and assets of households while enrolling for the programme in 2004 and sub-sequently in 2009. The study found that 71 per cent of households had increased their assets over the five year period. Twenty-two per cent of the house-holds were poorer having lost some of their assets. In 7 per cent households, there was no change in the financial position. The study found that quite a few members invested their money in gold as a hedge against risk and a facile means of raising liquidity in case of an emergent need. The investment in gold paid rich dividend as price of gold increased by 2.8 times between 2004 and 2009. Gold as a percentage of value of assets held by SHG members was 70 per cent in 2009 when compared with just 51 per cent in 2004 (Table 2.7).
Table 2.7 comparison of net wealth of households 2004–09
Per cent of households
Wealth range of household (`)* 2004 2009
(-)20,000 and less 9.9 20.0
Between(-)2.000 and (-)20,000 21.3 23.0
Between(-)1,999 and (+)1,999 35.4 10.9
Between(+)2,000 and (+)20,000 22.8 25.8
20,000 and more 10.6 20.3
* All monetary values are in index price 2009, in Rupees, survey sample 495 households.
22 MICROFINANCE INDIA
per cent people in the poverty margin, 11.7 per cent improved their assets, 11.8 per cent lost their as-sets and 10.9 per cent remained where they were. The impact of SHG linkage on poor households is not conclusive. The proportion of families that had moved up and moved down was almost the same!
Another study8 did a quantitative analysis of the extent of access to finance achieved by households that were part of SHGs. On a randomly selected sample of 240 households (140 with SHG member-ship and 100 without SHG membership), the study found that SBLP has increased the flow of institu-tional credit to landless and marginal farm house-holds, and discouraged non-institutional borrowing through thrift creation. Financial inclusion index was computed for each household to measure the degree of financial inclusion. The proportion of households that reached the medium and high de-gree of financial inclusion, increased with the size of the land holding. The proportion of households, which reached the higher degree of financial in-clusion, was relatively more among SHG member households compared to non-member households. The study found that…
…it could be inferred that the degree of financial inclusion could be increased with implementation of SHG-Bank linkage programme. Though the per-centage of households that reached the medium and high degree of financial inclusion is relatively more among the SHG member households compared to non-member households in all the farm size groups, the chi-square value (×2) was found to be statistical-ly significant only for landless, marginal and small farm size category.
The conclusion was that SBLP increased the de-gree of financial inclusion among landless, marginal and small farm size category but not so much in the other farm size category.
An impact study9 of SHGs covering 878 house-holds across 63 groups in Karnataka and Tamil Nadu drew the following significant conclusion. The most striking evidence is the presence of mon-eylenders in areas where the programme has been in existence for a longer time. This should not re-ally be seen as a red-flag. Instead this should be seen as a positive sign. It is important to realize that any financial services programme that is for-mally run will have its limitations on the amount of resources available, the systems and procedures to be followed, and the hierarchy of purposes that are deemed desirable for lending. Therefore, there are bound to be unmet needs of the households that may be covered by informal arrangements including that of the moneylender. The programme should be
deemed successful if it has succeeded in providing a credible alternative to the households. The proof of such a phenomenon is seen by the way the alterna-tive channels behave. In general, we have found that the moneylenders tend to reduce their interest rates and turn out to be a bit more flexible where the mi-crofinance activities are strong, and we find this even in the current study. Therefore, it is important for any ideologically driven organization to recognize the complexity of the service needs and accept, but affect the institution of the moneylender. The suc-cess of the programme is not in eliminating exist-ing structures, but in influencing them to be more reasonable and customer oriented, through effective competition.
roLe of naBard
NABARD’s role in the SHG movement had been hailed in the past for the vision, strategies and an innovative spirit. NABARD had embarked upon this journey of mobilizing poor people into groups and harnessing their power in groups to set up a financial architecture that reached the hinterland in the rural areas. For the current year, according to U.C. Sarangi, Chairman, NABARD will concen-trate ‘on maintaining and improving the quality of SHGs to ensure their sustainability and enabling their graduation to micro enterprises.’ Apart from capacity building support, NABARD has provided long term liquidity to banks (refinance) to incen-tivize their lending to SHGs. During the last year, the Microfinance Development and Equity Fund (MFDEF) available with NABARD has been uti-lized to the extent of ` 809.1 million during 2010 which also included ` 600 million given as loans to MFIs (Table 2.8). Last year’s sanctions were mostly to NGOs and banks for the Individual Rural Vol-unteers (IRVs) to fund formation and maintenance of SHGs.
The refinance provided by NABARD to banks was ` 31.73 billion, an increase of 21 per cent in 2010. The share of SHG refinance in the annual disbursement was 26 per cent, the second highest
Table 2.810 mfdef sanctions (` lakh)
outstanding loans of SHGs
agency no. amount no. of SHGs
Cooperative Banks 7 63.23 5230
RRB 4 40.14 3395
NGO 306 2620.10 53393
Farmers' Clubs IRVs 2 154.70 9250
Total 319 2878.17 71268
Self-help group bank linkage programme—in search of leadership and direction 23
share for any subsector. NABARD has backed up its thought leadership with finance to banks. But one cannot escape the feeling that over the last four or five years, the enthusiasm on the part of NABARD towards SHGs is on the wane. The loss of enthusi-asm is inexplicable as NABARD has everything to gain as an apex development agency from a fully functional rural financial architecture that could marry the informality required for the rural clients with the formalities associated with high finance. After crossing a few major milestones, there does not seem to be much by way of either innovation or focusing of attention on what has already been done. The last innovation was the tie-up with post-office for lending to SHGs, which is reportedly do-ing well, but progressing slowly.
The priority states that were identified have been performing reasonably but nowhere near their po-tential. Some of the alternative programmes insti-tuted in states such as the Madhya Pradesh Rural Livelihood Project (MPRLP), the District Poverty Initiative Project (DPIP) and the like have done better in terms of mobilization of groups and en-abling their linkage with the banking system in states like Madhya Pradesh, Bihar and Orissa. In Uttar Pradesh, an International Fund for Agricul-tural Development (IFAD) supported programme carried out with the help of NABARD and a col-laborative project with Rajiv Gandhi Charitable Trust have been doing well. However, these kinds of programmes are limited in scope. The good practices in such projects should be mainstreamed over entire states and all stakeholder institutions. With the professionally trained manpower, exper-tise and past experience, NABARD is in a position to play this key role in knowledge dissemination and mainstreaming.
STaTe and SHGs
It is true with a large number of groups linked to the banking system that fatigue sets in among the bankers on day to day operational matters. Andhra Pradesh and a few other states where federations have been set up comprising a few hundred SHGs as constituents have shown the way of bulking the requirements of services and providing a single point contact for the banks to engage with. Fed-erations constitute a viable intermediation point through which several groups’ requirements can be efficiently met. The requirements for federa-tions to succeed are that they should serve a felt need, the groups should take responsibility for governance and operations, there should be pro-fessionals employed to handle sensitive functions and they should be well supervised by financing institutions. Today, for want of a favourable dispen-sation from NABARD and others in the banking system, financially active federations do not seem to have much of a future.
However, the several state governments have been powering ahead with setting up of federations. Andhra Pradesh with 1100 mandal11 level federa-tions has been asking banks to lend large loans to satisfy the needs of all the constituent SHGs. The loan requirements have been put at ` 20 million to ` 30 million per mandal level federation that has been set up. The government is also providing ini-tial revolving fund assistance to these federations so that they are in a position to work viably. In the case of Tamil Nadu, 12000 panchayat level federations have been set up. The expectation from the state government is that banks would provide a loan of not less than ` 5 million to each of these federa-tions so that they are in a position to provide loans to their SHG constituents. Orissa had formed more than 7800 federations and is planning to make them financial intermediaries.
When the state enters the scene, it also brings in some of the problems associated with the state such as subsidies, poor quality groups, ghost groups, de-livery of non-financial programmes, and creation of dependency in SHGs. Expectations of customers from the state involvement exceed the limits of fi-nancial discipline that defaults and inefficiencies are acceptable. The further problems that impact state-run programmes in the SHG domain are in the matter of selection of unsuitable staff, low levels of training and competence, and lack of accountability. In order to ensure that the state does not intrude in the affairs of what is supposed to be a people-owned people-governed movement, the federations should have the right of self-determination. They should
Post-Office and SHGs—a NABARD linkage
NABARD has reported that the results of SHG–Post-Office Linkage Programme in Tamil Nadu had been very encouraging. It had sanctioned additional ` 20 million as revolving fund to India Post for onward lending to SHGs. The vast network of post-offices in rural areas are utilized by India Post for disbursement of credit to the rural poor, on agency basis. So far, 2828 SHGs have opened zero interest savings accounts, of which 1195 SHGs have been provided loan by post-offices amounting to ` 32.12 million as on 31 March 2010. The project is also being imple-mented in Meghalaya with revolving funds hav-ing been sanctioned.

24 MICROFINANCE INDIA
become free to exercise their powers autonomously and take decisions on borrowing, saving and align-ing themselves with governments or others’ pro-grammes in their best judgement. Deep Joshi,12 while reviewing the IKP had made the comment that participation and leadership in the groups, vil-lage level organizations and Mandal Samakhya fed-erations of Andhra Pradesh ‘is clearly weighted to-wards the better off educated and articulate women especially in SHGs. Leaders are better informed than members in all these institutions. Material benefits and training inputs are similarly skewed.’
State and name of programme
design— operating
organization
coverage and type of
interventions
Andhra Pradesh, Indira Kranti Patham
SHGs—Federations at two higher tiers—Independent society (SERP) for technical services and support
1.1million groups, 1099 Mandal federations, ` 105 billion loans (March 2010) Bank linkage, livelihood interventions, farm technology improvement, money lender redemption
Tamil Nadu, Mahalir Thittam
SHGs in partnership with NGOs; Panchayat Level Federations a recently formed Tamil Nadu Corporation for Development of Women
0.44 million groups, 12000 Panchayat Federations, ` 27.9 billion loans ` 25.6 billion savings Formation, linkage with banks, training, monitoring
Kerala, Kudum-bashree
Neighbourhood Groups—federated in to Community Development Society—State Poverty Eradication Mission
Microplanning and implementation with panchayats’ support, bank linkage
Orissa, Mission Shakti
SHGs—federations MSVN (Women development corporation)
0.41 million SHGs linked, 7842 federations Formation, capacity building, income activities, bank linkage
Karnataka, Stree Shakthi
SHGs—Department of Women and Child Development
Bank linkage, women and child development issues
Bihar SHGs—Jeevika (state society)
Livelihoods, income generation, banks linkage
Gujarat, Sakhi Mandal
SHGs—Rural Development Department
Bank linkage, livelihoods, marketing
Rajasthan
SHGs—DWCD
Promotion, bank linkage, livelihoods, natural resource management
Madhya Pradesh
SHGs—DWCD, MPRLP Formation, linkage, income generation activities, marketing
Indira Kranti Patham
The Andhra Pradesh Programme, which is likely to be the model for National Rural Livelihoods Mission, goes beyond access to finance in its agenda. It spans land rights of poor, livelihoods and incomes, human development and social se-curity.
Under a ‘Land Access Programme’, the rights of the poor over land are restored. A ‘Community Managed Sustainable Agriculture’ intervention guides farmers (0.45 million farmers) in reduc-ing cost of cultivation and increasing net income. SHGs and their federations operate 199 Bulk Milk Chilling Centres covering 0.15 million milk producers, providing an assured market. Further, the Community Based Organizations procure and market agricultural and Non-Timber For-est Products (` 2.25 billion in the first quarter of 2010). The Employment Generation and Mar-keting Mission trains rural youth, builds their employable skills and places them on jobs (0.23 million jobs).
As part of gender initiative, 517 Mandal Level Social Action Committees have been formed and 332 family counselling centres managed by community. The centres resolve cases of violence and injustice to women. The Health and Nutri-tion initiative has established 1066 day care cum nutrition centres that have reported 99 per cent safe deliveries and 90 per cent normal deliveries among the women enrolled in these nutrition centres.
Abhaya Hastham is a co-contributory pension cum insurance scheme introduced by the gov-ernment for the SHG women over and above age group of 18 in rural areas to provide social secu-rity after attaining the age of 60 years. Pension disbursements under this scheme currently cover 0.37 million old women. Life cover is provided under Aam Aadmi Bhima Yojana (AABY) for 5.2 million landless agricultural labourers.
During the visits to the field in Andhra Pradesh, Tamil Nadu and Orissa, the impression gathered was that if provided autonomy, the groups and their higher order institutions would a find a way forward. But the willingness to provide autonomy to people based organizations is low in the state officials. The SHGs and their higher tiers are made to work as fi-nancial intermediaries, but without the discipline that is required in a financial institution. The devel-opment benefits are delivered as ‘charity’, making

Self-help group bank linkage programme—in search of leadership and direction 25
members of SHGs a subservient class. The best of linkage programmes is run by Andhra Pradesh, but the relationship between project staff of the government and the staff of the block federations, and between the staff and the customers has a clear hierarchy and pecking order that affects individual initiative.
The financial programme in Andhra Pradesh has developed problems such as high defaults in the intra-group loans, equal division of loans instead of need based loans, proxy loans, multiple borrowing by members, frequent distribution of corpus among members, irregular meetings, and so on. On the group dynamics side, there were drawbacks such as non-rotation of leaders, dependence on project staff, transactions outside the meeting, absence from meetings, and so on. The Andhra Pradesh project has been able to deepen bank linkage, but unable to significantly influence livelihoods. In some loca-tions, productivity has been enhanced through agri-cultural technology practices, but the increased pro-duction has been sold to agents (who had provided input loans) at lower prices.
In Mahalir Thittam, development activities were mostly left to NGOs and the groups themselves. The groups and the government staff in charge of the programme meet once in a few months. The recent formation of panchayat level federations has not been received well at the group level. SHGs are uneasy with the reported call to decide between the federation and the NGO that is currently facilitat-ing their functioning. The move to secure bank loans for the federations that are neither profession-ally equipped nor have past experience of handling finance is viewed with disfavour by banks. At the proposed loan level of ` 5 million per federation, banks will have a credit exposure of ` 600 billion to undercapitalized entities without sufficient profes-sional managerial staff. The banks are wary of the concept and would like to test out some pilot financ-ing models before taking a final decision.
The problems are not irremediable. There are well-functioning federations both in the state pro-grammes and more in the non-state domain. But such federations are few and these should be stud-ied. The learning from successful practices and fail-ures should guide the mainstreaming federations as financial intermediaries.
The concerted move towards federation and the pressure on banks to finance them should be tak-en cognizance of by RBI and NABARD. NABARD should revisit its current policy on federations and provide for supporting federations with finance and professional skills. Federations might be the
Swayanshree—an autonomous federation13
A cooperative society registered under Self-Reliant Cooperatives Act, has 2024 SHGs as constituents in nine clusters in Cuttack, Orissa. Its total membership exceeded 16000. The fed-eration is engaged in savings, credit, insurance, livelihoods support, legal services, and health and disaster management activities. It also campaigns in the social sphere for avoidance of liquor, birth/death registration, anti-dowry ac-tivities and flood relief.
The directors on the board are elected through specific cluster based constituencies. The presi-dent and office bearers do not continue for long terms in accordance with bye-law provisions. There are committees of the board such as loan committee and audit committee. Through well-laid governance norms, office bearers are prevent-ed from influencing decisions on their SHGs.
Member savings is the important source of funds. The total savings mobilized by the federa-tion was ` 45.6 million in 2010. Average savings per member was ` 2752. Average monthly saving per SHG was ` 700. Swayanshree paid interest of 10 per cent on fixed deposits. Need based bor-rowing from Small Industries Development Bank of India (SIDBI) and State Bank of India (SBI) helps the federation to meet member demand for loans. It is looking to increase its borrowings in a bid to expand the loan portfolio.
The active borrowers were more than 9000 with a loan portfolio of ` 52.8 million. Aver-age loan per SHG was ` 50000, which is higher than the average bank loan to SHGs in Orissa. Individual members could avail a loan of up to ` 50000 with a maximum repayment period of 24 months. Typical member loan in the initial stages of membership is ` 20000 repayable in 18 months. Swayanshree has partnerships with four insurance companies for life, health and asset in-surance with more than 12000 policies.
The performance ratios are impressive with operational self-sufficiency at 180 per cent and financial self-sufficiency at 130 per cent. Its op-erating cost ratio was 8.14 per cent, which indi-cated a high level of efficiency. The federation has withstood the onslaught of 15 MFIs/MFOs in a competitive Cuttack market. Its challenges are in scaling up for serving the members better.
‘SHG federations can function independently with autonomy, good governance and profes-sionalism’ is the message of Swayanshree.

26 MICROFINANCE INDIA
NABARD should make SHG linkage a core part of business strategy of cooperative banks and invest in specialized HR and institutional capacities in coop-erative banks to handle the same.
The policy establishment while concerned about proliferation of commercial models of microfi-nance does not seem to take decisive actions to energise the community based models. There are some reports in Karnataka that SHGs are return-ing to their parent NGOs after being disillusioned with MFIs. The best way of disciplining commer-cial institutions is through the market. Strengthen-ing the SHG movement and investing in its higher tier institutions would provide the poor with cost-effective options in financial services that would have a salutary effect on commercial institutions. That is also the logical way forward for the SHG movement.
innovation that NABARD requires to regain lead-ership of the SBLP. Creation of federations that are need based, enabling them to become professional with staff and training, providing them with seed capital for initial infrastructure and ensuring that they develop as sound community owned financial institutions are the tasks before NABARD in de-signing the higher level architecture for SHG con-solidation. The other aspect meriting attention of NABARD is the lacklustre performance of coopera-tive banks in financing SHGs. Barring a few states, cooperatives have not been supportive of a move-ment that is people based. The opportunities for low risk business expansion, building a larger constitu-ency of customers among the rural poor and abil-ity to price loans that are not controlled directly or indirectly by the government are good reasons why cooperative banks must prioritise SHG lending.

Self-help group bank linkage programme—in search of leadership and direction 27
anneX 2.1 credit to savings ratio across states
State average loan/SHG average saving/SHG o/S loans to savings ratio
Andaman & Nicobar Islands (UT) 28428 2468 12
Andhra Pradesh 79292 8663 9
Arunachal Pradesh 33359 2569 13
Assam 61213 4716 13
Bihar 66470 12869 5
Chhattisgarh 37927 6648 6
Goa 3751577 386987 10
Gujarat 20151 19140 1
Haryana 58510 7924 7
Himachal Pradesh 41526 6719 6
Jammu & Kashmir 62016 34117 2
Jharkhand 45615 9345 5
Karnataka 61507 11723 5
Kerala 39415 9526 4
Madhya Pradesh 57897 5696 10
Maharashtra 28876 7144 4
Manipur 42196 2047 21
Meghalaya 41988 3056 14
Mizoram 110916 4938 22
Nagaland 34234 5641 6
New Delhi 85629 10719 8
Orissa 41444 6780 6
Pondicherry 109247 22069 5
Punjab 66790 8115 8
Rajasthan 48165 6464 7
Sikkim 29562 15555 2
Tamil Nadu 28800 10878 3
Tripura 66442 10641 6
Uttar Pradesh 47885 6156 8
Uttarakhand 61198 16143 4
West Bengal 26182 9161 3
Total 50645 9326 5

28 MICROFINANCE INDIA
anneX 2.2 microfinance Penetration index (mPi) and microfinance Poverty Penetration index (mPPi)
State mPi mPPi
northern region 0.23 0.41
Haryana 0.23 0.45
Himachal Pradesh 0.57 1.57
Punjab 0.07 0.22
Jammu & Kashmir 0.03 0.13
Rajasthan 0.34 0.42
New Delhi 0.11 0.20
northeastern region 0.49 0.71
Arunachal Pradesh 0.44 0.70
Assam 0.45 0.64
Manipur 0.44 0.69
Meghalaya 0.29 0.43
Mizoram 0.36 0.78
Nagaland 0.32 0.47
Sikkim 0.50 0.69
Tripura 1.17 1.70
eastern region 0.67 0.74
Bihar 0.20 0.14
Jharkhand 0.50 0.34
Orissa 2.00 1.19
West Bengal 1.48 1.65
central region 0.41 0.32
Chhattisgarh 0.64 0.43
Madhya Pradesh 0.38 0.27
Uttar Pradesh 0.38 0.32
Uttarakhand 0.64 0.44
Western region 0.76 0.81
Goa 0.54 1.08
Gujarat 0.26 0.43
Maharashtra 1.03 0.92
Southern region 2.44 3.40
Andhra Pradesh 3.64 6.35
Karnataka 1.57 1.74
Kerala 1.36 2.49
Pondicherry 2.03 2.52
Tamil Nadu 2.27 2.77
India 1.00 1.00
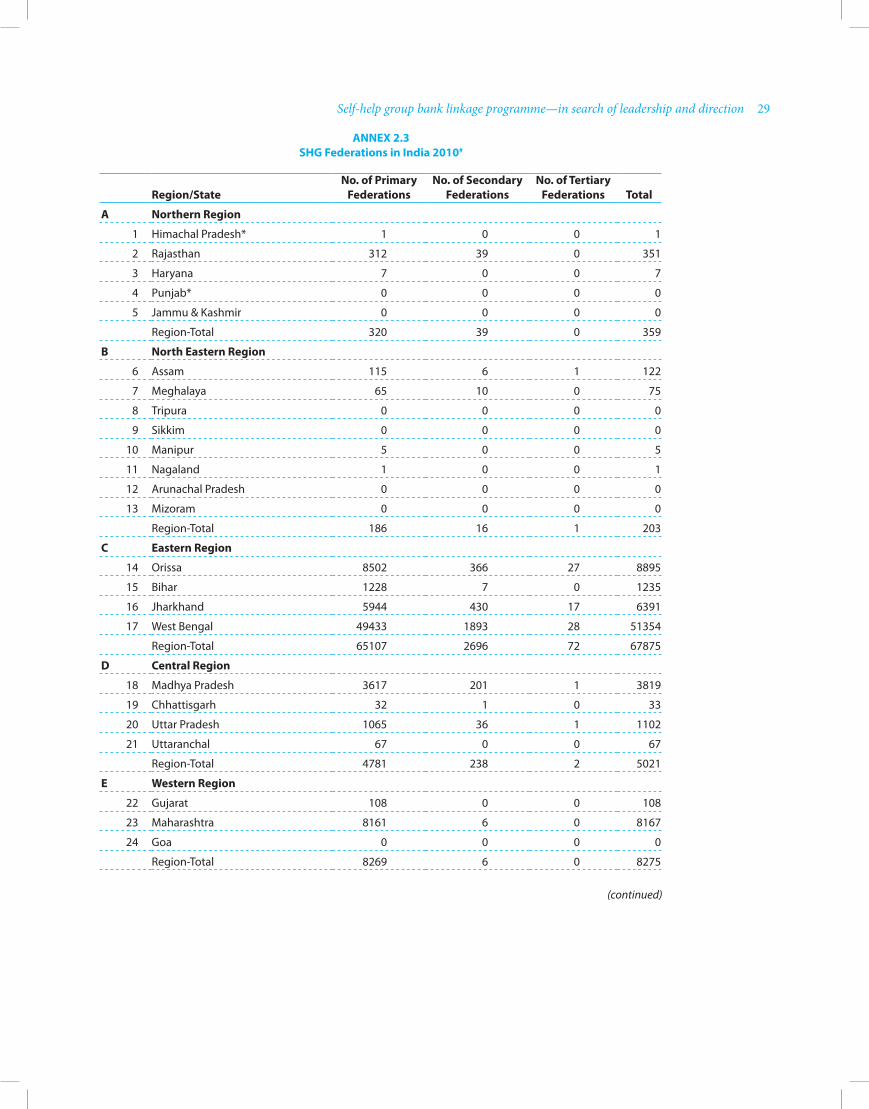
Self-help group bank linkage programme—in search of leadership and direction 29
anneX 2.3 SHG federations in india 2010#
region/State
no. of Primary federations
no. of Secondary federations
no. of Tertiary federations
Total
a northern region
1 Himachal Pradesh* 1 0 0 1
2 Rajasthan 312 39 0 351
3 Haryana 7 0 0 7
4 Punjab* 0 0 0 0
5 Jammu & Kashmir 0 0 0 0
Region-Total 320 39 0 359
B north eastern region
6 Assam 115 6 1 122
7 Meghalaya 65 10 0 75
8 Tripura 0 0 0 0
9 Sikkim 0 0 0 0
10 Manipur 5 0 0 5
11 Nagaland 1 0 0 1
12 Arunachal Pradesh 0 0 0 0
13 Mizoram 0 0 0 0
Region-Total 186 16 1 203
c eastern region
14 Orissa 8502 366 27 8895
15 Bihar 1228 7 0 1235
16 Jharkhand 5944 430 17 6391
17 West Bengal 49433 1893 28 51354
Region-Total 65107 2696 72 67875
d central region
18 Madhya Pradesh 3617 201 1 3819
19 Chhattisgarh 32 1 0 33
20 Uttar Pradesh 1065 36 1 1102
21 Uttaranchal 67 0 0 67
Region-Total 4781 238 2 5021
e Western region
22 Gujarat 108 0 0 108
23 Maharashtra 8161 6 0 8167
24 Goa 0 0 0 0
Region-Total 8269 6 0 8275
(continued)
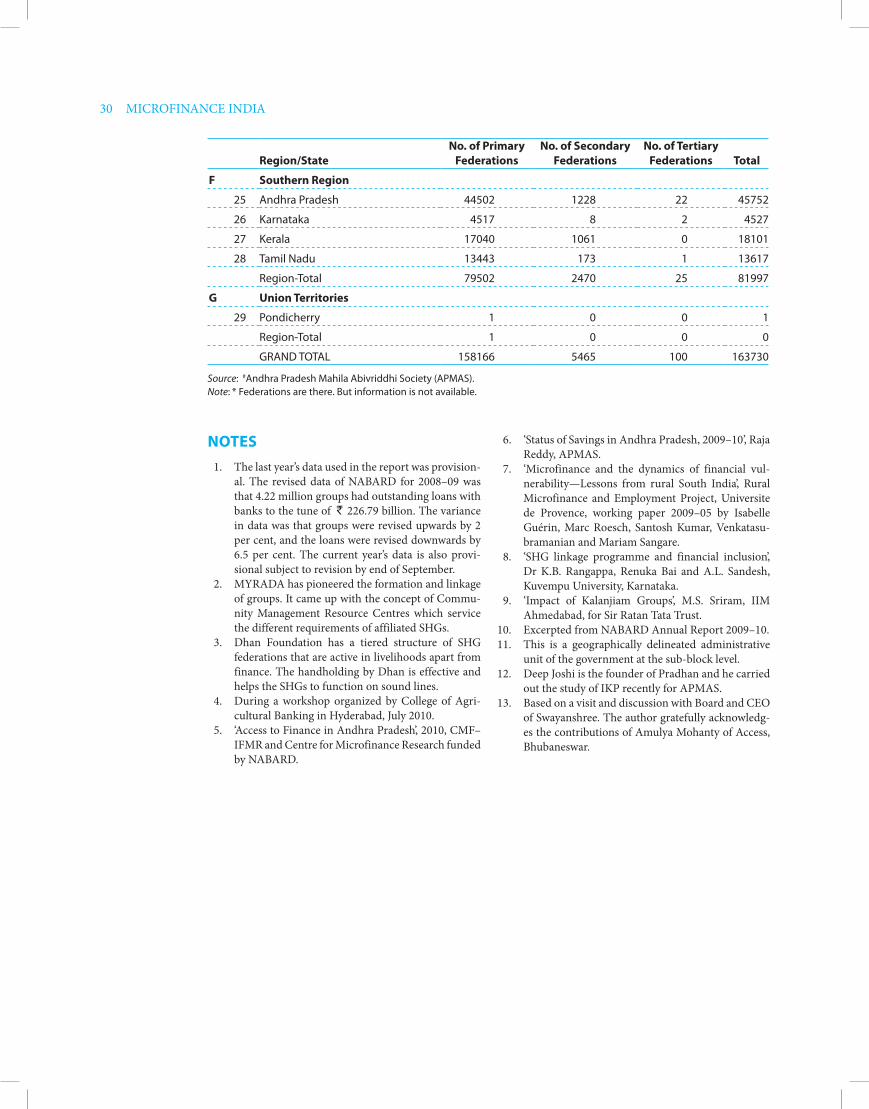
30 MICROFINANCE INDIA
region/State
no. of Primary federations
no. of Secondary federations
no. of Tertiary federations
Total
f Southern region
25 Andhra Pradesh 44502 1228 22 45752
26 Karnataka 4517 8 2 4527
27 Kerala 17040 1061 0 18101
28 Tamil Nadu 13443 173 1 13617
Region-Total 79502 2470 25 81997
G Union Territories
29 Pondicherry 1 0 0 1
Region-Total 1 0 0 0
GRAND TOTAL 158166 5465 100 163730
Source: #Andhra Pradesh Mahila Abivriddhi Society (APMAS).Note: * Federations are there. But information is not available.
noTeS 1. The last year’s data used in the report was provision-
al. The revised data of NABARD for 2008–09 was that 4.22 million groups had outstanding loans with banks to the tune of ` 226.79 billion. The variance in data was that groups were revised upwards by 2 per cent, and the loans were revised downwards by 6.5 per cent. The current year’s data is also provi-sional subject to revision by end of September.
2. MYRADA has pioneered the formation and linkage of groups. It came up with the concept of Commu-nity Management Resource Centres which service the different requirements of affiliated SHGs.
3. Dhan Foundation has a tiered structure of SHG federations that are active in livelihoods apart from finance. The handholding by Dhan is effective and helps the SHGs to function on sound lines.
4. During a workshop organized by College of Agri-cultural Banking in Hyderabad, July 2010.
5. ‘Access to Finance in Andhra Pradesh’, 2010, CMF–IFMR and Centre for Microfinance Research funded by NABARD.
6. ‘Status of Savings in Andhra Pradesh, 2009–10’, Raja Reddy, APMAS.
7. ‘Microfinance and the dynamics of financial vul-nerability—Lessons from rural South India’, Rural Microfinance and Employment Project, Universite de Provence, working paper 2009–05 by Isabelle Guérin, Marc Roesch, Santosh Kumar, Venkatasu-bramanian and Mariam Sangare.
8. ‘SHG linkage programme and financial inclusion’, Dr K.B. Rangappa, Renuka Bai and A.L. Sandesh, Kuvempu University, Karnataka.
9. ‘Impact of Kalanjiam Groups’, M.S. Sriram, IIM Ahmedabad, for Sir Ratan Tata Trust.
10. Excerpted from NABARD Annual Report 2009–10. 11. This is a geographically delineated administrative
unit of the government at the sub-block level. 12. Deep Joshi is the founder of Pradhan and he carried
out the study of IKP recently for APMAS. 13. Based on a visit and discussion with Board and CEO
of Swayanshree. The author gratefully acknowledg-es the contributions of Amulya Mohanty of Access, Bhubaneswar.

3Chapter
Microfinance institutions—moderation dictated by market
Despite reported problems and concerns arising from rising default rates and attention of the wrong kind from some state authorities, the sector has posted good growth. The growth rates have been modest compared to last year but far ahead of any other sector in the Indian economy. As per provi-sional data made available by Sadhan1, microfinance institutions (MFIs) achieved a client outreach of 26.7 million and loan portfolio of ` 183.44 billion,2 18 per cent growth in clients3 and 56 per cent growth in loan portfolio over 2009.4 In terms of vibrancy and future potential, the sector seemed to be the best bet among the investor community. A poll of 50 investment banking firms/companies5 brought out that microfinance is the top ranked destination for investments in financial sector today. Of those who voted, more than 80 per cent rated microfinance as the best sector for investments. The continuing ac-celeration of client acquisition and business volumes on a very large expanded base indicates strong de-mand and the inadequate supply to meet the needs of vulnerable people.
During 2009, 20 Indian MFIs made it to the top 100 list of Mix Market,6 and 15 were in the top 50. In Microfinance Information Exchange (MIX) top 100, 2008, only 10 Indian MFIs had figured (Table 3.1). Indian MFIs have posted vigorous growth in a year in which MFIs in other countries have faced difficulties. The efficiency and profitability of In-dian MFIs saw many of them improve their ranking compared with the previous year.
Barring three, all MFIs in the list climbed many places from last year’s ranking. The data for the year 2009–10 was not published by Sadhan till end of August; the analysis in this section of the report has relied on MIX market database to which 77 Indian MFIs had reported. These 77 MFIs had a share of 89.6 per cent of the clients and 89.6 per cent
of the loan outstanding of all MFIs that reported to Sadhan.7
Predictably, the top spot in terms of clients and loans was captured by SKS microfinance (Table 3.2). The top seven MFIs of last year retained their place. Ujjivan Financial Services entered the list of top 10, displacing BISWA. Equitas moved up from the tenth place to eighth while Grama Vidiyal slid down one place to ninth. The list now has seven
Table 3.1 Indian MFIs in the MIX top 100 list
Name of MFI
Ranking in 2009
Ranking in 2008
Grameen Fin Services 4 180
SKS 7 3
Spandana 8 23
BASIX 11 32
SHARE 12 26
Bandhan 13 5
Village Fin Services 15 219
Asmita 18 127
Grama Vidiyal 20 –
SWAWS 23 269
Gram Utthan 28 196
BISWA 31 90
Cashpor 33 7
SKDRDP 39 59
Saadhana 45 109
Sarvodaya Nano 57 15
SMSS 78 407
BSS 84 40
ESAF 86 19
NEED 89 293
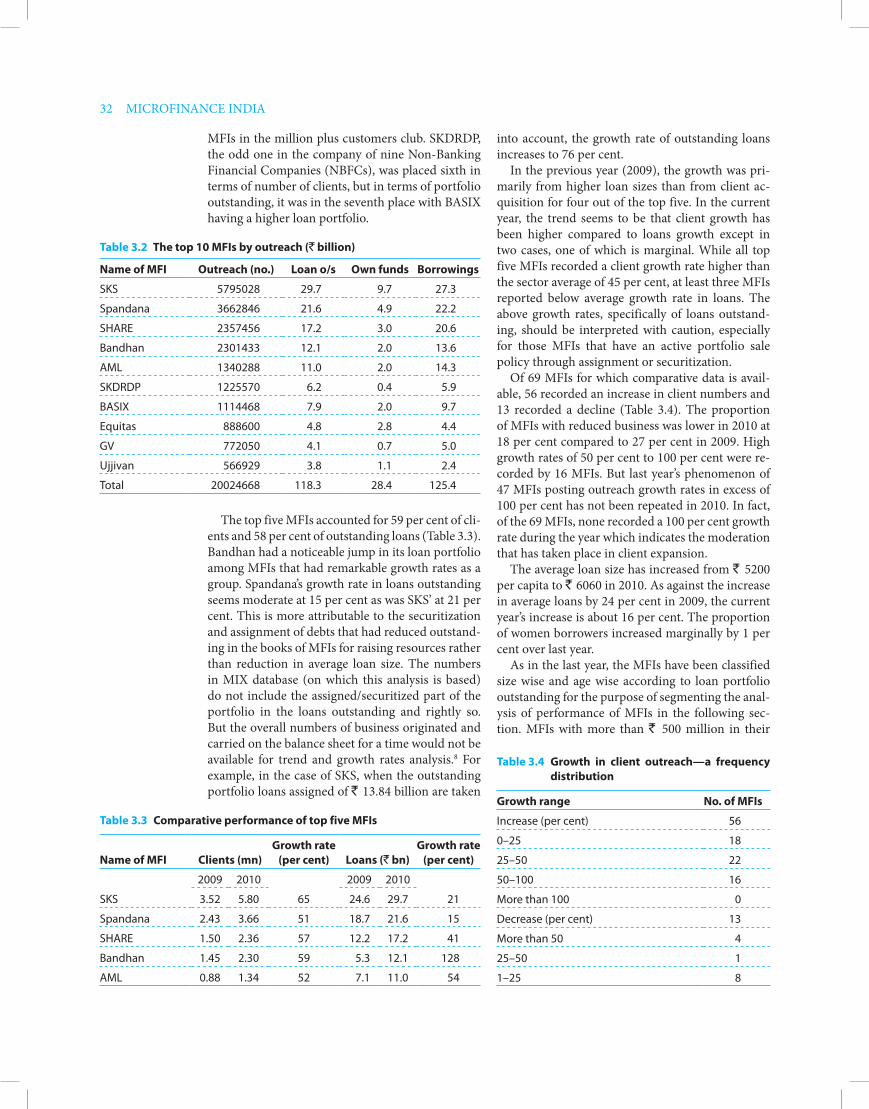
32 MICROFINANCE INDIA
MFIs in the million plus customers club. SKDRDP, the odd one in the company of nine Non-Banking Financial Companies (NBFCs), was placed sixth in terms of number of clients, but in terms of portfolio outstanding, it was in the seventh place with BASIX having a higher loan portfolio.
into account, the growth rate of outstanding loans increases to 76 per cent.
In the previous year (2009), the growth was pri-marily from higher loan sizes than from client ac-quisition for four out of the top five. In the current year, the trend seems to be that client growth has been higher compared to loans growth except in two cases, one of which is marginal. While all top five MFIs recorded a client growth rate higher than the sector average of 45 per cent, at least three MFIs reported below average growth rate in loans. The above growth rates, specifically of loans outstand-ing, should be interpreted with caution, especially for those MFIs that have an active portfolio sale policy through assignment or securitization.
Of 69 MFIs for which comparative data is avail-able, 56 recorded an increase in client numbers and 13 recorded a decline (Table 3.4). The proportion of MFIs with reduced business was lower in 2010 at 18 per cent compared to 27 per cent in 2009. High growth rates of 50 per cent to 100 per cent were re-corded by 16 MFIs. But last year’s phenomenon of 47 MFIs posting outreach growth rates in excess of 100 per cent has not been repeated in 2010. In fact, of the 69 MFIs, none recorded a 100 per cent growth rate during the year which indicates the moderation that has taken place in client expansion.
The average loan size has increased from ` 5200 per capita to ` 6060 in 2010. As against the increase in average loans by 24 per cent in 2009, the current year’s increase is about 16 per cent. The proportion of women borrowers increased marginally by 1 per cent over last year.
As in the last year, the MFIs have been classified size wise and age wise according to loan portfolio outstanding for the purpose of segmenting the anal-ysis of performance of MFIs in the following sec-tion. MFIs with more than ` 500 million in their
Table 3.2 The top 10 MFIs by outreach (` billion)
Name of MFI Outreach (no.) Loan o/s Own funds Borrowings
SKS 5795028 29.7 9.7 27.3
Spandana 3662846 21.6 4.9 22.2
SHARE 2357456 17.2 3.0 20.6
Bandhan 2301433 12.1 2.0 13.6
AML 1340288 11.0 2.0 14.3
SKDRDP 1225570 6.2 0.4 5.9
BASIX 1114468 7.9 2.0 9.7
Equitas 888600 4.8 2.8 4.4
GV 772050 4.1 0.7 5.0
Ujjivan 566929 3.8 1.1 2.4
Total 20024668 118.3 28.4 125.4
Table 3.3 Comparative performance of top five MFIs
Name of MFI
Clients (mn)
Growth rate (per cent)
Loans (` bn)
Growth rate (per cent)
2009 2010 2009 2010
SKS 3.52 5.80 65 24.6 29.7 21
Spandana 2.43 3.66 51 18.7 21.6 15
SHARE 1.50 2.36 57 12.2 17.2 41
Bandhan 1.45 2.30 59 5.3 12.1 128
AML 0.88 1.34 52 7.1 11.0 54
Table 3.4 Growth in client outreach—a frequency distribution
Growth range No. of MFIs
Increase (per cent) 56
0–25 18
25–50 22
50–100 16
More than 100 0
Decrease (per cent) 13
More than 50 4
25–50 1
1–25 8
The top five MFIs accounted for 59 per cent of cli-ents and 58 per cent of outstanding loans (Table 3.3). Bandhan had a noticeable jump in its loan portfolio among MFIs that had remarkable growth rates as a group. Spandana’s growth rate in loans outstanding seems moderate at 15 per cent as was SKS’ at 21 per cent. This is more attributable to the securitization and assignment of debts that had reduced outstand-ing in the books of MFIs for raising resources rather than reduction in average loan size. The numbers in MIX database (on which this analysis is based) do not include the assigned/securitized part of the portfolio in the loans outstanding and rightly so. But the overall numbers of business originated and carried on the balance sheet for a time would not be available for trend and growth rates analysis.8 For example, in the case of SKS, when the outstanding portfolio loans assigned of ` 13.84 billion are taken

Microfinance institutions—moderation dictated by market 33
85 per cent of loans (Figure 3.3). Societies, the next most popular form had a share of just 6.4 per cent of the market. The market shares of different forms should be understood in the context of support available from other stakeholders such as banks, in-vestors, rating agencies and others. Companies are the preferred form as there is a clearly defined own-ership and governance structure, well-laid systems of accounting and audit and, therefore, account-ability for performance to those who invest or lend. Rating agencies subconsciously raise their ratings a notch when they see a company as the form in MFI as compared to a trust or society. Investors cannot buy equity in any other form with a potential for capital appreciation and dividends. The dominant market share of NBFCs has as much to do with their abilities as with the supportive framework provided by other stakeholders.
loan portfolio are classified as ‘Large’, those with ` 50 million to ` 500 million are classified as ‘Me-dium’ and those with less than ` 50 million are clas-sified as ‘Small’.9 MFIs that were operational for less than five years are classified as A, those operational for five to 10 years are classified as B and those op-erational for more than 10 years are classified as C.
The database had 37 Large MFIs, 30 Medium MFIs and eight Small MFIs. The Large MFIs had 94.5 per cent of the clients and the Small ones had a negligible share (Figure 3.1). Medium MFIs had a share of 5.3 per cent of clients, but in terms of loan volumes, they had a lesser share of 4 per cent. Since the database for this analysis comprises almost all the Large MFIs but not all the Small and Medium MFIs (that did not report to MIX), the shares of Large MFIs is significantly overstated. The share of Large MFIs alone in the overall market (as per the Sadhan provisional data) is 86 per cent of clients and 97 per cent of loans (Figure 3.2).10 The market is clearly dominated by the Large ones and the like-lihood that the voice of other MFIs will be heard by the other stakeholders is small.
5.33% 0.16%
94.51%LargeMediumSmall
Figure 3.1 Client outreach by size of MFIsNBFC
2.55%4.05% 0.75%
0.77%0.50%
SocietySection 25TrustCooperative BankOther
Local Area Bank
84.96%
6.41%
Figure 3.3 Market share of different forms of institu-tions—loan volumes
4.06% 0.14%
LargeMediumSmall
95.80%
Figure 3.2 Share of loan volumes—size wise
The form-wise distribution of MFIs in the MIX database has NBFCs as the largest grouping (Table 3.5).
The analysis of the market share in terms of the form of organization of MFIs shows that NBFCs had a very strong hold on the market with a share of
PROFITaBILITy
Of the 76 MFIs in the database, six had not reported information relating to profits. Of the remaining 70 MFIs, 62 had reported positive returns and nine had reported negative return-on-assets. Of the loss making MFIs, one was in the Large category.
A cursory analysis of return-on-assets offers a surprising revelation that the microfinance sec-tor has a very high profit potential. Six MFIs had
Table 3. 5 Form-wise distribution of MFIs—loan portfolio
Form No. of MFIs GLP
NBFC 34 133.67
Society 23 10.09
Section 25 6 4.01
Trust 4 6.37
Cooperative Bank 5 1.17
Other 3 1.20
Local Area Bank 1 0.79
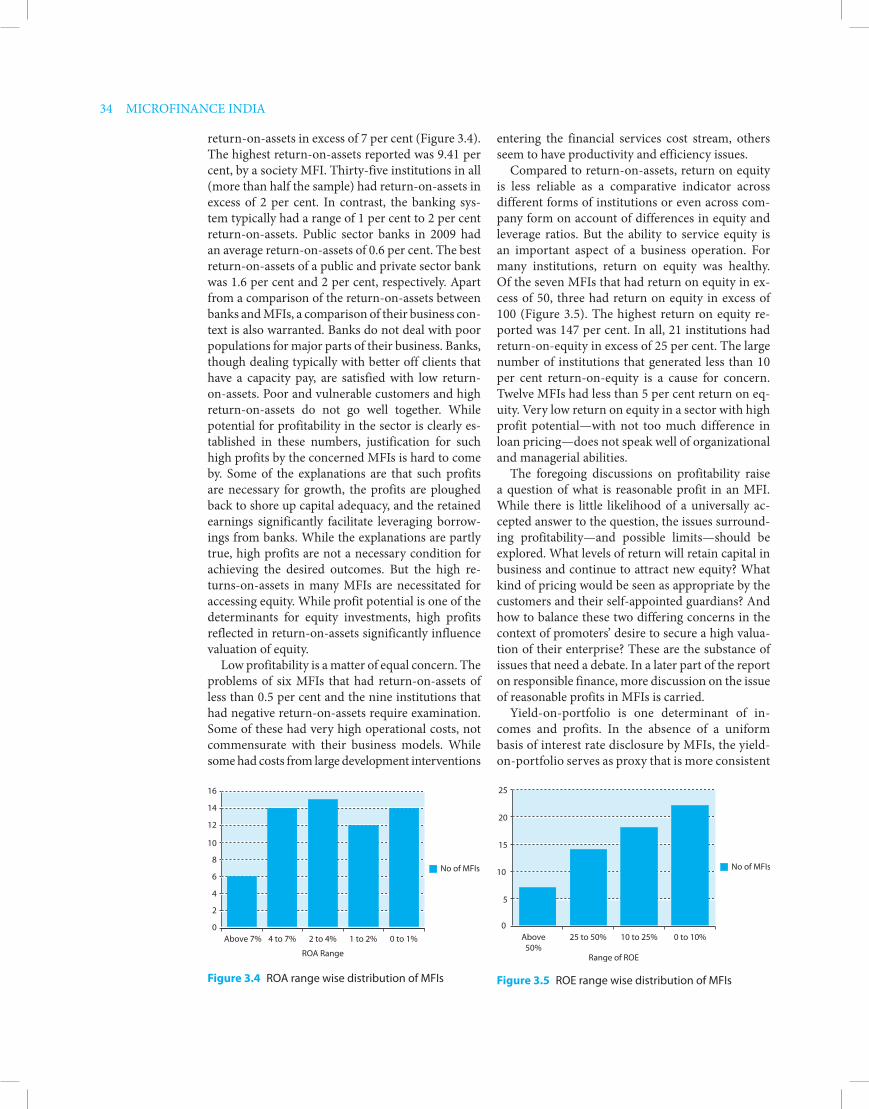
34 MICROFINANCE INDIA
entering the financial services cost stream, others seem to have productivity and efficiency issues.
Compared to return-on-assets, return on equity is less reliable as a comparative indicator across different forms of institutions or even across com-pany form on account of differences in equity and leverage ratios. But the ability to service equity is an important aspect of a business operation. For many institutions, return on equity was healthy. Of the seven MFIs that had return on equity in ex-cess of 50, three had return on equity in excess of 100 (Figure 3.5). The highest return on equity re-ported was 147 per cent. In all, 21 institutions had return-on-equity in excess of 25 per cent. The large number of institutions that generated less than 10 per cent return-on-equity is a cause for concern. Twelve MFIs had less than 5 per cent return on eq-uity. Very low return on equity in a sector with high profit potential—with not too much difference in loan pricing—does not speak well of organizational and managerial abilities.
The foregoing discussions on profitability raise a question of what is reasonable profit in an MFI. While there is little likelihood of a universally ac-cepted answer to the question, the issues surround-ing profitability—and possible limits—should be explored. What levels of return will retain capital in business and continue to attract new equity? What kind of pricing would be seen as appropriate by the customers and their self-appointed guardians? And how to balance these two differing concerns in the context of promoters’ desire to secure a high valua-tion of their enterprise? These are the substance of issues that need a debate. In a later part of the report on responsible finance, more discussion on the issue of reasonable profits in MFIs is carried.
Yield-on-portfolio is one determinant of in-comes and profits. In the absence of a uniform basis of interest rate disclosure by MFIs, the yield-on-portfolio serves as proxy that is more consistent
return-on-assets in excess of 7 per cent (Figure 3.4). The highest return-on-assets reported was 9.41 per cent, by a society MFI. Thirty-five institutions in all (more than half the sample) had return-on-assets in excess of 2 per cent. In contrast, the banking sys-tem typically had a range of 1 per cent to 2 per cent return-on-assets. Public sector banks in 2009 had an average return-on-assets of 0.6 per cent. The best return-on-assets of a public and private sector bank was 1.6 per cent and 2 per cent, respectively. Apart from a comparison of the return-on-assets between banks and MFIs, a comparison of their business con-text is also warranted. Banks do not deal with poor populations for major parts of their business. Banks, though dealing typically with better off clients that have a capacity pay, are satisfied with low return-on-assets. Poor and vulnerable customers and high return-on-assets do not go well together. While potential for profitability in the sector is clearly es-tablished in these numbers, justification for such high profits by the concerned MFIs is hard to come by. Some of the explanations are that such profits are necessary for growth, the profits are ploughed back to shore up capital adequacy, and the retained earnings significantly facilitate leveraging borrow-ings from banks. While the explanations are partly true, high profits are not a necessary condition for achieving the desired outcomes. But the high re-turns-on-assets in many MFIs are necessitated for accessing equity. While profit potential is one of the determinants for equity investments, high profits reflected in return-on-assets significantly influence valuation of equity.
Low profitability is a matter of equal concern. The problems of six MFIs that had return-on-assets of less than 0.5 per cent and the nine institutions that had negative return-on-assets require examination. Some of these had very high operational costs, not commensurate with their business models. While some had costs from large development interventions
0
2
4
6
8
10
12
14
16
Above 7% 4 to 7% 2 to 4%
ROA Range
1 to 2% 0 to 1%
No of MFIs
Figure 3.4 ROA range wise distribution of MFIs
0
5
10
15
20
25
Above50%
25 to 50%
Range of ROE
10 to 25% 0 to 10%
No of MFIs
Figure 3.5 ROE range wise distribution of MFIs
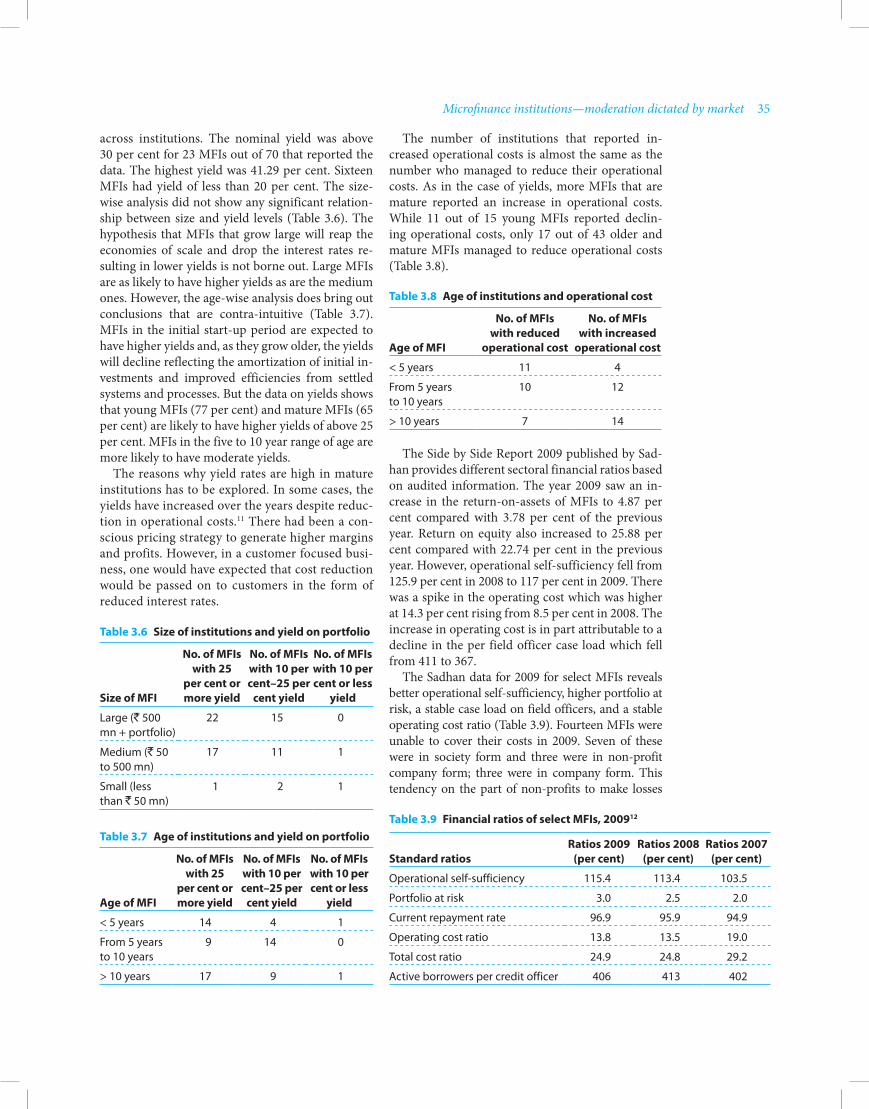
Microfinance institutions—moderation dictated by market 35
The number of institutions that reported in-creased operational costs is almost the same as the number who managed to reduce their operational costs. As in the case of yields, more MFIs that are mature reported an increase in operational costs. While 11 out of 15 young MFIs reported declin-ing operational costs, only 17 out of 43 older and mature MFIs managed to reduce operational costs (Table 3.8).
across institutions. The nominal yield was above 30 per cent for 23 MFIs out of 70 that reported the data. The highest yield was 41.29 per cent. Sixteen MFIs had yield of less than 20 per cent. The size-wise analysis did not show any significant relation-ship between size and yield levels (Table 3.6). The hypothesis that MFIs that grow large will reap the economies of scale and drop the interest rates re-sulting in lower yields is not borne out. Large MFIs are as likely to have higher yields as are the medium ones. However, the age-wise analysis does bring out conclusions that are contra-intuitive (Table 3.7). MFIs in the initial start-up period are expected to have higher yields and, as they grow older, the yields will decline reflecting the amortization of initial in-vestments and improved efficiencies from settled systems and processes. But the data on yields shows that young MFIs (77 per cent) and mature MFIs (65 per cent) are likely to have higher yields of above 25 per cent. MFIs in the five to 10 year range of age are more likely to have moderate yields.
The reasons why yield rates are high in mature institutions has to be explored. In some cases, the yields have increased over the years despite reduc-tion in operational costs.11 There had been a con-scious pricing strategy to generate higher margins and profits. However, in a customer focused busi-ness, one would have expected that cost reduction would be passed on to customers in the form of reduced interest rates.
Table 3.6 Size of institutions and yield on portfolio
Size of MFI
No. of MFIs with 25
per cent or more yield
No. of MFIs with 10 per cent–25 per
cent yield
No. of MFIs with 10 per cent or less
yield
Large (` 500 mn + portfolio)
22 15 0
Medium (` 50 to 500 mn)
17 11 1
Small (less than ` 50 mn)
1 2 1
Table 3.7 age of institutions and yield on portfolio
age of MFI
No. of MFIs with 25
per cent or more yield
No. of MFIs with 10 per cent–25 per
cent yield
No. of MFIs with 10 per cent or less
yield
< 5 years 14 4 1
From 5 years to 10 years
9 14 0
> 10 years 17 9 1
Table 3.8 age of institutions and operational cost
age of MFI
No. of MFIs with reduced
operational cost
No. of MFIs with increased
operational cost
< 5 years 11 4
From 5 years to 10 years
10 12
> 10 years 7 14
Table 3.9 Financial ratios of select MFIs, 200912
Standard ratios
Ratios 2009 (per cent)
Ratios 2008 (per cent)
Ratios 2007 (per cent)
Operational self-sufficiency 115.4 113.4 103.5
Portfolio at risk 3.0 2.5 2.0
Current repayment rate 96.9 95.9 94.9
Operating cost ratio 13.8 13.5 19.0
Total cost ratio 24.9 24.8 29.2
Active borrowers per credit officer 406 413 402
The Side by Side Report 2009 published by Sad-han provides different sectoral financial ratios based on audited information. The year 2009 saw an in-crease in the return-on-assets of MFIs to 4.87 per cent compared with 3.78 per cent of the previous year. Return on equity also increased to 25.88 per cent compared with 22.74 per cent in the previous year. However, operational self-sufficiency fell from 125.9 per cent in 2008 to 117 per cent in 2009. There was a spike in the operating cost which was higher at 14.3 per cent rising from 8.5 per cent in 2008. The increase in operating cost is in part attributable to a decline in the per field officer case load which fell from 411 to 367.
The Sadhan data for 2009 for select MFIs reveals better operational self-sufficiency, higher portfolio at risk, a stable case load on field officers, and a stable operating cost ratio (Table 3.9). Fourteen MFIs were unable to cover their costs in 2009. Seven of these were in society form and three were in non-profit company form; three were in company form. This tendency on the part of non-profits to make losses
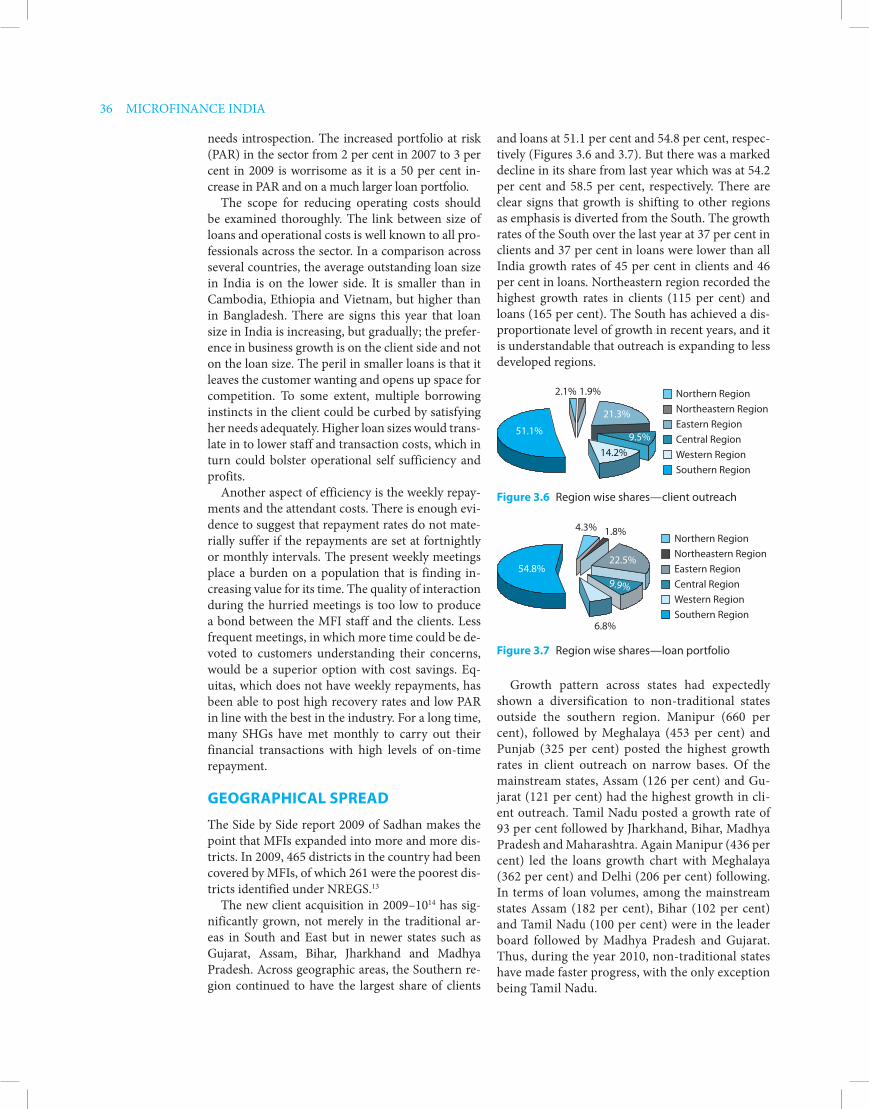
36 MICROFINANCE INDIA
and loans at 51.1 per cent and 54.8 per cent, respec-tively (Figures 3.6 and 3.7). But there was a marked decline in its share from last year which was at 54.2 per cent and 58.5 per cent, respectively. There are clear signs that growth is shifting to other regions as emphasis is diverted from the South. The growth rates of the South over the last year at 37 per cent in clients and 37 per cent in loans were lower than all India growth rates of 45 per cent in clients and 46 per cent in loans. Northeastern region recorded the highest growth rates in clients (115 per cent) and loans (165 per cent). The South has achieved a dis-proportionate level of growth in recent years, and it is understandable that outreach is expanding to less developed regions.
needs introspection. The increased portfolio at risk (PAR) in the sector from 2 per cent in 2007 to 3 per cent in 2009 is worrisome as it is a 50 per cent in-crease in PAR and on a much larger loan portfolio.
The scope for reducing operating costs should be examined thoroughly. The link between size of loans and operational costs is well known to all pro-fessionals across the sector. In a comparison across several countries, the average outstanding loan size in India is on the lower side. It is smaller than in Cambodia, Ethiopia and Vietnam, but higher than in Bangladesh. There are signs this year that loan size in India is increasing, but gradually; the prefer-ence in business growth is on the client side and not on the loan size. The peril in smaller loans is that it leaves the customer wanting and opens up space for competition. To some extent, multiple borrowing instincts in the client could be curbed by satisfying her needs adequately. Higher loan sizes would trans-late in to lower staff and transaction costs, which in turn could bolster operational self sufficiency and profits.
Another aspect of efficiency is the weekly repay-ments and the attendant costs. There is enough evi-dence to suggest that repayment rates do not mate-rially suffer if the repayments are set at fortnightly or monthly intervals. The present weekly meetings place a burden on a population that is finding in-creasing value for its time. The quality of interaction during the hurried meetings is too low to produce a bond between the MFI staff and the clients. Less frequent meetings, in which more time could be de-voted to customers understanding their concerns, would be a superior option with cost savings. Eq-uitas, which does not have weekly repayments, has been able to post high recovery rates and low PAR in line with the best in the industry. For a long time, many SHGs have met monthly to carry out their financial transactions with high levels of on-time repayment.
GeOGRaPhICaL SPRead
The Side by Side report 2009 of Sadhan makes the point that MFIs expanded into more and more dis-tricts. In 2009, 465 districts in the country had been covered by MFIs, of which 261 were the poorest dis-tricts identified under NREGS.13
The new client acquisition in 2009–1014 has sig-nificantly grown, not merely in the traditional ar-eas in South and East but in newer states such as Gujarat, Assam, Bihar, Jharkhand and Madhya Pradesh. Across geographic areas, the Southern re-gion continued to have the largest share of clients
Figure 3.6 Region wise shares—client outreach
Northern RegionNortheastern RegionEastern RegionCentral RegionWestern RegionSouthern Region
2.1% 1.9%
51.1%
21.3%
9.5%14.2%
Figure 3.7 Region wise shares—loan portfolio
Northern RegionNortheastern RegionEastern RegionCentral RegionWestern RegionSouthern Region
4.3% 1.8%
6.8%
54.8%22.5%
9.9%
Growth pattern across states had expectedly shown a diversification to non-traditional states outside the southern region. Manipur (660 per cent), followed by Meghalaya (453 per cent) and Punjab (325 per cent) posted the highest growth rates in client outreach on narrow bases. Of the mainstream states, Assam (126 per cent) and Gu-jarat (121 per cent) had the highest growth in cli-ent outreach. Tamil Nadu posted a growth rate of 93 per cent followed by Jharkhand, Bihar, Madhya Pradesh and Maharashtra. Again Manipur (436 per cent) led the loans growth chart with Meghalaya (362 per cent) and Delhi (206 per cent) following. In terms of loan volumes, among the mainstream states Assam (182 per cent), Bihar (102 per cent) and Tamil Nadu (100 per cent) were in the leader board followed by Madhya Pradesh and Gujarat. Thus, during the year 2010, non-traditional states have made faster progress, with the only exception being Tamil Nadu.
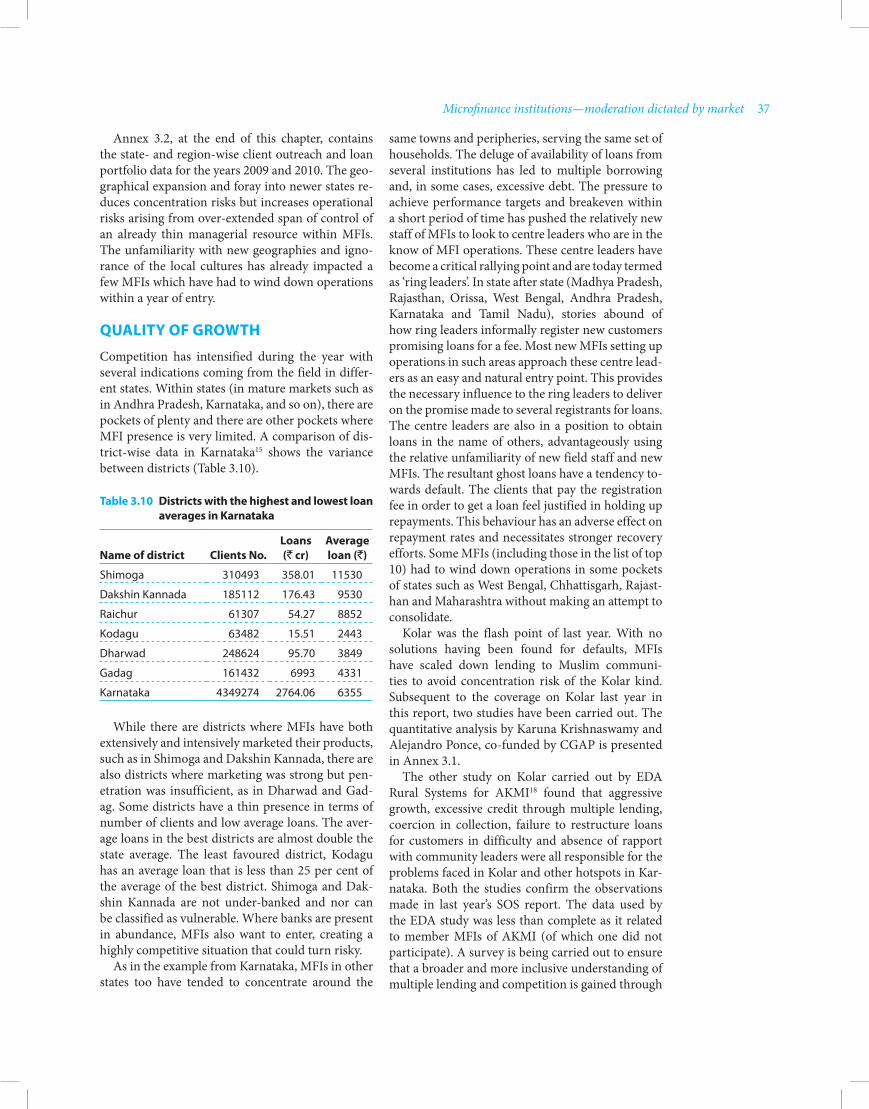
Microfinance institutions—moderation dictated by market 37
same towns and peripheries, serving the same set of households. The deluge of availability of loans from several institutions has led to multiple borrowing and, in some cases, excessive debt. The pressure to achieve performance targets and breakeven within a short period of time has pushed the relatively new staff of MFIs to look to centre leaders who are in the know of MFI operations. These centre leaders have become a critical rallying point and are today termed as ‘ring leaders’. In state after state (Madhya Pradesh, Rajasthan, Orissa, West Bengal, Andhra Pradesh, Karnataka and Tamil Nadu), stories abound of how ring leaders informally register new customers promising loans for a fee. Most new MFIs setting up operations in such areas approach these centre lead-ers as an easy and natural entry point. This provides the necessary influence to the ring leaders to deliver on the promise made to several registrants for loans. The centre leaders are also in a position to obtain loans in the name of others, advantageously using the relative unfamiliarity of new field staff and new MFIs. The resultant ghost loans have a tendency to-wards default. The clients that pay the registration fee in order to get a loan feel justified in holding up repayments. This behaviour has an adverse effect on repayment rates and necessitates stronger recovery efforts. Some MFIs (including those in the list of top 10) had to wind down operations in some pockets of states such as West Bengal, Chhattisgarh, Rajast-han and Maharashtra without making an attempt to consolidate.
Kolar was the flash point of last year. With no solutions having been found for defaults, MFIs have scaled down lending to Muslim communi-ties to avoid concentration risk of the Kolar kind. Subsequent to the coverage on Kolar last year in this report, two studies have been carried out. The quantitative analysis by Karuna Krishnaswamy and Alejandro Ponce, co-funded by CGAP is presented in Annex 3.1.
The other study on Kolar carried out by EDA Rural Systems for AKMI18 found that aggressive growth, excessive credit through multiple lending, coercion in collection, failure to restructure loans for customers in difficulty and absence of rapport with community leaders were all responsible for the problems faced in Kolar and other hotspots in Kar-nataka. Both the studies confirm the observations made in last year’s SOS report. The data used by the EDA study was less than complete as it related to member MFIs of AKMI (of which one did not participate). A survey is being carried out to ensure that a broader and more inclusive understanding of multiple lending and competition is gained through
Annex 3.2, at the end of this chapter, contains the state- and region-wise client outreach and loan portfolio data for the years 2009 and 2010. The geo-graphical expansion and foray into newer states re-duces concentration risks but increases operational risks arising from over-extended span of control of an already thin managerial resource within MFIs. The unfamiliarity with new geographies and igno-rance of the local cultures has already impacted a few MFIs which have had to wind down operations within a year of entry.
QuaLITy OF GROwTh
Competition has intensified during the year with several indications coming from the field in differ-ent states. Within states (in mature markets such as in Andhra Pradesh, Karnataka, and so on), there are pockets of plenty and there are other pockets where MFI presence is very limited. A comparison of dis-trict-wise data in Karnataka15 shows the variance between districts (Table 3.10).
Table 3.10 districts with the highest and lowest loan averages in Karnataka
Name of district
Clients No.
Loans (` cr)
average loan (`)
Shimoga 310493 358.01 11530
Dakshin Kannada 185112 176.43 9530
Raichur 61307 54.27 8852
Kodagu 63482 15.51 2443
Dharwad 248624 95.70 3849
Gadag 161432 6993 4331
Karnataka 4349274 2764.06 6355
While there are districts where MFIs have both extensively and intensively marketed their products, such as in Shimoga and Dakshin Kannada, there are also districts where marketing was strong but pen-etration was insufficient, as in Dharwad and Gad-ag. Some districts have a thin presence in terms of number of clients and low average loans. The aver-age loans in the best districts are almost double the state average. The least favoured district, Kodagu has an average loan that is less than 25 per cent of the average of the best district. Shimoga and Dak-shin Kannada are not under-banked and nor can be classified as vulnerable. Where banks are present in abundance, MFIs also want to enter, creating a highly competitive situation that could turn risky.
As in the example from Karnataka, MFIs in other states too have tended to concentrate around the
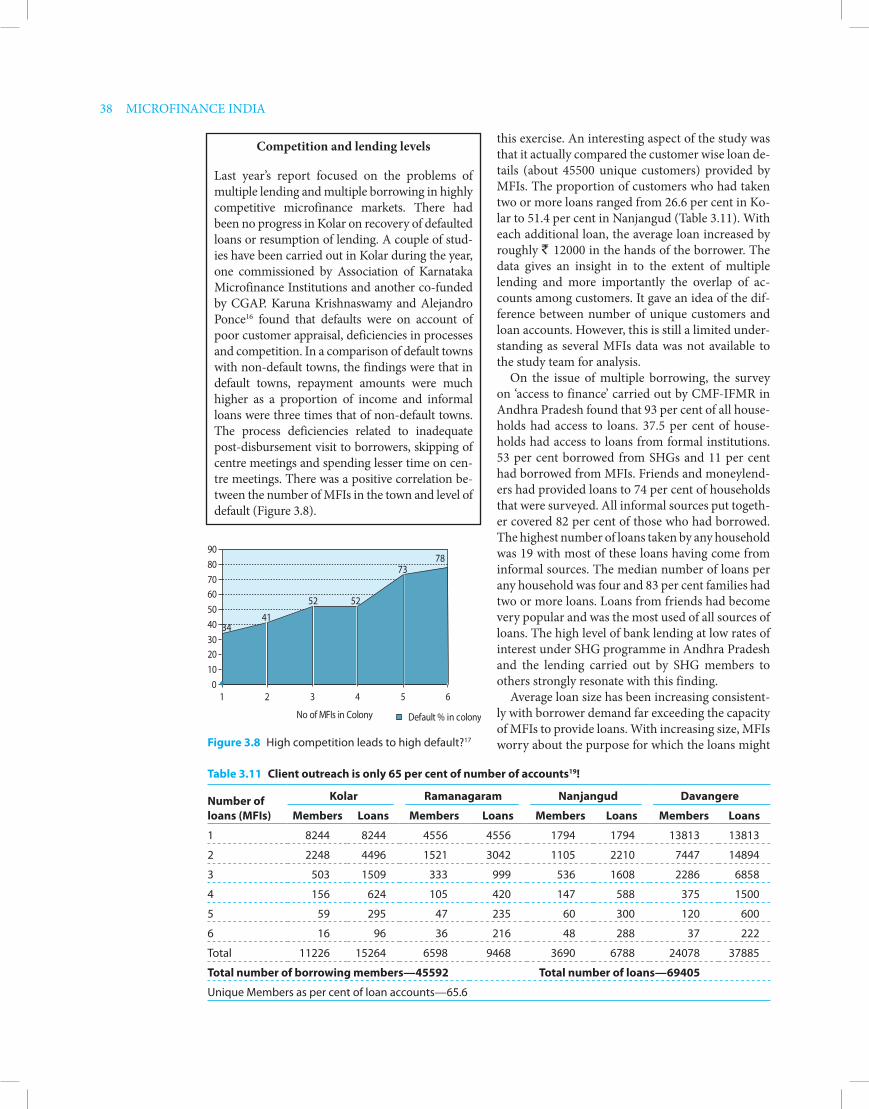
38 MICROFINANCE INDIA
this exercise. An interesting aspect of the study was that it actually compared the customer wise loan de-tails (about 45500 unique customers) provided by MFIs. The proportion of customers who had taken two or more loans ranged from 26.6 per cent in Ko-lar to 51.4 per cent in Nanjangud (Table 3.11). With each additional loan, the average loan increased by roughly ` 12000 in the hands of the borrower. The data gives an insight in to the extent of multiple lending and more importantly the overlap of ac-counts among customers. It gave an idea of the dif-ference between number of unique customers and loan accounts. However, this is still a limited under-standing as several MFIs data was not available to the study team for analysis.
On the issue of multiple borrowing, the survey on ‘access to finance’ carried out by CMF-IFMR in Andhra Pradesh found that 93 per cent of all house-holds had access to loans. 37.5 per cent of house-holds had access to loans from formal institutions. 53 per cent borrowed from SHGs and 11 per cent had borrowed from MFIs. Friends and moneylend-ers had provided loans to 74 per cent of households that were surveyed. All informal sources put togeth-er covered 82 per cent of those who had borrowed. The highest number of loans taken by any household was 19 with most of these loans having come from informal sources. The median number of loans per any household was four and 83 per cent families had two or more loans. Loans from friends had become very popular and was the most used of all sources of loans. The high level of bank lending at low rates of interest under SHG programme in Andhra Pradesh and the lending carried out by SHG members to others strongly resonate with this finding.
Average loan size has been increasing consistent-ly with borrower demand far exceeding the capacity of MFIs to provide loans. With increasing size, MFIs worry about the purpose for which the loans might
Competition and lending levels
Last year’s report focused on the problems of multiple lending and multiple borrowing in highly competitive microfinance markets. There had been no progress in Kolar on recovery of defaulted loans or resumption of lending. A couple of stud-ies have been carried out in Kolar during the year, one commissioned by Association of Karnataka Microfinance Institutions and another co-funded by CGAP. Karuna Krishnaswamy and Alejandro Ponce16 found that defaults were on account of poor customer appraisal, deficiencies in processes and competition. In a comparison of default towns with non-default towns, the findings were that in default towns, repayment amounts were much higher as a proportion of income and informal loans were three times that of non-default towns. The process deficiencies related to inadequate post-disbursement visit to borrowers, skipping of centre meetings and spending lesser time on cen-tre meetings. There was a positive correlation be-tween the number of MFIs in the town and level of default (Figure 3.8).
Figure 3.8 High competition leads to high default?17
01 2 3 4 5 6
102030405060708090
No of MFIs in Colony Default % in colony
3441
52 52
7378
Table 3.11 Client outreach is only 65 per cent of number of accounts19!
Number of loans (MFIs)
Kolar Ramanagaram Nanjangud davangere
Members Loans Members Loans Members Loans Members Loans
1 8244 8244 4556 4556 1794 1794 13813 13813
2 2248 4496 1521 3042 1105 2210 7447 14894
3 503 1509 333 999 536 1608 2286 6858
4 156 624 105 420 147 588 375 1500
5 59 295 47 235 60 300 120 600
6 16 96 36 216 48 288 37 222
Total 11226 15264 6598 9468 3690 6788 24078 37885
Total number of borrowing members—45592 Total number of loans—69405
Unique Members as per cent of loan accounts—65.6

Microfinance institutions—moderation dictated by market 39
and Northern regions had higher levels of default compared to West and South. MFIs in NBFC form had much lower default rates compared to Section 25 companies which had the highest default rates. Default tended to be higher with age of the MFI. MFIs that were in business for more than 10 years had current repayment rates of 95.8 per cent com-pared with MFIs which were less than five years old having current repayment of 97.3 per cent. When growth rates of portfolio in older MFIs abate, the PARs catch up, making for higher PARs.
On the question of defaults, Mani Nandi of Uni-versity of Delhi22 had carried out a study in and around Delhi. The small study23 which covered 339 clients found that 279 had been maintaining their repayment schedules while 60 were defaulters. The number of EMIs paid was 435 and that which were remaining to be paid including those in default was 449. The ratio of defaulters to total clients was 2.2:10. However, in the books of the MFI, there had been zero default on account of the joint liability mecha-nism working efficiently. The defaults placed a huge burden on the remaining members in the group. The analysis showed that nine clients had to bear an extra ` 1210 to repay 48 remaining instalments of a borrower. This amounted to almost 20 per cent of the loan that each of them had taken from the MFI. Apart from the normal interest rates which are in the range of 30 per cent, a capital charge of 20 per cent is too big a burden for the poor to bear. Even after the defaulters’ remaining liabilities to the MFI had been met by the group members, MFI closed down the centres where these problems occurred.
be used. In several locations, field staff of different MFIs desired that borrowers should be asked to de-clare the purpose of loans and that the end use of loans must be verified.
Table 3. 12 usage of loan money by lender type20
Loan usage for
Bank (per cent)
JLG (per cent)
ShG (per cent)
Informal (per cent)
Start new business 2.0 2.5 1.9 1.1
Buy agri inputs 57.5 13.2 19.3 19.9
Purchase stock 3.0 9.9 4.2 2.7
Repay old debt 14.6 25.4 20.4 7.0
Health 11.4 10.9 18.6 25.3
Marriage 4.3 4.8 2.2 12.2
Funeral 0.1 0.2 0.5 1.7
Other festival 0.6 3.5 3.6 4.8
Home improvement 9.7 22.1 13.0 14.2
Unemployment 0.0 0.0 0.1 0.8
Purchase land 0.8 0.9 0.7 0.6
Education 4.1 4.4 5.7 5.3
Purchase of jewellery 0.5 0.6 1.6 0.4
Does ascertainment of loan purpose and monitoring help?
The data collated in CMF’s study in Andhra Pradesh seems to indicate that where the bor-rower is asked to declare a purpose for the loan and is monitored, the loan is likely to be applied for the purpose. CMF’s study on Access to Fi-nance in Andhra Pradesh found that borrowers from banks applied a large part of their loans for income generating activities—especially for agricultural inputs (Table 3.12). Whereas in case of MFI loans (JLGs), the use was more towards non-income generating purposes.
An important fact about bank loans is that the borrower has to state the purpose of the loan against which the bank assesses the credit re-quirement. The loan disbursement is followed up by a visit to check use of the loan. In case of other lenders, such a procedure does not exist for many reasons. But with loan sizes increasing, is it time that loans are given for a purpose, monitored to ensure asset acquisition, and regulated to im-prove the probability of income enhancement.
Customer acquisition does not seem to focus on homogeneity of groups and clusters. The heterogene-ity of customers within groups and clusters creates problems in repayment discipline. The CGT, GRT21 exercises in the recent past have failed to deliver on their objectives. With changing lifestyles of custom-ers and increased value for time, weekly meetings are under grave threat. Borrowing members attend meet-ings reluctantly fearing loss of wages and opportunity costs. Multiple loans and heterogeneous groups have tended to weaken loyalty of the customer to the MFIs and induced indiscipline in repayment.
The rising defaults in MFIs are a cause for con-cern. The ‘Side By Side’ report brought out by Sad-han for the year 2009 reveals that the honeymoon between customers and MFIs is rapidly coming to an end. Current repayment rates which were at a three year high of 99.1 per cent in 2008 had de-clined to 96.87 per cent in 2009. The portfolio at risk over 60 days doubled from 0.9 per cent to 1.82 per cent. A detailed analysis shows that MFIs with larg-er portfolios had lower default rates and MFIs with smaller portfolios had higher default rates. Eastern

40 MICROFINANCE INDIA
It looks unfair that the joint liability mechanism works one way. When the members show responsi-ble repayment behaviour despite considerable odds and personal deprivation, the MFI shuts down the centre at the end of loan cycle to the detriment of good repaying members. As for the reasons for such defaults, an important factor brought out in the study was the presence of ring leaders who mobilize groups and also corner some of the loans taken in the names of others.
PROduCTS aNd PROCeSSeS
In general, the MFIs have restricted themselves to the weekly repayment instalment product. The product is easy for the MFIs to market, process and recover. It requires a simple software application to monitor and simple training of staff. While there are new labels introduced in the product profile of sev-eral MFIs, the basic loan remains the same. How-ever, some MFIs have come out with fresh ideas on products that balance traditional microfinance with the specified needs of the poor. Equitas provides a food security loan which is a revolving cash credit that helps a borrower buy monthly articles of con-sumption and repay it within a month’s time. Usu-ally a credit limit of ` 1500 is available to the mem-ber of Equitas Dhanya Kosha. The loan ensures that the household does not go hungry for want of cash to buy food. SKS has designed a revolving credit product for financing requirements of small kirana stores (in the slums) with a tie-up to Metro Cash and Carry chain.24
The design of the loan product is always a chal-lenge. Designing a product to provide flexibility to the customer in repayment of loans to suit their in-come flows is rare. South Indian Federation of Fish-ermen Societies (SIFFS) in Tiruvananthapuram has a portfolio of products with flexible repayments that are aligned to the nature of livelihoods of its cus-tomers.
Such innovative products to cater to real require-ments of customers are few and not commonly found in use. With loan sizes increasing and in some cases being adequate to support a significant part of live-lihood activities, there has been no move towards either increasing the turnover of loans to a longer pe-riod or changing the repayment instalments to suit the cash flows that might arise from the livelihoods. The reluctance to change the loan product features can prove to be an impediment to portfolio expan-sion. Single product companies carry considerable risk potential and this more than any other factor is likely to impact MFIs in the near future.
Innovative products: Sangam stores model of SKS
About 3 lakh customers of SKS (5 per cent of cli-ents) are running small kirana25 stores typically in urban slums. This loan product is focused on such borrowers from SKS who own kirana stores. It enables them to buy FMCG and groceries for trading through a wholesale vendor at competi-tive prices with cost and time savings on trans-port. By providing finance and delivery services to kirana stores, their volume of business and in-comes could be enhanced. Financing the goods (working capital) and order consolidation are the important roles played SKS in this model.
SKS partnered with Metro—an internation-al hypermarket wholesale chain—that offers 13000 different products. Kirana stores can buy goods from Metro by placing an order through mobile phone, and get the same delivered to the shop. SKS makes payment for the goods deliv-ered to the Kirana shop directly to Metro and accounts for the same as a loan to the custom-er in its books. This loan is a revolving credit, which is interest free and must be repaid within a fortnight. Kirana stores can keep up the cycle of ordering goods, paying for the goods within a fortnight and ordering again continuously in ac-cordance with the needs of business. SKS gener-ates revenue from a commission paid by Metro on the transaction value of goods purchased by the Kirana stores.
A pilot launched in Sangareddy and Amber-pet branches has been extended to 30 branches in urban areas of Hyderabad, Bangalore and New Delhi with multiple wholesale suppliers.
Pilot highlights:
Number of cycles: 4 cycles/monthNumber of branches covered: 45Number of sangam stores enrolled: 3300Total order size (cumulative): ` 180 millionAverage order size/store : ` 4000 Variety of products supplied: 210Average Loan size (`): 4000–25000Repayment of loans: 100 per centLead time (From order to final delivery): 24 hrs
SKS has also developed MIS for order collec-tion and loan tracking for stores to facilitate scal-ing up the programme in multiple locations. A GPRS enabled mobile phone is used as front end to collect orders and process through a central server.

Microfinance institutions—moderation dictated by market 41
borrowers who failed to repay on time and whose obligations are met by other group members. In some cases, the other group members are provided top-up loans that enable them to find cash for re-payment of the defaulting loans. These practices are commonplace in quite a few locations especial-ly where competition is severe. In the absence of ‘individual loan repayment’ tracking mechanisms, it is difficult to say whether the low default record is built actually on the basis of a disciplined clien-tele, on the basis of the joint liability mechanism, or because of ever greening resorted to in a covert manner by the MFIs.
The other side of this coin is the expectation among funders and investors that the MFIs will have a zero default record. Decades of financial sector ex-perience is that loans given do not always come back on time. Microfinance being no different from rest of the financial sector, there should be acceptance of the fact that MFIs will face a level of defaults. The emphasis should be on knowing the extent of de-fault in the loan portfolio, controlling problems and keeping the defaults at low levels. A framework that fails to accept the probability of default ensures that poor quality information is provided to superficially satisfy the funders and investors. Sooner than later the sector should come to a consensus on what is a reasonable level of default, a range that would be seen as normal and could still render the MFIs an investment grade entity rather than going by the zero and less than 1 per cent PAR as indicators of portfolio quality.
The PAR should also be measured against the stock of loans that has been given out some time back. The continuing measurement of loans in de-fault as a proportion of current loans which are ever growing does not provide a sufficiently valid basis for conclusions about portfolio quality. It would be desirable to measure PAR as instalments not paid on time against loans that have been given till three months before the date on which the PAR is mea-sured.
GOveRNaNCe
Governance of MFIs had improved over the last few years, as was also commented in the last year’s re-port. The NBFC MFIs, in particular, have brought in professionals to their boards. Audit committees, executive compensation committees and the like have been set up. The annual report disclosures indicate the hard work put in by these committees. Ujjivan’s annual report contained the results of a comprehensive pilot impact evaluation study, which
Similarly, processes of the MFIs have remained the same despite a distinct change in the nature of customer expectations and cost implications. Some MFIs have benefited from process mapping exer-cises, while many others are loath to change long standing processes relating to customer acquisition, loan sanction and disbursement, monitoring and recovery of defaults. Understanding the customer’s situation and appraising the customer and her loan proposal are important entry point activities that are not part of the existing processes. The risks posed by lack of deep engagement with customer at the initial stage is sought to be offset by limiting the loan size. The total loan amount given to several customers at the same level of ignorance does not constitute a better risk than larger loans given to limited num-ber of customers. What may bring down the risk is better credit decisions based on good appraisals, in which case the loans could be larger.
The reporting of PAR has been a contentious one. Several institutions have been reporting 100 per cent recoveries. Some report between 99 per cent to 100 per cent on-time payment. These num-bers hide the fact that there are several individual
Customer friendly repayment structure26
Loans from SIFFS are available for produc-tion, consumption, marketing and investment in livelihood assets. Most loans are extended to fishermen for fishing activities. Women, includ-ing fisherwomen are also provided with loans to pursue livelihood activities including fish vending. The loan amounts range from as little as ` 2,000 for consumption purposes to crew members to as high as ` 75,000 for production purposes for fishing boat owners for the pur-chase of boat, outboard motor, and consumables like, iceboxes, nets, and so on. The loans to fish-ermen are priced at 12 per cent on production loans and 14 per cent on consumption loans. The repayment periods range from 12 months to 36 months depending on the purpose. While fixing the repayment instalments, SIFFS has taken the seasonality and uncertainty of income flows into consideration and provided a longer tenor over which the instalments have to be paid. For exam-ple, a loan of 12 monthly instalments is repayable in 14 months and a loan with 36 monthly instal-ments is repayable in 42 months. This flexibility has been built because the lean and off-seasons would not produce income flows to meet the monthly loan repayments in full.
42 MICROFINANCE INDIA
of life. This competition does not terminate in the market place. There are some states where state authorities have formed a negative view of the op-erations of MFIs on the basis of reported interest rates and complaints of coercive recovery practices. In Andhra Pradesh and Tamil Nadu, the state gov-ernments have tried to use law and administrative controls to curb the influence of MFIs. In Kerala, the state government had asked the NBFCs to reg-ister under the Money Lender’s Act, which has been upheld by the Supreme Court. While RBI does not interfere in the pricing policies of MFIs registered with it, the MFIs now have to abide by the state gov-ernment’s policies on reasonable interest rates.
The media attention on microfinance has changed in character from curiosity and admiration to critical probing into the hidden flaws. Both the Indian press and foreign press have found microfinance stories interesting, especially on themes like multiple
was a commendable exercise. It carried a study of about 3000 clients that measured their progress out of poverty and reported the results transparently. After the failure of Satyam group of Companies, the independent directors on boards have turned wary. The vicarious liability fixed on independent direc-tors in the infamous Union Carbide case (Bhopal gas disaster) has done little to allay apprehensions of directors on company boards. It is reported that it is becoming increasingly difficult to find indepen-dent directors. The result is that some professionals in the sector have to be on several boards, raising conflict of interest.
The promoter group actions in configuring the equity holdings and especially at the time of trans-formation of NGOs in NBFC MFIs have been less than transparent. Some of the large MFIs have been accused of mal-governance at material points of time in a bid to retain control over the MFI after transformation. The creation of Mutual Benefit Trusts (MBTs) and their governance has come un-der severe criticism. Whether the trustees of MBTs took decisions in the best interest of the beneficia-ries is a question that is repeatedly posed. While all the required legal and ethical issues might have been satisfactorily attended to, the lack of informa-tion in the public domain and non-availability of facts when required create a negative opinion of concerned institutions in the public eye.
But the fact that such occurrences were allowed by boards with professional directors is a sad com-mentary on the gravity with which the governance responsibility is taken up. Governance workshops for directors on the board and senior management seem an urgent necessity. The influence of the pro-moter over boards has been perceived to be exces-sive in some MFIs and must be scaled back. Cousin boards and subservient independent directors have been used to ensure that the companies run on the lines of promoter’s thinking rather than on what is in the best interests of the company.
The induction of equity investor’s representatives on the boards has changed the dynamics for the bet-ter. Qualitative improvement has been noticed in the careful structuring of agenda for boards, the presen-tation of information, discussion and decision mak-ing. Only in the aspect of mission fulfilment, these boards do not seem to be fully engaged.
OPeRaTING eNvIRONMeNT
Apart from competition among the MFIs, compe-tition with SHG lending programmes, especially those run by the state governments, has been a fact
Kerala Moneylending Act implications
Two Southern Indian states, Andhra Pradesh and Kerala, are seeking to increase regulation on NBFCs and MFIs operating in their respective re-gions. The two governments are demanding that NBFCs register under local moneylender laws, which, in the case of Kerala MFIs, would lead to interest rate regulation. Currently, NBFCs (a legal structure commonly adopted by for-profit MFIs) are subject to regulation under the RBI.
In Andhra Pradesh, the relevant policy, called the Andhra Pradesh Scheduled Area Moneylend-ers Regulations, 1960, (APSAMR) is applicable only in certain tribal areas. Government officials claim the push toward greater regulation is geared at protecting borrowers. NBFCs operating in the area of Andhra Pradesh under the jurisdiction of the regulation would be in danger of having their licence revoked by the government should their interest rates be deemed too high by state officials. This would apply to all MFIs registered as NBFCs. The move comes as part of Andhra Pradesh’s tough stance on MFI practices. In April 2010, the Andhra Pradesh government announced that it would file criminal charges against any MFI that engaged in ‘inhuman’ loan recovery practices. The govern-ment has constituted task forces in every district to investigate complaints and grievances of cus-tomers. While the government has exempted non-NBFC MFIs from APSAMR, lenders operating in the area are being cautious. According to the Eco-nomic Times, two of the four MFIs operating in the

Microfinance institutions—moderation dictated by market 43
In conclusion, the sector is no more delicately placed in the sense of being vulnerable or uncertain. The institutions understand the expectations of other stakeholders and their own responsibilities. In
borrowing, default crisis, high interest rates, coercive recoveries and the IPO at high valuations. During the past year, positive stories on microfinance were few. The failure in public relations, if any, of the sector was its preoccupation with business to the exclusion of positive engagement with the press and media.
The last year’s report referred to new start-up institutions promoted by professionals who want to combine a development orientation with enter-prise acumen. Some of these start-ups have caught the fancy of the other stakeholders and have ramped up business very quickly. MFIs in this class start with a clear mission, vision and resources to support the same. The initial systems and human resources are well planned. On account of their convincing initial business case they have been able to find equity and loan funding. Suryodaya Microfinance was able get venture capital even be-fore commencing business. Utkarsh Microfinance received equity investment from IFC even in the initial months of its operations. In the current year, the report profiles another start-up in Eastern In-dia, which takes an integrated view of financial services to customer.
Khammam district (which falls under the regula-tion’s jurisdiction) have moved out of the area for fear of the government changing its mind on the exemption.
Meanwhile in Kerala, a court battle raging be-tween NBFCs and the government in light of its demand that NBFCs register under the Kerala Moneylending Act, 1946 (KMA) has been decid-ed by the Supreme Court in favour of the govern-ment. The Kerala NBFC Association argues that by forcing companies to register under the KMA, NBFCs are being subjected to double regulation since they are already regulated by the RBI. The government’s position is that borrowers must be protected from high interest rates. The KMA ensures that moneylenders cannot charge more than 2 per cent over the RBI’s prescribed rate of interest, which currently stands at 11 per cent to 12 per cent. Microfinance interest rates average 25 per cent to 30 per cent.
The Supreme Court decision against Shiram Transport Finance Company has left the gov-ernment in a position to implement KMA reg-ulations on NBFCs. This could have a serious impact on MFIs operating in Kerala. Moving for-ward, the effects of moneylending regulation on microfinance-focused NBFCs could offer valu-able lessons on interest rate management.
Anjali Microfinance
A recent Kolkata based start-up, Anjali, has a set of professional promoters. Its vision is to cover 1 million customers by 2015. It has eight branches in West Bengal and 12 branches in Bihar are to be opened shortly. The MFI has a hub and spoke model that focuses on areas where there is no other MFI and, therefore, very little competition. The branches are located on the peripheries of towns and the field staff is required to travel deep from the location of the branch so that roadside and town-centric customers (where competition is high) are avoided.
The MFI focuses on savings, insurance and credit, and tries to deliver all the three services in an integrated manner. It has a suite of credit products, which are basically year long weekly instalment loans, except one product which is for a period of two years for enterprise activity. It promotes savings through a savings linked life insurance product, in which members could accumulate savings in a regulated form. With a minimum saving of ` 100 per month, the life cover is avail-able for 10 years. In the initial few months, 2300 customers have enrolled for this savings product which is offered in partnership with Aviva. A fam-ily health insurance product is also offered (with Bharti Axa). This is a cashless policy that covers the husband, wife and two children. Loss of wages are compensated in case of hospitalization for up to three days at the rate of ` 100 per day. All bor-rowing customers are insured for health with the present coverage at 4500.
The passbook issued by the MFI is informative from a customer’s point of view and contains all the insurance certificates as well. The disclosure levels are comfortably high. Toll free numbers of the insurer are given in the pass book. An ERP solution to take care of accounting and MIS needs has been installed. The staff employed is local with a bias towards women. Following a system-atic approach, an operations policy and opera-tions manual have been prepared and issued to branches and staff. While reaching a million cus-tomers within five years might seem a tall order, looking to performance of similar start-ups of the past such as Ujjivan and Equitas, one many not be surprised if Anjali achieves its target.

44 MICROFINANCE INDIA
The attempts to enforce compliance with code of conduct could easily transform into self-regulation. The move to appoint an ombudsman by MFIN is a welcome one as it provides an external arbiter for customers with a grievance.
The basic intra-institutional issue in the sector today relate to interest rates, excessive debt and co-ercive recovery practices. While interest rates are not much in the control of MFIs (they could pass on cost savings arising from enlarged volumes and improved efficiencies), more could be done on the other two aspects. The larger issues are in gover-nance and failure to innovate especially on products. These two aspects need more attention. The con-certed action taken by the MFIs especially through MFIN, hold out the hope that the customers could benefit from more responsible financing in future. These networks have also to push the agenda of gov-ernance and innovations forward.
terms of ideas and options for action there are fewer uncertainties. Clear directions are available and the implications of choosing each option are fairly well known. It is now up to the institutions to define their vision and decide whether the original mandate re-mains valid as they embark upon the next stage of their growth. While some old problems continue, new ones have cropped up in the sector. But the MFIs have shown a great ability in taking even large problems in their stride and marching along their growth path. Learning from last year’s experiences, the sector has invested time in refining a code of conduct, framing some rules of competition, risk management at the sector level through voluntary restraint on excessive lending, greater transparency, participating in credit bureaus as also information dissemination to external stake holders. The work being done by MFIN and Sadhan with regard to code of conduct and transparency is commendable.
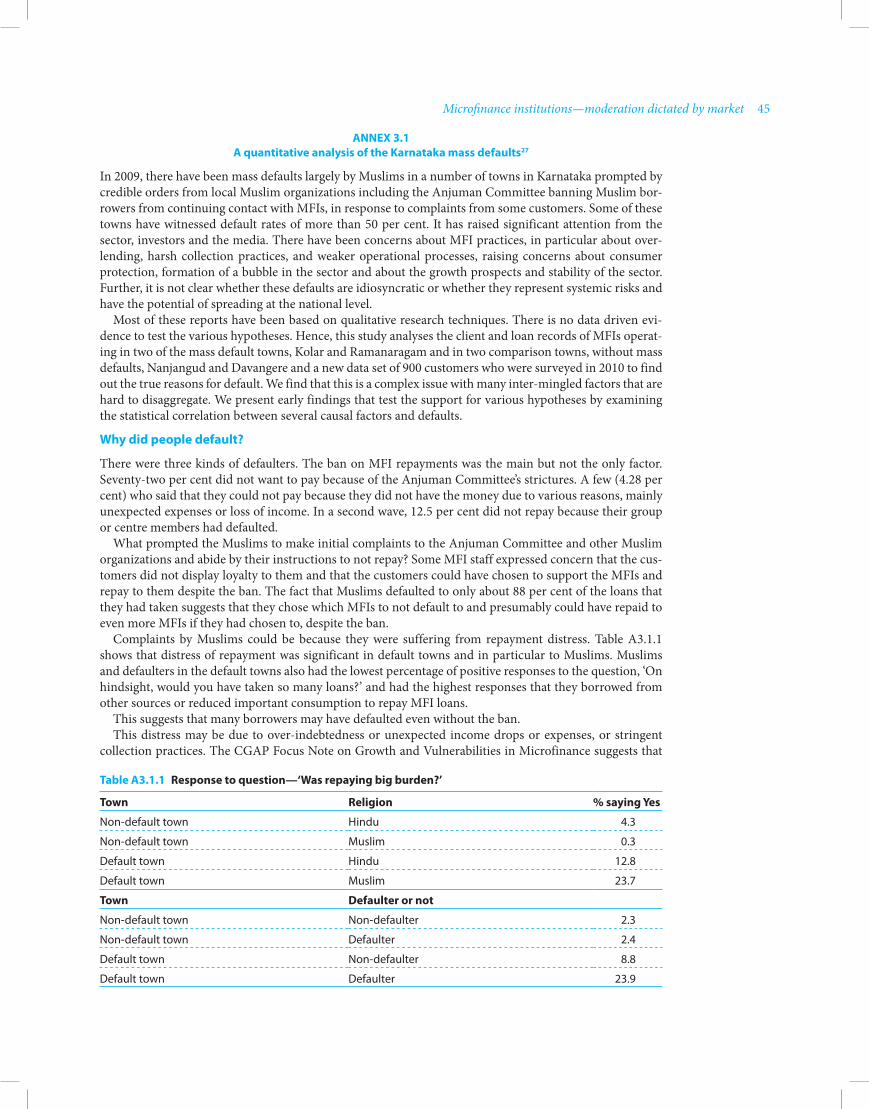
Microfinance institutions—moderation dictated by market 45
Table a3.1.1 Response to question—‘was repaying big burden?’
Town Religion % saying yes
Non-default town Hindu 4.3
Non-default town Muslim 0.3
Default town Hindu 12.8
Default town Muslim 23.7
Town defaulter or not
Non-default town Non-defaulter 2.3
Non-default town Defaulter 2.4
Default town Non-defaulter 8.8
Default town Defaulter 23.9
aNNeX 3.1 a quantitative analysis of the Karnataka mass defaults27
In 2009, there have been mass defaults largely by Muslims in a number of towns in Karnataka prompted by credible orders from local Muslim organizations including the Anjuman Committee banning Muslim bor-rowers from continuing contact with MFIs, in response to complaints from some customers. Some of these towns have witnessed default rates of more than 50 per cent. It has raised significant attention from the sector, investors and the media. There have been concerns about MFI practices, in particular about over-lending, harsh collection practices, and weaker operational processes, raising concerns about consumer protection, formation of a bubble in the sector and about the growth prospects and stability of the sector. Further, it is not clear whether these defaults are idiosyncratic or whether they represent systemic risks and have the potential of spreading at the national level.
Most of these reports have been based on qualitative research techniques. There is no data driven evi-dence to test the various hypotheses. Hence, this study analyses the client and loan records of MFIs operat-ing in two of the mass default towns, Kolar and Ramanaragam and in two comparison towns, without mass defaults, Nanjangud and Davangere and a new data set of 900 customers who were surveyed in 2010 to find out the true reasons for default. We find that this is a complex issue with many inter-mingled factors that are hard to disaggregate. We present early findings that test the support for various hypotheses by examining the statistical correlation between several causal factors and defaults.
why did people default?
There were three kinds of defaulters. The ban on MFI repayments was the main but not the only factor. Seventy-two per cent did not want to pay because of the Anjuman Committee’s strictures. A few (4.28 per cent) who said that they could not pay because they did not have the money due to various reasons, mainly unexpected expenses or loss of income. In a second wave, 12.5 per cent did not repay because their group or centre members had defaulted.
What prompted the Muslims to make initial complaints to the Anjuman Committee and other Muslim organizations and abide by their instructions to not repay? Some MFI staff expressed concern that the cus-tomers did not display loyalty to them and that the customers could have chosen to support the MFIs and repay to them despite the ban. The fact that Muslims defaulted to only about 88 per cent of the loans that they had taken suggests that they chose which MFIs to not default to and presumably could have repaid to even more MFIs if they had chosen to, despite the ban.
Complaints by Muslims could be because they were suffering from repayment distress. Table A3.1.1 shows that distress of repayment was significant in default towns and in particular to Muslims. Muslims and defaulters in the default towns also had the lowest percentage of positive responses to the question, ‘On hindsight, would you have taken so many loans?’ and had the highest responses that they borrowed from other sources or reduced important consumption to repay MFI loans.
This suggests that many borrowers may have defaulted even without the ban. This distress may be due to over-indebtedness or unexpected income drops or expenses, or stringent
collection practices. The CGAP Focus Note on Growth and Vulnerabilities in Microfinance suggests that

46 MICROFINANCE INDIA
Aver
age
info
rmal
loan
(`)
0 1
0 Non-default Towns 1 Default Towns
8,000
6,000
4,000
2,000
0
Figure a3.1.2 Informal loan amounts
fast growth of MFIs could lead to weaker operational processes and relationship management. This may in turn lead to poorer selection of clients and less monitoring of loan utilization, leading to poorer repayment performance.
Weaker relationship between the customers and the MFI may lead to apathy by the customers. Further, it is well established that entry of new lenders in the absence of a credit information system decreases incen-tives for existing customers to repay existing loans, because of the expectation that they can get fresh loans from new lenders.
what could be the reasons for distress?
Over-indebtedness
Number of MFI loans and average MFI debt levels, as proxied by weekly total repayments to all MFIs is not significantly different between default towns, Muslims or non-Muslims or defaulters and non-defaulters. This suggests it is not average MFI debt or multiple borrowing per se which is the fundamental problem.
But, other measures of indebtedness such as debt-to-income-per-household-member ratio (Figure A3.1.1) are significantly correlated to defaults and are higher in default towns.
0.0
0.5
1.0
1.5
2.0
Mon
thly
repa
ymen
t to
per c
apita
inco
me
ratio
0 1
0 Non-default Towns 1 Default Towns
Figure a3.1.1 Debt-to-income-per-household-member ratio
However, as Figure A3.1.2 shows, informal loan amounts are higher in the default towns. Unexpected drops to income show a similar pattern.
This suggests that MFIs could use more sophisticated measures to assess debt absorption capacity includ-ing informal loan information.

Microfinance institutions—moderation dictated by market 47
Table a3.1.2 Loan officer practices
Question average ‘yes’ response per customer
Did Loan Officer visit before loan disbursement?
Non-mass default towns 99%
Mass default towns 94%
did Loan Officer visit after loan disbursement?
Non-mass default towns 89%
Mass default towns 77%
did Loan Officer ever skip centre meetings?
Non-mass default towns 13%
Mass default towns 24%
did meeting times decrease over time?
Non-mass default towns 0%
Mass default towns 15%
To address the possibility that there were weaker systems and controls in the default towns, customers were asked questions about loan officer practices before the ‘MFI problems’. Table A3.1.2 suggests that all indicators are consistently worse in the default towns, suggesting that this could be well be a causal factor in leading to larger numbers of less carefully screened clients who were not monitored well.
The percentage of clients who were initially approached for membership by the centre manager is lower in default towns while percentage of clients who were first approached by the centre leader or group leader is higher in default towns, supporting anecdotal evidence that loan officers identified centre leaders and relied on them to identify customers, transferring client relationship management to them. This may have decreased the relationship between MFI and customer and reduced knowledge about the creditworthiness of clients.
Further, twice the number of the respondents in default towns were using loans for non-business ex-penses (including repaying other loans and lending to others) compared to comparison towns, pointing to weaker loan utilization checks.
why did the Muslim borrowers not support the MFIs?
The fact that defaulters did not default on loans to all MFIs but did so selectively implies, among other things, that customers could have chosen to repay more loans than they did and over-ride the ban against MFIs. Competition could well be a factor. Presence of a large number of lenders might have provided incen-tives for customers to default on existing loans thinking that they would get new loans from other MFIs. Table A3.1.3 below suggests that default rates (per cent of loans defaulted to in a colony) increase with the number of MFIs per colony while average debt (not shown) does not rise at the same pace.
Table a3.1.3
Competition and default rates per colony in default towns
No. MFIs per colony % of loans defaulted
1 34
2 41
3 52
4 52
5 73
6 78
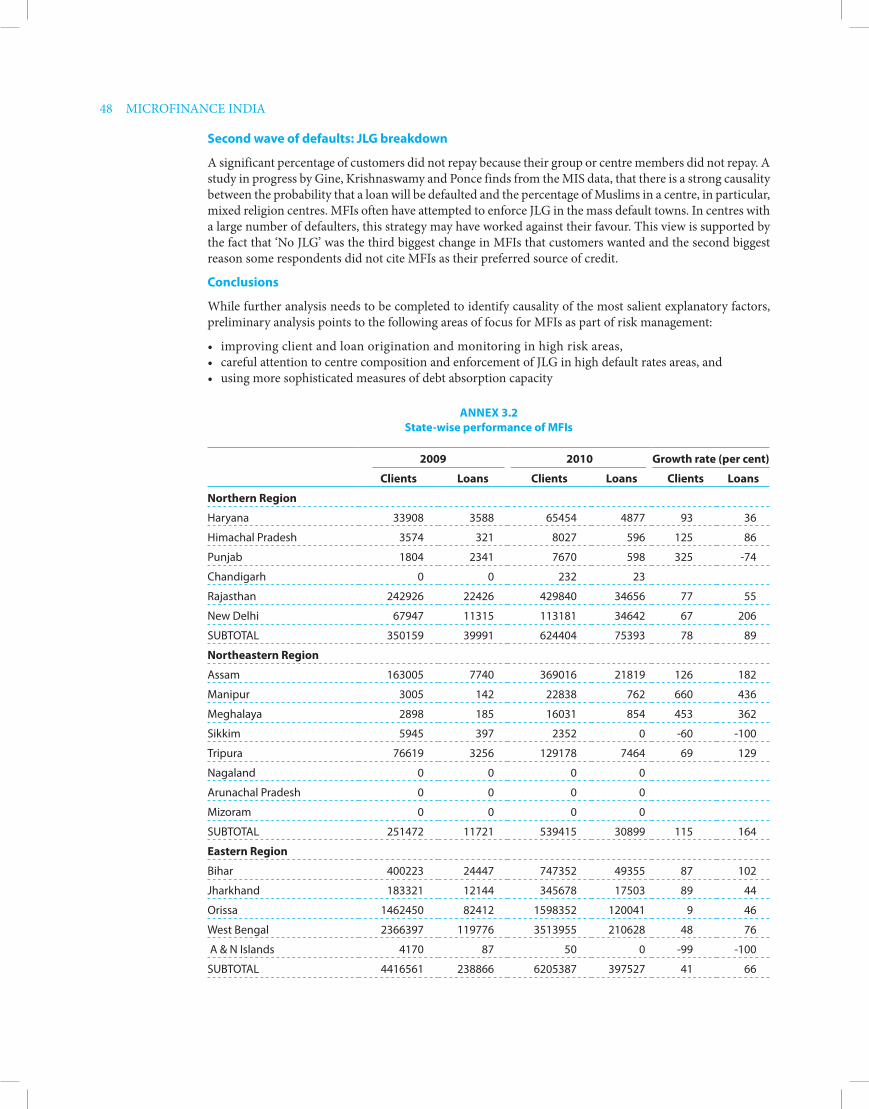
48 MICROFINANCE INDIA
Second wave of defaults: JLG breakdown
A significant percentage of customers did not repay because their group or centre members did not repay. A study in progress by Gine, Krishnaswamy and Ponce finds from the MIS data, that there is a strong causality between the probability that a loan will be defaulted and the percentage of Muslims in a centre, in particular, mixed religion centres. MFIs often have attempted to enforce JLG in the mass default towns. In centres with a large number of defaulters, this strategy may have worked against their favour. This view is supported by the fact that ‘No JLG’ was the third biggest change in MFIs that customers wanted and the second biggest reason some respondents did not cite MFIs as their preferred source of credit.
Conclusions
While further analysis needs to be completed to identify causality of the most salient explanatory factors, preliminary analysis points to the following areas of focus for MFIs as part of risk management:
• improvingclientandloanoriginationandmonitoringinhighriskareas,• carefulattentiontocentrecompositionandenforcementofJLGinhighdefaultratesareas,and• usingmoresophisticatedmeasuresofdebtabsorptioncapacity
aNNeX 3.2 State-wise performance of MFIs
2009 2010 Growth rate (per cent)
Northern Region Clients Loans Clients Loans Clients Loans
Northern Region
Haryana 33908 3588 65454 4877 93 36
Himachal Pradesh 3574 321 8027 596 125 86
Punjab 1804 2341 7670 598 325 -74
Chandigarh 0 0 232 23
Rajasthan 242926 22426 429840 34656 77 55
New Delhi 67947 11315 113181 34642 67 206
SUBTOTAL 350159 39991 624404 75393 78 89
Northeastern Region
Assam 163005 7740 369016 21819 126 182
Manipur 3005 142 22838 762 660 436
Meghalaya 2898 185 16031 854 453 362
Sikkim 5945 397 2352 0 -60 -100
Tripura 76619 3256 129178 7464 69 129
Nagaland 0 0 0 0
Arunachal Pradesh 0 0 0 0
Mizoram 0 0 0 0
SUBTOTAL 251472 11721 539415 30899 115 164
eastern Region
Bihar 400223 24447 747352 49355 87 102
Jharkhand 183321 12144 345678 17503 89 44
Orissa 1462450 82412 1598352 120041 9 46
West Bengal 2366397 119776 3513955 210628 48 76
A & N Islands 4170 87 50 0 -99 -100
SUBTOTAL 4416561 238866 6205387 397527 41 66
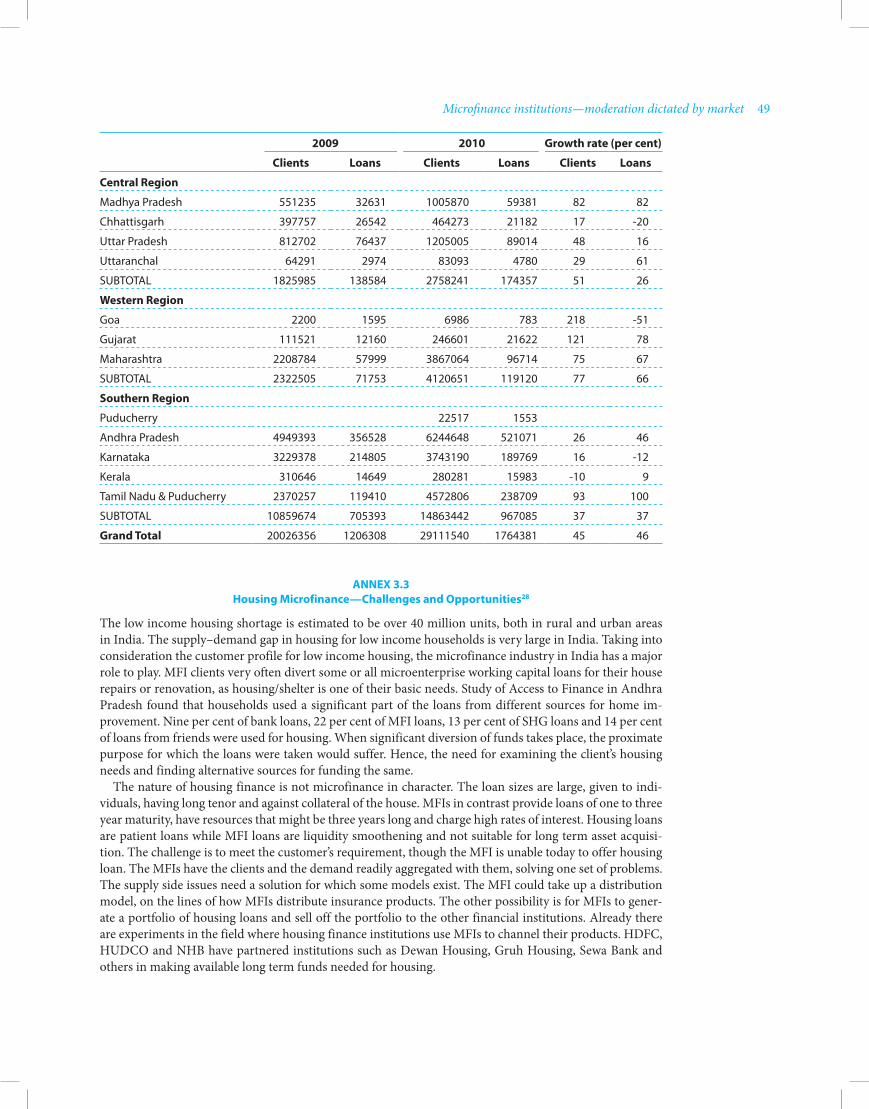
Microfinance institutions—moderation dictated by market 49
2009 2010 Growth rate (per cent)
Northern Region Clients Loans Clients Loans Clients Loans
Central Region
Madhya Pradesh 551235 32631 1005870 59381 82 82
Chhattisgarh 397757 26542 464273 21182 17 -20
Uttar Pradesh 812702 76437 1205005 89014 48 16
Uttaranchal 64291 2974 83093 4780 29 61
SUBTOTAL 1825985 138584 2758241 174357 51 26
western Region
Goa 2200 1595 6986 783 218 -51
Gujarat 111521 12160 246601 21622 121 78
Maharashtra 2208784 57999 3867064 96714 75 67
SUBTOTAL 2322505 71753 4120651 119120 77 66
Southern Region
Puducherry 22517 1553
Andhra Pradesh 4949393 356528 6244648 521071 26 46
Karnataka 3229378 214805 3743190 189769 16 -12
Kerala 310646 14649 280281 15983 -10 9
Tamil Nadu & Puducherry 2370257 119410 4572806 238709 93 100
SUBTOTAL 10859674 705393 14863442 967085 37 37
Grand Total 20026356 1206308 29111540 1764381 45 46
aNNeX 3.3 housing Microfinance—Challenges and Opportunities28
The low income housing shortage is estimated to be over 40 million units, both in rural and urban areas in India. The supply–demand gap in housing for low income households is very large in India. Taking into consideration the customer profile for low income housing, the microfinance industry in India has a major role to play. MFI clients very often divert some or all microenterprise working capital loans for their house repairs or renovation, as housing/shelter is one of their basic needs. Study of Access to Finance in Andhra Pradesh found that households used a significant part of the loans from different sources for home im-provement. Nine per cent of bank loans, 22 per cent of MFI loans, 13 per cent of SHG loans and 14 per cent of loans from friends were used for housing. When significant diversion of funds takes place, the proximate purpose for which the loans were taken would suffer. Hence, the need for examining the client’s housing needs and finding alternative sources for funding the same.
The nature of housing finance is not microfinance in character. The loan sizes are large, given to indi-viduals, having long tenor and against collateral of the house. MFIs in contrast provide loans of one to three year maturity, have resources that might be three years long and charge high rates of interest. Housing loans are patient loans while MFI loans are liquidity smoothening and not suitable for long term asset acquisi-tion. The challenge is to meet the customer’s requirement, though the MFI is unable today to offer housing loan. The MFIs have the clients and the demand readily aggregated with them, solving one set of problems. The supply side issues need a solution for which some models exist. The MFI could take up a distribution model, on the lines of how MFIs distribute insurance products. The other possibility is for MFIs to gener-ate a portfolio of housing loans and sell off the portfolio to the other financial institutions. Already there are experiments in the field where housing finance institutions use MFIs to channel their products. HDFC, HUDCO and NHB have partnered institutions such as Dewan Housing, Gruh Housing, Sewa Bank and others in making available long term funds needed for housing.
50 MICROFINANCE INDIA
But to make MFIs take to housing finance in a more organized manner, capacity building of MFIs should be prioritized. The focus has to shift from group lending methodology prevalent for most microfi-nance loans to individual lending. Further the funding norms should be codified. The differences between funding housing in urban areas and rural areas should be fully understood. Based on the understanding, the loan processes and documentation should be standardized so that MFIs whether on own account or as agent do not face problems in customer acquisition.
Challenges and issues in housing Microfinance
As microfinance expands, MFIs are diversifying their products to reach the unmet demand in low cost housing and also to scale up. The MFIs should also see this as an important agenda to meet the basic needs of their clients to provide safe, secure and affordable housing and also to reward and retain loyal clients. So far a strong housing microfinance product has not entered the market. This could be due to some perceived challenges and issues facing the scaling up of Housing Microfinance.
assumptions on housing loans—need for clarity
• Housingloansareperceived as non-income generating and financial institutions are unwilling to lend for non-productive purposes, especially to the low income clients. The income effect of an improved quality of housing has not been studied adequately. In many tiny enterprises and artisanal households, the house is the headquarters of the enterprise and therefore a business asset. Larger workspace, better lighting and storage under safe conditions resulting from improved living and working space, significantly improve productivity, reduce wastage and have an impact on both cost and revenues. MFIs would do well to study the customer’s livelihood and the income impact of better housing.
• Long term housing loans are less profitable for MFIs. ‘A 5 year loan from a funder/financial institution to an MFI can be lent out only once for a housing loan, when it could be lent or rotated three to four times for a micro-enterprise loan. Will it affect the profitability of a MFI for servicing of housing loans with long tenure? Will long term loans create a liquidity crunch?’ The positive side is that the MFIs will earn revenue on a client acquired for five or more years without any fresh acquisition and documentation costs. If the housing loan is a distributed product for an external principal, the MFI would be leveraging its customer base for earning extra income, as in case of distribution of insurance policies. A mix of long term and short term loans reduces risk and improves stability of the business. Asset and liability repricing risks do not impact the MFI if both books are balanced. The staff needs to work less hard on new loans, but spend time servicing known clients over a long term. There are distinct advantages to having long terms as part of the loan book.
There are other issues that still need to be tackled before housing finance becomes a part of most MFI’s portfolios.
Land issues and collateral
Low income households, particularly in rural areas, seldom have clear, legal land titles, though they often have para-legal rights of some sort, which are not accepted as collateral by the banks/FIs.
MFIs give out housing loans to their clients with or without collateral. Housing microfinance practice shows that the client’s legal land title is retained only as a psychological deterrent.
Subsidies
Government subsidy programmes and institutional grants for housing cloud prospects for microfinance by creating a culture of expectation and of non-repayment amongst the beneficiaries. While it is always benefi-cial to tie-up government housing subsidies to reduce the borrower’s burden, invariably there is a mismatch of the income level of target clients of the MFI and government. While the government subsidy is eligible to people living below poverty line, the MFIs clients eligible for housing are those in a higher income bracket (` 8000 to ` 12000), in their third or fourth cycle of loan recipients.

Microfinance institutions—moderation dictated by market 51
Pricing
Ideally, the cost of funds should be dependent on a market’s unsubsidized interest rate, irrespective of what the MFI is paying for its funds. It may not be possible for MFIs to offer housing microfinance in competi-tion with banks, because of cost of funds and servicing.
Many MFIs prefer to price the housing microfinance product at par with or little lesser than that of micro-enterprise loans. But high interest rates on housing loans make it unaffordable for the customer and, therefore, limit business potential. MFIs, through appropriate sourcing of funds from housing finance com-panies, should seek to deliver loans to customers at affordable rates. If they distribute the loans as agents of others, then they should ensure that their service charges are reasonable.
Housing finance is a specialized form of finance requiring special skills and long term engagement with the customer. MFIs entering this pace should add value to customers by encouraging them to take up group housing, use of alternate building materials for low cost housing, promote environmental sensitivity in the group housing projects and ensure adequate arrangements for sanitation and hygiene as part of the project.
NOTeS 1. Sadhan had undertaken a comprehensive data col-
lection exercise during the year. On account of the addition of more pieces of data and changes in for-mat, the process of cleaning and publishing took more time. Given the time bound nature of SOS, final data published by Sadhan could not be used. The author is grateful to Sadhan for making avail-able some provisional numbers in the third week of August 2010 to make some macro analysis possible. Detailed analysis of institutional performance in this chapter relies heavily on MIX Market data in which 77 MFIs had reported. These accounted for 89.6 per cent each of clients and loans compared with the total clients and loans reported to Sadhan by 261 MFIs.
2. Neither the Sadhan data sets nor MIX data sets in-clude volumes of loans outstanding, but assigned to financing agencies. To that extent the loan outstand-ing data should be taken as less than actual perfor-mance. The implications are on some large MFIs that have an active policy of securitization or assignment of portfolios are that their efficiency ratio will seem worse and their yield would be over stated.
3. Press statement by Mathew Titus, ED, Sadhan, as re-ported in Business Standard, 1 September 2010. The client outreach data in the press release announcing Quick data seems to be understated and might need revision. Only 77 MFIs (in MIX database) had client outreach of 26.1 million. The remaining 180 MFIs that have additionally reported to Sadhan then have then a combined membership of 0.6 million. How-ever, the loans pertaining to these 6 lakh members is of the order of ` 2526 crores giving an average loan balance of ` 42000 which is very high.
4. The references to years 2008, 2009, 2010 indicate the position as on 31 March of the year mentioned in
terms of stock items of data (such as number of cli-ents, loans outstanding, borrowings) and the period from beginning of April of the previous year to end March of the year mentioned in terms of flow items of data (such as income, costs). The financial year in India is from 1 April to 31 March of the following year.
5. ‘What PE/VC investors think?’, Private Equity Pulse on financial Services by Venture Intelligence, March 2010.
6. The 2009 Mix top 100 list is based on data as on March 2009.
7. Sadhan had indicated that 261 MFIs had reported in-formation including more than 110 non-members.
8. For example, SKS Microfinance had debts assigned to the tune of ` 1383 crores, outstanding at the end of March 2010. Had the debts not been assigned the outstanding loan portfolio would have been ` 43.5 billion. On a base of 43.5 billion, the different ratios that are related to loans would be different compared to a base of ` 29.7 billion used.
9. With the growth of the sector, the size-wise classifi-cation will have to undergo a change. The next year’s report will carry more classes based on size and do a more disaggregated analysis.
10. This share of overall market has to be taken with a pinch of salt as the provisional data reported in the press is yet to be unverified. The difference between Mix and Sadhan data in the number of reporting institutions is about 183. The difference in number of clients (ostensibly representing 183 MFIs) is only 0.6 million. But the difference in loan portfolio rep-resenting this 0.6 million clients is ` 25.26 billion, giving an average loan balance of ` 4200 per capita. The client outreach numbers in Sadhan data might undergo a substantial revision when verified data is released.

52 MICROFINANCE INDIA
20. Table reproduced from Access to Finance in Andhra Pradesh, 2010, CMF-IFMR, Chennai.
21. Common Group Test, Group Recognition Test are entry point activities in formation new groups before financing. These are to ensure that group understands the loan procedure, their obligation towards each others liabilities and the need for fi-nancially disciplined behaviour. The exercises also help the MFI staff to test out familiarity of group members with each other and the homogeneity of the group.
22. While findings of this study were shared in the MRAP researchers meet in CMF, Chennai in August 2010, the paper is likely to be published later in the year.
23. The yet unpublished study was by Ms Mani Nandhi of Delhi University. Findings were presented in the CMF - MRAP researchers’ workshop in Chennai.
24. Metro is a bulk dealer in groceries, cosmetics and household goods—essentially a large format hyper-market.
25. Kirana stores are neighbourhood petty shops that sell groceries, and odds and ends.
26. Excerpted from ‘Community Owned Microfinance Institutions—Enabling double bottom line Impact’, Access Development Services and Rabo Bank, Girija Srinivasan and N. Srinivasan.
27. Study by Karuna Krishnaswamy and Alejandro Ponce, co-funded by CGAP.
28. The author acknowledges inputs from Milroy Paul, Habitat for Humanity, India that formed the basis for this note.
11. In Chapter 9, an analysis of trends and yields is car-ried, which shows that a large number of institutions posted higher yields even as their operating costs declined.
12. The data is reproduced from Side by Side Report 2009 (Bharat Microfinance Report—Responsive Growth) of Sadhan.
13. National Rural Employment Guarantee Scheme as-sures 100 days employment rural households and is operational in districts that backward, vulnerable and remote. Such districts are notified by the Gov-ernment of India.
14. The analysis of regional spread of business is based on Provisional data for March 2010 made available by Sadhan.
15. District-wise data provided by Association of Kar-nataka Microfinance Institutions (AKMI) relating to its members business in the State. The data per-tains to 22 members of AKMI and is not covering all MFI operations in the state. But the available data is valid for the analysis in the context of the issue.
16. Please see an abstract of their study findings in An-nex 3.2 at the end of this chapter.
17. Chart derived from basic data given in a quantita-tive analysis of the Karnataka mass defaults by Kar-una Krishnaswamy and Alejandro Ponce.
18. ‘Competition and the role of external agents—The 2009 delinquency crisis in southern Karnataka’, April 2010, EDA Rural Systems for AKMI.
19. Table constructed from basic data in Table 3.2 published in ‘Competition and the role of exter-nal agents—The 2009 delinquency crisis in south-ern Karnataka’, April 2010, EDA Rural Systems for AKMI.

4Chapter
Investment climate—getting better1
As stated in the Chapter 3, microfinance is the sub-sector of choice in the financial sector for investment bankers. The deluge of liquidity with Microfinance Investment Vehicles (MIV) and investment bankers made it easy for Microfinance Institutions (MFIs) in India to access equity. Investments by private equity (PE) investors in India continue to grow ever since Sequoia Capital India invested in SKS. The US$ 32 million investment was soon followed by other PE investors, among them Unitus, Bellwether, Treeline and Developing World Markets. According to the Venture Intelligence,2 cash-for-equity investments in India-based companies by PE/venture capital (VC) firms accounted for 40 per cent of all PE deals in the past 18 months. There were 11 PE deals worth US$ 178 million during the calendar year 2009, compared to three deals worth US$ 52 million in 2008, according to Venture Intelligence.
Sequoia Capital India was the first traditional VC firm to invest in the space with US$ 11.5 million in-vestment in Hyderabad based SKS Microfinance in 2007. US based Sandstone Capital became the larg-est VC investor in an MFI by leading a US$ 75 mil-lion round in SKS Microfinance in November 2008. However, for most small MFIs, equity from external investors was a distant dream until recently. All the new PE deals in Indian MFIs were predominantly for the top tier MFIs. The deals were large but very few. However, the situation has been changing. In the year 2009–10, there were 29 equity deals worth US$ 213 million. Thirteen MFIs outside the top 10 list got equity support, while eight MFIs in the top 10 list got more equity investments. In the first quar-ter of 2011, six deals worth more than US$ 66 mil-lion were concluded in which four smaller MFIs re-ceived equity apart from two large MFIs (Table 4.1). Investors are thus willing to take equity positions in start-up MFIs, for the capital appreciation potential
Table 4.1 Equity deals in Indian MFIs
Financial year Amount US$ (million) No. of deals
2007–08 52 3
2008–09 178 11
2009–10 209 29
2011–Q1 66 6
they offer. The International Finance Corporation (IFC), the investment arm of the World Bank, has invested US$ 300000 in Utkarsh Micro Finance Private Limited, a microfinance start-up providing loans in Northern India.
The number of equity investment deals in Indian MFIs has been increasing over the last three years. There was a significant increase in the number of investments made in the financial year 2009–10. Though increase in the amount invested was only 18 per cent, the increase in the number of deals done was 163 per cent, reflecting better access to equity for more MFIs and smaller average investments.
ThE INvESTorS
With active investment interest in the Indian market, different types of investors have entered the space. The early interest in MFI equity came from inves-tors abroad. Several foreign investment firms oper-ate in India and more new ones are in the process of entry. Domestic investors have also made equity investments, often accompanying the international investors. Domestic equity did not get invested in MFIs on account of a weak venture capital culture and the unfamiliarity with the sector. The entry of foreign capital in the sector has raised awareness of domestic investors to the opportunities in microfi-nance. From the global funders, there was a steady

54 MICROFINANCE INDIA
The initial investors in the sector were microfi-nance focused funds that entered a riskier market and prepared the field for broader entry of others. With the maturing of the market, more mainstream investors have gained entry. This year saw more investments from mainstream investors than MFI focused funds. IFC, with investments of more than US$ 57 million, led the pack of mainstream inves-tors (Table 4.3). Mainstream investors had a share of 72.8 per cent of equity invested during the year. The coming to maturity of Indian microfinance sector is apparent from the equity investments from main-stream players that lead the others by a ratio of 3:1.
The equity market will continue to be active. With the Capital to Risk (weighted) Assets Ratio (CRAR) increasing to 15 per cent of risk weighted assets, and the growth in gross assets of the MFIs, more equity will be needed. Lok Capital had esti-mated that there would be ‘an annual equity need of approximately $ 200 million for the top ten MFIs’ until fiscal year 2013.’3 The loan portfolio growth shown by the sector had been ` 57 billion and ` 66 billion in years 2009 and 2010, respectively. If fu-ture loan portfolio growth is around ̀ 70 billion per annum, incremental equity of ` 10 billion might be
flow of funds though the investment cycles turned a little longer due to credit crisis. The IFC committed ` 350 million in Rajasthan-based NBFC, AU Finan-ciers Pvt. Ltd. Entering India for the first time, In-cofin, a Belgium based microfinance company, has recently picked up a 34 per cent stake (` 80 million) in Asomi Finance Private Ltd. Other institutions like Bellwether, Microvest, Temasek, ACCION gate-way, Tree Line Fund (Singapore) and Blue Orchard (Switzerland) also invested in various MFIs for the year ending 2010 (Table 4.2). The number of inter-national players is growing in the sector. Domestic interest intensified with the entry of new investors such as Bajaj Allianz Life Insurance and Catamaran Venture Fund.
Table 4.2 Listing of investors based on domicile
National investors International investors
Lok Capital International Finance Corp (IFC)
Aavishkaar Goodwell Sequoia Capital
India Microfinance Development Co
Incofin
Bajaj Allianz Life Insurance Microvest Capital Funds
SIDBI Temasek Holdings
Catamaran Venture Fund Blue Orchard Private Equity
Bellwether MF Fund P. Ltd ACCION Gateway Funds
Dia Vikas Capital MicroVentures SpA
SVB India Capital DWM Investment Ltd., NMI Frontier Fund, Tree Line Asia Master Fund
Matrix Partners Unitus Equity Fund, Elevar Equity Advisors, Microvest, CLSA Capital, Triodos Bank
Table 4.3 Equity deals in 2009–10 by class of investors
Mainstream investors Microfinance investors
Name Amount US$ Name Amount US$
Temasek 50000000 Dia Vikas 3150000
Blue Orchard 10334849 Bellwether 479581
Sequoia 9400000 Microvest Capital 4500000
Treeline Asia 10000000 Accion Gateway 500000
Individuals 319006 Microventures Spa 34649
Catamaran Venture 6099783 DWM Investment 20845986
IFC 57800000 Unitus Equity 4250000
Aavishkaar Goodwell 930521 Incofin 1804522
Bajaj Allianz 10000000 Lok Capital 1500000
India Microfin Dev Co 10000000
SIDBI 10727311
Total 154884159 57792049
Share 72.8 per cent 28.2 per cent
Press note 2 of DIPP
FDI in the Non-Banking Financial Company (NBFC) sector is put on automatic route subject to compliance with guidelines of the Reserve Bank of India (RBI). Minimum Capitalization Norms for fund based NBFCs states that:
• ForFDIupto51percent:US$0.5millionisto be brought upfront
• ForFDI above 51per cent andup to 75percent: US$ 5 million is to be brought upfront
• ForFDIabove75percentandupto100percent: US$ 50 million out of which US$ 7.5 mil-lion is to be brought upfront and the balance in 24 months
Some MFIs, especially the start-ups, do not comply with the Press Note 2 computation of investment limits and, hence, the NBFC norms of RBI. RBI had last year written to DIPP point-ing out that under the revised Press Note norms, seven domestic banks would cease to be counted as Indian-owned banks. Some MFIs are awaiting the verdict of DIPP in this regard. If DIPP up-holds Press Note 2, domestic equity investors will be much in demand as they will be instrumental in facilitating infusion of large sums of foreign in-vestments by putting in a small domestic portion.
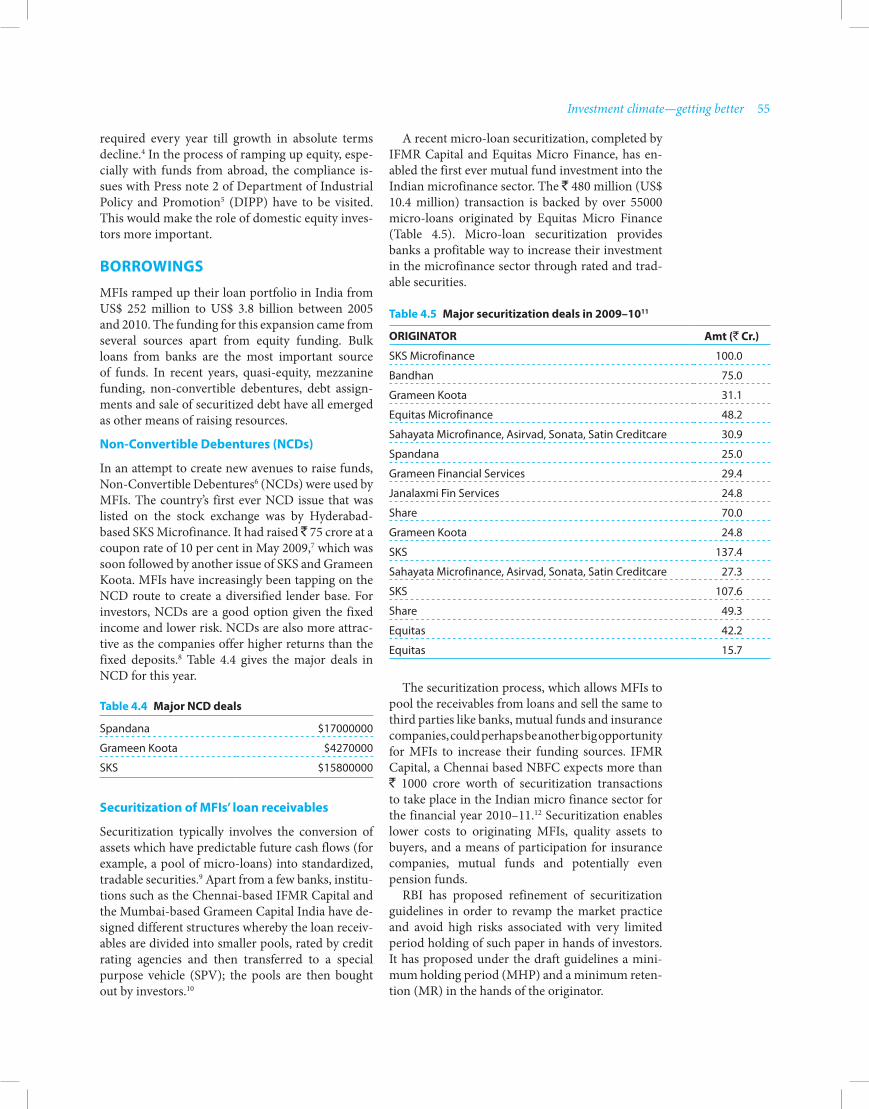
Investment climate—getting better 55
A recent micro-loan securitization, completed by IFMR Capital and Equitas Micro Finance, has en-abled the first ever mutual fund investment into the Indian microfinance sector. The ` 480 million (US$ 10.4 million) transaction is backed by over 55000 micro-loans originated by Equitas Micro Finance (Table 4.5). Micro-loan securitization provides banks a profitable way to increase their investment in the microfinance sector through rated and trad-able securities.
required every year till growth in absolute terms decline.4 In the process of ramping up equity, espe-cially with funds from abroad, the compliance is-sues with Press note 2 of Department of Industrial Policy and Promotion5 (DIPP) have to be visited. This would make the role of domestic equity inves-tors more important.
BorrowINgS
MFIs ramped up their loan portfolio in India from US$ 252 million to US$ 3.8 billion between 2005 and 2010. The funding for this expansion came from several sources apart from equity funding. Bulk loans from banks are the most important source of funds. In recent years, quasi-equity, mezzanine funding, non-convertible debentures, debt assign-ments and sale of securitized debt have all emerged as other means of raising resources.
Non-Convertible Debentures (NCDs)
In an attempt to create new avenues to raise funds, Non-Convertible Debentures6 (NCDs) were used by MFIs. The country’s first ever NCD issue that was listed on the stock exchange was by Hyderabad-based SKS Microfinance. It had raised ̀ 75 crore at a coupon rate of 10 per cent in May 2009,7 which was soon followed by another issue of SKS and Grameen Koota. MFIs have increasingly been tapping on the NCD route to create a diversified lender base. For investors, NCDs are a good option given the fixed income and lower risk. NCDs are also more attrac-tive as the companies offer higher returns than the fixed deposits.8 Table 4.4 gives the major deals in NCD for this year.
Table 4.4 Major NCD deals
Spandana $17000000
Grameen Koota $4270000
SKS $15800000
Table 4.5 Major securitization deals in 2009–1011
orIgINATor Amt (` Cr.)
SKS Microfinance 100.0
Bandhan 75.0
Grameen Koota 31.1
Equitas Microfinance 48.2
Sahayata Microfinance, Asirvad, Sonata, Satin Creditcare 30.9
Spandana 25.0
Grameen Financial Services 29.4
Janalaxmi Fin Services 24.8
Share 70.0
Grameen Koota 24.8
SKS 137.4
Sahayata Microfinance, Asirvad, Sonata, Satin Creditcare 27.3
SKS 107.6
Share 49.3
Equitas 42.2
Equitas 15.7
Securitization of MFIs’ loan receivables
Securitization typically involves the conversion of assets which have predictable future cash flows (for example, a pool of micro-loans) into standardized, tradable securities.9 Apart from a few banks, institu-tions such as the Chennai-based IFMR Capital and the Mumbai-based Grameen Capital India have de-signed different structures whereby the loan receiv-ables are divided into smaller pools, rated by credit rating agencies and then transferred to a special purpose vehicle (SPV); the pools are then bought out by investors.10
The securitization process, which allows MFIs to pool the receivables from loans and sell the same to third parties like banks, mutual funds and insurance companies, could perhaps be another big opportunity for MFIs to increase their funding sources. IFMR Capital, a Chennai based NBFC expects more than ` 1000 crore worth of securitization transactions to take place in the Indian micro finance sector for the financial year 2010–11.12 Securitization enables lower costs to originating MFIs, quality assets to buyers, and a means of participation for insurance companies, mutual funds and potentially even pension funds.
RBI has proposed refinement of securitization guidelines in order to revamp the market practice and avoid high risks associated with very limited period holding of such paper in hands of investors. It has proposed under the draft guidelines a mini-mum holding period (MHP) and a minimum reten-tion (MR) in the hands of the originator.
56 MICROFINANCE INDIA
MFIs in comparison to private sector banks’ expo-sure of ` 4133 crore. Foreign banks had outstanding loans of ` 1994 crore and FWWB had increased its exposure from ` 295 crore last year to ` 360 crore. SIDBI almost doubled its exposure to ` 3808 crores during the year. At this level SIDBI had a share of more than 25 per cent of the market.
Regional Rural Banks (RRBs) had minimal expo-sures amounting to ` 52 crores, mainly to smaller MFIs in their respective areas of operation. The vol-ume of loans outstanding in the books of the banks formed 82 per cent of loans outstanding in the books of MFIs. While banks have increased bulk loans to MFIs and also took up securitized and assigned debts, they limited their dealings to larger MFIs and select medium MFIs. The small and tiny MFIs found it very difficult to raise bank loans. In state after state, small and medium MFIs complained that banks have turned insensitive to their needs. Some MFIs had to scale down their lending programmes and reduce their clients because of the sheer un-availability of financing. Others had to reduce the per head loans in a bid to provide some satisfaction to every customer in the hope that adequate bank loans might come through. While the problem for some of the smaller MFIs was resolved with the ad-vent of the month of March,15 for others there was no hope. MFIs were asked to generate a portfolio of ` 2 crore before approaching some banks for a loan. MFIs in trust, society and cooperative forms were asked to transform into a company. There were also cases where credit rating was required for loans as little as ` 2.5 million. Personal guarantees of the board, promoters and collateral were demanded by some banks. Ishat Hussain16 observes
Promoters of Micro Finance Organizations regis-tered under society/trust & section 25 of company Act are basically social entrepreneurs. They have neither own equity nor they profit from micro fi-nance operations. Banks treat MFOs on par with profit oriented MFIs and apply the same debt-equity ratios. Guarantees and collateral security from pro-moters are asked for. Banks ignore the social equity, long time presence in development sector and vol-untary service mandate of such MFOs. Social equity must be considered and weighed in to relax debt to equity ratio. MFO’s Promoters personal and col-lateral guarantee should not be stipulated. Banks should provide loans to non-profit MFOs out of DRI17 scheme at low rates of interest.
The rating agencies, by and large, were not com-fortable with other forms than companies in micro-finance. The rating was a notch less than companies
The MHP requirement is that a loan will not be sold unless it is held with the originator for nine months, and for the loans having an original term of more than 24 months, it will be 12 months. The MR requirement is that the originator will continue to hold a first loss piece, that is, the subordinated portion of the portfolio, with a minimum risk of 5 per cent in case of loans of up to 24 months’ matu-rity, and 10 per cent in case of loans with above 24 months’ maturity.
In contrast to the present guidelines, the pro-posed guidelines apply the same rules to both secu-ritizations and direct assignments. The implications for the proposed guidelines are that MFIs (with a typical loan maturity of 12 months and actual loan maturity of less than 10 months, because of pre-payments) will not be able to securitize their loans. Assignments similarly will not be possible. Even evergreened loans through top-up cannot be securi-tized as the date of origination will be the new date of the top-up. With equity based leverage options being limited on account of CRAR norms and the bank’s own risk exposure to individual MFIs, the alternative source for raising resources not only from banks, but also from other sources, is virtually bound to close. But the concerns of the regulator have to be seen from the light of sub-prime prob-lems where originators and investors tended to hold assets for very short periods and tried to shift risk elsewhere.
Sucharita Mukherjee13 suggeted that the mini-mum holding period (MHP) for one year microfi-nance loans with periodic weekly instalments (since a majority of microfinance loans are 50 weeks in maturity with weekly repayments) could be speci-fied as the period pertaining to:
(a) repayment of nine instalments or (b) repayment of 20 per cent of the principal
amount of the loan, whichever is larger.
The minimum holding period will then be linked to the tenor, as well as the frequency of repayments of the underlying micro-loans in the same way that the Guidelines make a distinction between bullet re-payment loans and amortizing loans.
Loans from banks
Bank loans to MFIs did not exhibit any overt signs of increased risk perceptions towards the microfi-nance sector. The total loans extended to MFIs and outstanding at the end of March 2010 is estimated at ` 15085 crore.14 Public sector banks have taken to MFI financing in a big way. Public sector banks (not including SIDBI) had an exposure of ` 4737 crore to
Investment climate—getting better 57
about 0.46 per cent of bank credit. To replace this small proportion of loans with other priority sector loans will not present a challenge to banks. Certain-ly the exposures would be re-rated for risk and the interest would go up as a consequence. The impact of removal of PSL tag would be felt more on costs than on availability.
Banks, on their part, have been under some pres-sure from state governments and Ministry of Fi-nance over lending to MFIs that charge high rate of interest from poor. Some of them are mulling inter-est rate caps on onlending of their funds.
A concern expressed by banks has been the lack of responsiveness from MFIs when requested for information and compliance with loan contract re-quirements. The tendency of MFIs to play one lender against another was also a matter of concern. Most lenders to MFIs have joined to set up an informal forum of lenders. In the initial stage they share in-formation among themselves; they have taken up joint portfolio audits and shared the pooled informa-tion from audit. In the lenders forum, further steps on unifying the minimum disciplines for MFIs and coordinating the lending programmes are underway. The lenders forum could become the basis for a regu-latory organization for its borrowing clients.
ACCESSINg CApITAL MArkETS—wATErShED IN ThE MICroFINANCE SECTor
SKS Micro Finance floated its first public offering of equity and mobilized US$ 358 million. The eventual pricing valued SKS Micro Finance at US$ 1.6 billion. The shares which were over-subscribed 13.7 times (primarily by institutional investment interest) fixed the price per share at ` 985 reflecting a valuation of 98 times the face value of shares. Overall, the valua-tion accorded a book value to market value ratio of six times. The successful float of the IPO bodes well for the rest of the microfinance sector. Microfinance has got the attention of the capital market and there is active investor interest in this new business. Up to half a dozen other MFIs are aspirants to enter the equity market with their own share floats.
However, there were certain issues that need examination. High enterprise valuations could result in fair-weather conditions when too much investible money chases too few available capital stocks. The ability to justify such high valuations through appropriate returns on investment as also capital appreciation is very rare. Given the fact that the customers are politically sensitive as a class and any abnormal profits made at their cost are bound
for other forms of organization. Community owned organizations in particular got a raw deal from the rating agencies. With the availability of World Bank funds, SIDBI should partner with other agencies to set up a funding facility for small and medium MFIs that do not have grand designs of growth. The smaller MFIs were reluctant to invest money in get-ting rated on account of the uncertainty of the out-come and the likelihood of bank loans thereafter. NABARD has extended two schemes for funding the cost of rating for such MFIs with the objective of introducing small MFIs to rating exercises. One scheme caters to needs of MFIs seeking bank loans and routes the grant through the financing banks. The second scheme is for MFIs that seek Equity or bulk loan from NABARD.
I. NABARD Grant Assistance for MFI Ratings
1. The scheme is operational on an ongoing basis.
2. Banks can avail of 100 per cent reimbursement of expenses of rating of MFIs up to ` 3 lakh by way of grant, for the first rating of MFI.
3. MFIs with minimum loan outstanding of ` 50 lakh and maximum loan outstanding of ` 10 crore are eligible for support.
4. Regional Offices of NABARD have been del-egated powers to sanction and release grant assistance under the scheme.
II Rating/Grading support to MFIs seeking Capital Support and/or RFA under MFDEF
from NABARD
1. The scheme is operational on an ongoing basis.
2. 100 per cent reimbursement of ‘professional fee’ of the Credit Rating Agency (CRA) for rating of MFIs only, subject to a ceiling of ` 3 lakh.
3. The MFI that had been provided with Capital/ Equity/RFA by NABARD will be eligible for assistance for the second rating on a 50:50 sharing basis, subject to improvement in per-formance.
One of the threats to bank funding has been re-moval of priority sector lending (PSL) tag attached to loans given to MFIs. If this is removed, some banks might withdraw from MFIs. But others might con-tinue existing exposures and wait and watch. Over-all there would be a reduction in available funds to MFIs immediately after the withdrawal of the Pri-ority sector tag. Banks’ present exposure to MFIs is

58 MICROFINANCE INDIA
earning ratio of around 6. Private sector banks such as HDFC Bank and Kotak Mahindra had exception-al price to earning ratios of 18 and 15, respectively. Strong promoter based corporate houses are able to defend share prices in the markets on account of deep pockets and mechanisms on the ground. But where the holding of the promoter is thin, a turbu-lent market when in a downswing could be unfor-giving. A case in point is the steep fall in the share price of ICICI Bank last year from ` 1000+ to ap-proximately ` 430 within a period of five days, just on the basis of unfounded rumours that they had risk exposure to Lehman Brothers. But the share price is yet to get back to pre-shock levels, and took more than a year to claw back to 90+ per cent of the peak prices. While getting high enterprise valu-ations in the market is a difficult enough task, the responsibility to defend the prices in the market and protect shareholder value is even more onerous. The core competence of MFIs is in financing the vulner-able. How much can they stretch themselves to at-tend to other matters?
to boomerang on the entire sector, it is difficult to envision high returns to capital and high return of capital in the form of appreciation.18 An investment that is priced 98 times the face value in the normal course has to wait 99 years to recover the investment cost even if dividends of 100 per cent are declared each year. In the process, the current opportunity cost of capital invested will never be recovered and postponed indefinitely. With return-on-assets on an average of 4.8 per cent to 6 per cent, it’s difficult to see how capital appreciation beyond the current rates could be achieved. If the return-on-assets does not increase and return on equity hovers around 25 per cent, it is difficult to sustain the listing premium over the long run. With neither the technical factors around business promising an extraordinary spike in income potential nor the market sentiments re-flecting the urge to apply a higher discount ratio in terms of price to earnings, the valuation achieved would be difficult to defend. The banking sector on the whole had an average return-on-assets of 1 per cent. Sound financial institutions enjoy a price to

Investment climate—getting better 59
ANNEX 4.1 Banker’s round table
Twelve private sector and foreign banks engaged in microfinance met in a consultation workshop arranged by CAB, RBI specifically for the purpose of State of the Sector Report 2010. Of the banks that attended, six had a positive outlook for the sector and looked to increase their exposure to MFIs. Three banks wanted to exercise caution and remain on watch as to emerging developments. Three of them clearly felt that the outlook did not look positive and expected that they would reduce their exposure to the sector.
The overall impression on growth rates of the sector was that there is some difficulty in finding newer geographies and newer markets. The growth which has been concentrated around urban, peri-urban and semi-urban areas has more or less reached a saturation point. The number of institutions operating in such locations has also increased and led to intense competition. But there were also views among the bank-ers that in rural areas there is still adequate space but the cost of providing services in the rural areas are bound to be higher. This actually hindered the expansion of microfinance in the hinterland. There were also views that the strident growth over the last three years has caused a fall in portfolio quality. Portfolio at risk (60 days) that was less than 1 per cent last year has been moving up towards 2 per cent to 2.5 per cent. Some other banks expressed concern at the growth in loan volumes fuelled by increasing loan sizes and the practice of providing additional top-up loans within three to four months of the basic loan being given to the borrowers. The consensus was that there is still considerable growth potential in the long term. MFIs were felt to be mindful of the growth potential while expanding their operations in many areas; they are not averse to reducing their exposure and withdrawing from the more difficult locations. Availability of continued funding from banking sector could be the key determinant in the future growth of the industry. Three important aspects of the growth rates were felt to be staffing, systems and demand for credit. The Bankers’ prediction was that the client growth rates might slow down for the top MFIs but volume growth in terms of loans would continue.
A more important concern was that MFIs quite often went outside the boundaries of the religion of microfinance. MFIs need to stick to financial intermediation, especially providing credit to poorer sec-tions of people efficiently at doorsteps. When they try to take up other lines of activities such as education, health, distribution of consumer goods, they cross the boundaries of microfinance which increases the risk exponentially. Further, individual lending is something in which MFIs have no skills and therefore are not good at. Such inherently risky businesses should be avoided. As long as MFIs continue to provide the joint liability group or SHG based loans they would be in a position to continue to thrive. The emerging concern in the sector as seen through the field visits as also from the bankers’ eyes was lack of diversification of products, lack of focus on income generation and livelihood of the poor customers.
The reported proposal to remove microfinance from the priority sector mandate of banks is a particu-larly damaging one, not so much for fund availability but to the image of microfinance sector.
The emergence of ring leaders who act as agents of MFIs has adverse consequences. In a number of locations across several states in the country, more and more centre leaders were becoming the key point around which the groups were getting formed and financed. Originally, the centre leaders were the contact points to facilitate the work of MFIs who could identify the members and help out in verification of cus-tomers’ antecedents and so on. Today, with competition among MFIs having becoming intense, the centre leaders have become power centres. The centre leaders reportedly register members promising them that they would be able to access loans from MFIs. This registration comes at a fee (unauthorized, either known or unknown to the MFIs concerned). Further the continuing engagement with the members over the pe-riod of loan also entails payment of some form of commission to the centre leader. In some cases, the MFIs pay out these fees by collecting it from the members and, in others, the leaders collect the fee themselves without the knowledge of MFIs. Such unauthorized power centres existing outside the MFIs system poses a great risk. The incidence of ghost loans in several centres and the consequent defaults by certain groups in some locations is an indication of the high risks inherent in letting centre leaders become ring leaders. The escalation of debt level in respect of certain borrowers in some locations is attributed directly or indirectly to the mechanism of centre leaders. The sooner MFIs get a fix on this, the better it would be for their ongo-ing business. It does make sense to MFIs to employ a person with local knowledge and familiarity of the

60 MICROFINANCE INDIA
local population as a key person in customer acquisition. In such a case, the MFIs should take the person on its rolls either as an employee or as a contracted entity so that the person is compelled to work within the framework of rules and regulations of the MFIs. Any payments made to the central leaders and any money collected by the central leaders from the customers should be fully documented, accounted for and understood by all parties concerned. Without transparency on the terms of engagement of centre leaders and the money collected by them, it would be difficult for MFIs to operate in a risk free manner in different locations. It does look as if the field staff have found easier ways of achieving their targets and continued monitoring over the clients through the mechanism of centre leaders. In many cases, the field staff seem to have done so without information to the MFIs concerned.
Another area of concern was the quality of information reported by MFIs to their lenders. The verifi-ability of data reported was a major issue for the banks. Some MFIs were reportedly reluctant to provide complete information to any bank. They were also reportedly unwilling to take up audits of a special kind to determine the portfolio quality of their loans. Some of the MFIs provided information that would find acceptance in banks rather than what was available on their books. The loan portfolio audit that has been conducted in a couple of cases did bring out that there were significant problems in the quality of portfolio. In some cases, the customer in whose names the loans were outstanding in the books of MFIs did not exist. In some other cases, repayments received from the customers have not been accounted for. In certain other cases, the transfer of loans had been taking place of which the MFIs apparently were not aware. These in-formation related issues did not come to surface; some banks did suspect that there was active concealment. In certain cases, the MFIs play one funder against the other by stating that a funder with a larger exposure did not want certain pieces of information that the other funders with a smaller exposure desired to have. There were also reported cases where the MFIs chose to pay out the outstanding dues to the financing bank rather than provide the information asked for. These do not reflect good corporate governance and also do not provide confidence as to the quality of information that exists with the MFIs.
The information system in place in several MFIs is also a cause for worry. The MIS is dissociated from the accounting data. Aspects such as number of customers acquired, amount of loan disbursed, amount of loans outstanding, amount of loans that were repaid in each period, the portfolio at risk calculations made are all subject to corrections. As Sadhan19 reported, the difference between un-audited data and audited data subsequently filed by the MFIs reflected a divergence of around 10 per cent. If the accounting data which forms part of the balance sheet, and profit and loss account could register a 10 per cent difference during the audit process, then the un-audited MIS based data could be erroneous to a much larger extent. Only a few MFIs had invested in information systems that capture data from the basic accounting entries by having proper solutions which were based on ERP/CBS platforms. It’s high time that funders and investors demanded a stable and inter-connected accounting-cum-MIS system in order to ensure that decisions are taken on reliable, verifiable information.
On governance, the bankers expressed increasing comfort with development in the sector. More and more MFIs were making the board much more professional with induction of independent directors. Eq-uity investors and large lending banks were also represented in the boards. The audit was being awarded to more reputed and professional firms reflecting an increasing concern within MFIs to improve the quality of audit. The creation of independent audit committees of the board as also other sub-committees to look at different aspects of functioning of MFIs at board level was an increasing source of comfort. The profession-alization of senior management has also been a positive for the sector. The increased transparency level and greater dissemination of information has led to increased confidence in the MFIs. However, there remained a few MFIs where without the promoter neither the board nor the professionals could be functional. Even for providing very small pieces of information, promoter’s concurrence was desired by the senior staff which reflected that the governance was in poor shape and that the institution was being run on individual whims. Such institutions should be influenced to become better governed.
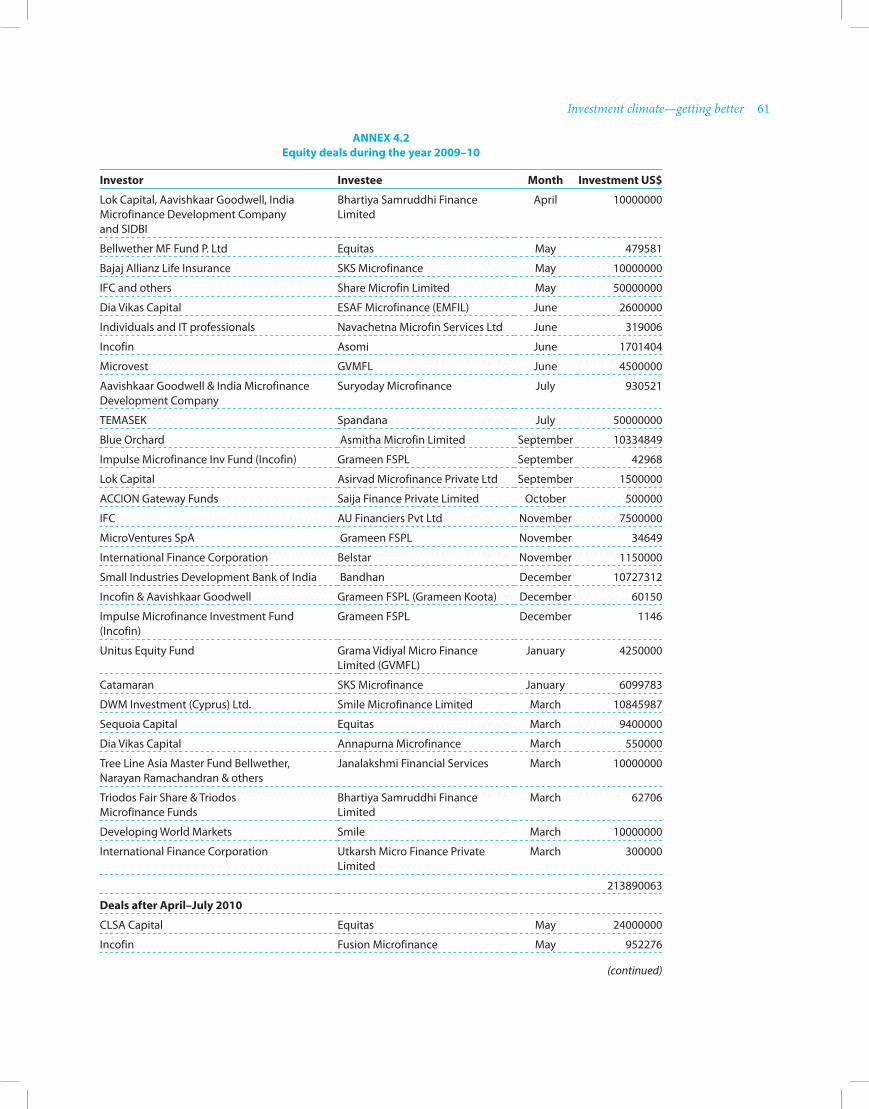
Investment climate—getting better 61
ANNEX 4.2 Equity deals during the year 2009–10
Investor Investee Month Investment US$
Lok Capital, Aavishkaar Goodwell, India Microfinance Development Company and SIDBI
Bhartiya Samruddhi Finance Limited
April
10000000
Bellwether MF Fund P. Ltd Equitas May 479581
Bajaj Allianz Life Insurance SKS Microfinance May 10000000
IFC and others Share Microfin Limited May 50000000
Dia Vikas Capital ESAF Microfinance (EMFIL) June 2600000
Individuals and IT professionals Navachetna Microfin Services Ltd June 319006
Incofin Asomi June 1701404
Microvest GVMFL June 4500000
Aavishkaar Goodwell & India Microfinance Development Company
Suryoday Microfinance July 930521
TEMASEK Spandana July 50000000
Blue Orchard Asmitha Microfin Limited September 10334849
Impulse Microfinance Inv Fund (Incofin) Grameen FSPL September 42968
Lok Capital Asirvad Microfinance Private Ltd September 1500000
ACCION Gateway Funds Saija Finance Private Limited October 500000
IFC AU Financiers Pvt Ltd November 7500000
MicroVentures SpA Grameen FSPL November 34649
International Finance Corporation Belstar November 1150000
Small Industries Development Bank of India Bandhan December 10727312
Incofin & Aavishkaar Goodwell Grameen FSPL (Grameen Koota) December 60150
Impulse Microfinance Investment Fund (Incofin)
Grameen FSPL December 1146
Unitus Equity Fund Grama Vidiyal Micro Finance Limited (GVMFL)
January 4250000
Catamaran SKS Microfinance January 6099783
DWM Investment (Cyprus) Ltd. Smile Microfinance Limited March 10845987
Sequoia Capital Equitas March 9400000
Dia Vikas Capital Annapurna Microfinance March 550000
Tree Line Asia Master Fund Bellwether, Narayan Ramachandran & others
Janalakshmi Financial Services March 10000000
Triodos Fair Share & Triodos Microfinance Funds
Bhartiya Samruddhi Finance Limited
March 62706
Developing World Markets Smile March 10000000
International Finance Corporation Utkarsh Micro Finance Private Limited
March 300000
213890063
Deals after April–July 2010
CLSA Capital Equitas May 24000000
Incofin Fusion Microfinance May 952276
(continued)

62 MICROFINANCE INDIA
NoTES 1. Laxman Timilsina, intern with CMF provided sup-
port through collection of data and helpful working draft for the initial part of this chapter. The author gratefully acknowledges his contributions and the cooperation from CMF in making his services avail-able.
2. A investment advisory firm that catalogues equity investments across the world.
3. Microfinance Industry in India, March 2010, Lok Capital.
4. With the huge unmet demand (for both widening and deepening) for credit from people excluded from financial services, decline in absolute growth in loan portfolio is not likely for many years. Growth rates might abate, but actual volumes will continue to sustain. The only risks are of a crisis or a regula-tory intervention that might cause contraction.
5. A discussion of the issues is available in ‘Possible epicentre of the next big shake-up’, Shadab Rizvi on shadabrizvi.blog.co.in
6. NCDs are a type of debt instrument that is issued for a fixed maturity and which cannot be converted into equity.
7. http://www.microfinancefocus.com/news/2010/ 01/04/fundraising-via-ncd-route-grips-indian- microfinance-sector-2/
8. http://www.microfinancefocus.com/news/2010/ 06/23/ncds-and-securitization-popular-routes-for-debt-funding/
9. More about the process of securitization can be found in http://ifmrtrust.in/capital/images/stories/pdf/IntrotoSecuritisationforMFIs3.pdf
10. http://businesstoday.intoday.in/index.php?issueid=85&id=13925&option=com_content&task=view
11. http://businesstoday.intoday.in/index.php?issueid=85&id=13925&option=com_content&task=view, IFMR Capital deal portal.
12. http://indiamicrofinance.com/ifmr-capital-targets-rs-1000-cr-securitisation-deals-current-financial-year.html
13. Sucharita Mukherjee is the CEO of IFMR Capital, Chennai.
14. Based on provisional data made available by NAB-ARD and further information collected by the au-thor individually from some banks.
15. In the run up to meeting targets in the year end, banks sanction and disburse loans in the month of March. Every year, the March madness plays out.
16. Ishat Hussain, is the CEO of Pahal Institute, MFO in Uttarakhand. The observations were made during the UNSE annual forum meet in Jaipur.
17. The DRI scheme is the Differential Rate of Interest scheme under which banks are to lend 1 per cent of net bank credit to poorest of the poor at a rate of interest of 4 per cent. Banks have not been able to meet this requirement.
18. Either hefty dividends every year or a continuing high price in the bourses, and often a combination of both are necessary to justify the high premium. Even if 100 per cent dividend is paid, a patient share-holder will recover his investment in 99 years, but still be worse off. A trader by contrast will look for a spike in market prices that is above his threshold re-turn, sell off the stock and exit the investment. High valuations make the stocks trade in the bourses with considerable velocity and volatility. The promoter should forever be vigilant.
19. Side by Side Report 2009, Sadhan.
Investor Investee Month Investment US$
NMI Frontier Fund Belstar May 900000
Matrix Partners India, Hivos Triodos and Lok Capital
Bhartiya Samruddhi Finance Limited raises
July 26000000
Elevar Equity Advisors Pvt Ltd and SVB India Capital Partners
Vistaar Livelihood Finance (Vistaar LFI)
May 3277256
Developing World Markets (DWM) Smile May 10924186
Total 66053718
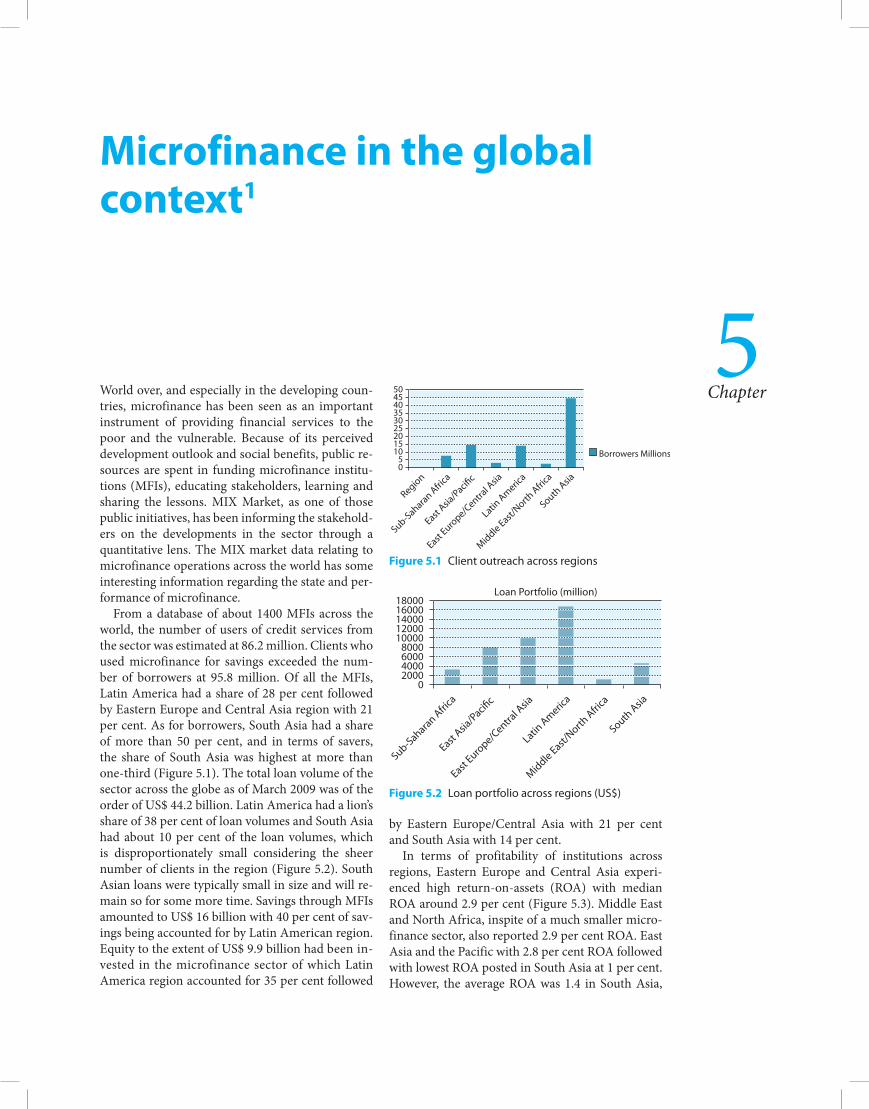
5Chapter
Microfinance in the global context1
World over, and especially in the developing coun-tries, microfinance has been seen as an important instrument of providing financial services to the poor and the vulnerable. Because of its perceived development outlook and social benefits, public re-sources are spent in funding microfinance institu-tions (MFIs), educating stakeholders, learning and sharing the lessons. MIX Market, as one of those public initiatives, has been informing the stakehold-ers on the developments in the sector through a quantitative lens. The MIX market data relating to microfinance operations across the world has some interesting information regarding the state and per-formance of microfinance.
From a database of about 1400 MFIs across the world, the number of users of credit services from the sector was estimated at 86.2 million. Clients who used microfinance for savings exceeded the num-ber of borrowers at 95.8 million. Of all the MFIs, Latin America had a share of 28 per cent followed by Eastern Europe and Central Asia region with 21 per cent. As for borrowers, South Asia had a share of more than 50 per cent, and in terms of savers, the share of South Asia was highest at more than one-third (Figure 5.1). The total loan volume of the sector across the globe as of March 2009 was of the order of US$ 44.2 billion. Latin America had a lion’s share of 38 per cent of loan volumes and South Asia had about 10 per cent of the loan volumes, which is disproportionately small considering the sheer number of clients in the region (Figure 5.2). South Asian loans were typically small in size and will re-main so for some more time. Savings through MFIs amounted to US$ 16 billion with 40 per cent of sav-ings being accounted for by Latin American region. Equity to the extent of US$ 9.9 billion had been in-vested in the microfinance sector of which Latin America region accounted for 35 per cent followed
by Eastern Europe/Central Asia with 21 per cent and South Asia with 14 per cent.
In terms of profitability of institutions across regions, Eastern Europe and Central Asia experi-enced high return-on-assets (ROA) with median ROA around 2.9 per cent (Figure 5.3). Middle East and North Africa, inspite of a much smaller micro-finance sector, also reported 2.9 per cent ROA. East Asia and the Pacific with 2.8 per cent ROA followed with lowest ROA posted in South Asia at 1 per cent. However, the average ROA was 1.4 in South Asia,
50
4045
353025201510
50
Region
Sub-Saharan Africa
East Asia
/Pacific
East Euro
pe/Centra
l Asia
Latin Americ
a
Middle East/North
Africa
South Asia
Borrowers Millions
Figure 5.1 Client outreach across regions
Figure 5.2 Loan portfolio across regions (US$)
1800016000140001200010000
8000600040002000
0
Sub-Saharan Africa
East Asia
/Pacific
East Euro
pe/Centra
l Asia
Latin Americ
a
Middle East/North
Africa
South Asia
Loan Portfolio (million)
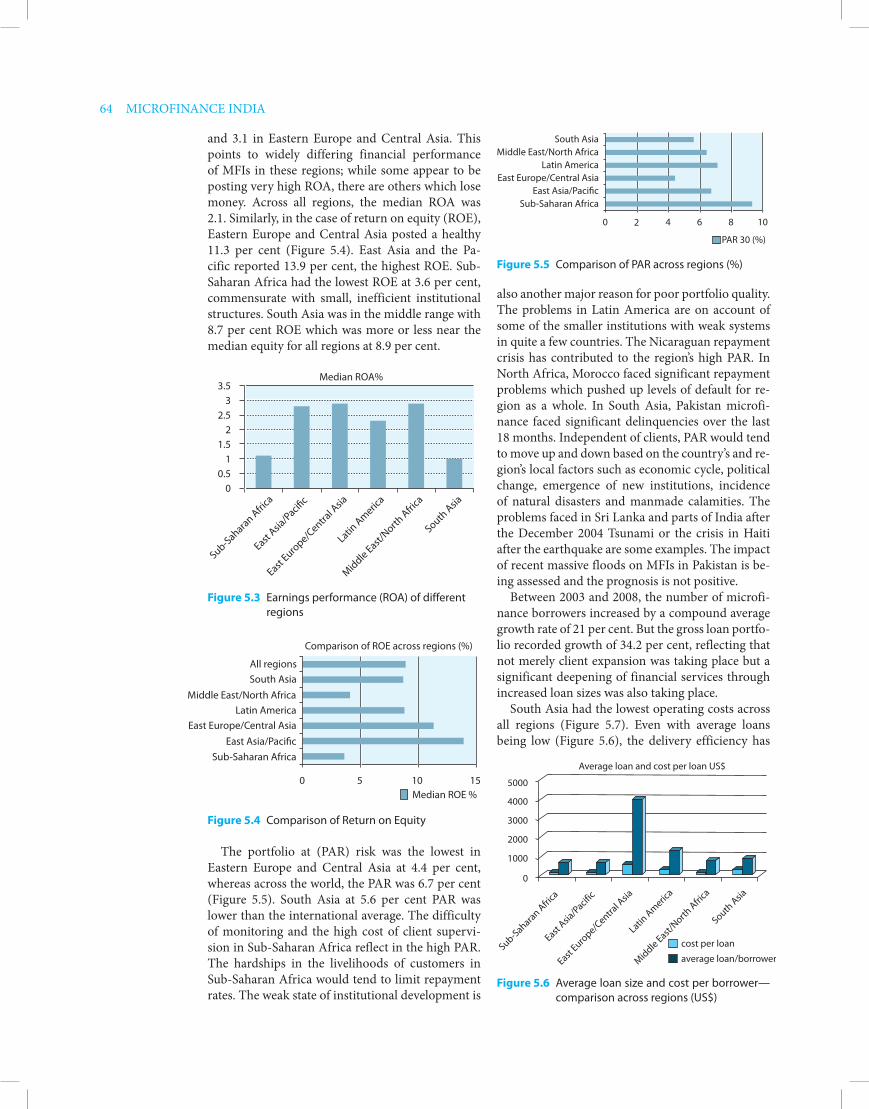
64 MICROFINANCE INDIA
also another major reason for poor portfolio quality. The problems in Latin America are on account of some of the smaller institutions with weak systems in quite a few countries. The Nicaraguan repayment crisis has contributed to the region’s high PAR. In North Africa, Morocco faced significant repayment problems which pushed up levels of default for re-gion as a whole. In South Asia, Pakistan microfi-nance faced significant delinquencies over the last 18 months. Independent of clients, PAR would tend to move up and down based on the country’s and re-gion’s local factors such as economic cycle, political change, emergence of new institutions, incidence of natural disasters and manmade calamities. The problems faced in Sri Lanka and parts of India after the December 2004 Tsunami or the crisis in Haiti after the earthquake are some examples. The impact of recent massive floods on MFIs in Pakistan is be-ing assessed and the prognosis is not positive.
Between 2003 and 2008, the number of microfi-nance borrowers increased by a compound average growth rate of 21 per cent. But the gross loan portfo-lio recorded growth of 34.2 per cent, reflecting that not merely client expansion was taking place but a significant deepening of financial services through increased loan sizes was also taking place.
South Asia had the lowest operating costs across all regions (Figure 5.7). Even with average loans being low (Figure 5.6), the delivery efficiency has
and 3.1 in Eastern Europe and Central Asia. This points to widely differing financial performance of MFIs in these regions; while some appear to be posting very high ROA, there are others which lose money. Across all regions, the median ROA was 2.1. Similarly, in the case of return on equity (ROE), Eastern Europe and Central Asia posted a healthy 11.3 per cent (Figure 5.4). East Asia and the Pa-cific reported 13.9 per cent, the highest ROE. Sub-Saharan Africa had the lowest ROE at 3.6 per cent, commensurate with small, inefficient institutional structures. South Asia was in the middle range with 8.7 per cent ROE which was more or less near the median equity for all regions at 8.9 per cent.
South AsiaMiddle East/North Africa
Latin AmericaEast Europe/Central Asia
East Asia/PacificSub-Saharan Africa
0 4 6 8 10
PAR 30 (%)
2
Sub-Saharan Africa
East Asia
/Pacific
East Euro
pe/Centra
l Asia
Latin Americ
a
Middle East/North
Africa
South Asia
3.53
2.52
1.51
0.50
Median ROA%
Figure 5.3 Earnings performance (ROA) of different regions
All regionsSouth Asia
Middle East/North Africa
East Europe/Central AsiaLatin America
East Asia/PacificSub-Saharan Africa
0 5 10Median ROE %
15
Comparison of ROE across regions (%)
Figure 5.4 Comparison of Return on Equity
Figure 5.5 Comparison of PAR across regions (%)
The portfolio at (PAR) risk was the lowest in Eastern Europe and Central Asia at 4.4 per cent, whereas across the world, the PAR was 6.7 per cent (Figure 5.5). South Asia at 5.6 per cent PAR was lower than the international average. The difficulty of monitoring and the high cost of client supervi-sion in Sub-Saharan Africa reflect in the high PAR. The hardships in the livelihoods of customers in Sub-Saharan Africa would tend to limit repayment rates. The weak state of institutional development is
5000
4000
3000
2000
1000
0
cost per loanSub-Saharan Africa
East Asia
/Pacific
East Euro
pe/Centra
l Asia
Latin Americ
a
Middle East/North
Africa
South Asia
average loan/borrower
Average loan and cost per loan US$
Figure 5.6 Average loan size and cost per borrower—comparison across regions (US$)

Microfinance in the global context 65
in India. The average loan per borrower at US$ 141 in Vietnam and US$ 150 in Ethiopia did not seem to fall in the same category of financial services in countries where the average loan per borrower was more than 10 times higher. Microfinance in China surprisingly was a small sector as cited by the MIX Market data. With active borrowers of only 45000 and loan portfolio of US$ 27.8 million, the sector seems to still be in its infancy.
ensured that MFIs remain profitable in the region. The South Asian countries, barring Nepal, are helped by the high density of population which enables field officers serve a larger number of cus-tomers. The group method of lending further brings down the cost per borrower. In sparsely populated countries, with individual lending models the costs could escalate. The remuneration structures vary across countries and regions. Mexico, for example, has high salaries paid to staff of MFIs, whereas in In-dia costs are much lower. Eastern Europe has a high salary structure compared to Sub-Saharan Africa. Sub-Saharan Africa and Latin America had high op-erating costs for a number of reasons such as sparse population, low case loads per staff, long travel times and associated costs, and low average loans. While Latin American MFIs were able to price their loans to recover costs, in Sub-Saharan Africa, pric-ing flexibility is low, making cost recovery difficult. Employee remuneration in Latin American region is high compared to many other regions. Latin America mostly follows individual lending mod-els which carry high costs. Many Latin American countries were able to charge interest rates that were significantly more than rates charged by banks. For example Mexico, Argentina and Panama charged rates that were 56 per cent to 35 per cent more than the bank interest rates. The ability to price loans in-dicates that competition if any is oligopolistic and does not incentivize cost optimization.
Sub-Saharan Africa
East Asia
/Pacific
East Euro
pe/Centra
l Asia
Latin Americ
a
Middle East/North
Africa
South Asia
50
40
30
20
10
0
Operating costs %
CambodiaBrazil
Bangladesh
Ecuador
Indonesia
Kyrgysta
n
Mexico
Nigeria
Philippines
Bosnia
India
25
20
15
10
5
0
Client Outreach (million)
CambodiaBrazil
Bangladesh
Ecuador
Indonesia
Kyrgysta
n
Mexico
Nigeria
Philippines
Bosnia
India
4000350030002500200015001000
5000
Loan Portfolio 2008 US$ (million)
Figure 5.7 Operating efficiency (OCR%)
Inter-country comparison across the regions re-vealed huge diversity in different markets. The in-equality also makes one question the definition of microfinance in these contexts. For example, the average loan size in Bosnia was US$ 2020, in Kyr-gystan US$ 1590 and in Ecuador US$ 1286. This provides an enormous contrast with average loan per borrower of US$ 92 in Bangladesh and US$ 133
Figure 5.9 Country comparison of loan portfolio
Figure 5.8 Country comparison of client outreach
In some countries, both depositors and borrow-ers used microfinance services quite effectively such as Bangladesh, Brazil, Ethiopia, Mexico and the Philippines. However, there are countries where savers preferred to use other forms and accessed only borrowings from MFIs. Countries where the microfinance sector reported significant amounts of voluntary saving are characterized by a number of banks offering financial services to poor and vul-nerable. There are also countries in which banks were not considered as part of the microfinance sector. The reckoning of banks within microfinance sector made a huge difference in volumes in savings and in operational performance parameters. Where MFIs provide both savings and credit services, the ability to scale up rapidly would be somewhat lim-ited. Where only credit is offered, as in India and Bangladesh, rapid scaling up is feasible. India seems
66 MICROFINANCE INDIA
provided ample market for continued growth. Pe-rennially low op erating costs, which did not move from prior year results, kept Indian MFIs achieving high marks in efficiency, as well. On average, these institutions ranked six percentage points above their peers in this pillar.
Morocco and Bosnia, had occupied many posi-tions in the top 100 list last year, but lost the same on account of repayment problems and modest growth rates.
An important addition to the knowledge base available on banking services for the poor is the am-bitious ‘Access to Finance’ survey carried out across the world by CGAP.4 It pointed out the institutional and other inadequacies in the developing countries that resulted in limited access to services. The sur-vey found that developing countries have one-third the numbers of deposits per person compared to the developed countries. In terms of loans, the develop-ing countries had one-fourth of the loans that were extended in the developed countries. The outreach of the financial institutions was much narrower in developing countries; in terms of the number of branches it was one-third the numbers and, in terms of number of points of sale, it was about one-twelfth per unit of population compared to what was ob-taining in high income countries. Microfinance sector was regulated by the Central Bank directly in 40 per cent of the countries. An interesting point made in the survey related to interest rate disclosure requirements by law. Among the Latin American countries and the high income countries, 91 per cent required that the interest rates be transparently disclosed. The countries across the region with in-terest disclosure requirements were 76 per cent in Europe and Central Asia, 73 per cent in East Asia and the Pacific, 54 per cent in Sub-Saharan Africa and only 50 per cent in South Asia. The customer protection levels in South Asia do not compare well with the rest of the world when seen from the con-text of this requirement.
In a survey of apex institutions in microfinance across the world, a study found that 76 apexes ex-isted in 2007.5 Most of these were located in Latin America and South Asia. But Africa has been set-ting up more apex institutions over the last five years. The average disbursement of 15 large apex institutions was US$ 151 million in 2007. The to-tal disbursement made by apexes in 2007 was of the order of US$ 2.5 billion. In India, the current year’s disbursement to the microfinance sector by the two apex development banks, NABARD and SIDBI was of the order of US$ 1.75 billion.
to have the largest number of borrowers in the mi-crofinance sector followed by Bangladesh. Deepen-ing of microfinance through larger loan sizes and support to enterprise activities are the priorities in South Asia.
The Economist Intelligence Unit2 (EIU) had car-ried out a comparative ranking survey of the 55 microfinance markets across the world. The survey ranked the countries and regions on three aspects: (i) regulatory environment, (ii) investment climate, and (iii) institutional development. Regionally, the survey ranked Latin America at the top followed by South Asia and Sub-Saharan Africa. In terms of regulatory climate, Sub-Saharan Africa was rated to be the highest ranked as it had relevant regulation specific to the sector and created an environment that was enabling for entry of institutions. In terms of investment climate, East Europe/Central Asia was found to be the best. The ease of entry and exit, the regulations relating to investments and options available for dealing with different financial instru-ments in the local markets were all considered to be the most appropriate for investors. On institutional development, South Asia was deemed to occupy the best position. With considerable investments both in technical capacities and in models and processes, the South Asian market was seen to be the most advanced, where most institutional and process in-novations took place. Across countries, the survey found that Peru was best placed in terms of ranking, followed by Bolivia, the Philippines, India and Gha-na. Countries that were placed at the bottom of the table were Venezuela, Jamaica, Trinidad and Toba-go, Vietnam, and Thailand. India’s position near the top is on account of good institution development factors and a reasonable regulatory environment. There is scope for improvement in governance stan-dards, transparency and regulation of microfinance operations.
The MIX top 100 list of MFIs provides a compar-ative assessment of performance of MFIs3 across the world. India had the maximum number of institu-tions in the top 100 list, holding 20 places, followed by Ecuador (9), Egypt (6), the Philippines (6) and Bangladesh (5). The ranking was based on a joint assessment of outreach, efficiency and transparen-cy. Indian MFIs had scored higher than the others on account of continuing high client growth rates and their low cost operations. The MIX report com-menting on the number of Indian MFIs getting top ranked states:
Expanding access outside of the southern states, the hub of Indian microfinance over the last decade, has

Microfinance in the global context 67
growth rates. The low PARs in India are not sustain-able in the long run as had been the case in mature markets. High penetration in select regions within India is a cause for concern in the light of concentra-tion risks. The study concluded that the Indian MFI valuation is driven more by excess capital availability and limited avenues of investment.
CGAP had carried out a study of the crisis in microfinance markets across four countries.9 The study ‘Growth and vulnerability in Micro Finance’ examined the problems in the microfinance sec-tor in Nicaragua, Morocco, Bosnia-Herzegovina and Pakistan. While the crisis was attributed su-perficially to the recession across the globe, the study found that the global recession was merely a contextual factor and was not the real cause. These four countries had a repayment crisis following a period of high growth. The study after examination of relevant factors concluded that in the midst of high growth, MFIs did not attend to fundamentals of risk mitigation and financial discipline. One of the reasons was highly concentrated competition in the microfinance markets which made it pos-sible for multiple borrowing by large populations of clients. The second reason was that the systems and controls of the MFIs were over stretched in the midst of a frenetic pace of growth. The third was the erosion of lending discipline in a very competi-tive market. These three factors eventually led to a breakdown of the repayment culture and resulted in the crisis. The findings are similar to the find-ings in some of the regions and locations in India where microfinance crisis had impacted the MFIs. While the crises in India were small scale and lo-calized, the kind of conditions faced now by the microfinance sector are similar to the conditions explained in the study report relating to these four countries.
A survey of Microfinance Investment Vehicles (MIVs) that channel equity funding across the world into MFIs was carried out by Micro Rate.6 The survey found that funds from Europe and in the USA were available in much larger volumes for MIVs to chan-nel to MFIs. In a world economy recovering from recession, it was interesting to note that investors’ funds are willing to flow to countries such as Peru, India and Uganda into the microfinance sector. The volume of funds mobilized in 2009 by MIVs was of the order of US$ 6 billion which was an increase of 22 per cent over the previous year’s volumes. How-ever, the assets (investments actually made in equi-ties) increased by only 11 per cent. This was a clear indication that the demand for investments was weak compared to supply of investible funds. The mismatch between weak demand and strong supply resulted in liquidity of around US$ 1 billion in the hands of MIVs as at the end of 2009. This surplus liquidity has been chasing the few quality invest-ment opportunities available in the market which explains the kind of subscriptions received by the recent SKS IPO in India.
As for investment destinations through MIVs, Latin America and Caribbean Region accounted for 37 per cent of investments, and Eastern Europe and Central Asia accounted for 35 per cent of invest-ments. South Asia had a small share of 9 per cent. The investible resources at the peak of recession have a tendency to shrink and even withdraw com-pletely. Two development finance institutions have joined hands to set up a microfinance enhancement facility to deal specifically with market volatility in-duced impact on flow of investible funds. A survey carried out by CGAP7 of MIVs found that there has been a slowdown in the market, but still there were few redemptions taking place.
CGAP and JP Morgan had collaborated to carry out a global valuation survey8 of MFIs. The survey found that despite persistent problems over the last two years, the valuation of MFIs continued to rise. The valuations increased over 60 per cent since 2007 to reach a median book value multiple of 2.1. The sec-tor attracted more funds than ever before from pri-vate investors as well as public funders. India seemed to be in an orbit of its own in MFI valuations. Large MFIs in India trade at three times the global median value multiple of 2.1. The research team was not convinced that the high Indian valuations were justi-fied. Current profitability of 14 per cent ROE was not high enough to merit a high equity valuation. While there is growth potential in the Indian market, in-vestors should pay for profitability and not for high
Bosnia-Herzegovina—a case in microfinance10
Bosnia and Herzegovina is a case study in the microfinance sector of how competition and lax risk mitigation can derail a successful sector. The Bosnian microfinance sector was growing at a robust pace and with high profitability. The median ROA for institutions in microfinance sector in Bosnia for the year 2007 was a healthy 5.9 per cent. Average loan sizes were quite high at US$ 2020. The sector had a clientele of 0.44 million with loan volumes of US$ 1 billion in 2008. Bosnia had a specific law governing MFIs

68 MICROFINANCE INDIA
direction seems to be towards establishing more commercial forms that would attract equity from investors. This form has great potential for using mainstream commercial funds for expanding ser-vices to the Base of Pyramid clientele. But, at the same time, these funds have the potential to dis-tort the priorities of MFIs and cause mission drift. The kind of growth ambitions and enterprise valu-ations that are engendered because of entry or the prospect of entry of such investment have already caused considerable damage. Even with the best of regulations in place, some of the more mature mi-crofinance markets are unable to prevent domestic crises. Hence, alliances are being forged to enforce the social and developmental character of microfi-nance. Initiatives such as Social Performance Task Force, the Smart Campaign, the Micro Finance Transparency and the like are to ensure that micro-finance retains the development character and is not hijacked by the prospect of extraordinary prof-its coming through the capital markets. To a large measure, availability of development funding and patient investors would ease the pressure on MFIs. Since the market is large and the demand is unlikely to be fully met in the next 10 years or so, the ur-gency with which market capture is taking place is primarily driven by the need to become the first and the best. If such instincts of growth are fuelled by patient funding that does not exact a premium from the entrepreneurs and promoters, it would be good both for the sector and for the customers. The role that is being played by World Bank, International Finance Corporation (IFC) and some of the bilat-eral agencies is commendable in introducing a mea-sure of long term and short term liquidity in differ-ent countries to cool down the markets and making MFIs to look for alternative funding that does not put a pressure on their existing mission as also busi-ness models. Over the long term, domestic fund-ing must take over financing of the microfinance sector. The experience has been that where sector was dependent predominantly on domestic funds, these countries were insulated from the problems of global recession. Cross-border funding carries risks of two kinds. During recessions, the money seems to flow back from the local economies to the inves-tors’ countries. The second is the problem of cur-rency risk, which is the result of unpredictability in foreign exchange markets. Cambodia11 is a case in point where more than 70 per cent of funding was from external sources. The forex risk of these funds has been passed on to the customers and in case of market volatilities in exchange rates the customers
and it also had a functional credit bureau which included MFIs as its members. However, the rapidly expanding market saw intense competi-tion among MFIs. The consequence of intense competition was that the customer appraisals became weak and inadequate. Credit decisions suffered in quality as the monitoring systems could not stand the strain of incremental clients and volumes. Growth instinct in a competitive market rode over all other considerations of financial prudence and risk management. The median ROA started shrinking. In 2008, it came down to 4.9 per cent and in the following year it came down to (-)3 per cent. The first quarter of 2010 saw that the median ROA declined further to (-)6.4 per cent. There was a dramatic increase in loan loss provision from 2.2 per cent to 9.1 per cent during the year 2007–08. Bosnia had a reasonably efficient operating cost of about 12 per cent. But then this low cost possibly did not make for quality monitoring and oversight of the borrowing members’ accounts. The overall size of the microfinance sector assets shrunk by 10 per cent and the level of equity also declined by 15 per cent (on account of loan write-offs) be-tween 2008 and 2009. That a fast growing micro-finance sector can get undone within a matter of a year is clear from the Bosnian experience. The fundamental problems have more to do with the manner in which the operations were conduct-ed by the institutions than to do with any other external factor. The need for a well-thought out approach towards acquiring customers, quality appraisals, establishing sound parameters for credit decisions and backing up the same with qualitative monitoring systems are brought out by the Bosnian experience. The pace of growth of MFIs should be consistent with their ability to monitor and oversee the expanded number of clients. Unless the monitoring systems, audit and internal control systems can match the pace at which the institutions can grow, it is advis-able that MFIs do not grow at a frenetic pace. The hindsight is that rigorous monitoring sys-tems should possibly be set up before the actual growth initiatives are rolled out.
The world over, equity investors, funders and development institutions alike are concerned about the manner in which microfinance growth is tak-ing place. While the pace and stage of development in different regions and countries vary widely, the
Microfinance in the global context 69
Notes 1. The first part of this section draws from the MIX mar-
ket database. Figures 5.1 to 5.7 have been constructed out of basic data in the MIX market database.
2. ‘Global microscope on the microfinance business environment 2009’, Pilot Study by Economist Intel-ligence Unit.
3. ‘2009 Mix Global 100’, Ranking of Microfinance In-stitutions.
4. ‘Access to Financial Services across the world 2009’, CGAP.
5. ‘Study of Apex Development Banks in Microfinance, 2009’, CGAP website.
6. ‘5th Microfinance Investment Survey’, July 2010, Microrate.
7. ‘MIV Performance and Prospects—2009’, MIV Benchmark Survey, CGAP.
8. ‘Microfinance Global Valuation Survey 2010’, Occa-ssional Paper, CGAP and JP Morgan.
9. ‘Growth and Vulnerabilities in Microfinance’, Feb 2010, Greg Chen, Stephen Rasmussen and Xavier Reille, CGAP.
10. Based on the country brief on MIX Market website. 11. Please refer to the excellent country brief on Cam-
bodia by MIX market on www.themix.org
would suffer heavily. Mechanisms of neutralizing these risks and making the customers free of foreign exchange risk should be built. Institutions like IFC and Asian Development Bank (ADB) have begun providing funds in local currencies in the markets in which they operate which is a highly welcome phenomenon.
India, in the global context is a small market in terms of loan volumes and equity flows. But it is also a rapidly growing market and a favourite destina-tion for equity. The practices and developments in other countries, though in different contexts, hold valuable lessons for India. The potential for cross country learning in the sector is high, both from successes as well as failures elsewhere. At the same time, retooling and reengineering of products and processes to suit domestic environment is an inte-gral part of learning. The emergence of new insti-tutions and mechanisms in diverse aspects of Mi-crofinance such as distributions models, funding instruments, risk mitigation systems, social perfor-mance and transparency offer exciting possibilities for developing markets.

6Chapter
Savings, investments and pension
Microfinance started off as a solution for the gaps in financial services of the poor. However, most parts of commercial microfinance have concentrated on the credit segment of microfinance. The regulatory restrictions on microfinance institutions (MFIs) in most forms has effectively blocked saving services to the poor. Of the permissible forms, community owned member based institutions such as coopera-tives have been able to offer saving services. Some of these institutions have played a significant role in the members’ lives by promoting savings habits and offering financial stability to their lives. However, such stories are few and do not offer a mainstream solution to the problems of inadequacies in saving services.
People still save despite the institutional and regulatory inadequacies. Daryl Collins and others in Portfolios of the Poor1 state that ‘poor households have room in their budget for savings and under-stand the need to save .… poor people have few op-portunities to build up savings in to large sums over the long term.’ The urge to save is natural especially to the women who take a long term view of what is required to protect the families from shocks. While still inadequate, the small savings do provide a risk absorption capacity to the rural and poor households. The forms in which informal savings take place have been numerous. History reveals that some of these experiments carried out by the people are nothing short of being miraculous. The traditional forms in which savings are made are through group mecha-nism such as kuries, chit funds, grain banks and so on. A mechanism of banking physical labour was also common in areas where agriculture required concentrated labour over a short time—during sow-ing and harvesting. Savings among the poor is not a easy habit; it required some external pressure which is the reason for group based processes.
The ‘Access to Finance in Andhra Pradesh’2 survey found that in Andhra Pradesh access to savings services was far better than rest of the country. Seventy-eight per cent of surveyed households had a savings account with a formal institution. Forty-two per cent of savers had accounts with post-offices and 40 per cent with commercial banks. But 79 per cent of savings accounts were used for receiving National Rural Employment Guarantee Scheme (NREGS) payments. The study observed:
The state government has also played a major role in increasing access to formal savings accounts in Andhra Pradesh in recent years. Over the past three years, the state government has made a concerted effort to deliver all wages to participants in NREGA (a national welfare program) through a formal sav-ings account (typically a post office account). While the primary motivation for using formal savings ac-counts to deliver NREGA wages was to reduce cor-ruption, the policy also had a substantial impact on access to savings accounts as many NREGA partici-pants lacked a formal savings account prior to the policy.
Other state governments have also thought of similar arrangements to inculcate savings habits among NREGS wage earners and, at the same time, find a cost-effective and low leakage mechanism of disbursement of wages. Only 14 per cent of the ac-count holders stated that their purpose of opening a savings account was to save money. The study also brought out that the cooperative banks reach out more to the public that too to small and marginal farmers. The public sector banks had targeted land-less labourers for opening their savings accounts. One of the important findings was that those who had no bank account tended to be poorer than those who had access to a bank account.
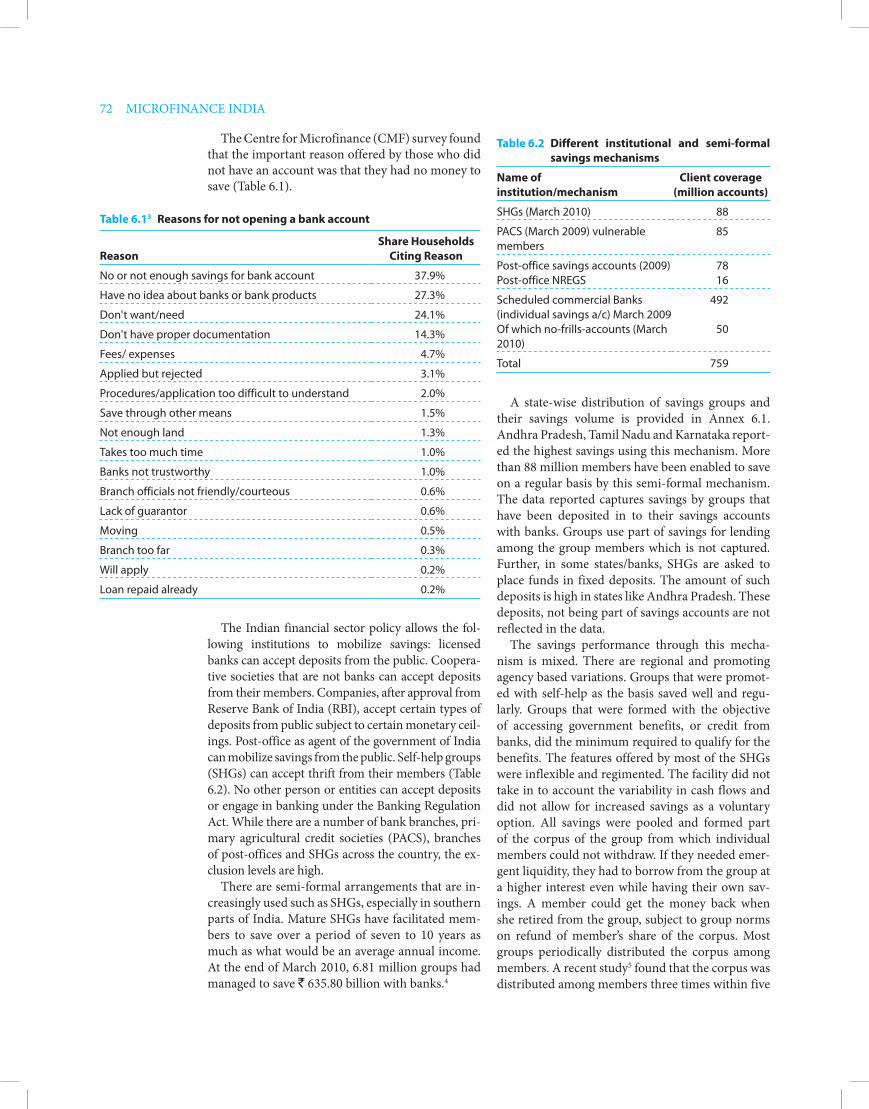
72 MICROFINANCE INDIA
A state-wise distribution of savings groups and their savings volume is provided in Annex 6.1. Andhra Pradesh, Tamil Nadu and Karnataka report-ed the highest savings using this mechanism. More than 88 million members have been enabled to save on a regular basis by this semi-formal mechanism. The data reported captures savings by groups that have been deposited in to their savings accounts with banks. Groups use part of savings for lending among the group members which is not captured. Further, in some states/banks, SHGs are asked to place funds in fixed deposits. The amount of such deposits is high in states like Andhra Pradesh. These deposits, not being part of savings accounts are not reflected in the data.
The savings performance through this mecha-nism is mixed. There are regional and promoting agency based variations. Groups that were promot-ed with self-help as the basis saved well and regu-larly. Groups that were formed with the objective of accessing government benefits, or credit from banks, did the minimum required to qualify for the benefits. The features offered by most of the SHGs were inflexible and regimented. The facility did not take in to account the variability in cash flows and did not allow for increased savings as a voluntary option. All savings were pooled and formed part of the corpus of the group from which individual members could not withdraw. If they needed emer-gent liquidity, they had to borrow from the group at a higher interest even while having their own sav-ings. A member could get the money back when she retired from the group, subject to group norms on refund of member’s share of the corpus. Most groups periodically distributed the corpus among members. A recent study5 found that the corpus was distributed among members three times within five
The Centre for Microfinance (CMF) survey found that the important reason offered by those who did not have an account was that they had no money to save (Table 6.1).
Table 6.13 Reasons for not opening a bank account
Reason
Share Households Citing Reason
No or not enough savings for bank account 37.9%
Have no idea about banks or bank products 27.3%
Don't want/need 24.1%
Don't have proper documentation 14.3%
Fees/ expenses 4.7%
Applied but rejected 3.1%
Procedures/application too difficult to understand 2.0%
Save through other means 1.5%
Not enough land 1.3%
Takes too much time 1.0%
Banks not trustworthy 1.0%
Branch officials not friendly/courteous 0.6%
Lack of guarantor 0.6%
Moving 0.5%
Branch too far 0.3%
Will apply 0.2%
Loan repaid already 0.2%
The Indian financial sector policy allows the fol-lowing institutions to mobilize savings: licensed banks can accept deposits from the public. Coopera-tive societies that are not banks can accept deposits from their members. Companies, after approval from Reserve Bank of India (RBI), accept certain types of deposits from public subject to certain monetary ceil-ings. Post-office as agent of the government of India can mobilize savings from the public. Self-help groups (SHGs) can accept thrift from their members (Table 6.2). No other person or entities can accept deposits or engage in banking under the Banking Regulation Act. While there are a number of bank branches, pri-mary agricultural credit societies (PACS), branches of post-offices and SHGs across the country, the ex-clusion levels are high.
There are semi-formal arrangements that are in-creasingly used such as SHGs, especially in southern parts of India. Mature SHGs have facilitated mem-bers to save over a period of seven to 10 years as much as what would be an average annual income. At the end of March 2010, 6.81 million groups had managed to save ` 635.80 billion with banks.4
Table 6.2 Different institutional and semi-formal savings mechanisms
Name of institution/mechanism
Client coverage (million accounts)
SHGs (March 2010) 88
PACS (March 2009) vulnerable members
85
Post-office savings accounts (2009)Post-office NREGS
78 16
Scheduled commercial Banks (individual savings a/c) March 2009 Of which no-frills-accounts (March 2010)
492
50
Total 759

Savings, investments and pension 73
especially to the financially excluded population. It also recommended that India Post should rethink its present status of an agent of government for mo-bilizing small savings, implying that it should offer financial services on its own account. This might entail setting up of a post bank.
As for deposit protection, the SHG members also do not get any protection for their savings. While a preponderant majority of members have outstand-ing credit balances that exceed their savings bal-ances, some are just savers. The SHGs apart from utilizing the savings for lending to group members also place the surplus with banks. Better account maintenance, periodic audits and issue of passbooks to members that are updated after each meeting are measures that could improve protection levels for SHG savers. In the recent past, MFIs registered as societies have mobilized savings from SHGs. The legitimacy of these mobilization efforts by societies is questionable. However, the small volumes and the small number of clients have been so far ignored by the regulator.
On the formal side, as stated earlier, community owned financial institutions have offered viable op-tions for their customers. A study of different com-munity owned institutions6 last year brought to fore the variety of savings options that such institutions offer suiting the customers. Bagnan Mahila Bikash Cooperative Society, Sewa Bank, Indur MACS, Swayanshree and SIFFS are some of the examples of customer friendly savings institutions. But the inability to scale up and find mainstream funds is compelling many such institutions to change form into Non-banking Financial Company (NBFC) and thereby deny the savings services to the members. As Microsave’s note says,
… it is simply sad (but increasingly common) to see an SHG Federation or Cooperative transform com-pletely into a non deposit-taking NBFC, allowing it only to provide credit services to members. Though perhaps difficult to manage, providing savings can be just as valuable to clients as providing additional credit—and can help securing the quality of the loan portfolio.7
BaNkiNg SySTem aND miCRoSaveRS
The banking system has responded to the call for financial inclusion by prioritizing no-frills-accounts on its books. More than 50 million no-frills-accounts8 have been opened by the banking system in the last five years in order to ensure that the excluded peo-ple have access to financial services especially that
years, which makes the savings very short term and unsuitable for asset building overtime. Failure to maintain records, delayed book maintenance, fail-ure to get audits done, frauds and levies of different types on SHGs are some of the impediments that are to be dealt with to make this mechanism more efficient.
As formal structures, cooperative societies have offered saving services but not with much success in most parts of India. The savings mobilized by PACS across the country was ` 262.45 billion in March 2009. In contrast, SHGs which have history that is just 15 per cent as long as cooperatives have more than double the savings. Kerala, Maharashtra, Gu-jarat and, to a lesser extent, Tamil Nadu and Orissa have seen the emergence of cooperative societies as viable institutions that offer saving services to their members. The ongoing reform of cooperative bank-ing structure is seeking to position PACS as deposit taking institutions from members. The number of members from the vulnerable sections of popula-tion already with PACS is impressive. The need for better savings protection for those who use prima-ry societies should be satisfied. While cooperative bank deposits are protected by the Deposit Insur-ance Corporation (DIC), savings with PACS are not. Some states have schemes for protecting savers such as in Maharashtra and Orissa. National Bank for Agricultural and Rural Development (NABARD) and Deutsche Gesellschaft für Technische Zusam-menarbeit (GTZ) are reportedly formulating a pro-posal for a deposit protection mechanism for those who save with PACS.
Post-offices have been rendering services for many years now. Post-office with its large network of more than 0.15 million outlets has been able to offer an easily accessible voluntary saving service. A large proportion of rural clients prefer the post-office to other entities on account of its easy ap-proachability and nearness to their habitats. They are seen as reliable by the users. With the sovereign imprint on its papers, deposit protection is never an issue with post-office. Post-office’s recent record has been impressive. It has managed to open more than 16 million savings accounts for NREGS wage earn-ers. But the levels of efficiency must improve. While technology investments have taken place in post-office, these are confined to the urban and met-ropolitan areas. The rural post-offices suffer from several infrastructure limitations. A high power committee recently went in to the reform of India Post. The committee, among other things, recom-mended that India Post should deliver lightweight, low cost bank accounts to all Indian citizens and

74 MICROFINANCE INDIA
concluded that targeting of no-frills-accounts needs to be sharper and more towards the poor. BCs and appropriate technology will make no-frills-accounts work better for the customers. Marketing of no-frills-accounts should be based on a clearer expo-sition of limitations of no-frills-accounts so that people with higher expectations do not enrol only to let the account remain inactive later. A summary of MicroSave’s findings is presented in Annex 6.2.
The process by which savings of the poor should be captured is very different from the process ad-opted by the banking system for financial inclusion. After acquisition of the customer, banks should find a way of frequently and periodically approaching the customer to trap the small surpluses that they attain from time to time and bring them into the accounts. Products that are built on the lines of re-curring deposits with instalments on a daily, weekly or a monthly periodicity are more likely to gain ac-ceptance from the customers. Second, goal oriented savings is the norm among the poor households. If banks could provide such goal oriented savings ac-counts, either in terms of an amount or in terms of a fixed period, then the savings accretion in accounts of poor people might gather pace. The branch structure is not suited for such doorstep small ticket banking. The use of BCs must be exploited to its full potential for offering savings services at the door-step for the vulnerable people.
Regulation is not always the impediment for of-fering services, if innovative minds are put to work. Institutions such as Kshetriya Gramin Financial Services (KGFS) in Tamil Nadu have shown that even within the existing regulatory norms it is pos-sible to offer savings services to people. KGFS offers a savings product which mobilizes money from the people and invest them in money market mutual funds which are highly liquid. If people require to withdraw money from their accounts, KGFS re-quests the mutual fund to repay by disposing off units to the extent of the savings withdrawn. This ensures that the money saved by the people is in a regulated form, invested for market returns and is available as and when it is required. This form of savings has captured the imagination of clientele of KGFS. More than 11000 customers (June 2010) had signed up for this savings product within a 14 month period.10 The average savings (termed asset under management as it is a mutual fund product) is about ` 200, average transaction size is about ` 570. 2.75 transactions per year per account have taken place on an average.
Another product which offers savings in the reverse relates to purchase of gold and paying for
of savings. The savings balances in these accounts amounted to ` 53.86 billion. However, the record of performance of no-frills-accounts has been less than adequate. A small proportion of these ac-counts (estimated to be between 10 per cent and 20 per cent)9 have in fact seen transactions. Fewer still have had any significant balance that would be termed as savings. Apart from the ease of open-ing a no-frills-accounts and the initial efforts that a bank puts in either by itself or through its busi-ness correspondents (BCs), there is nothing much to offer to the client. Every subsequent transaction for most clients is expensive as it involves travel to the bank branch and the waiting period which on the top of very small transaction volumes could be burdensome. No-frills-accounts, like all other fi-nancial inclusion efforts, have not been perceived to be commercial propositions and, hence, it is offered as a poor service for poor people. In this form, it is highly unlikely to recover costs for banks and enable provision of a superior service quality.
MicroSave had conducted a multi-location study of no-frills-accounts across banks and BCs. The study
South Indian Federation of Fishermen Societies (SIFFS) Saving Schemes
In 2001, SIFFS started a savings scheme named the ‘Old Age Security Scheme’ (OASS) for its members. This scheme was intended to help the artisanal fishermen to accumulate a lump sum at the time of retirement from fishing. A member can save a minimum of ` 50 or its multiples. The interest will be 0.5 per cent more than commer-cial banks’ rates. Members will have the option to withdraw the savings and interest accrued at the end of every fifth year.
Every month, the village societies’ clerks will collect and remit the savings amount to SIFFS through their federation. While collecting the savings amount from members, the village so-ciety clerk makes an entry in the member’s Pass Book. The year-end accumulated balance of each member is displayed on the notice board.
The scheme has become popular with par-ticipant savers increasing from less than 1000 in 2007 to more than 5000 in 2009. The cumula-tive balance saved stood at ` 11.3 million. SIFFS is now in the planning stage of converting this OASS into a professionally managed pension scheme. Discussions are underway to convert the present scheme to the ‘UTI Retirement Benefit Pension Fund.’

Savings, investments and pension 75
On another extreme, there are reports11 of infor-mal MFIs, in Assam, providing savings services to the public. Surprisingly, the number of such institu-tions is reportedly large and significant savings are mobilized by them without any regulatory oversight. When there is a shortage of regulated institutions to mobilize savings, other organizations find a niche for operations and occupy the space. If the geogra-phies are remote, impeding easy access for the regu-lator, then enforcement of laws that prohibit deposit taking activities becomes difficult. Preventing such informal finance activities when a viable alternative has not been put in place is another aspect of the problem.
the value of gold in instalments over a period of time. Here, the goal of saving by the people is to own gold. The investment in gold is facilitated by making a small down payment of as little as 5 per cent to 10 per cent of value of gold in the beginning and freezing the price of gold as on the date of pur-chase. The remainder of the value of gold is treated as a loan that is repayable over a 12 or 24 month period. Once repayment instalments are met, the gold passes into the ownership of the customer on whose behalf it is held by the MFI. Such goal ori-ented savings product significantly advances the cause of savings and motivates the poor to save. Similar products that suit the requirements of people are rare to find in the mainstream financial sector.
What is the World Gold Council doing in microfinance!
The concept of gold linked microfinance savings scheme was initiated by the World Gold Coun-cil (WGC) in 2008 with the objective of making good quality gold accessible and affordable to the below poverty line (BPL) households.
Currently, WGC is running projects in India in association with select institutions including Eq-uitas and KGFS Ltd. Under these schemes, cus-tomers book gold at the current price and make an initial down payment of 10 per cent to 15 per cent, and pay the balance amount via easy instal-ments, over 12 to 36 months as per their choice. The IFMR-KGFS gold linked microfinance pro-gramme is currently available across 59 branches of the Thanjavur and Thiruvarur districts in the State of Tamil Nadu.
For example, numerous villages in Tamil Nadu and Andhra Pradesh are a testimony to the suc-cess of the microfinance scheme. With seven to eight groups comprising of four to five members each, the weekly collection is handed over to the loan officer from the MFI. The basic objective of each of the women here is to invest in gold via credible suppliers in a stable manner thereby en-suring a secure future.
The scheme enables the customers an oppor-tunity to acquire an asset that is a good hedge against inflation over long periods. This reverse saving product incentivizes the savings instinct with the reward of owning a desirable asset. Cus-tomers in such circumstances do not mind the compulsion and difficulties involved in main-taining the repayment instalments.
Assam—Semi-formal sector going informal12
A survey on informal practices of microfinance was conducted in three districts of lower Assam—Kamrup (rural), Nalbari and Baksha to gather in-formation regarding informal practices that are prevailing in these districts. In these parts of the state, Kabuliwala (1969) was the main source of credit. After 1999, NGO-based and block based SHGs created a change in the scenario.
The most active savings generation and credit providers in these areas are private savings and credit societies. These saving and credit societies are run by local people. These societies perform basic functions of the banks. Most of these soci-eties are informal and do not have a formal reg-istration under any law. Five or six local persons pool their funds and offer credit to the people at an interest rate ranging from 3 per cent to 5 per cent per month. They also collect deposits from members daily or weekly, offering interest of 12 per cent to 24 per cent per annum. However, there are a few societies which are under some NGOs registered as society. These societies func-tion under a name and brand with their logo and offices in different places. They carry the pretence of a formal MFI with their signboards and other paraphernalia. They issue record books of trans-actions similar to pass books to the members. The members can avail loan against their deposit account. Loan admissible against the deposit ac-count is different in different societies ranging from 80 per cent to 100 per cent. Despite being high cost, people avail microfinance from these societies because availability of credit is more important for them as against the cost. There are many informal private societies in these districts capturing savings and providing micro-credit.

76 MICROFINANCE INDIA
More than savings, the poor households look to investing any surpluses that they have as a risk mitigation arrangement. Investment in suitable as-sets could gain in value over time and thus become the base for building a better livelihood and also the means of absorbing any external shocks that might arise. Another study carried out over time in Tamil Nadu by a group of researchers14 has shown that gold has been the most preferred form of asset in which poor households invest. Four hundred households that were members of SHGs had been surveyed from 2004 to 2009 in three phases. The monitory value of investments in gold in 2004 was of order of 51 per cent of total assets of these households. In 2006, this went up to 56 per cent and in 2009 it reached 70 per cent. The price of gold had increased by 2.8 times during the period 2004 to 2009, thus building up the value of asset significantly compared to any other form of investment. The stated preference for gold (which is considered an idle asset) has borne out rich dividends for the poor people. Such intui-tive investments of the vulnerable households need to be supported proactively by financial institutions. As explained earlier, the reverse savings products which make investments in gold possible by provid-ing a loan on the initial purchase price of gold would be very suitable to ensure that people able to save in a desirable form where, apart from savings, they are able to actually invest. The same study also brought out that investment in livestock was the next best choice made by these households. Livestock had the potential to provide current income whether they are dairy animals or goats. However, the skills re-quired to maintain these animals as also market for the produce were not commonplace. This resulted in erosion of assets in certain cases and a draw down on the overall asset base of the families.
Converting savings into investments, especially in livelihood assets, needs to be done with a lot of care. Institutions which position themselves as livelihood support providers need to carefully look at the skill sets available as also the local market conditions that would eventually determine the success of livelihood. In fact, discouraging people from making certain types of investments in preference to other types might be a valid service that financial counsellors could render. Where NGOs and MFIs take up the job of advising people on prudent financial behaviour, this could be one of the critical elements therein.
Financial savings are suitable in economies that have stable conditions. When inflation rates creep up, savings in financial assets end up as a tax on the poor. There have been countries with hyper inflation
On the part of the other MFIs that offer credit only services and also insurance services of a kind, there is no urge to promote savings. Offering sav-ings entails higher cost and also training of staff on skills, which are very different from that of lending and recovery. The MFIs would rather not be hassled with additional responsibilities arising from mobili-zation of voluntary savings and, hence, there has not been active interest on their part to strengthen the financial stability of their customers through sav-ings services. But a large number of MFIs require the borrowers to compulsorily save a part of the loan as a security for the loan. This ranges from 5 per cent to 20 per cent with the typical security de-posits being 10 per cent of value of loan. However, this does not really provide the value of a savings arrangement to the borrower, as this is not liquid, or convenient or withdrawable at will.
There have been a few studies that have gone into the behaviour of specific classes of people or vulner-able households in general as to their savings behav-iour. A study13 of rickshaw pullers in Delhi carried out by Mani Nandi brought out that 94 per cent of rickshaw pullers save regularly. Forty-six per cent of them in fact save some money daily. The manner of storing the savings was highly informal. Fifty-five per cent of them kept the savings with themselves. The means adopted included burying of the cash in secret locations which were shifted from time to time. Thir-ty per cent of the savings were kept on deposit with shopkeepers and friends. Just 1.7 per cent of rick-shaw pullers had made deposits in a bank account. One hundred and fifty-seven rickshaw pullers were polled, which brought out that they had saved alto-gether more than ̀ 4 lakh. The story of rickshaw pull-ers saving money through whatever possible means brings out the glaring deficiencies in the present in-stitutional arrangements for enabling people to save.
The ease of access could matter critically for people availing services is a point that was clearly brought out in the CMF study referred to earlier. Of people who did not have a bank account 36 per cent had at least one cellular phone in the house-hold. This shows that the households really do not eschew external linkages. They had opted for a cel-lular phone which actually is an item of cost as the call charges would have to be incurred from time to time. But the ease of availability and ease of entry into the services offered by the telecom provider has made the difference. The point to note is that the financial institutions must offer their products and services in a manner that could be easily availed by the vulnerable households.
Savings, investments and pension 77
The micropension scheme offered by UTI AMC is unable to cover costs because of low enrolments, low contributions and high costs. A study15 carried over 700 clients of an MFI brought out that 87 per cent were willing and keen to join a pension scheme. The preferred pension per month that they wanted to receive was ` 270. They were willing to pay either monthly or weekly premiums towards the pension contributions. Sixty-three per cent were willing to pay a premium of ` 100 and 70 per cent were prepared to pay a weekly premium of ` 20. As for the duration of contribution, 64 per cent wanted to contribute for five years and 30 persons were willing to contribute for 10 years. Seventy-three per cent surprisingly did not want regular pension payments, but a lump sum payment.
India Invest Micro Pension Services (IIMPS) has been spearheading a campaign for improving pension literacy and enrolling more people to sub-scribe to pension schemes. They work with NGOs, MFIs and governments who have large clientele and are able to provide outreach at low costs. Pres-ently, IIPS is partnering Nyaya Bhoomi for covering 85000 rickshaw workers in Delhi, Basix for covering 700000 working poor in 15 states and Sewa Bank to cover its members.
Sheperd India and Dhan Foundation are also implementing pension solutions for their custom-ers. The large footprint pension schemes are UTI Micropension scheme with over 1.25 lakh subscrib-ers, promoted through BASIX, SHGs and other community based groups, and SERP-LIC partnered micro-pension scheme in which over 3.7 lakh wom-en members of SHGs had subscribed as of April 2010.
The Pension Fund Regulatory and Development Authority (PFRDA) had introduced a New Pension Scheme Lite (NPS Lite) for poor and vulnerable sec-tions of people. The NPS Lite is a low cost scheme that will carry negligible administrative and trans-action overheads. The key features of the scheme are that (i) there are no minimum contributions fixed, (ii) the account can be operated from anywhere, and (iii) account opening is through aggregators who could be MFIs and NGOs.
The aggregators should be registered entities un-der any law, have ` 10 million net worth, ability to handle large databases, have cash management and transfer capabilities and be able to provide a security deposit. For enrolling customers, aggregators must carry out know-your-customer (KYC) as per norms applicable in case of bank accounts. Remuneration would be at the rate of ` 50 per account enrolled.
where the value of savings would have been very little over time. The cases of Zimbabwe and Mexico where inflation reached very high levels show that in such situations, the poor would have been better off to borrow and invest in assets. Financial institutions have a responsibility to advise poor households on the form of savings that would suit them best given the market conditions.
PeNSioNS
Pension investments in India are rather thin even among the affluent. Apart from compulsory pen-sion schemes of employers, few voluntary pension schemes have popular support. Among the micro-finance clients, the need for pensions is clearly felt and expressed. Most realize that they do not have a retirement date as they have nothing to live on despite age making them infirm. Estimates show that only between 11 per cent to 13 per cent of the Indian workforce will retire with old age benefits. Primary data from the Invest India Incomes and Sav-ings Survey 2007 (IISS07) suggests that a significant proportion (25.8 million) of these working poor are interested in saving for their old age and can af-ford an average annual retirement saving of ` 2300. However, without access to customized retirement savings products that deliver high real returns at low transaction costs, most of these working poor will fall below the poverty line in their old age.
The National Old Age Pension Scheme (NOAPS) is a non-contributory scheme. The eligible pension-ers under the scheme will be means-tested poor, who will receive a meagre ` 200 per month as pen-sion. The scheme has very low coverage compared with the need. For all others planning and investing for pension is a dire necessity.
There have been private initiatives in offering pension products. One set of products are offered by insurance companies who collect the premiums, invest the same and pay out pension once the vest-ing age is reached. They usually provide insurance cover for life of the subscriber. The products offered by the insurance companies do not normally suit the poor and vulnerable. Another type is that offered by the Asset Management Companies (AMCs) who collect the periodic payments from the customer and invest the same with a long term growth objec-tive. At vesting age, options are available to draw the money and place it with an annuity provider. For the microfinance sector, Unit Trust of India Asset Management Company has a pension fund offering for over three years now.

78 MICROFINANCE INDIA
The search for regulated mechanisms and institu-tions is on account of depositor protection, espe-cially the vulnerable savers. Innovations can pro-vide answers if technology and communications are used (as in the case of KGFS). The major issue in savings is not the ability to save, but availability of suitable products and collection mechanisms. It is time for donning thinking hats and heading to the drawing board.
The scheme has been recently introduced and hence no progress has been reported. For the scheme to succeed, concerted marketing is necessary. The aggregator remuneration should be reviewed; as it is not attractive enough presently, the aggregator would ignore the product and might not market the same. The low costs and professional financial man-agement expertise for managing corpus investments must facilitate client acquisition.
In savings, unlike in the case of loans, the addi-tional issue of safety of savings has to be addressed.
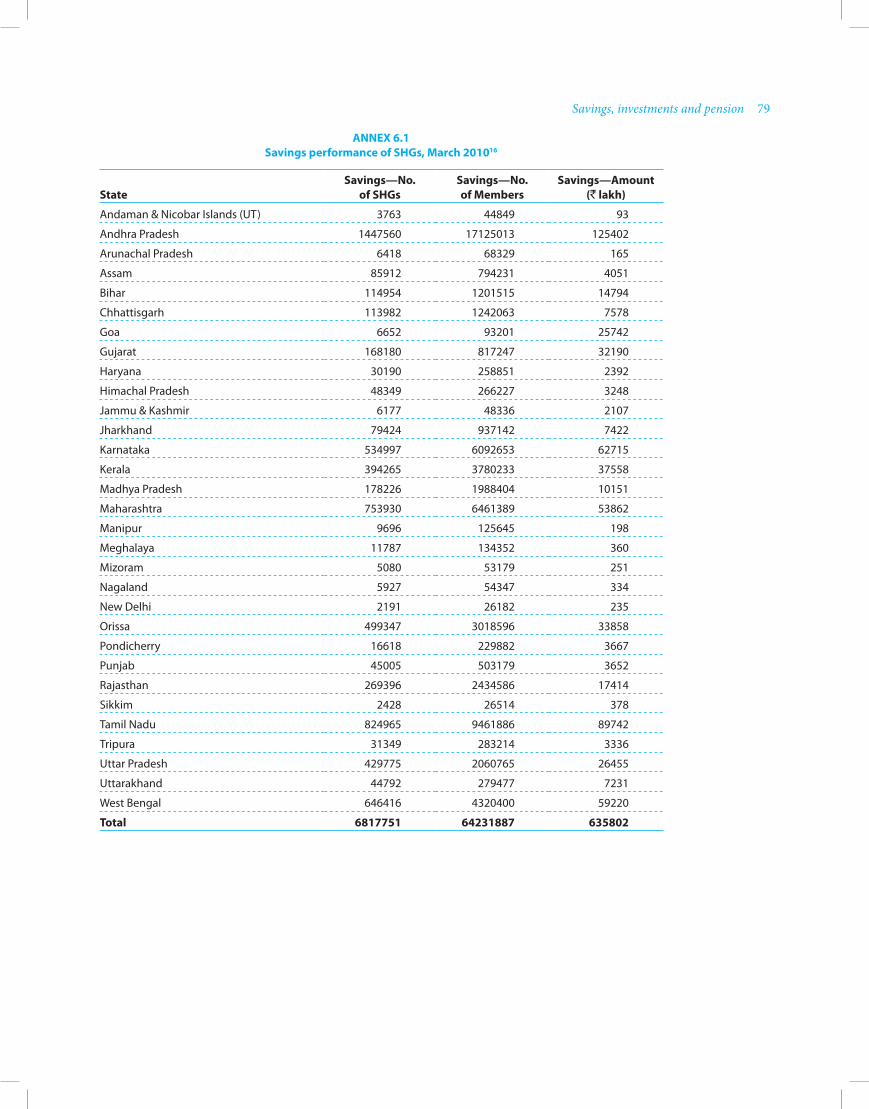
Savings, investments and pension 79
aNNeX 6.1 Savings performance of SHgs, march 201016
State
Savings—No. of SHgs
Savings—No. of members
Savings—amount (` lakh)
Andaman & Nicobar Islands (UT) 3763 44849 93
Andhra Pradesh 1447560 17125013 125402
Arunachal Pradesh 6418 68329 165
Assam 85912 794231 4051
Bihar 114954 1201515 14794
Chhattisgarh 113982 1242063 7578
Goa 6652 93201 25742
Gujarat 168180 817247 32190
Haryana 30190 258851 2392
Himachal Pradesh 48349 266227 3248
Jammu & Kashmir 6177 48336 2107
Jharkhand 79424 937142 7422
Karnataka 534997 6092653 62715
Kerala 394265 3780233 37558
Madhya Pradesh 178226 1988404 10151
Maharashtra 753930 6461389 53862
Manipur 9696 125645 198
Meghalaya 11787 134352 360
Mizoram 5080 53179 251
Nagaland 5927 54347 334
New Delhi 2191 26182 235
Orissa 499347 3018596 33858
Pondicherry 16618 229882 3667
Punjab 45005 503179 3652
Rajasthan 269396 2434586 17414
Sikkim 2428 26514 378
Tamil Nadu 824965 9461886 89742
Tripura 31349 283214 3336
Uttar Pradesh 429775 2060765 26455
Uttarakhand 44792 279477 7231
West Bengal 646416 4320400 59220
Total 6817751 64231887 635802
80 MICROFINANCE INDIA
aNNeX 6.2 Findings of microsave on No-Frills-accounts
The studies focused on opening and usage of no-frills-accounts. Interviews were conducted in five places in Uttar Pradesh and Delhi, with staff and customers of four banks (ICICI Bank, Union Bank, A District Cooperative Bank and Baroda Grameen Bank), an MFO (CASHPOR), an NGO (AWARD), a technology provider (FINO), and a mobile-banking initiative (Eko). These places and entities were chosen to accom-modate a variety of no-frills-accounts situations:
• Bothwheretheno-frills-accountwasprovidedandserveddirectlybyabankwithnoBCandwherethe bank worked through a business correspondent.
• Bothwheretheno-frills-accountswereofferedtothegeneralpublicandwheretheywereofferedtoruralworkers receiving wages from the government’s make-work scheme, the National Rural Employment Guarantee Act (NREGA).
• BothwhereaccountmanagementwasmanualandwhereitwasmanagedthroughITequipment(portablepoint-of-sale devices and mobile phones).
The sample of 243 respondents is not statistically representative of no-frills-account account holders nationally, but is enough to provide reliable insights.
Profile of the Respondents
Three out of five were illiterate (though not necessarily unschooled) and almost two-thirds depended on agricultural or other wage labour. There were an equal number of men and women. Almost three-quarters were of prime working age—between 26 and 45.
Reasons for opening a no-frills-account
Half the no-frills-account holders or ex-account holders interviewed opened their no-frills-account in or-der to handle small savings. Some others opened their accounts because to do so was ‘easy and cheap’ or because they were encouraged to do so by someone else.
An important minority, 20 per cent of the total, but virtually everyone in the specific research area, opened their accounts to receive payments under the government’s provide-work scheme, that is, NREGS.
Were the Reasons for opening the no-frills-account Fulfilled?
Almost half of the respondents said ‘yes’. Of the remainder, most said that the no-frills-account was in some way inconvenient (the bank too distant, for example). Some said they found the account did not offer the facilities that they had hoped for. (cheque books and loans were the most frequently mentioned)
Was the no-frills-account the first bank account opened?
For almost two-thirds of account holders, the no-frills-account was the first bank account they ever opened; however, more than half of the respondents said that there is someone in their family who already has a bank account.
Levels of Understanding
Two thirds of those who had opened an no-frills-account had a basic understanding of the nature and workings of their account.
Frequency of Transactions in active accounts
Of the 121 account holders interviewed who are actively using their no-frills-account, one in six said they transact daily and another one in four transact weekly. Altogether, 58 per cent said they transacted at least once a month. Many of these were in areas served by BC agents equipped with biometrically enabled point-of-sales devices. A further 20 per cent transacted whenever their NREGS wage was paid in.
Likes and Dislikes, and Ranking of account Features by importance
One third of respondents rated their account easy to open and manage, cheap, and offering good service. A quarter liked the proximity and the fact that they could transact in small amounts: this view, again, came mostly from those served on their doorstep by agents.
Savings, investments and pension 81
On the other hand, a third of respondents found using their no-frills-accounts ‘inconvenient’ and one in five complained of poor service. Others had specific complaints: one in eight disliked the lack of cheque-cashing or cheque-book facilities: these were mostly from a lower-middle income suburban area some of whom claim they had been told they would be able to encash cheques.
‘Product attribute ranking’ exercises among a limited number of respondents revealed that they rank the security of their deposits as most important, followed by the proximity of the service, the ability to save and withdraw small amounts, and the ease of withdrawal.
inactive accounts
Of all 200 no-frills-account holders interviewed, four out of 10 said their accounts were inactive. Of these, six out of 10 said their accounts had been inactive for more than two years; and another quarter for more than a year.
Why did the accounts Become inactive?
Among inactive account holders, more than one in five said that the reason had to do with poor or absent or distant services. Another one in seven lacked trust in the service provider, and another one in 10 had lost their account documentation. There were some who gave no answer other than ‘personal reasons’. Very small numbers said that they had no interest in saving, or that they had no surpluses to save.
marked Differences Between the Research areas
The figures given in these ‘findings’ need to be viewed in the light of marked differences between the re-search areas, each of which was characterized by a different combination of provider, BC and technology.
The first area included a lower-middle income housing area on the outskirts of a large town, served by an NGO-run BC from offices some kilometres away, using smartcard technology. Many of these accounts are now inactive either because of the distance of the office from their homes, or because the services were too basic for these users (many wanted to be able to clear cheques or use their cards in ATMs or take loans, but are not able to do so).
The second area is rural and served by a microfinance organization (MFO) which acted as a BC in order to bring savings services to its group members. It adopted smart cards and portable point-of-sale machines. Unfortunately, it very quickly created many accounts while the technology still had teething trouble, after which it gave up on the idea, leaving many customers with cards but no service. However, the technol-ogy provider, acting as a BC, subsequently improved the performance of the machines and recruited local agents who go door-to-door in their villages.
The third and fourth areas are again rural and served by a bank directly, without sophisticated technol-ogy. The no-frills-accounts were opened to receive NREGS wage payments. These accounts are mainly ac-tive, though many are only used to receive and withdraw the wage, since many account holders do not trust the process and prefer to encash their payments as soon as possible. Some, however, are starting to use their accounts for personal saving. The bank is introducing smart cards on a pilot basis, and plans to pay state pensions and widows’ allowances into no-frills-accounts.
The fifth area, urban, is served by a young mobile-phone-banking BC of a major bank. Most account holders made a deliberate choice to open their account (unlike the NREGS users in the third area, for example) and tend to have a good understanding of the system: for some, banking on the phone is a style statement. Many accounts therefore remain active. Where there are inactive accounts, it is because users have moved home, or because the account was opened on a whim, often at the suggestion of some third party, or because the user decided that the system is not to be trusted. Some also stop using the system because they want services not provided at present (ATM access and cheques) or because they find the network of agents is not yet wide enough.
Conclusions: Huge Potential, yet to be Realized
Just opening a no-frills-account is not enough to become an active participant in the financial system. The no-frills-account has to be a gateway to valued and usable services. Our interviews show that for many poorer customers, this means services that are conveniently close at hand so that they can be used fre-quently, to mop up small amounts of saving (or repayments) and to make those savings (or loans) available for withdrawal whenever they are needed. Above all, the service must be reliable, both in the sense of

82 MICROFINANCE INDIA
NoTeS 1. Quoted from the celebrated book Portfolios of the
Poor, Daryl Collins, Jonathan Morduh, Stuart Ru-therford and Orlanda Ruthven.
2. ‘Access to Finance in Andhra Pradesh’, CMR-IFMR for CMR-BIRD, funded by NABARD.
3. Table reproduced from ‘Aceess to finance in Andhra Pradesh’, Study by CMF-IFMR for CMR, funded by NABARD.
4. Provisional data provided by NABARD. 5. ‘Savings by SHGs’, Study by Raja Rao and C.S. Red-
dy, APMAS. 6. ‘Community Owned Microfinance Institutions—
meeting the challenge of double bottom line’, Girija Srinivasan and N. Srinivasan, Access Development Services and Rabo Bank.
7. Cited from ‘Microsave India Focus’, Note 47. 8. RBI Annual Report 2009–10, ‘Credit Delivery and
Financial Inclusion’. 9. Skoch Foundation in its study last year had found
that less than 12 per cent of no-frills-accounts had significant transactions.
10. Based on information provided by KGFS at the re-quest of the author.
11. ‘Microfinance in Assam—an overview’, presenta-tion by Dr Debabrata Das, Tezpur University in the MRAP researchers meet in CMF, Chennai, Tezpur University in the MRAP researchers meet in CMF, Chennai.
12. This was contributed by Dr Debabrata Das. 13. Unpublished paper by Mani Nandhi, University of
Delhi, presented in the MRAP Researchers meet in CMF, Chennai.
14. Microfinance and the dynamics of financial vulner-ability. Lessons from rural South India, by Isabelle Guerin and others; Rural Microfinance and Em-ployment, working paper 2009–5.
15. From an article by Uthira D. and Hansa Lysander Manohar in International Research Journal of Fi-nance and Economics 2009.
16. Provisional data of NABARD.
delivering services accurately and in the sense of guaranteeing security of deposits and inspiring confidence in the user.
The study found that no-frills-account dormancy occurs where these features are absent, or where no-frills-account holders are not aware that the features exist. That is, dormancy results from services being too distant, too infrequent, or unreliable (or perceived as unreliable), or from poor explanation of the services to potential customers.
But we also found cases where these features are on offer, and where no-frills-accounts are being actively used. Usually, this was where BCs were able to take services close to the users and offer a reliable and rapid service through the use of sophisticated technology. We also found a case where a bank, operating no-frills-accounts, without a BC or technology, was able to offer a limited but still useful service, handling NREGS wage payments.
Moving to a situation where no-frills-accounts as gateways to useful services becomes the norm rather than the exception will require massive effort. But a start has been made. High levels of dormancy do not negate the idea of the no-frills-account: on the contrary, they help us see what needs to be done to make no-frills-accounts truly inclusive.
Recommendations
No-frills-accounts can be improved, and dormancy rates reduced, if and when:
• Servicesaremorefullyandmorehonestlymadeknowntopotentialusers.• TargetingisimprovedsothatNFAsareofferedtothosewhowillfindthemmostvaluable(thepoor)
rather than to those that banks already perceive as potentially bankable (the not-so-poor).• No-frills-accountopeningisnotseenasanendinitselfbutastheprerequisiteforthedeliveryofreliable
and useful services.• Waysarefoundtoreachcustomers,frequently,closetotheirhomesorworkplaces:BCsandITdevices
have a big role to play in this respect.• Afullerrangeofservicesisavailabletono-frills-accountholders,especiallycredit,butalsoremittances
and cheque-clearing.
7Chapter
Policy environment and regulation
The microfinance sector has not yet been brought under comprehensive regulation. The proposed mi-crofinance bill seems stillborn1 on account of signif-icant differences of opinion within the sector on its coverage, relevance, significance and impact. How-ever, the developments in the last year underline the need for a sector regulator that would take care of the interest of all the clients and provide a measure of comfort to the lenders and investors. Presently, there is a void with regard to formulation of policies specifically for microfinance sector. The absence of an institutional mechanism for dealing with deviant behaviour by a microfinance institution (MFI)—though few—is strongly felt. While policy decisions that impact the sector are being taken, these are more as part of overall macro considerations, of the entire financial sector or the context of poverty alle-viation, or financial inclusion and so on. At the time of policy making of a overall macro nature that cuts across many sectors, the specific and narrow inter-est of institutions that focus closely on vulnerable sections of people do not get adequate attention.
The voice of the microfinance sector, if suffi-ciently strong and persistent, is heard more during revisions and refinements of policy already an-nounced. The result is that the policy making for the sector is ad-hoc. An example of this could be seen in the pronouncements relating to removal of the priority sector lending (PSL) tag from loans given by banks to MFIs. This seems to be a reaction to some of the practices in the field that adversely af-fected interest of customers. These practices related to mis-selling of credit products and coercive recov-ery measure. Some state governments have taken re-course to appointing state machinery and subjecting MFIs’ operations in their states to controls designed under legislation for moneylenders.2 Another ex-ample is the proposed change to the securitization
guidelines that have been announced might reduce the enthusiasm of MFIs to enter this market. It would also make it difficult for banks and others to buy securitized loan assets of MFIs. The peculiari-ties in microfinance have possibly not been consid-ered while drafting the changes in the securitization guidelines.
The policy for the sector suffers from two major infirmities. The first is that it is implicit and not overtly stated; the second is that it is mostly made behind the scenes. In fact, there are several fair and reasonable expectations of the government and the Reserve Bank of India (RBI) with regard to how mi-crofinance institutions should form, raise resources, mobilize equity, govern themselves, lend monies, price their loans and also recover these from the customers. These expectations have not been codi-fied in any manner as to reflect a body of guidance for MFIs to operate in the field. One of the oft re-peated reasons for absence of such guidelines is that a measure of flexibility is being afforded to a nascent sector. This reasoning is not valid any more. The sector has become fairly large and has significant presence in many states. It has managed to attract equity funds in considerable sums (about ` 10 bil-lion) both in India and abroad. The access to banks funds has also been significant (about ` 150 billion) with some MFIs constituting large exposures to the funding banks. In view of these developments, the sector should not be seen as nascent and the flexibil-ity if any to be offered to the sector should be clearly identified and positioned as such. Mere expectations which are by and large unstated cannot become can-ons of policy. The standards of behaviour should be expressly stated and compliance demanded from in-stitutions. Measuring deviance from a desirable be-haviour that is not articulated is very difficult and, even if measured, does not become the basis for any
84 MICROFINANCE INDIA
89 per cent of loan portfolio. But regulation of these institutions is confined to registration, information reporting and a few studies by the regulator. Poli-cymaking for microfinance institutions does not take place. The question of what would be a desir-able and enabling environment for MFIs and what is their place in the financial sector are questions that should be answered by policy. Then regulation can take steps to achieve the policy goals.
action against institutions concerned.3 It is in this context that the need for a sector regulator is felt. This by no means is a call on RBI to take the respon-sibility of regulating very small entities which in the overall financial sector do not constitute a signifi-cant financial volume.4 However, by sheer numbers of people who are customers, this sector is sensitive-ly significant. Customer protection in the financial sector is a public good that ought to be delivered by the state and the central bank. The need for cogent and well-defined policy and regulation of MFIs is a priority.
If the policy intent and content is clearly articu-lated, regulatory actions could be taken through different means rather than by statute. It is more likely that the lenders and the donors to the sector in partnership with the investors would take up is-sues relating to reasonable market behaviour and customer protection. The World Bank is already on course to support the Small Industries Development Bank of India (SIDBI) for developing a fairly broad framework of ‘good practice’ based policies for the sector. These set of policies are handed to the sector through loan conditionalities arising from its loan to SIDBI, which in turn, would be providing bulk funds to MFIs. With a share of almost 20 per cent of the borrowing book of MFIs, SIDBI is in a position to rally the other funders to forge a partnership that would have the ability, intent and competence to of-fer a set of disciplines and guidelines to borrowing MFIs. A lenders forum of all those who provide bulk funds to MFIs has been constituted and it has had a few rounds of meetings. During the current year the lenders forum would probably be formalized so that it could coordinate actions aimed at financial, operational and market disciplines on MFIs. A set of norms that secure reasonable market conduct, pro-tection of customers, fair reporting of information and systemic stability are the requirements. Enforce-ability of these norms would be through the funding offered to the sector—the cost, extent and terms of funds could be determined in accordance with the response of particular institutions to adherence to disciplines. In the short run, using loan conditions for securing reasonable market conduct seems the best way of ensuring orderly expansion of the sec-tor. A statute based regulatory practice might take time introduce; even more time and effort before it evolves in to a full-fledged mechanism and must be viewed as a long term goal.
In a technical sense, a major part of microfinance sector is regulated. The Non-banking Financial Companies (NBFCs) in microfinance are registered with RBI. They have a clientele that accounts for
Regulation in India—A global comparison
In a global survey carried out by Economist In-telligence Unit (EIU),5 regulatory framework was one of the aspects studied. The regulatory frame-work was examined from four aspects viz.,
1) Regulation of micro-credit operations, 2) Formation and operations of regulated spe-
cialized MFIs,3) Formation and operation of non-regulated
MFIs, and4) Regulatory and examination capacity.
India has been ranked thirteenth with a score of 62 per cent along with six others out of 54 countries that were ranked. (Cambodia was the top ranked country in regulation with a score of 87.5 per cent.) The survey makes the obser-vation that India achieves a score of 3 out of 4 for its regulation of micro-credit by established institutions, indicating that its regulations cre-ate only minor obstacles. It recognizes that the process for creation and operation of regulated, specialized MFIs is fairly simple and enables sev-eral industry players that were originally focused on SHG formation and other social programmes to transform themselves into NBFCs. On the regulatory capacity in terms of human resources, it observes that the numbers, skills and micro-finance expertise of examiners and regulators needs reinforcement.
One of the current problems is that feedback to policy establishment comes from the customer and the markets through indirect channels. This could be through media reports, reports received from the state authorities and social service organizations with different affiliations. The absence of unbiased machinery to examine grievances and problems makes it difficult to specifically deal with institu-tions that have caused problems in the field. The reaction by public authorities falls in two extremes: either to do nothing at all putting the customers to
Policy environment and regulation 85
across geographies, institutional forms and varying size is a question of considerable import. RBI as a statutory authority could take charge of regulatory policy for the sector. But the level of detail and the smallness of institutions might preclude the super-vision and administration of regulation. The lend-ers who deal with individual MFIs through grant-ing loans are sufficiently large in number and have the machinery to enforce lenders discipline on the MFIs. The donors that continue to support some of the MFIs do not have significant authority over these MFIs and may not be able to help with super-vision. An association of MFIs in their enlightened self-interest could take voluntary action to regulate the behaviour of the members. This is precisely what Sadhan and Microfinance Institutions Net-work (MFIN) have set out to do especially in the past one year. Third party service institutions such as the credit bureaus, social performance task force, institutions like microfinance transparency and the like which gather information from MFIs and make it available in a public forum can support supervi-sory effort.
The power of information in a public place—open for scrutiny by stakeholders—to regulate the market conduct is high. This eventually will be the best route towards making MFIs work efficiently, ef-fectively and in an orderly manner based on a mar-ket discipline. Sadhan in its attempt to ensure that the members subscribe to the overall objective of serving vulnerable customer fairly and reasonably has taken new initiatives to enforce the code of con-duct which it had formulated four years back. In the last year’s report, a reference was made to the fact that the code of conduct was more ornamental than functional. But during the current year, Sadhan had taken several measures to ensure that its code of con-duct is observed by the MFIs. The code which today has ethical behaviour, transparency, governance, fair competition, feedback and grievance redress mechanisms, client education and literacy as its core elements is finding greater acceptance among the members. An Ethics and Grievance Redressal Committee has been formed in Sadhan which will examine complaints on breach of the codes. Sadhan is also working on a code of conduct compliance tool for gathering information and which would be monitored from time to time. Going beyond com-pliance to code of conduct, Sadhan is also striving to raise awareness and adoption levels of social perfor-mance management among MFIs. The facilitation that comes from Sadhan in this regard is training and skill building, developing the literature, design of assessment tools and the indicators. During the
discomfort or to take sweeping measures which are outside the sector but would necessarily impact all institutions within. Measures such as bringing all MFIs under Money Lenders’ law or the proposal to withdraw the PSL tag are some examples. This man-ner of disciplining all institutions across the sector for the deviant behaviour of a handful is iniquitous. The ability to specifically deal with errant behaviour needs to be created and exercised so that real prob-lems are tackled precisely in proportion to the grav-ity of their nature.
The institutions functioning in the sector require an enabling environment. The enabling environ-ment is not only for the MFIs to start their opera-tions and run it as commercial entities pursuing their business goals but also for the customers to en-gage with the MFIs and benefit from the availability of financial services from them. Such an enabling environment cannot be built unless policy focuses very clearly on the major concerns. The major con-cerns that currently engage the government and RBI relate to interest rates, fair marketing practices, fair recovery practices, governance, concentration risk, conflicts of interest and banks exposure to the MFIs. While the concerns are there, they have not been adequately studied and analyzed. Real issues relat-ing to the field do not always reach key levels of gov-ernment and central bank. In the absence of sector specific and field specific information, certain views (often biased) are held that pass off as reasonable judgments. For example, there is a perception that interest rates of MFIs are far too high and reflect a profit seeking motive on the part of these institu-tions. There had been not even a superficial analysis of what it costs to deliver small loans at the door-step. Further, what the customer pays to avail loans from an MFI as contrasted from what they would pay to avail the same from a bank has not been ad-equately studied. In the past, there have been sur-veys which have brought out that the price paid by a borrower to avail loan from a bank could be as much as or more than what she would pay the MFI. But the emphasis on customer protection should shift from branding interest rates as extortionate to making available pricing information transparently before the user. The customer should be enabled to make an informed judgement on availing the loans by comparing the real price of loans from compet-ing sources.
The sector has an uneven institutional landscape with a number of small MFIs operating in different corners and a few large institutions operating with a large number of branches across the country. Who if any is best equipped to regulate and guide the sector
86 MICROFINANCE INDIA
institutions to produce the desired results. If three out of four borrowers from the sector are brought under the credit bureau, the remaining fourth has the potential of distorting the base information given by the credit bureau and render any decisions taken on the basis thereof questionable. Even if all MFIs participate in sharing information with the credit bureau, then it will still have the disadvantage of informal lenders and borrowings from the SHGs not being reckoned in the overall debt levels. As ex-plained in an earlier chapter, a survey carried out in Andhra Pradesh7 showed that the number of people who had borrowed from SHGs were five times more than those who had borrowed from an MFI. Of all those who had borrowed from an MFI, more than 67 per cent had also borrowed from an SHG. Mul-tiple borrowing by the customers of this type can re-ally not be brought into credit information bureau’s database in the absence of an understanding with different banks and further down with borrowing SHGs that actually have member wise accounts. The credit bureaus initiative is more a palliative and feel-good factor than a decision tool for MFIs today. It is not geared to detect and much less prevent high MFI credit exposure to individual customers and excessive debt in borrower’s hands.
On the financial inclusion sphere, some positive developments have taken place. During the year, based on the Usha Thorat Committee8 report, RBI asked banks to prepare a plan for providing banking services in every village having a population of more than 2000 but which remains unbanked.9 By March 2010, almost every district had prepared this kind of plan where the public sector banks and some large private sector banks have taken a lead role. These plans envisaged opening of new branches to a less extent and using business correspondents (BCs) as the main channel of providing a transaction point in these villages. This implies that over the next year or so, the BC space is set to grow. In a connected development, RBI had increased the type of enti-ties that could become BCs.10 The new entities that are allowed are retired officials and small for-profit merchant establishments such as grocery shops, in-dividual petrol pump owners and so on. Even with the expansion in the list of potential BCs, non-profits and individuals are the two broad types available for banks. In a further move, RBI made it possible for banks to charge a separate fee from the customers that are served by business correspondents in or-der to cover costs. This is intended to take care of the problems of viability of these services. Presently BCs are not able to get a reasonable compensation; banks also are not able to cover their cost even after
current year, Sadhan hopes to be able to commu-nicate effectively with its membership and secure a much better environment of operations.
MFIN also has a code of conduct approved by its members for adoption. Its membership base of around 39 has a market share of more than 75 per cent in terms of both clients and loan volumes in the sector. The code of conduct stresses fair prac-tices with the borrower, a fair system of recovery of defaulted loans, avoidance of multiple lending and limiting the debt burden on the customer. The members have agreed on a protocol for data sharing with credit bureaus and incident sharing with the other members, a code for staff hiring that avoids poaching, a whistle blowing policy and an enforce-ment mechanism. This observance of rules of con-duct is supported by the Office of Ombudsman6 that would be an arbiter of disputes and grievances.
A notable omission in the MFIN code is the gov-ernance aspect of MFIs. Being a network of mem-bers, perhaps it has felt that governance of the in-dividual institutions is beyond the capacity of peers to observe and control. Its multiple lending code stipulates that no MFI should become the fourth lender to a client. It also envisages that MFIs will avoid giving a loan that will take the loan burden beyond ` 50000 to an individual client. The en-forceability of multiple lending norms in the code is not easy. Adherence to this in the field has been found to be difficult. The field staff at branch man-ager levels and below felt that without sufficient information base and a tracking mechanism, it is difficult to ensure that the loans do not become the fourth one or that the outstanding does not exceed ` 50000. In fact, MFIN would have been better off to have instituted a qualitative customer appraisal mechanism rather than arbitrary limits on number of loans and amount of loans. An important initia-tive by MFIN has been to tie-up with two credit information bureaus—CIBIL and Highmark—for serving the needs of MFIs. The work of refining the MIS of member institutions in order for them to be able to report data to the credit bureaus is ongoing. While the credit bureaus might become functional and be able to offer information about individual customers, it is bound to take a couple of years. The problems relating to intense competition in the field between MFIs and multiple loans do not seem near-ing a solution. Credit bureaus would at best be able to provide information based on data given by the participating MFIs. Last year’s default problem in Kolar and the continuing incidents elsewhere in the country show that 40 MFIs out of around 300 or so do not make a significant enough number for credit
Policy environment and regulation 87
Act, RBI does seem to be on weak ground. In regu-lation of NBFCs, the primary focus of RBI seemed to be on the institutions and not on customers. The moneylenders’ Act with their customer protection focus seems to have convinced the Courts of the le-gitimacy of the state’s action. But with two regula-tors, the MFIs will have greater compliance issues. Moneylender controls militate against principles of financial institution regulations in interest pricing and loan recovery. There is a need to unify the regu-latory regime and agree upon a delineation of roles between RBI and state governments as has been at-tempted in the case of Urban Cooperative Banks.12
RegulatoRy DeveloPments
In a surprising move, RBI had referred to a com-mittee13 the issue of whether loans by banks to MFIs should continue to get priority sector status. There have been reports that the Committee recommended removal of bank loans to MFIs from the list of eligible activities under priority sector. Reportedly this with-drawal will be in a phased manner and completed by March 2012, so as to cause least disruptions to the sector. This announcement has caused consterna-tion among banks and MFIs alike. The committee’s report is anxiously awaited. If the priority sector eli-gibility is removed from microfinance bulk loans, it would have a short term shock-effect on funds flow to the MFIs. With re-rating of risks, at a higher in-terest rate, loans might continue to be available to MFIs. The banks might not find it difficult to re-place MFI loans with others in their priority sector basket, as the present level of exposure to MFIs is about 0.56 per cent of bank credit. The damage is more in terms of the loss of image that the sector will suffer. Every other sector/subsector that entered the list of priority sector loans has increased its cov-erage over time and hardly any sector has been re-moved from the list. Microfinance will be one of the rare sectors determined to be unsuitable for priority sector label.
Another move by RBI is the proposal to amend the guidelines of securitization and sale of assets of NBFCs. The introduction of Minimum Holding Period (MHP) and Minimum Retention (MR) does not take cognizance of the loan tenor widely preva-lent in the microfinance sector. The securitized as-sets or assigned debts are considerably enhanced in quality and offer a low risk investment opportunity to banks. The guidelines, if finalized without chang-es, would hamper the MFIs’ diversification strate-gies for resource mobilization. Banks would also be put to difficulties as they have to lend against book
paying less than optimal remuneration to BCs. The permission to charge service charges to customers would facilitate development of business models that are viable.
Recently, RBI placed for public discussion a document on hiring of corporate retail networks as BCs. This has immense possibilities of being main-streamed.11 The paper is currently being examined by RBI in the context of comments received from the public; during the current year, one hopes to see partnerships between banks and large corporates with a retail outreach into the hinterland.
From the state governments, the problems for the MFIs continued. Some of the states where MFIs have a considerable presence have reacted to the growth of the sector with either apathy or hostility. The happenings in Kerala, Tamil Nadu, Karnataka and Andhra Pradesh have shown the states in a poor light. Enforcement of moneylenders’ regulation on MFIs in Kerala, setting up district level committees to enquire into the operations of MFIs in Andhra Pradesh, the apathy shown in dealing with default of loans to MFIs in Karnataka and the attempted ex-clusion of MFIs from mainstream financing space in Tamil Nadu, all show that the states are apathetic to the problems of MFIs. While the state authori-ties have the good of vulnerable sections of people at heart, they should realize that curbing activities of MFIs without having satisfactory alternative sys-tems in place will reduce choices to the customers. In the last year’s report a suggestion was made for an interaction between the centre and states on the approach to microfinance sector and specifically to MFIs. It is high time that the Government of India had a dialogue at the highest level with state gov-ernments and brings in a uniform and measured reaction to the microfinance sector. If parts of the sector do not behave well, means of disciplining those parts must be found. Punishing the entire sector including good working institutions is not in the interest of public policy. Forcing such institu-tions to operate at sub-optimal levels and in some cases to restrict and even close down operations will inflict heavy economic cost especially when states do not have a mechanism by which to replace this huge infrastructure. With paucity of ideas on how to provide the last mile financial architecture, any ac-tion in haste against the sector might prove counter-productive.
An area of potential regulatory conflict is between state governments and RBI in the matter of NBFCs registered with RBI. With the Supreme Court up-holding the locus standi of the Kerala Government to ask the NBFCs to register under the moneylenders’

88 MICROFINANCE INDIA
notes 1. After a few stories in the media that the bill is about
to be passed early in 2010, no further discussions have been heard of. It is understood that the Minis-try of Finance is looking for a significant redraft of the bill, taking into account differing views and last two years’ developments in the sector.
2. Refer to Chapter 2 for coverage of Kerala and Andhra Pradesh governments moves on this.
3. Even as the draft of this chapter was being finalized, newspaper reports stated that ‘RBI had also sent an informal communication to NBFC MFIs, telling them among other things to bring their return on equity below 20 per cent, their return on assets, or ROA, below 2 per cent, to reduce interest rates, to raise transparency levels and to improve governance standards.’
4. The MFIs outstanding loans constituted 0.56 per cent of bank credit at the end of March 2010.
5. ‘Global microscope on the microfinance business environment—A pilot Index and Study’, by the Economist Intelligence Unit, commissioned by IDB, CAF and IFC.
6. Vijay Mahajan, Chairman of MFIN announced in a recent press conference that there would be four regional ombudsmen to share the work burden.
7. ‘Access to Finance in Andhra Pradesh, CMF-IFMR’, for CMR-BIRD funded by NABARD.
8. The High Level Committee to Review Lead Bank Scheme set up by RBI, was headed by Ms Usha Thorat, Deputy Governor, RBI. The report is avail-able in www.rbi.org.in.
9. Circular of RBI/ 2009-10/233 RPCD.CO.LBS.HLC.BC.No.43/02.19.10/2009-10 dated 27 November 2009.
10. Circular of RBI/2009-2010/238 DBOD.No.BL.BC. 63 /22.01.009/2009-10 dated 30 November 2009.
11. Please refer to the chapter on Financial Inclusion for more information and analysis on corporate BCs.
12. RBI and some state governments after intense dia-logue signed Memoranda of Understanding in re-lation to respective roles in supervision over urban cooperative banks. Both had supervisory powers over urban cooperative banks derived from banking Regulation Act and Cooperative Societies Act.
13. The Committee is headed by V. K. Sharma, Execu-tive Director, RBI.
14. Circular of RBI RBI/2009-10/273 DPSS.CO.No.1357/02.23.02/ 2009-10, 24 December 2009.
15. ‘Access to Finance 2009’, CGAP. 16. ‘Microfinance Activities and the Core Principles for
Effective Banking Supervision’, http://www.bis.org/publ/bcbs167.htm
debts of MFIs without credit quality enhancement. Hopefully, the pleas of the MFIs would be consid-ered while finalizing the guidelines by RBI.
The mobile payment guidelines issued in 2008, stated that
the long term goal of mobile payment framework in India would be to enable funds transfer from ac-count in one bank to any other account in the same or any other bank on a real time basis irrespective of mobile network a customer has subscribed to. This would require inter-operability between mobile payments service providers and banks, and develop-ment of a host of message formats. Banks may keep this objective while developing solution or entering into arrangements with mobile payments solution providers.
In keeping with its goal, RBI introduced chang-es14 to improve the usability of the mobile payments system. The changes are that (i) banks are permit-ted to offer this service to their customers subject to a daily cap of ` 50000 per customer for both funds transfer and transactions involving purchase of goods/services, (ii) transactions up to ` 1000 can be facilitated by banks without end-to-end encryption, and (iii) banks are permitted to provide fund trans-fer services which facilitate transfer of funds from the accounts of their customers for delivery in cash to the recipients up to ` 5000 per transaction and a total value of ` 25000 per month per customer.
The push in the Indian microfinance sector should be towards governance standards, transparency and responsible finance. Interest rate disclosures, infor-mation reporting standards and customer grievance handling procedures are some of current priorities that require priority attention. The access to finance report of CGAP15 pointed out that South Asia does not demand interest rate disclosure to customers by financial institutions to the extent other regions do. Against 91 per cent countries in high income coun-tries requiring interest rate disclosure, 50 per cent of South Asian countries require it. For example, India does not have the equivalent of Truth in Lending legislation.
The Basel Committee’s proposed guidelines16 on microfinance supervision were brought out in Feb-ruary 2010. The proposals are being examined with regard to both deposit taking MFIs and pure credit MFIs. Hopefully, the action that follows will bring in a regulatory regime that would prove beneficial to the customers of Microfinance.
8Chapter
Technology in microfinance
Microfinance being a sector that serves very large number of small people distributed over wide geo-graphical areas could be a highly cost intensive proposition. The adoption of appropriate techno-logical solutions both in the hardware and software platforms has ensured so far that the costs remain within reasonable limits. In fact, very large micro-finance institution (MFIs) have made technology solutions an integral part of their operational and control processes in the bid to contain costs. How-ever, the information being gathered from the sec-tor year after year on the technology front reveals that institutions are lagging behind the technologi-cal development and have to ramp up their internal technology appreciation processes in order to catch up. A survey of the information and communica-tion technology scenario in the sector was carried out by Microfinance Insights.1 The survey found that for many MFIs, availability of reliable continu-ous electric power was a problem. Twenty-one per cent of branches reported severe problems of no power (3 per cent) or frequent shut downs (17.7 per cent). A further 50 per cent branches reported load shedding, but not too frequent. Ten per cent head quarters offices of MFIs and 19 per cent branches did not have internet connectivity. Twenty-seven per cent of head offices and 32 per cent of field branches had to rely on weak and uncertain dial-up connections in order to communicate with each other. In terms of the types of technologies in use for different purposes in the MFIs, more frequently, MIS was the major purpose with almost 80 per cent institutions having some kind of software in place. Nineteen per cent of institutions used ATMs in their business. Ten per cent reported use of personal Digital Assistants (PDAs) with their personnel as a means of transacting and communicating transac-
tions. Smart cards and biometrics were used by 8.5 per cent of institutions. Overall a size-wise analysis revealed that the larger institutions had better ac-cess to technologies. Mobile banking was seen as an area of great interest that was being watched by MFIs in the light of its promised potential. How-ever, in terms of utilizing mobile enabled services in their business, MFIs were clear that they would use it for receiving loan repayments and more for money transfers. Seventy-eight per cent MFIs prefer to use it to receive loan repayments from customers with only 51 per cent MFIs opting to use mobiles for making loan disbursements. Being a new technol-ogy, mobile financial services were being watched with equal amounts of interest and caution. The challenges perceived in mobile banking related to client unfamiliarity, limitations of infrastructure and also IT security concerns when data is trans-mitted over the mobile networks. The survey also mapped the expenditure on technology incurred by the MFIs. It was surprising that the cost conscious MFIs did not look at investment in technology as a long term measure that would improve efficiencies and bring down operational cost. Forty-two per cent of MFIs reported spending less than 5 per cent of their annual expenditure on information and com-munication technology (ICT). Fifteen per cent insti-tutions have chosen to spend more than 15 per cent of their annual expenditure on ICT. Perhaps there is a need for a study to prove the link between high investments in ICT and the growth rates in business as also the operating costs. Results of such a study probably would provide guidance to all MFIs in un-dertaking technology investments.
However, it is difficult to conclude that willing-ness of MFI to invest in technology solutions alone would be sufficient to secure quality software that

90 MICROFINANCE INDIA
to secure qualitative implementation. This issue was reported last year too. There have been projects which have run on for more than a year or so in the implementation process without any reports being produced. Some of these implementations are with very large MFIs.
There have been apprehensions among lenders that the information provided to them by MFIs is not always factual. Loan portfolio audits have fre-quently brought out the divergence between key data reported by MFIs such as current recovery ratios, portfolio at risk (PAR) and growth rate and what was actually found out from the field. The con-cern is the ability of MFIs to capture information from the field and collate it together in a central-ized MIS platform with high standards of fidelity and integrity. The disconnection between account-ing and MIS in many MFIs has made the quality of MIS suspect. During field visits in the preparation of this report, it was found that many smaller and medium MFIs still do not have MIS software. Even where they had MIS software, there was no means of verifying that what is contained in the MIS is a true reflection of the information in books of ac-counts. There were possibilities that differences in number of clients, number of accounts, amount of loan disbursed, amount of loan outstanding as also the recovery rates could be mistaken. There have been reports in a couple of MFIs that branch staff had been able to draw higher incentives than war-ranted taking advantage of separation between ac-counting and MIS.
Tally seems to be the software of choice when it comes to accounting. The earlier versions of Tally do not have a provision for linking with MIS software especially where a multi-branch model is involved. In recent, times Tally has announced an ERP soft-ware which might have the capability to integrate MIS and accounting. In many MFIs, MIS has been centralized. The reports received from branches in different forms (internet connected branches can send the data by email, but those not connected will send hard information by mail) will be collated manually, leaving scope for errors (both accidental and intentional).
Some of the MFIs are viewing the mobile banking space to offer a cash free mechanism of transaction to their customers. Grameen Koota3 (GFSPL) and Ujji-van are examples of MFIs which are on the drawing boards to roll out mobile enabled financial services in collaboration with a bank. Equitas as described in the last year’s report has been using SMS based re-ports for real time update of data especially relating to daily repayments across its operational locations.
will work on the MFIs different aspects of business. There have been quite a few cases of large technology projects that have been delayed for very long period of time for want of understanding of the sector by the technology solutions provider and also inability of the MFIs to clearly explain their needs in order
Do it yourself networking technology!2
Sahastradhara KGFS (SKGFS) located on the foothills of the Himalayas, faced issues of inter-mittent network connectivity that interfered with its day-to-day operations, resulting in transac-tion delays and increase in customer wait-time at its branches. The hilly terrain not only caused instability in network availability, but also the eventual disruption took a lot of time to correct. The options available from the network provid-ers were limited and costly. VSATs (Very Small Aperture Terminal) once used to provide Inter-net connectivity to the SKGFS branches did not prove a fitting option on account of transmission dealys, weather induced disruptions and high costs. The IFMR rural finance team decided to take matters on its hands instead of blaming the technology and service providers.
IFMR Rural Finance in partnership with Air-Jaldi created an interconnected network between the SKGFS headquarters and its branches, with Internet being supplied through this network. The average distance between branches is 10 kms with the first branch being 75 kms away from the headoffice in Jolly Grant.
The Jolly Grant network uses a combination of wireless WiFi links, utilizing the publicly avail-able and unlicensed 2.4 and 5.8 GHz frequen-cies and wired LAN cabling. Relays, the antennas used to transmit and receive communication, are all mounted on low masts and are equipped with battery power backup allowing the network to stay up during power cuts, a frequent occur-rence. Two of the relays, which are located in ar-eas where power is very erratic or not available at all, are solar powered. The network is managed and monitored from a Network Operation Cen-tre (NOC), which utilizes a range of Free/Open Source tools configured to suit the network topol-ogy. As a result of this solution, now all SKGFS branches have connectivity bandwidth of 256 Kbps and the headoffice is connected at a speed of 512 Kbps through the NOC. The local SKGFS team has also been trained to handle day-to-day issues of basic maintenance.

Technology in microfinance 91
Cost reducing technologies is where the sector is headed today. Atom Technologies has offered a solution ‘m-collection’ that helps MFIs track re-payment process on a mobile phone. Java enabled mobile handsets required by this solution enable the field staff to travel even when recording and transmitting transaction information. The data transmitted by the mobile is integrated with the back office server to provide real time updates to the MFI, saving hours in the back office on return from the field.
Other MFIs too have adopted such solutions. But as described earlier, using mobiles for financial transac-tions is not yet common place.
Mobiles in financial inclusion space have made more progress than in microfinance. The CGAP supported pilot has gone beyond initial testing stage. The first phase of the project was primarily focused on developing a business model and mak-ing improvements on Eko user interface. Last year’s report mentioned that Eko had established a part-nership with the State Bank of India (SBI) to be-come its business correspondent (BC). Eko has also established multiple other partnerships with tech-nology vendors, mobile operator(s) and marketing firms to drive its business. Eko had begun to grow fast since the second quarter of 2009–10. It had a client base of 70000 clients by July 2010. EKO has 500 service points in Delhi, Bihar and Jharkhand providing remittance to migrant workers. Between 1500 and 2000 transactions (deposits, withdrawals and transfers) are put through each day for a finan-cial value of between ` 12 lakh and ` 20 lakh. Eko is one of the successful models in mobile enabled financial inclusion. The reasons for success of EKO are that it was an early mover and could secure some funding from CGAP; more importantly it entered in to partnership with State Bank of India.
In the last year’s report, a reference was made to the need for software solutions implementers that can act on behalf of MFIs. The level of unfamiliarity with technology solutions in MFIs makes it difficult for them to understand the costs and time involved. The reasonability of costs on a given quality of soft-ware and the internal preparations that are needed to be made for making implementation successful are unclear to the MFI which makes decision mak-ing difficult. It also hinders drafting of satisfactory contracts with the suppliers of software. The unfa-miliarity delays decisions and/or result in subop-timal decisions which tend to be ad-hoc needing changes either in the software platform or in the vendor within a short period of time.
Technology is a key investment. Investing for the expanded business that is likely to result in, say, five years’ time, should be an underlying consideration. But many MFIs tend to catch up with past problems rather than build a solution to secure the future business potential. This is an aspect which requires immediate attention from the sector. Mircofinance Institutions Network (MFIN) and Sadhan would do well to invest in a core body of experts who could function as the link between technology solutions providers and the MFIs; and protect the interest of MFIs in negotiating with the technology firms.
Microfinance computing in the cloud
The internet has changed the way software so-lutions for businesses will be owned and used. Instead of having to invest in IT systems—the servers, the storage devices, the networking, the software, the databases—business can tap into IT capabilities and solutions over the Internet anywhere in the world, simply by logging in to a website. The actual work is done remotely on servers that can be far away, in large server farms that process and hold data for several compa-nies or millions of users. This new information technology model where the technical resources required to carry out processing are elsewhere is called ‘cloud computing’. The cloud computing model lowers the cost of IT, outsources mainte-nance hassles and ensures best technical exper-tise. On account of economies of scale and a large customer base, not only costs are low, but tech-nologies too remain current. The user MFIs do not have to understand the complexities of plan-ning, implementing and day-to-day running of IT systems.
Ekgaon Technologies offers a cloud computing platform for MFIs. Vijay Pratap Singh4 says ‘ …. these organizations do need technology and solu-tions but they don’t have the capacity to run them on their own. They have to buy equipments, set up air conditioned rooms, hire people with back-ground in technology who can run the computer and server. We created a platform where they can come out and create an account for their organiza-tion and start using their systems, just like we use an email or facebook account. Now we are trying to propagate that platform for microfinance orga-nization wherein there is no registration fee. They are only charged for whatever transactions they do in the system. That comes out to be cheaper for the organization in terms of saving the cost of install-ing their systems …..’

92 MICROFINANCE INDIA
Intellecap has introduced MostFit, an open source MIS software to help small MFIs to expand their busi-ness. MostFit is built on a platform that is suitable as a client-server application that fits in with the existing hardware environment. It is reportedly scalable, flex-ible to accommodate any lending model (individual or group), any frequency of repayment instalments (weekly, monthly) and can interface with mobile de-vices. The software can be customized by the user modification of the application is possible. While it is useful for large MFIs too, initially Intellecap aims to target smaller MFIs so that they too can scale up.
Arjun Sharma and Shreyas Gopinath of CMF5 had carried out a SOS specific survey based study of user perspectives relating to the ICT solutions used by them. The study enquired into the level of auto-mation and integration of key business processes in MFIs. Twenty-four MFIs responded to the survey. Further, software vendors had responded to another set of questions relating to the features of the soft-ware supplied by them.
Majority of the MFIs were found using standard software for most of their business processes; either custom developed or off-the-shelf software to man-age their key business processes. Budgeting and the fixed asset management process mostly relied on self-developed applications or even manual comput-ing on Excel worksheets. A significant proportion of MFIs used Excel as the platform on which Payroll and HR processes were managed. Budgeting and payroll management involve significant accounting and finance related work. Both are key processes where archived information is needed frequently for reference. Manual computing for these processes is not the best option.
Most of the respondents have automated the generation of critical reports such as the balance sheet, cash flow statement, and PAR. The capital adequacy requirement report is the least automated, with 43 per cent (Figure 8.4) of the respondents stating that they prepare this manually.
Branch-office connecTiviTy
91 per cent of the MFIs have electricity in all their branch offices, 74 per cent have all branch-offices connected to the internet and able to send informa-tion on-line (Figure 8.5) using Point of Sale (POS) terminals to relay information to the headoffice. Seventeen per cent of the MFIs are using POS ter-minals to relay information to the headoffice. This data does not capture the number of hours electric-ity is available, which can vary widely based on the location of the branch-offices and have a significant
Banking 30%
9%
35% 57% 0%4%
9%4%
9%4%
48%
43%
35%
39%
17% 4% 70%
39% 9% 22%
Budgeting
Closing
Journal Entries(New, Adjusting)
Chart of Accounts (Creating and Modifying)
Custom Dev/In House
O� the Shelf Software
Manually Prepared
Prepared using Excel or other Spreadsheet Program
(per cent refers to the proportion of user MFIs)
figure 8.1 Process-wise use of software solutions
Loss Reserves or ... 45% 36%
23%
23%
27%
27%
27%
27%
27%
18% 18%
9%
5%
5%
5%
5%
18%
18%
14%
14%
14%
45%
50%
68%
68%
68%
64%
64%
64%
Entering Payment ...
Refinancing a Loan
Rescheduling a Loan
Disbursing Loans
Approving Loans
Cancelling Loans
Entering new Loans
Creating and ...
0% 20% 40% 60% 80%100%
Custom Dev/In House
Off the Shelf Software
Manually Prepared
Prepared using Excel or other Spreadsheet Program
(per cent refers to the proportion of user MFIs)
figure 8.2 Process-wise use of software solutions
57%
26%
Client Information ...
CRM
Payroll Management
HR Administration
Accounts Payable
Accounts Receivable
Fixed Asset Management
17%
22%
30%
26%
35% 13% 43%
48% 4%17%4%
48% 17% 4%
35% 4% 39%
43% 4% 4%30%
30% 30% 9%4%
26% 9%9%Custom Dev/In House
O� the Shelf Software
Manually Prepared
Prepared using Excel or other Spreadsheet Program
9%
(per cent refers to the proportion of user MFIs)
figure 8.3 Process-wise use of software solutions
Capital AdequacyRequirement 13% 43%
43%
30%
43% 43% 9%4%
43% 22% 4%
43% 13%
43%
Portfolio at Risk
Cash Flow Statement
Balance Sheet
0% 20% 40% 60% 80% 100%
Automatically/SystemGenerated
Generated via Systemand ManuallyConsolidated
Manually/via Excel orother SpreadsheetProgram
(per cent refers to the proportion of user MFIs)
figure 8.4 Process-wise use of software solutions

Technology in microfinance 93
impact on the ability to transfer mission critical data to management on time.
Twenty-two per cent of implemented MIS so-lutions are integrated solutions provided by ven-dors. Most MFIs are developing their MISs using in-house expertise, or off-the-shelf software from multiple vendors (for example, Tally for accounting) (Figure 8.6).
When asked to rank the level of satisfaction with their current MIS on a scale of 1 to 10, with 1 being least satisfied and 10 being most satisfied, respon-dents with in-house developed MIS had the high-est satisfaction rating of 7, and those with solutions provided by single vendors had the lowest rating of 5.8 (Figure 8.7).
Most MFI respondents have automated their critical business processes and have been reason-ably successful in connecting their branch-offices (despite existing infrastructural constraints) to re-lay mission sensitive information to management. Furthermore, results show that currently most MFIs are using either in-house developed soft-ware, or a smorgasbord of off-the-shelf software as part of their MIS solutions. While there is nothing wrong with existing solutions, the average satisfac-tion scores suggest that Indian MFIs feel that there
is still significant room for improving their current systems.
MFIs ranked constraints such as cost, lack of suit-able solutions, and lack of available vendors, and so on, to determine the challenges they face with regards to expanding the capabilities of their cur-rent MIS. Based on the qualitative and quantitative responses received, the biggest challenge faced by MFIs is the lack of vendors for providing enterprise wide solutions, tailored to the unique requirements of the Indian MFI, or integrated into their existing systems framework, at an appropriate cost.
Technology is a necessary part of the solutions that MFIs should integrate in their business pro-cesses, but technology is not a complete solution in itself. The hype about some technologies takes attention away from the problems, making institu-tions believe that all problems can be solved given appropriate technology. Some of the more obvi-ous and easy processes are at times made complex through technology. The features that are marketed may not all be necessary for MFIs to acquire. Some of the technologies are not practical in the operat-ing conditions of MFIs. Commenting on mobile payment technologies Benjamin Lyon6, founder of Frontline SMS Credit said that there is ‘….a tenden-cy to try and seek out solutions to the bigger de-velopment challenges. Easier low hanging fruits are often overlooked.’ From a different stand point, Ian Miles7 commented that ‘as familiarity with IT grows, so does awareness about its value and risks: which is not to say that it is always used in the most effective ways or that risks are always are minimized.’ The question that needs to be asked in choice of tech-nology or design of technology enabled processes is whether technology runs the business or the busi-ness runs to meet their objectives and technology enables the same? If technology runs business and technology dictates process, it is a very difficult situ-ation to be in. The sector should use technology for its enabling features. Customers hate to get answers such as ‘our system does not permit monthly instal-ment loans; so you should be content with weekly
0%
10%
20%
30%
40%
50%
60%
70%
80%
90%
100%
Number of MFIs with 100% branch
o�ces with internet access
Number of MFIs with 100% branch
o�ces withelectricity
Number of MFIs with 90-100% of branch
o�ces with access to enter data using
MIS software
74% 74%
91%
figure 8.5 Branch-office infrastructure
MIS DevelopedInhouse
More than 90% of MIS Solution Providedby Single Vendor
MIS Comprised of Software byMultiple Vendors
39%
22%
39%
figure 8.6 MIS solutions
Average satisfactionscore of in-housedeveloped MIS
Average satisfactionscore of vendorprovided MIS
Average satisfactionscore of MFIs usingmultiple vendors
7
5.8
6.2
figure 8.7 Satisfaction ratings with MIS

94 MICROFINANCE INDIA
4. Vijay Pratap Singh, CEO, Ekgaon Technologies in an interview to Microfinance Focus, 9 August 2010.
5. Arjun Sharma and Shreyas are consultants with CMF-IFMR. This study was specially commissioned by CMF for the purpose of State of the Sector Report. The author gratefully acknowledges the support of Justin Oliver, Executive Director, CMF for this study.
6. In an interview to Microfinance Insights, vol. 15, November–December, 2009.
7. In article in Microfinance Insights, vol. 15, November–December, 2009.
repayment loans.’ When technology no more gives out such answers, then it would have arrived.
noTes 1. Microfinance Insights, vol. 15, November–December,
2009. 2. Adapted from a blog in IFMR blog page. 3. For a detailed description of Grameen Koota’s
implementation of Mcheck mobile pilot, refer to ‘Benefits of Mobile Payments in Microfinance’, Vikas Jhunjhunwala, Microfinance Insights, vol. 15, November–December, 2009.
9Chapter
Social performance, transparency and responsible finance
The social performance decibel levels have been increasing in microfinance. Often the terms ‘social performance’ and ‘responsible finance’ are inter-changeably used in the sector. ‘Responsible finance’ relates to a manner of dealing with acquired custom-ers, with fair, equitable and transparent treatment of customers being the objective. Responsible finance is to do with establishing processes and products that seek to enhance value to the customer and ensure that the customers’ interests stay protected. ‘Social performance’ takes institutions beyond responsible finance. While responsible finance looks at the exist-ing customer base, social performance looks to the context in which the institution operates and engage-ment beyond financial transactions with potential customers as well. Microfinance institutions (MFI) usually have missions that go beyond business. The mission has to generally do with serving vulner-able sections of people and making a difference to their livelihood and quality of life. Responsible fi-nance would achieve a fair and equitable transaction framework with the clients through a suitable set of products and processes. Social performance would seek to deliver greater value not only in terms of the financial services but in terms of improving incomes, health, social standing and the educational levels, be-sides dealing with political and social issues from a development perspective. In recent times, addressing environmental concerns has also entered the social space. Delivering social performance thus is more than doing business well. It is about performing well beyond business, looking at the customer circum-stances and the local context of operations of the MFI. If this difference between social performance and responsible finance is understood, the need for the MFIs to develop competencies in looking be-yond the customer and the immediate business in-terest of the MFI would be clear.
In terms of responsible finance, several initiatives have been taken during the year. The emergence of a new industry network of commercial MFIs un-der the label of Mircofinance Institutions Network (MFIN)1 has been an exciting development. This network has already secured broad based consensus among its member MFIs (which together account for more than 75 per cent of the Indian microfi-nance market) on the code of conduct in relation to business practices, setting in place a customer griev-ance mechanism, fair practice principles on hiring personnel from other MFIs and a code of competi-tion. These measures have the potential to ensure that business remains fair towards the customer and deal with reputation risks arising from undesirable practices. Sadhan2 on its part had encouraged its membership to undertake social performance re-porting and look at the reputational issues involved in unprofessional conduct. Sadhan is developing a code of conduct assessment tool which has the po-tential of being upgraded in to a social performance measurement tool. To establish responsibility in financing, issues relating to cross-selling of prod-ucts, mis-selling of products, opacity in pricing and bundled product marketing have all to be carefully looked at. Both Sadhan and MFIN have asked the MFIs to make available greater amount of informa-tion to the customers that would help them stay aware and take informed decisions on loans.
MFIN3 had described the problems of the industry as one of having a large network at a nascent stage, which is making it difficult to ensure that compli-ance with qualitative processes across the institutions is monitored well. The idea of MFIN in introducing self-regulation and a culture of compliance relating to good practices is a sound one. Periodic reporting and verification of the reports would go a long way in ensuring that financing remains responsible. The
96 MICROFINANCE INDIA
to provide loans with the result that the borrower from a situation of under-funding moves into ex-cess funding; at the same time, the affordability of these loans in terms of loan servicing ability of the borrower turns adverse. The competitive practices in the market, the space given for competition to en-ter because of small loan sizes and the structure of weekly instalments do not reflect responsible finance considerations. Another factor in this is the lack of quality client focused appraisals. Assumptions of peer pressure and group decision making in provid-ing an implicit guarantee for members’ repayment of loans have tended to exclude appraisal of individual customers’ ability to repay. With increasing individ-ual loan exposures (arising from multiple borrow-ing) the importance of customer appraisal cannot be overstated. The sooner individual customer specific appraisal is introduced by MFIs for taking credit de-cisions, the better the sector would be able to show its focus on responsible financing. Even in the case of SHGs, the field observations are that large loans are given by banks without looking to the purpose on the premise that groups take credit decisions tak-ing borrowers status, purpose and servicing ability into consideration. But the groups have been found to divide the bank loans equally among members. For example, in Andhra Pradesh, loans as large as 0.5 million had been equally distributed among the members by the groups, which does not indicate any appraisals having been made at the group level.
The rate of interest on loans is another conten-tious issue. While MFIs operate on a very different model of retail distribution of financial services, their costs are bound to be higher. However, con-tinued working on high cost distribution models over sustained periods of time does not reflect well on the MFIs which have made investments in pro-fessional human resources as also state of the art technology. In a large number of cases, MFIs do not seem to pass on the cost savings that are achieved as the volumes build up. Last year’s report did point to the fact that several MFIs have, in fact, reported increasing yield on their portfolios even when the operating costs decline. During the current year, the trend persisted. Some MFIs have at least signalled that they are sensitive to this fact by announcing a reduction in their rates of interest.
Data relating to 31 MFIs were analysed for a four year period (Figure 9.1). Operating costs and yields were compared for individual MFIs and it was found that five institutions that had reduced oper-ating costs had also lower yields, the implication being that the cost savings have been passed on to customer. Twelve MFIs recorded a higher operating
setting up of an ombudsman in four regions by MFIN to listen to the unresolved complaints of customers is a particularly positive move aimed at enhancing the protection levels available to customers. Sadhan has set up a Ethics and Grievances Committee to enquire into complaints and decide on ethical issues. These are some of the aspects of the industry’s own efforts that will drive it towards responsible finance.
A further initiative across the industry that is gaining ground is that of financial literacy for the customers. The initial training offered by MFIs such as the GRT and CGT are sought to be revamped with additional inputs to raise the level of financial literacy. Good use of loans, understanding prices, selecting suitable loan products for the different purposes are all to be subjects of interest in the cus-tomer training. However, one of the aspects that have not been focused so far in responsible finance is the suitability of loan products to the customers’ needs. By and large, the simple loan products that were introduced based on the Grameen experience comprising weekly instalment of repayments are continuing to be in vogue. While new names have been provided such as emergency loans, education loans, housing loans, livelihood loans, the nature of the products remain the same with a small change in the length of repayment period. Most customers in rural and urban settings do not enjoy cash flows that permit weekly repayment of loan instalments. The vulnerable sections of people have irregular and lumpy cash flows. Such lumpy cash flows do not permit the borrower to service the loans from their incomes.
A number of small studies have found that loan servicing that takes place in case of MFIs is funded out of borrowings and other sources. A study car-ried out by CMF in Andhra Pradesh4 found that new loans taken from banks, self-help groups (SHGs) and other MFIs are being used to repay the other existing loans including the MFI loans. Bor-rowers used 14.6 per cent, 25.4 per cent, 20.4 per cent and 7 per cent of the loans taken from Banks, JLGs, SHGs and informal sources, respectively, for repaying other loans.5 With multiple borrow-ing becoming the norm, using one loan to repay another does not have any negative connotations for the customer. The loan product design has a lot to do with breeding indiscipline in the repayment behaviour.
A matter of further concern is the small size of loans that continue to operate. Majority of borrow-ers in the first and second cycles tend to receive loans which are much smaller than their require-ment. This leaves the field open for competing MFIs
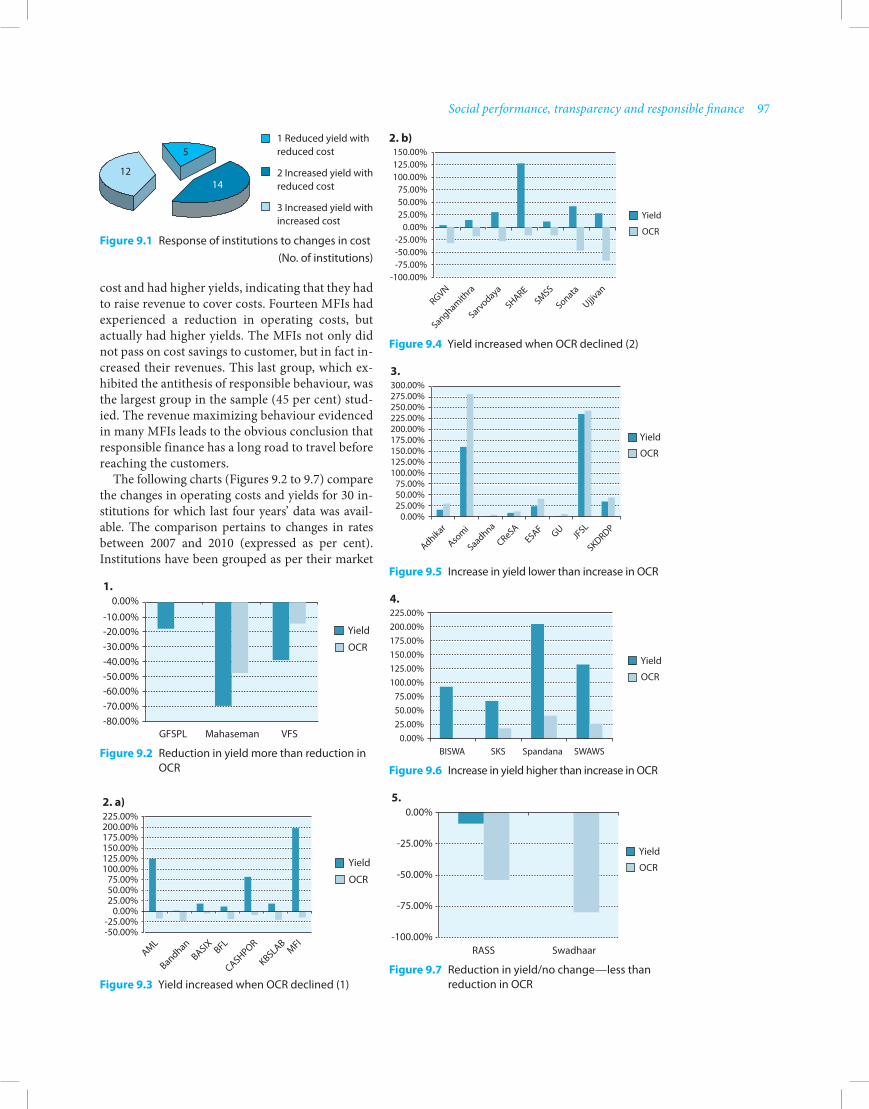
Social performance, transparency and responsible finance 97
cost and had higher yields, indicating that they had to raise revenue to cover costs. Fourteen MFIs had experienced a reduction in operating costs, but actually had higher yields. The MFIs not only did not pass on cost savings to customer, but in fact in-creased their revenues. This last group, which ex-hibited the antithesis of responsible behaviour, was the largest group in the sample (45 per cent) stud-ied. The revenue maximizing behaviour evidenced in many MFIs leads to the obvious conclusion that responsible finance has a long road to travel before reaching the customers.
The following charts (Figures 9.2 to 9.7) compare the changes in operating costs and yields for 30 in-stitutions for which last four years’ data was avail-able. The comparison pertains to changes in rates between 2007 and 2010 (expressed as per cent). Institutions have been grouped as per their market
Figure 9.1 Response of institutions to changes in cost (No. of institutions)
1 Reduced yield withreduced cost
2 Increased yield withreduced cost
3 Increased yield withincreased cost
14
5
12
Figure 9.2 Reduction in yield more than reduction in OCR
0.00%
-10.00%-20.00%-30.00%-40.00%-50.00%-60.00%-70.00%-80.00%
GFSPL Mahaseman VFS
Yield
OCR
1.
Figure 9.3 Yield increased when OCR declined (1)
225.00%200.00%175.00%150.00%125.00%100.00%
75.00%50.00%25.00%
0.00%-25.00%-50.00%
AML
BandhanBASIX BFL
CASHPOR
KBSLABMFI
Yield
OCR
2. a)
300.00%275.00%250.00%225.00%200.00%175.00%150.00%125.00%100.00%
75.00%50.00%25.00%
0.00%
Adhikar
Asomi
Saadhna
CReSAESAF
JFSL
SKDRDPGU
Yield
OCR
Figure 9.5 Increase in yield lower than increase in OCR
3.
150.00%125.00%100.00%
75.00%50.00%25.00%
0.00%-25.00%-50.00%-75.00%
-100.00%
RGVN
Sanghamithra
Sarvodaya
SHARESMSS
Sonata
Ujjivan
Yield
OCR
Figure 9.4 Yield increased when OCR declined (2)
2. b)
Yield
OCR
225.00%200.00%175.00%150.00%125.00%100.00%
75.00%50.00%25.00%
0.00%BISWA SKS Spandana SWAWS
Figure 9.6 Increase in yield higher than increase in OCR
4.
Yield
OCR
0.00%
-25.00%
-50.00%
-75.00%
-100.00%RASS Swadhaar
Figure 9.7 Reduction in yield/no change—less than reduction in OCR
5.
98 MICROFINANCE INDIA
strategies in pricing. Where MFIs seemed to have dropped effective prices, with a decline in their OCR (and in some cases even with an increase in OCR), clearly the strategy was in line with custom-ers’ needs. There are MFIs that achieved increased revenues when their OCR fell or achieved higher yield increases than the cost increases warranted. In such cases, certainly the customer was not served. The short point is that even when there is a business justification for reducing interest prices, MFIs did not do so; some actually increased prices when they should have passed on cost savings to customers.
TranSparency—noT only in pricing
The interest pricing issues have been the subject of great debate. Confusion prevails in the market as to whether any specific MFI is pricing its loans higher or lower than others. Since the stated price of a loan and the actual price paid by the borrower are very different on account of different charges and loan structures, it is difficult to conclude in a competitive market as to which loans are better for the customer. Apart from the interest rate that is applied on the loan, the number of instalments of repayment, compulsory deposits collected, the rate of interest paid on the compulsory deposits, service charges, inspection charges, membership charges, monitoring charges, the premiums to be paid on compulsory insurance policies and the adjustments if any made for pre-payment of loans are some of the factors that determine the real price paid. Mi-crofinance Transparency (MFT)6 has launched a major initiative during the current year in order to ensure that MFIs become transparent in providing information to the customers, and to the funders and regulators on the real prices paid on their loans. This initiative would seek to enrol all MFIs as members for reporting their pricing structure on the different products marketed by them. Based on the information collected from the MFIs, MFT will compute actual prices paid by customers and host price information of all reporting MFIs on its web based platform. This information which is a com-parison of all reporting MFIs, would also be available to all funders, regulators and the public at large. The transparent prices arrived at after processing all the covert and overt costs paid by the customer to the MFI would be required to be declared to the cus-tomer in the sanction letter or the pass book. As a further measure of customer comfort, MFT plans to produce customer literacy material on use of interest price information to make credit availing decisions.
Further, MFT proposes to work with MFIs in ex-ploring the relationship between the cost structures and the price, and help them in deciding on business strategies to bring down costs. MFT would also work with the apex institutions and the regulator in pro-viding research based inputs for policymaking and advisories. So far, more than 80 MFIs have agreed to be part of the MFT framework and 50 institutions have already provided data of a qualitative nature. The launch of this platform is expected in October/November 2010. The need for transparent pricing initiative is long overdue. In a competitive market which operates across all major cities and towns in India, the customers of MFIs need greater amount of information in order to be able to take decisions. Further, customers also require the information as to what kind of loans would be suitable given the purpose for which they would like to borrow. The power of transparent information available in pub-lic domain would have a salutary effect on the inter-est rates and MFT expects that interest rates would drop once the platform becomes active.
Transparency in microfinance is not only about prices being communicated in an understandable form to the customer. There are other aspects of business where transparency is necessary. The in-formation put out by MFIs about their performance is often not consistent with their past record and the regulatory filings. The repayment rate is an aspect on which considerable scepticism prevails. The ef-fort to mislead donors and funders by a minority of institutions is not a mistaken attempt, but a deliber-ate one. There have also been cases of parallel sets of data, flexibly used according to the destination of information. Governance processes have not been transparent where required. Transformation pro-cess of NGO microfinance operations in to com-mercial operations has been a mystery. The manner in which share stakes are decided, the transfer of borrowers from books of the MFO to the MFI, valu-ation of enterprise, form of payment for the same and recipients of prices paid at the time of transfor-mation have all been shrouded in mystery. While those who do not have a stake in company need not be provided with such information, keeping away the information from the customers, staff and other stakeholders is not a good practice.
The annual report disclosures are less than forth-coming on some of the problematic areas of busi-ness. MFIs have suffered losses in some locations on account of frauds, and had to wind up operations in some other within a short period of launch for want of familiarity and appropriate staff. Such occurrenc-es are not reported. The MFI’s attitude to provision

Social performance, transparency and responsible finance 99
of information to stakeholders could impact the staff; they too could decide to conceal information from the higher authority. When the truth is known, it could be too late as was found by some MFIs in Kolar last year.
Social perFormance—going beyond Finance and loan conTracTS
On the field, quite a few MFIs have taken the so-cial performance aspects of their business seriously. In the last years report, specific mention was made of Equitas Microfinance based in Chennai. Equitas has by choice earmarked a certain portion of its an-nual profits to be spent on development interven-tions. Presently Equitas is engaged in improving the educational standards of the children of its clients, improving their access to health services and also expanding the options available for employment through skills training of members. As a further measure of engaging the customers in improving their quality of life, Equitas has been piloting the concept of offering groceries from dedicated stores. Members can purchase their requirements from these stores at prices that are lower than the market. A separate entity (Dhanya Kosha) has been spawned by Equitas to handle the marketing of grocery to members and it is supported by a food security loan available from Equitas for families which run short of resources to buy even their weekly or monthly re-quirements of food articles. Reviewing the profiles of the clients, Equitas also found that a significant number are retailing fruits and vegetables in their local areas. A model of supply of fruits and vege-tables to the petty trader in her local area has been designed. This would be run on commercial lines by Equitas; but at the same time, it is designed to offer considerable value to the traders through re-duced cost (prices and transport costs), better qual-ity and a credit limit to support their trade. Equitas describes its development interventions in the cus-tomers’ lives as enlightened self-interest. Building a loyal customer base and building economic security through different means ensures that Equitas would remain relevant in the lives of these customers and also ensure that the financial relationship remains strong.
Bandhan Microfinance had been operating a programme for the hardcore poor. This pro-gramme has been in the running for more than two years and the initial results reported by Bandhan have been highly favourable. SKS too ran a special programme focused on the ultra-poor. While the
results are reportedly positive, the coverage in such programmes is too small to create an impact. Large MFIs must find ways of incorporating the features of their ultra-poor programmes in their normal business. Ujjiwan Financial Services based in Ban-galore had brought out a social performance report as part of its annual report. The social performance report carried a survey of 3000+ clients across three loan cycles. The conclusion arrived at by Ujjiwan is that its customers have generated additional income on account of sustained access to microfinance. But then Ujjiwan concludes that the increase in income is far too small to be able to pull people out of pover-ty. Microfinance alone may not be sufficient allevi-ate poverty in the poor customers is the finding that makes Ujjiwan look for other solutions as well. The most telling insight from the survey is that microfi-nance cannot replace the ubiquitous moneylender.
Practices that erode well-being and social content of microfinance seem to mushroom. Ever since credit insurance became a compulsory requirement among MFIs, older persons find themselves persona-non-grata in microfinance. Insurance companies routinely refuse to insure people’s lives when they reach 60. Once credit insurance is denied, the MFI does not want to provide a loan to such borrowers as the bulk funders would not refinance portfolios lacking in complete credit insurance cover. The result is perverse; clients that had dealt with the MFI for many cycles maintaining regular repayments find themselves cut out of its loans because they turned 60! Dropping regular clients that too when they are old does not seem to be either socially desirable or responsible business behaviour. The sector needs to find ways of continuing to finance people above the age of 60, subject to their credit worthiness. Insurability of their lives should have nothing to do with providing them credit.
Sale of insurance policies to customers is another area of concern. In the previous reports, it had been pointed out that the insurance cover is neither ef-fective nor understood well by the customers. But insurance has become a precondition for loans in many MFIs. In some MFIs, multiple insurance poli-cies is the norm. In some MFIs, it is difficult to escape the feeling that revenues drive the sales of insurance rather than risk mitigation of the customer. Cus-tomers are not provided adequate service after the policy is sold. MFIs have not created insurance spe-cialization within their staff and skill sets to handle claims. The drop out rates of customers from many insurance schemes is a telling comment on custom-er satisfaction level. Responsible MFIs that want to look at customer risk mitigation would also focus on
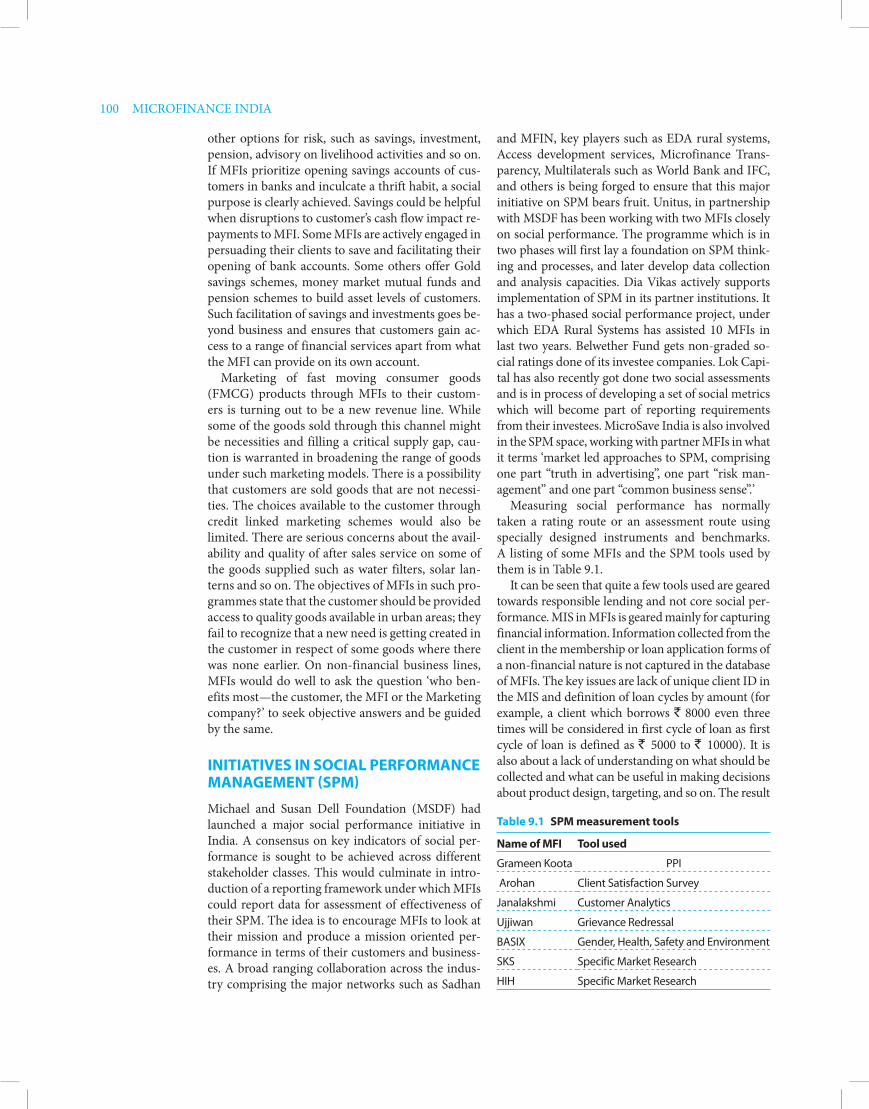
100 MICROFINANCE INDIA
other options for risk, such as savings, investment, pension, advisory on livelihood activities and so on. If MFIs prioritize opening savings accounts of cus-tomers in banks and inculcate a thrift habit, a social purpose is clearly achieved. Savings could be helpful when disruptions to customer’s cash flow impact re-payments to MFI. Some MFIs are actively engaged in persuading their clients to save and facilitating their opening of bank accounts. Some others offer Gold savings schemes, money market mutual funds and pension schemes to build asset levels of customers. Such facilitation of savings and investments goes be-yond business and ensures that customers gain ac-cess to a range of financial services apart from what the MFI can provide on its own account.
Marketing of fast moving consumer goods (FMCG) products through MFIs to their custom-ers is turning out to be a new revenue line. While some of the goods sold through this channel might be necessities and filling a critical supply gap, cau-tion is warranted in broadening the range of goods under such marketing models. There is a possibility that customers are sold goods that are not necessi-ties. The choices available to the customer through credit linked marketing schemes would also be limited. There are serious concerns about the avail-ability and quality of after sales service on some of the goods supplied such as water filters, solar lan-terns and so on. The objectives of MFIs in such pro-grammes state that the customer should be provided access to quality goods available in urban areas; they fail to recognize that a new need is getting created in the customer in respect of some goods where there was none earlier. On non-financial business lines, MFIs would do well to ask the question ‘who ben-efits most—the customer, the MFI or the Marketing company?’ to seek objective answers and be guided by the same.
iniTiaTiveS in Social perFormance managemenT (Spm)
Michael and Susan Dell Foundation (MSDF) had launched a major social performance initiative in India. A consensus on key indicators of social per-formance is sought to be achieved across different stakeholder classes. This would culminate in intro-duction of a reporting framework under which MFIs could report data for assessment of effectiveness of their SPM. The idea is to encourage MFIs to look at their mission and produce a mission oriented per-formance in terms of their customers and business-es. A broad ranging collaboration across the indus-try comprising the major networks such as Sadhan
and MFIN, key players such as EDA rural systems, Access development services, Microfinance Trans-parency, Multilaterals such as World Bank and IFC, and others is being forged to ensure that this major initiative on SPM bears fruit. Unitus, in partnership with MSDF has been working with two MFIs closely on social performance. The programme which is in two phases will first lay a foundation on SPM think-ing and processes, and later develop data collection and analysis capacities. Dia Vikas actively supports implementation of SPM in its partner institutions. It has a two-phased social performance project, under which EDA Rural Systems has assisted 10 MFIs in last two years. Belwether Fund gets non-graded so-cial ratings done of its investee companies. Lok Capi-tal has also recently got done two social assessments and is in process of developing a set of social metrics which will become part of reporting requirements from their investees. MicroSave India is also involved in the SPM space, working with partner MFIs in what it terms ‘market led approaches to SPM, comprising one part “truth in advertising”, one part “risk man-agement” and one part “common business sense”. ’
Measuring social performance has normally taken a rating route or an assessment route using specially designed instruments and benchmarks. A listing of some MFIs and the SPM tools used by them is in Table 9.1.
It can be seen that quite a few tools used are geared towards responsible lending and not core social per-formance. MIS in MFIs is geared mainly for capturing financial information. Information collected from the client in the membership or loan application forms of a non-financial nature is not captured in the database of MFIs. The key issues are lack of unique client ID in the MIS and definition of loan cycles by amount (for example, a client which borrows ` 8000 even three times will be considered in first cycle of loan as first cycle of loan is defined as ` 5000 to ` 10000). It is also about a lack of understanding on what should be collected and what can be useful in making decisions about product design, targeting, and so on. The result
Table 9.1 Spm measurement tools
name of mFi Tool used
Grameen Koota PPI
Arohan Client Satisfaction Survey
Janalakshmi Customer Analytics
Ujjiwan Grievance Redressal
BASIX Gender, Health, Safety and Environment
SKS Specific Market Research
HIH Specific Market Research
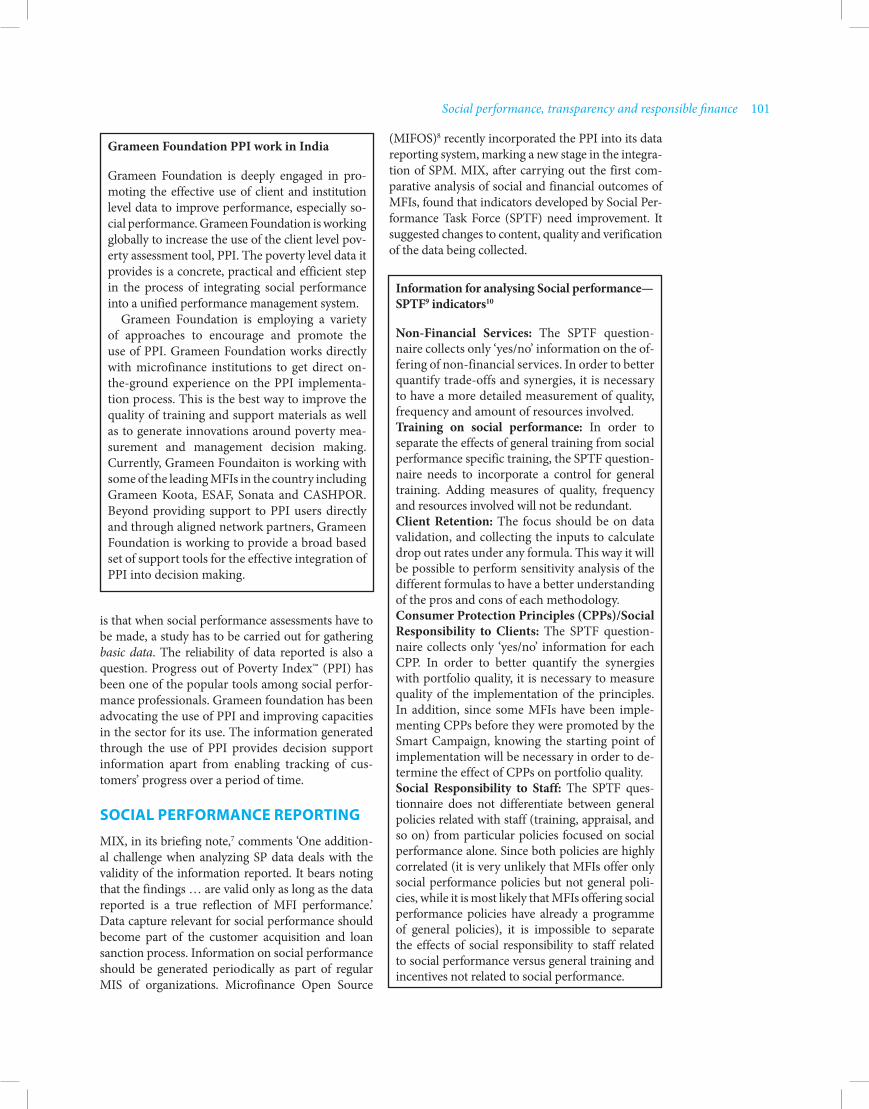
Social performance, transparency and responsible finance 101
is that when social performance assessments have to be made, a study has to be carried out for gathering basic data. The reliability of data reported is also a question. Progress out of Poverty Index™ (PPI) has been one of the popular tools among social perfor-mance professionals. Grameen foundation has been advocating the use of PPI and improving capacities in the sector for its use. The information generated through the use of PPI provides decision support information apart from enabling tracking of cus-tomers’ progress over a period of time.
Social perFormance reporTing
MIX, in its briefing note,7 comments ‘One addition-al challenge when analyzing SP data deals with the validity of the information reported. It bears noting that the findings … are valid only as long as the data reported is a true reflection of MFI performance.’ Data capture relevant for social performance should become part of the customer acquisition and loan sanction process. Information on social performance should be generated periodically as part of regular MIS of organizations. Microfinance Open Source
(MIFOS)8 recently incorporated the PPI into its data reporting system, marking a new stage in the integra-tion of SPM. MIX, after carrying out the first com-parative analysis of social and financial outcomes of MFIs, found that indicators developed by Social Per-formance Task Force (SPTF) need improvement. It suggested changes to content, quality and verification of the data being collected.
Grameen Foundation PPI work in India
Grameen Foundation is deeply engaged in pro-moting the effective use of client and institution level data to improve performance, especially so-cial performance. Grameen Foundation is working globally to increase the use of the client level pov-erty assessment tool, PPI. The poverty level data it provides is a concrete, practical and efficient step in the process of integrating social performance into a unified performance management system.
Grameen Foundation is employing a variety of approaches to encourage and promote the use of PPI. Grameen Foundation works directly with microfinance institutions to get direct on-the-ground experience on the PPI implementa-tion process. This is the best way to improve the quality of training and support materials as well as to generate innovations around poverty mea-surement and management decision making. Currently, Grameen Foundaiton is working with some of the leading MFIs in the country including Grameen Koota, ESAF, Sonata and CASHPOR. Beyond providing support to PPI users directly and through aligned network partners, Grameen Foundation is working to provide a broad based set of support tools for the effective integration of PPI into decision making.
Information for analysing Social performance—SPTF9 indicators10
Non-Financial Services: The SPTF question-naire collects only ‘yes/no’ information on the of-fering of non-financial services. In order to better quantify trade-offs and synergies, it is necessary to have a more detailed measurement of quality, frequency and amount of resources involved.Training on social performance: In order to separate the effects of general training from social performance specific training, the SPTF question-naire needs to incorporate a control for general training. Adding measures of quality, frequency and resources involved will not be redundant.Client Retention: The focus should be on data validation, and collecting the inputs to calculate drop out rates under any formula. This way it will be possible to perform sensitivity analysis of the different formulas to have a better understanding of the pros and cons of each methodology.Consumer Protection Principles (CPPs)/Social Responsibility to Clients: The SPTF question-naire collects only ‘yes/no’ information for each CPP. In order to better quantify the synergies with portfolio quality, it is necessary to measure quality of the implementation of the principles. In addition, since some MFIs have been imple-menting CPPs before they were promoted by the Smart Campaign, knowing the starting point of implementation will be necessary in order to de-termine the effect of CPPs on portfolio quality.Social Responsibility to Staff: The SPTF ques-tionnaire does not differentiate between general policies related with staff (training, appraisal, and so on) from particular policies focused on social performance alone. Since both policies are highly correlated (it is very unlikely that MFIs offer only social performance policies but not general poli-cies, while it is most likely that MFIs offering social performance policies have already a programme of general policies), it is impossible to separate the effects of social responsibility to staff related to social performance versus general training and incentives not related to social performance.
102 MICROFINANCE INDIA
While ratings and assessments are valid external views of what is delivered to customer, these rarely take the customers perspective on what is valuable about the social interventions. Social performance is more treated as a delivery issue on which the recipient can have no views. Recently, Equitas car-ried out study of what value customers attribute to its development interventions in education, health and skills training. The customers were surveyed through a structured questionnaire to attribute the value they perceived as having received. The study brought out that all the interventions were positively valued. The value attributed to health interventions were 10 times the cost of delivery of services, five times the cost of delivery in skills training of cus-tomers. The education intervention had the lowest multiple of one, meaning that cost of delivery and value perceived were equal. Overall the customers were extremely satisfied with the interventions, but had suggestions on cost reduction, increasing scale and enlarging the scope of benefits. The gain of Equitas from the study was inputs for planning of development interventions including budget alloca-tion decisions.
An important aspect of SPM is the engagement with the MFI in implementation of appropriate pro-cesses. The present focus in SPM is mostly on de-veloping rating tools, indicators and measurements. Agents external to the MFIs carry out the tasks and leave the organization with a report. While assess-ments and ratings are necessary, resources should be allocated for building capacities within MFIs for adopting practices and processes relevant for SPM. Loosely described, there is a lot of action on find-ing out how to diagnose what is wrong; but little on handholding the patient through the treatment and recovery process.
do miSSionS maTTer?
CMF commissioned (exclusively for SOS 2010) a study of mission statements of leading MFIs and the financial performance aligned to the mission state-ments11. The objective was to assess the nature of the mission (financial or social) and to what extent financial performance reflects movement towards mission fulfilment. Fifty leading MFIs (measured by number of borrowers) that have clearly published mission statements were chosen as subjects for this study of which data relating to 38 could be finally used.
The ratings for mission orientation as ‘social’ and ‘financial’ was obtained through a survey adminis-tered to individuals with no familiarity of MFIs, and
thus little to no knowledge of the industry. Partici-pants studied the ‘mission’, ‘vision’ and ‘goals’ of each MFI, and rated each combined statement on a scale from 1 to10 on the two factors, ‘social’ and ‘finan-cial’. The respondent’s intuitive understanding of the terms ‘social’ and ‘financial’ with basic guidelines highlighting parameters defining each term formed the basis of the rating. The goal of the survey was to capture and quantify an objective ‘perception’ of the extent of social and financial content of each MFI’s mission. The underlying assumption is that this perception measure captures the MFI’s true in-tentions as perceived by a lay person. The reported ratings have been averaged over all respondents for each MFI.
A number of MFIs appear to place an equal em-phasis on social and financial goals, shown by equiv-alent ratings such as BASIX and Satin Credit Care (15 MFIs had a differential of less than 1 between ‘social’ and ‘financial’ rating). Respondents indicated that very vaguely worded missions were given low ratings in each category. For example, PWMACS re-ceived low ratings in both categories, suggesting that respondents could not clearly identify or categorize the specific mission of the MFI. Another general trend is for highly social mission driven MFIs to have low financial mission ratings, suggesting that there is a trade-off even in the thinking language between investing in financial and social goals.
Table 9.2 gives the average rating given by the respondents based on their perception of the mis-sion statements as also the rank ordering of MFIs. The names of the institutions have not been given, but their form has been given so that scores could be examined from the context of presumed man-date of non-profit, social forms. The top 10 ranked institutions on social content of mission had four Non-banking Financial Companies (NBFCs) and six non-NBFCs. The last 10 ranks on social content as mission had three NGOs, four NBFCs and all the three cooperatives in the sample. Of the top 10 ranked on financial content of the mission, nine were NBFCs. Only one was a non-commercial entity.
A second stage analysis rated whether finan-cial performance was socially aligned by assigning ratings for Return-on-Assets, Yield on portfolio, trends in cost and yields (whether the MFI achieved reduced yield when operating costs declined) and availability longer duration loans for customers.12 The scoring was a simple two factor one, with high score of ‘2’ assigned if benchmark was achieved and ‘1’ if the benchmark was not achieved. The scores on financial aspects were compared with scores on mission content.
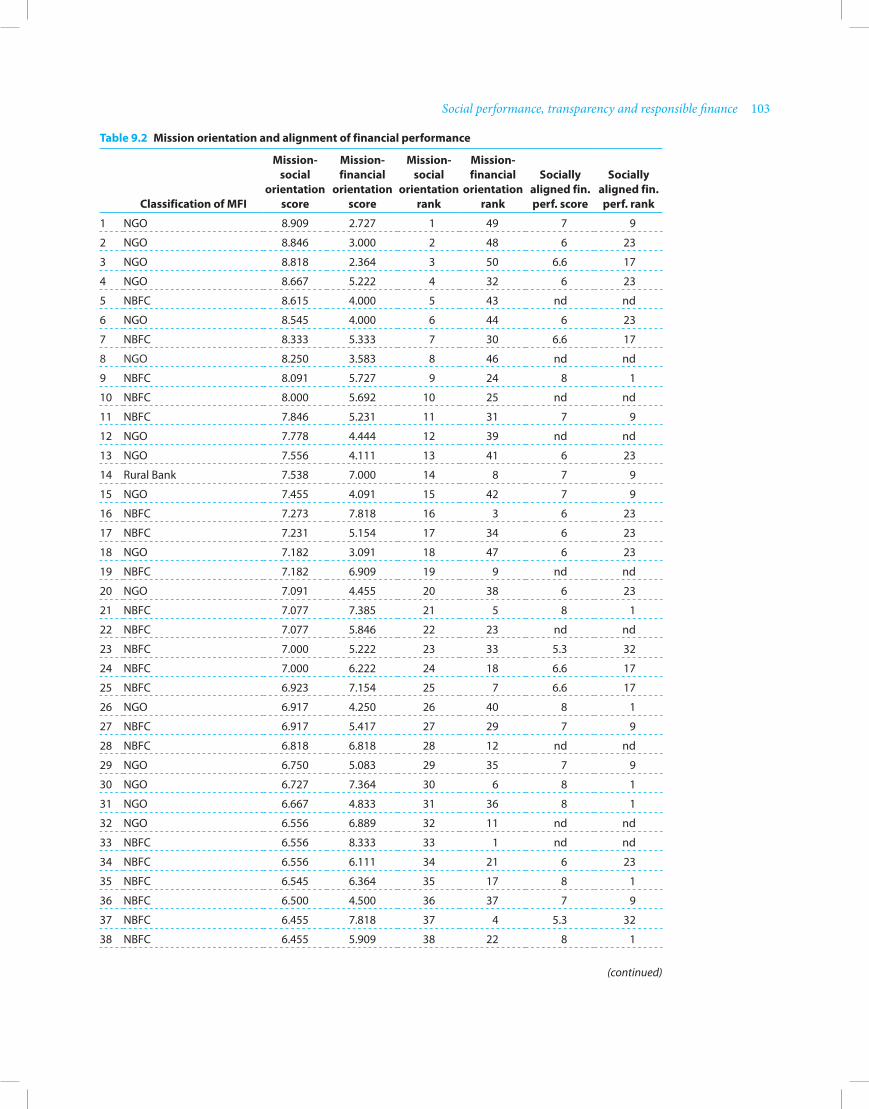
Social performance, transparency and responsible finance 103
Table 9.2 mission orientation and alignment of financial performance
classification of mFi
mission-social
orientation score
mission- financial
orientation score
mission- social
orientation rank
mission-financial
orientation rank
Socially
aligned fin. perf. score
Socially
aligned fin. perf. rank
1 NGO 8.909 2.727 1 49 7 9
2 NGO 8.846 3.000 2 48 6 23
3 NGO 8.818 2.364 3 50 6.6 17
4 NGO 8.667 5.222 4 32 6 23
5 NBFC 8.615 4.000 5 43 nd nd
6 NGO 8.545 4.000 6 44 6 23
7 NBFC 8.333 5.333 7 30 6.6 17
8 NGO 8.250 3.583 8 46 nd nd
9 NBFC 8.091 5.727 9 24 8 1
10 NBFC 8.000 5.692 10 25 nd nd
11 NBFC 7.846 5.231 11 31 7 9
12 NGO 7.778 4.444 12 39 nd nd
13 NGO 7.556 4.111 13 41 6 23
14 Rural Bank 7.538 7.000 14 8 7 9
15 NGO 7.455 4.091 15 42 7 9
16 NBFC 7.273 7.818 16 3 6 23
17 NBFC 7.231 5.154 17 34 6 23
18 NGO 7.182 3.091 18 47 6 23
19 NBFC 7.182 6.909 19 9 nd nd
20 NGO 7.091 4.455 20 38 6 23
21 NBFC 7.077 7.385 21 5 8 1
22 NBFC 7.077 5.846 22 23 nd nd
23 NBFC 7.000 5.222 23 33 5.3 32
24 NBFC 7.000 6.222 24 18 6.6 17
25 NBFC 6.923 7.154 25 7 6.6 17
26 NGO 6.917 4.250 26 40 8 1
27 NBFC 6.917 5.417 27 29 7 9
28 NBFC 6.818 6.818 28 12 nd nd
29 NGO 6.750 5.083 29 35 7 9
30 NGO 6.727 7.364 30 6 8 1
31 NGO 6.667 4.833 31 36 8 1
32 NGO 6.556 6.889 32 11 nd nd
33 NBFC 6.556 8.333 33 1 nd nd
34 NBFC 6.556 6.111 34 21 6 23
35 NBFC 6.545 6.364 35 17 8 1
36 NBFC 6.500 4.500 36 37 7 9
37 NBFC 6.455 7.818 37 4 5.3 32
38 NBFC 6.455 5.909 38 22 8 1
(continued)

104 MICROFINANCE INDIA
The institution top ranked on social content of mission was ranked ninth in socially aligned finan-cial performance (Table 9.3). A comparison of rank-ings showed that the mission statements and their orientation did not translate in to mission aligned financial performance. There were more socially aligned best performers among MFIs with a strong financial content in mission. Strong social missions and aligned financial performance while not contra-indicated, do not seem to go together.
A comparison of top five and bottom five scores in social content of mission and scores attained by those MFIs reveals that the connection between social mission and aligned financial performance
is nebulous. Not one of the top five ranked MFIs achieved top score in aligned financial perfor-mance, whereas an institution ranked lowly on social content of mission (38th rank) has shown financial performance that is clearly socially aligned (rank ‘1’). Further analysis across the data set also shows that the form of organization does not predispose the MFI towards a certain type of performance. The analysis has limitations of data, simplistic assumptions and conclusions that are general. But the study explores the possibility that some aspects of financial performance can and should be used for measuring whether MFIs function in a socially relevant manner and the idea deserves further rigorous examination. The broad conclusions from the study are:
• Themissionstatementshavelimitedguidancevalue for many MFIs.
• Strongsocialcontentinmissiondoesnotneces-sarily imply strategies adopted by the MFI will not be strongly financial.
• MFIsperceivedtobecommercial,respondtothecustomer in a sensitive and responsible manner.
• MFIs need to revisit their mission and designprocesses for examining their performance and its alignment to the mission.
gender in microFinance
In the initial stages of microfinance movement in India, women were at the forefront. Lending to women was thought of as a better means of
classification of mFi
mission-social
orientation score
mission- financial
orientation score
mission- social
orientation rank
mission-financial orienta-
tion rank
Socially
aligned fin. perf. score
Socially
aligned fin. perf. rank
39 NBFC 6.417 6.667 39 14 5 35
40 NBFC 6.364 5.455 40 28 nd nd
41 NGO 6.273 5.636 41 27 7 9
42 NBFC 6.250 5.667 42 26 5 35
43 NBFC 5.909 6.818 43 13 5 35
44 Credit Union/Cooperative 5.727 3.727 44 45 8 1
45 NGO 5.273 6.636 45 15 6.6 17
46 NBFC 5.083 8.000 46 2 5 35
47 NBFC 5.000 6.909 47 10 nd nd
48 NGO 4.833 6.417 48 16 6.6 17
49 Credit Union/Cooperative 4.615 6.154 49 20 nd nd
50 Credit Union/Cooperative 3.111 6.222 50 19 5.3 32
‘nd’ denotes no data
Table 9.3 comparison of scores of social content of mission ranks and financially aligned per-formance ranks
mission-social orientation rank
Socially aligned financial performance rank
1 9
2 23
3 17
4 23
6 23
38 1
39 17
40 35
42 17
44 32
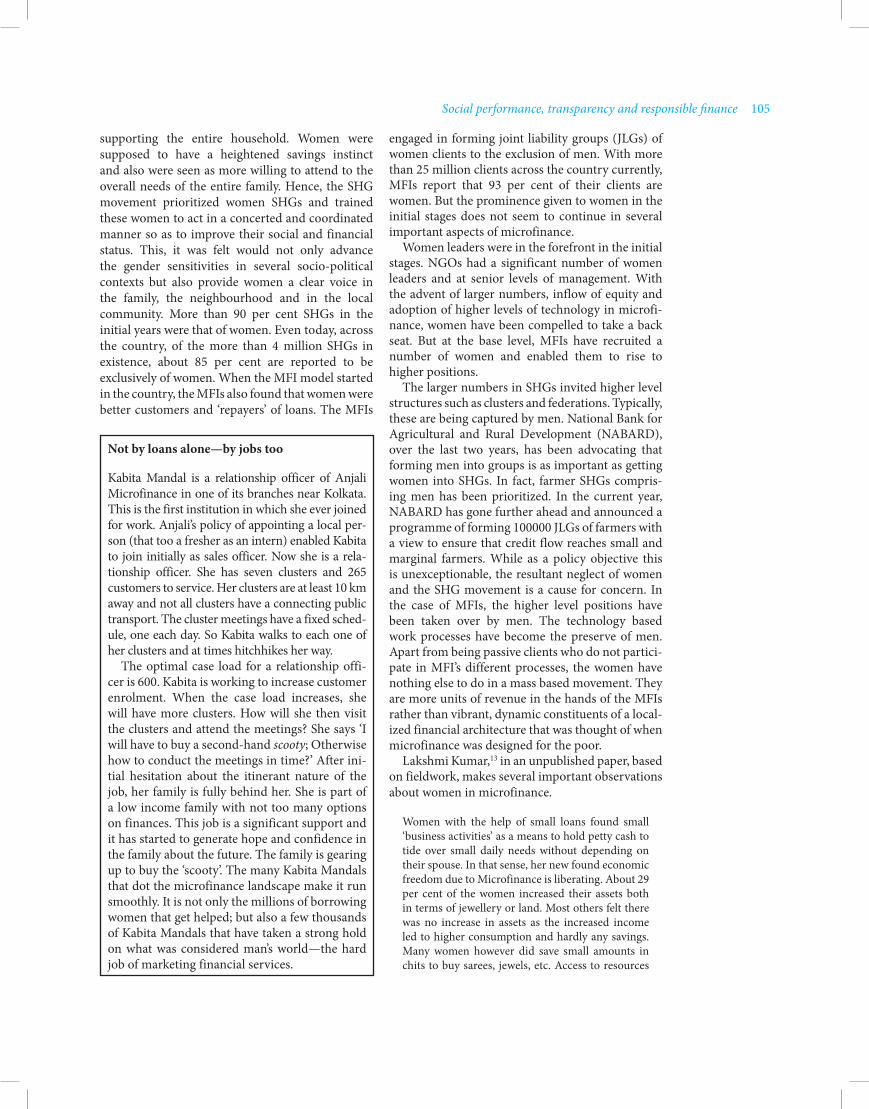
Social performance, transparency and responsible finance 105
supporting the entire household. Women were supposed to have a heightened savings instinct and also were seen as more willing to attend to the overall needs of the entire family. Hence, the SHG movement prioritized women SHGs and trained these women to act in a concerted and coordinated manner so as to improve their social and financial status. This, it was felt would not only advance the gender sensitivities in several socio-political contexts but also provide women a clear voice in the family, the neighbourhood and in the local community. More than 90 per cent SHGs in the initial years were that of women. Even today, across the country, of the more than 4 million SHGs in existence, about 85 per cent are reported to be exclusively of women. When the MFI model started in the country, the MFIs also found that women were better customers and ‘repayers’ of loans. The MFIs
engaged in forming joint liability groups (JLGs) of women clients to the exclusion of men. With more than 25 million clients across the country currently, MFIs report that 93 per cent of their clients are women. But the prominence given to women in the initial stages does not seem to continue in several important aspects of microfinance.
Women leaders were in the forefront in the initial stages. NGOs had a significant number of women leaders and at senior levels of management. With the advent of larger numbers, inflow of equity and adoption of higher levels of technology in microfi-nance, women have been compelled to take a back seat. But at the base level, MFIs have recruited a number of women and enabled them to rise to higher positions.
The larger numbers in SHGs invited higher level structures such as clusters and federations. Typically, these are being captured by men. National Bank for Agricultural and Rural Development (NABARD), over the last two years, has been advocating that forming men into groups is as important as getting women into SHGs. In fact, farmer SHGs compris-ing men has been prioritized. In the current year, NABARD has gone further ahead and announced a programme of forming 100000 JLGs of farmers with a view to ensure that credit flow reaches small and marginal farmers. While as a policy objective this is unexceptionable, the resultant neglect of women and the SHG movement is a cause for concern. In the case of MFIs, the higher level positions have been taken over by men. The technology based work processes have become the preserve of men. Apart from being passive clients who do not partici-pate in MFI’s different processes, the women have nothing else to do in a mass based movement. They are more units of revenue in the hands of the MFIs rather than vibrant, dynamic constituents of a local-ized financial architecture that was thought of when microfinance was designed for the poor.
Lakshmi Kumar,13 in an unpublished paper, based on fieldwork, makes several important observations about women in microfinance.
Women with the help of small loans found small ‘business activities’ as a means to hold petty cash to tide over small daily needs without depending on their spouse. In that sense, her new found economic freedom due to Microfinance is liberating. About 29 per cent of the women increased their assets both in terms of jewellery or land. Most others felt there was no increase in assets as the increased income led to higher consumption and hardly any savings. Many women however did save small amounts in chits to buy sarees, jewels, etc. Access to resources
Not by loans alone—by jobs too
Kabita Mandal is a relationship officer of Anjali Microfinance in one of its branches near Kolkata. This is the first institution in which she ever joined for work. Anjali’s policy of appointing a local per-son (that too a fresher as an intern) enabled Kabita to join initially as sales officer. Now she is a rela-tionship officer. She has seven clusters and 265 customers to service. Her clusters are at least 10 km away and not all clusters have a connecting public transport. The cluster meetings have a fixed sched-ule, one each day. So Kabita walks to each one of her clusters and at times hitchhikes her way.
The optimal case load for a relationship offi-cer is 600. Kabita is working to increase customer enrolment. When the case load increases, she will have more clusters. How will she then visit the clusters and attend the meetings? She says ‘I will have to buy a second-hand scooty; Otherwise how to conduct the meetings in time?’ After ini-tial hesitation about the itinerant nature of the job, her family is fully behind her. She is part of a low income family with not too many options on finances. This job is a significant support and it has started to generate hope and confidence in the family about the future. The family is gearing up to buy the ‘scooty’. The many Kabita Mandals that dot the microfinance landscape make it run smoothly. It is not only the millions of borrowing women that get helped; but also a few thousands of Kabita Mandals that have taken a strong hold on what was considered man’s world—the hard job of marketing financial services.

106 MICROFINANCE INDIA
in terms of land holding in joint name was very low in spite of awareness among these women about their rights. 70 per cent of the women studied were in the confines of their homes; with the support of their spouses and microfinance they got an oppor-tunity to earn and contribute to their family. Their incomes, however meagre, have given them confi-dence and made them feel worthwhile, though with increased physical burden. This new found economic independence does give them a lot of hope. We need however to distinguish economic independence from empowerment. To these women, Microfinance seems a transformation to economic independence. For Microfinance to effectively contribute to women’s em-powerment, or facilitate it at some level, the women involved must perceive themselves as being provided choices, which they never had in the past. Unless and until this mindset is present, we are not likely to find empirically that microfinance leads to women’s em-powerment. Women’s empowerment seems a non-issue to them, hence an illusion, at least as of now.
The point to ponder is whether microfinance has an ideological position on gender empower-ment in the midst of doing business. Some parts of microfinance seem exploitative of the nature of women, especially with regard to recoveries. Fi-nancing of single women and unmarried girls is considered a risk, even when migration of adult males is more common. The question that needs an answer is what kind of product and process changes need to take place to make microfinance more gender sensitive?
iS iT The reSponSibiliTy oF mFis alone?
The initiatives on SPM are targeted at MFIs ap-proaching their customers from a responsible and welfare viewpoint even as they strive to achieve their business goals. MFIs are expected to have a so-cially relevant mission, introduce customer friendly products, appropriate processes, invest in customer education, exercise restraint in pricing and offer services beyond finance to improve livelihoods and quality of life. MFIs are but a part of the sector that seeks to reach out to vulnerable customers. The funders, donors and government have an equally important role to play if MFIs are to deliver what is expected of them. A review of the operations of MFIs on the ground makes it clear that smaller MFIs and Community Owned Microfinance Institutions (COMFI) deliver more social content and are re-sponsible to their customers. Higher level agencies with an objective of maximizing social performance would do well to support these institutions that are already well engaged in appropriate practices. But
small institutions and COMFIs face extraordinary difficulties in accessing mainstream funds. They are increasingly forced to change form to become NBFCs. It is amply evident that an entity becoming NBFC loses its original DNA. Regardless of however hard NBFCs try, investor control and shareholder value considerations would limit their social perfor-mance focus. The contrarian signals that emanate from banks and socially minded investors that push socially committed MFIs first to choose forms that are not natural social entities and then to demand of such institutions that they perform socially are difficult to comprehend. Enabling environment for smaller institutions and COMFIs to get access to bulk funds, equity and capacity building support will bolster SPM in microfinance as much as all other ongoing effort addressed at commercial MFIs. In not providing a good environment to smaller MFIs and those in non-profit forms, the funders do not practice what they preach. In respect of price of loans, training of staff on SPM, improved loan products and practices, funders should also lead the way. Good practices emerge from good examples. Funders and donors should introduce changes in the manner they deal with the MFIs and then de-mand of MFIs that they behave similarly towards their customers.
In sum, the bottom of the pyramid customers are not only vulnerable but also lack the skills and re-sources to negotiate markets. Despite all attempts at literacy and education, they will find it hard to ac-quire the kind of competence required to contract loans and savings with financial institutions that come with highly advanced skills. It is incumbent on these professional institutions to deliver the best of services on conditions favourable to the custom-er without being asked either by the customer or by the external institutions. Responsible finance has meaning only when these acts that are in the cus-tomers’ interest are performed voluntarily without being asked. If this has to be externally stipulated, enforced and monitored on a long term, then the meaning of responsible finance is lost especially when the institutional mandate stipulates that they deal exclusively with vulnerable people for their betterment.
noTeS 1. Microfinance Institutions Network is an industry
association of NBFCs in Microfinance, set up last year, currently having 39 members.
2. Sadhan is a network of MFIs, MFOs and other insti-tutions working in microfinance sector. It had 230 members —financial and non-financial entities.
Social performance, transparency and responsible finance 107
report carried out the survey of respondents and provided the data on social and financial orientation scores, providing the basis for the further analysis contained in the report.
12. The assumptions were that high return-on-assets and high yields are not socially aligned as they cause distress to the customer. Though financial sector return-on-assets hovers around 1 per cent, looking to the peculiarities of the Microfinance sector return-on-assets of 4 per cent was deemed the threshold for an institution to be considered as socially aligned. Return-on-assets in excess of 4, therefore, was not considered ‘social’ for this scor-ing. Similarly, yield in excess of 30 per cent was not deemed ‘social’. Disclosure of interest rates to borrowers was deemed social. If MFIs had declin-ing yields when their costs declined, the action was deemed social. Where yields increased despite a de-crease in operating costs or where cost savings were not reflected in declining yields, the same was not deemed ‘social’.
13. ‘The Illusion of Women Empowerment in Micro-finance: A case study’, Lakshmi Kumar, Faculty, IFMR.
3. Alok Prasad, CEO MFIN. 4. ‘Access to Finance in Andhra Pradesh’, CMF-IFMR
for CMR-BIRD funded by NABARD. 5. ‘Access to finance in Andhra Pradesh, 2010’, CMF-
IFMR for CMR-BIRD funded by NABARD. 6. Microfinance Transparency is a non-profit company
registered in the USA, with a mandate to promote transparency in pricing across the world. It has al-ready published transparent prices for four coun-tries and is actively working with 20 more countries (including India) for publishing transparent prices in public domain.
7. ‘Microfinance Synergies and Trade-offs: Social ver-sus Financial Performance Outcomes in 2008’, Adri-an Gonzalez, MIX Data Brief no 7.
8. Popular MIS software from the Grameen stable. 9. Social Performance Task Force (SPTF) is an interna-
tional coalition of institutions engaged in promot-ing and facilitating of social performance content in microfinance programmes across the world.
10. ‘Microfinance Synergies and Trade-offs: Social ver-sus Financial Performance Outcomes in 2008’, Adri-an Gonzalez, MIX Data Brief no 7.
11. Joshua Wan, intern in CMF-IFMR guided by Justin Oliver, Shreyas Gopinath and the author of this

10Chapter
Financial inclusion—reasons for hope
The Reserve Bank of India (RBI) took the plati-num jubilee year of its existence as a critical point of departure for intensifying financial inclusion ac-tivities across the banking sector. RBI had reasons to be disappointed with the level of effort relating to inclusion agenda carried out by the banks. The policy pronouncements that had been made over the last five years in introducing products in the form of no-frills-accounts, general credit cards, changes in processes such as in relaxed know-your-customer (KYC) norms and introducing new mechanisms such as the business correspondents (BCs) and business facilitators had still not resulted in substantial progress. RBI had not been able to make banks think of inclusion as a business exer-cise. With the very best efforts of the government and RBI, financial inclusion has at best been viewed as a social mandate or even less a corporate social responsibility of the banking system. The response of most banks so far has been to clock additional numbers in the no-frills-accounts and little else. Some banks had hired the services of business fa-cilitators and BCs and many did not venture into this outsourcing arrangement. Committing their own staff to open new accounts had its own limita-tions. As already explained in the last year’s report, the network and staff limitations and the inability to decide upon an appropriate technology solution meant that inclusion of numbers would be relatively small compared to the requirements and the depth of inclusion shallow compared to the requirement of customers.
The financial institutions count the accounts and not unique account holders. There is considerable overlap in the accounts, especially in banks and post-offices. The overlap in urban areas in bank ac-counts could be as high as 100 per cent, meaning that each customer on an average may be holding
two accounts with a bank if not more. The case of post-offices also is similar, though the overlap could be less. Recent studies indicate that among micro-finance institutions (MFIs) and self-help groups (SHGs) also there is overlap on account of multiple memberships. The overlap across institutions such as bank account holder having accounts with a post-office has also to be factored in to the inclusion arithmetic to estimate the excluded.
As of March 2010, 50.6 million no-frills-accounts had been opened by banks and the balances in these accounts were of the order of ` 53.86 billion. The banks had also issued 3.5 million general credit cards under which credit of ` 6.35 billion had been availed. 0.18 million overdraft accounts had also been sanctioned along with the concerned no-frills-account for a value of ` 0.28 billion. The sum and substance of last five years’ efforts is reflected in these numbers. Whereas studies mentioned that the number to be included is more than three times of what has been achieved.
One of the problems that limits inclusion has been the insistence of both government and RBI that banks alone could validly provide access to financial services. A comparison with what has been achieved by some of the alternative insti-tutions shows that the banks’ performance gets dwarfed. The post-office had 78.04 million nor-mal savings accounts on its books at end March 2009, 16.24 million more accounts for workers receiving payments under the National Rural Employment Guarantee Scheme (NREGS). The primary agricultural credit societies had a mem-bership of 132.3 million in the rural hinterland. Of these, the small and vulnerable members and the disadvantaged people were of the order of 85.6 million. The post-office savings deposits amounted to ` 22689 billion and the deposits mobilized by
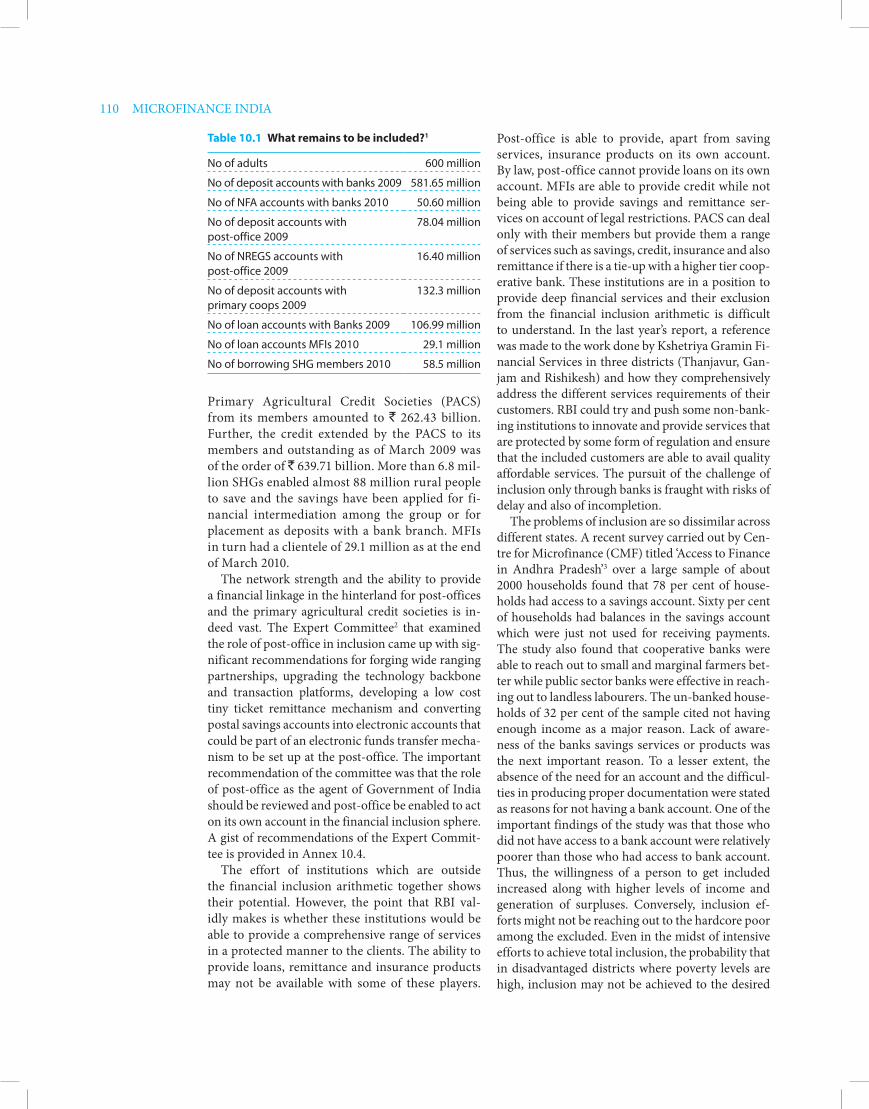
110 MICROFINANCE INDIA
Post-office is able to provide, apart from saving services, insurance products on its own account. By law, post-office cannot provide loans on its own account. MFIs are able to provide credit while not being able to provide savings and remittance ser-vices on account of legal restrictions. PACS can deal only with their members but provide them a range of services such as savings, credit, insurance and also remittance if there is a tie-up with a higher tier coop-erative bank. These institutions are in a position to provide deep financial services and their exclusion from the financial inclusion arithmetic is difficult to understand. In the last year’s report, a reference was made to the work done by Kshetriya Gramin Fi-nancial Services in three districts (Thanjavur, Gan-jam and Rishikesh) and how they comprehensively address the different services requirements of their customers. RBI could try and push some non-bank-ing institutions to innovate and provide services that are protected by some form of regulation and ensure that the included customers are able to avail quality affordable services. The pursuit of the challenge of inclusion only through banks is fraught with risks of delay and also of incompletion.
The problems of inclusion are so dissimilar across different states. A recent survey carried out by Cen-tre for Microfinance (CMF) titled ‘Access to Finance in Andhra Pradesh’3 over a large sample of about 2000 households found that 78 per cent of house-holds had access to a savings account. Sixty per cent of households had balances in the savings account which were just not used for receiving payments. The study also found that cooperative banks were able to reach out to small and marginal farmers bet-ter while public sector banks were effective in reach-ing out to landless labourers. The un-banked house-holds of 32 per cent of the sample cited not having enough income as a major reason. Lack of aware-ness of the banks savings services or products was the next important reason. To a lesser extent, the absence of the need for an account and the difficul-ties in producing proper documentation were stated as reasons for not having a bank account. One of the important findings of the study was that those who did not have access to a bank account were relatively poorer than those who had access to bank account. Thus, the willingness of a person to get included increased along with higher levels of income and generation of surpluses. Conversely, inclusion ef-forts might not be reaching out to the hardcore poor among the excluded. Even in the midst of intensive efforts to achieve total inclusion, the probability that in disadvantaged districts where poverty levels are high, inclusion may not be achieved to the desired
Primary Agricultural Credit Societies (PACS) from its members amounted to ` 262.43 billion. Further, the credit extended by the PACS to its members and outstanding as of March 2009 was of the order of ` 639.71 billion. More than 6.8 mil-lion SHGs enabled almost 88 million rural people to save and the savings have been applied for fi-nancial intermediation among the group or for placement as deposits with a bank branch. MFIs in turn had a clientele of 29.1 million as at the end of March 2010.
The network strength and the ability to provide a financial linkage in the hinterland for post-offices and the primary agricultural credit societies is in-deed vast. The Expert Committee2 that examined the role of post-office in inclusion came up with sig-nificant recommendations for forging wide ranging partnerships, upgrading the technology backbone and transaction platforms, developing a low cost tiny ticket remittance mechanism and converting postal savings accounts into electronic accounts that could be part of an electronic funds transfer mecha-nism to be set up at the post-office. The important recommendation of the committee was that the role of post-office as the agent of Government of India should be reviewed and post-office be enabled to act on its own account in the financial inclusion sphere. A gist of recommendations of the Expert Commit-tee is provided in Annex 10.4.
The effort of institutions which are outside the financial inclusion arithmetic together shows their potential. However, the point that RBI val-idly makes is whether these institutions would be able to provide a comprehensive range of services in a protected manner to the clients. The ability to provide loans, remittance and insurance products may not be available with some of these players.
Table 10.1 What remains to be included?1
No of adults 600 million
No of deposit accounts with banks 2009 581.65 million
No of NFA accounts with banks 2010 50.60 million
No of deposit accounts with post-office 2009
78.04 million
No of NREGS accounts with post-office 2009
16.40 million
No of deposit accounts with primary coops 2009
132.3 million
No of loan accounts with Banks 2009 106.99 million
No of loan accounts MFIs 2010 29.1 million
No of borrowing SHG members 2010 58.5 million
Financial inclusion—reasons for hope 111
extent. An interesting fact that came to light in the survey was that 51 per cent of the rural households had mobile phones. Of those households that did not have a savings account, 36 per cent had a mobile phone. The interesting hypothesis that this engen-ders is that if saving services are offered through the mobile phones, the inclusion levels in such locations might increase.
RegulaToRy and policy iniTiaTives
In a bid to expand the rural branch network, which is a critical constraint even for a BC based model of inclusion, RBI had relaxed the branch licens-ing guidelines.4 Banks have been allowed to open branches in rural and semi-urban centres (centres with population of less than 50000) without the pri-or permission of RBI. In November 2009, as a fol-low-up of the High Power Committee recommen-dations, RBI had advised5 the District Consultative Committees (DCCs) to prepare financial inclusion plan for banking services coverage of under-banked large villages. The instructions issued by RBI state:
constitute a Sub-Committee of the District Consul-tative Committees (DCCs) to draw up a roadmap by March 2010 to provide banking services through a banking outlet in every village having a population of over 2,000, by March 2011. Such banking services may not necessarily be extended through a brick and mortar branch but can be provided through any of the various forms of ICT- based models, includ-ing through BCs.
A monitoring and review mechanism may be in-stituted by DCCs to periodically assess and evaluate the progress made in achieving the roadmap. This may be taken up for review in each meeting of the DCC. It is advised that a sub-committee of DCC may be formed which may meet on monthly basis and arrange to furnish progress. In accordance with the guidelines, each district in the country had finalized a financial inclusion plan. The under-banked villages have been allocated among banks operating in the district of establishing the financial services network. The plans show that some of the villages with higher potential will be covered through a new rural branch and others will be covered through a BC. For exam-ple, Indian Bank6 plans to cover 1294 such villages across the country through BCs. Since the deadline of March 2011 is not too far off, banks would try to engage BCs rapidly for the purpose. One of the im-pediments to contracting the services of competent institutions is the method of selection. Banks are
expected to follow Central Vigilance Commission’s (CVC) guidelines on procurement, and invite par-ties to bid for providing the services of a BC (treating the selection of BCs as procurement of some routine outsourced job). This would result in the lowest bid-ders being hired regardless of their competence and background. The BCs are intended to replace staff of the banks. Staff of the bank is not hired through a bidding process. An appraisal of interested persons takes place based on which the best in terms of will-ingness and competence are chosen. Hiring of BCs should also follow such a process of selection.
Having dealt with major constraint of network presence, RBI attended to the issues relating to where the new BCs will come from. During the year, RBI had made incremental changes to the guidelines on use of BCs. (See Annex 10.1 for the circular issued on the subject). Based on the report of the internal committee that went into the BC arrangement, RBI increased the types of eligible entities to be hired as BCs and included for-profit small individual units such as kirana shops, individual owning petrol pumps and so on. The distance between the bank branch and the location of operations of BCs in ru-ral areas was increased to 30 km, with a further pro-vision for relaxing the same by gaining approval of the district level consultative committee of bankers. In a further move, RBI also allowed banks to col-lect service charges from customers who were being served through BCs in order to make the payments to be made to the BCs. The only stipulation was that the charges should be reasonable and approved by the board of banks. While this was a path breaking initiative from RBI, the response from banks had been muted. Barring ICICI Bank, which had taken a decision in a recent board meeting, no other banks has announced the schedule of charges. From 1 July 2010, one remaining impediment for providing credit to vulnerable customers has been removed. Under the new dispensation of the base rate mecha-nism, RBI has removed the cap7 on interest rates for small loans of up to ` 200000, which earlier was to have been limited to prime lending rate of the bank. The freedom to price small loans according to the commercial judgement of the banks should enable a greater flow of credit to the newly included clients.
The mobile banking guidelines had been refined with transaction caps raised. Banks are permitted to offer this service to their customers subject to (i) a daily cap of ` 50000 per customer for both funds transfer and transactions involving purchase of goods/services, (ii) transactions up to ` 1000 can be facilitated by banks without end-to-end encryp-tion, and (iii) banks are permitted to provide fund

112 MICROFINANCE INDIA
to breakeven and earn their revenues. They bring in managerial expertise as also the organizational abil-ity to build the network and operate the business through the network. They have systems of monitor-ing and control that will ensure that discipline and uniform quality of work is rendered throughout the network. Corporates are also in a position to pro-vide skills and equipment required to carry out the kind of business they are in. Finally, corporates look to the future and ensure that they invest in business continuity, even in case some of the retail agents vol-untarily or involuntarily cease to do business. The need to build and sustain their reputation will drive the corporates towards ensuring that the customer is served well. On account of these reasons, RBI’s recent move to look at the feasibility of using corpo-rates as BCs must be welcomed. However, there are contrary views on using corporate as BCs. Conflict of interest, bundling of services, emergence of local monopolies, mis-selling of products, breach of con-fidentiality of customer information and erosion of customer protection are some of the larger concerns in using corporates as BCs.
Dr S.L. Shetty8 comments:
Such an engagement of corporate bodies for serv-ing as BCs would tantamount to a backdoor entry of non-banking companies into banking business, which is against the basic principles underlying banking legislations in the country. Economic history of this country has upheld the validity of these basic principles. Unlike many other coun-tries, this country has a long history of a large number of grassroots level institutions—village cooperatives, postal authorities, etc.,—which can be galvanized for supplementing the activities of organized banking in reaching the unbanked sec-tions of the society. For want of sincerity on the part of organized banking, corporate bodies are being roped in to achieve financial inclusion in the name of the poor. Corporate bodies will never find it prof-itable to render banking services without extracting a surplus from the system and that would be invari-ably passed on as a burden on the poor.
The need is to ensure that the banks and corpo-rates select each other to partner and also agree upon the rules of engagement. Issues such as sharing of investment cost, the kind of remuneration that will be required and how the network will be controlled are best left to the bank and the BC to decide. RBI’s overarching concern relating to customer protection and systemic integrity should be conveyed to the bank and the banks made responsible for performance on all fronts towards the customers and also towards the
transfer services which facilitate transfer of funds from the accounts of their customers for delivery in cash to the recipients up to ` 5000 per transac-tion and a total value of ` 25000 per month per customer. With the impending expansion of BC networks, remittances could get a fillip through mechanisms that use mobile technology.
The reasons for the slow enrolment of BCs by banks require analysis. The viability of a BC agent, the BC and the bank seems uncertain presently. Viability is a function of how the business is struc-tured, range of services offered and technology investments required. Marketing by BC of bank-ing services could bring in higher footfalls, but the types of BCs so far allowed do not have a marketing background. The remuneration in some arrange-ments is front loaded; in such conditions, the BC has little interest after initial customer acquisition. The focus is on continued enrolment of customers and not much attention to serving the customers. Banks are learning to structure compensation in such a manner as to secure business in the acquired accounts. A combination of transaction and volume based remunerations are being worked out and im-plemented. Outsourcing core jobs is a new experi-ence to many banks, especially in the public sector which makes for slow progress. Not-for-profits are unable to bring in the financial organizational and managerial competencies required to run a large operation where millions of clients have to be ac-quired and their transactions put through in a man-ner that is consistent with the discipline of the fi-nancial sector. While banks might be able to take on retired officials and individual kirana shops as BCs, monitoring a number of such small units even with sound technological base is bound to be challeng-ing. Hence, more organized players in the market should be invited to partner banks in rolling out the inclusion effort.
The recognition that thousands of villages pro-posed to be covered by BCs cannot be hired in bits and pieces has perhaps influenced RBI to come out with an alternative. If BCs could be part of a net-work that had some pre-existing discipline of finan-cial and managerial control, then banks may find such networks easier to deal with. RBI had recently put out a discussion paper on ‘Use of a retail net-work of for profit corporates as business correspon-dents.’ This discussion paper is a significant shift in the stance of RBI which, in its original guidelines for BCs, had ruled out for-profit entities being part of the BC framework. The corporate entities have the capacity to invest and also the patience to wait
Financial inclusion—reasons for hope 113
mingling of transactions of the MFI and the bank, even though both transactions get done in the same location. Further, the possibility that there could be a conflict of interest between marketing of bank’s loan and marketing of MFI’s own loan needs to be addressed. MFIs typically give small loans whereas banks are in a position to give larger loans as well. A threshold limit could be set beyond which the MFI must send the loan proposals to the bank for sanction. Below the threshold limit, the MFI could provide loans on its own account. In case it is un-able to do so, loans below the threshold limit can also be referred to the bank for sanction. The sepa-ration of the types of loans based on the size of the loan limit would deal with conflicts of interest in the marketing of bank loan. Overall, the network that is built up by the MFIs could play a useful role in mobilizing savings of people. The sector fervently hopes that at the end of the consultation process on the discussion paper issued by RBI, the partnership of banks and corporates are approved rapidly and allowed to scale up efforts.
Some of the models that emerge in corporate partnership would require that banks make invest-ments in their own human resources so that they are able to monitor and supervise the BC networks. So far the monitoring of BCs had been left to bank branches. In some cases, the bank branches are un-cooperative towards the business brought in by the BCs. There have been cases of delays in opening ac-counts brought in by BCs, verification of KYC and in general a step-motherly attitude towards BC gen-erated business. Within the bank, there should be a realization that a customer of a bank whether com-ing through a BC or directly needs to be served well. In order to ensure that the BCs do not face obstacles in achieving their business objective and building volumes for the bank, the banks need to have rela-tionship managers who interact with BCs. Without a mechanism that will manage the BC network, banks would be hard put to make financial inclusion ef-forts succeed. The risks that are integral to branch-less banking arrangements, especially with BCs as the mechanism, should be mitigated with adequate investments in dedicated staff who understand how these networks function and how to monitor their performance, so that client protection levels are kept high. They should facilitate the interface between the bank and the BC. State Bank of India (SBI) has realized this need and has already started hiring consultants on contract for the purpose of establish-ing this interface between BC network and the bank and also supervising their performance.
regulator. The nature of the arrangement between the bank and the corporate would be a business partnership. A partnership is based on negotiation and should not be treated as procurement. Earlier in the chapter, the move on part of public sector banks to go in for a tendering process (least cost bid as norm for selection) to select the least cost bidder as BC had been described. This process of selection, if insisted upon, would bring in ill-suited and non-serious players, reducing a promising alternative to a parody.
The use of commercial MFIs as BCs has also been discussed in the paper issued by RBI. While MFIs carry out one leg of financial intermediation, that is, providing loans whether they would be suitable vehicles of mobilizing savings is a question that needs to be analyzed. Presently, most of the MFIs have a model by which itinerant field officers visit groups of people once in a week for about half an hour. During this time repayment of loans by cus-tomers and disbursal of fresh loans by the field offi-cer takes place. The documentation relating thereto is also carried out. Whether this kind of presence for half an hour in a week covering 50 or so peo-ple in every cluster would be a satisfactory means of providing saving services has to be considered. More than 75 per cent of the 100000+ staff of MFIs comprises field officers. The operational risks of so many staff collecting unknown sums of money from customers are not easily manageable. MFIs cur-rently know the maximum sums of money the field officer would be handling each day; the collection amount for the day is known through the demand lists and the fresh disbursements are initiated from the MFI. In case of savings, MFI will neither know nor be able to project how many people will pay in or withdraw money and how much. End of the day verification and tallying would rely on self-report by staff. Physical verification would be possible once in a while and might prove expensive. Using field staff to offer BC savings services during their short visits does not seem a viable option. MFIs have a huge network. They have a few thousand branches in different parts of the country. In order to make best use of their network presence and the staff, it might be worthwhile to consider making the branches of MFIs as the points at which saving services may be offered. Every branch should be provided with a point of sale (POS) terminal which will be exclusively used for putting through trans-actions on behalf of the bank. This terminal would not have any connectivity with any other business of the MFI. This would ensure that there would be no
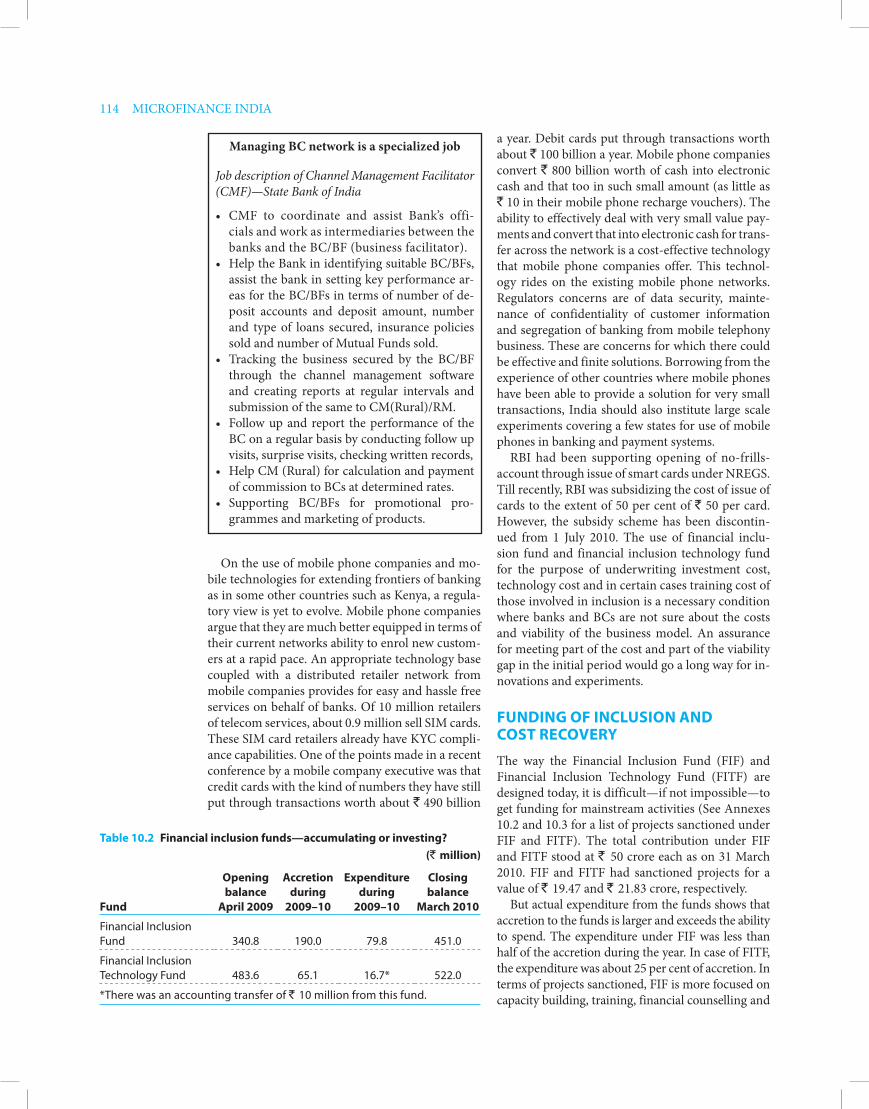
114 MICROFINANCE INDIA
a year. Debit cards put through transactions worth about ` 100 billion a year. Mobile phone companies convert ` 800 billion worth of cash into electronic cash and that too in such small amount (as little as ` 10 in their mobile phone recharge vouchers). The ability to effectively deal with very small value pay-ments and convert that into electronic cash for trans-fer across the network is a cost-effective technology that mobile phone companies offer. This technol-ogy rides on the existing mobile phone networks. Regulators concerns are of data security, mainte-nance of confidentiality of customer information and segregation of banking from mobile telephony business. These are concerns for which there could be effective and finite solutions. Borrowing from the experience of other countries where mobile phones have been able to provide a solution for very small transactions, India should also institute large scale experiments covering a few states for use of mobile phones in banking and payment systems.
RBI had been supporting opening of no-frills-account through issue of smart cards under NREGS. Till recently, RBI was subsidizing the cost of issue of cards to the extent of 50 per cent of ` 50 per card. However, the subsidy scheme has been discontin-ued from 1 July 2010. The use of financial inclu-sion fund and financial inclusion technology fund for the purpose of underwriting investment cost, technology cost and in certain cases training cost of those involved in inclusion is a necessary condition where banks and BCs are not sure about the costs and viability of the business model. An assurance for meeting part of the cost and part of the viability gap in the initial period would go a long way for in-novations and experiments.
Funding oF inclusion and cosT RecoveRy
The way the Financial Inclusion Fund (FIF) and Financial Inclusion Technology Fund (FITF) are designed today, it is difficult—if not impossible—to get funding for mainstream activities (See Annexes 10.2 and 10.3 for a list of projects sanctioned under FIF and FITF). The total contribution under FIF and FITF stood at ` 50 crore each as on 31 March 2010. FIF and FITF had sanctioned projects for a value of ` 19.47 and ` 21.83 crore, respectively.
But actual expenditure from the funds shows that accretion to the funds is larger and exceeds the ability to spend. The expenditure under FIF was less than half of the accretion during the year. In case of FITF, the expenditure was about 25 per cent of accretion. In terms of projects sanctioned, FIF is more focused on capacity building, training, financial counselling and
On the use of mobile phone companies and mo-bile technologies for extending frontiers of banking as in some other countries such as Kenya, a regula-tory view is yet to evolve. Mobile phone companies argue that they are much better equipped in terms of their current networks ability to enrol new custom-ers at a rapid pace. An appropriate technology base coupled with a distributed retailer network from mobile companies provides for easy and hassle free services on behalf of banks. Of 10 million retailers of telecom services, about 0.9 million sell SIM cards. These SIM card retailers already have KYC compli-ance capabilities. One of the points made in a recent conference by a mobile company executive was that credit cards with the kind of numbers they have still put through transactions worth about ` 490 billion
Managing BC network is a specialized job
Job description of Channel Management Facilitator (CMF)—State Bank of India
• CMF to coordinate and assist Bank’s offi-cials and work as intermediaries between the banks and the BC/BF (business facilitator).
• HelptheBankinidentifyingsuitableBC/BFs,assist the bank in setting key performance ar-eas for the BC/BFs in terms of number of de-posit accounts and deposit amount, number and type of loans secured, insurance policies sold and number of Mutual Funds sold.
• Tracking the business secured by the BC/BFthrough the channel management software and creating reports at regular intervals and submission of the same to CM(Rural)/RM.
• Followupandreport theperformanceof theBC on a regular basis by conducting follow up visits, surprise visits, checking written records,
• HelpCM(Rural)forcalculationandpaymentof commission to BCs at determined rates.
• Supporting BC/BFs for promotional pro-grammes and marketing of products.
Table 10.2 Financial inclusion funds—accumulating or investing? (` million)
Fund
opening balance
april 2009
accretion during
2009–10
expenditure during
2009–10
closing balance
March 2010
Financial Inclusion Fund 340.8 190.0 79.8 451.0
Financial Inclusion Technology Fund 483.6 65.1 16.7* 522.0
*There was an accounting transfer of ` 10 million from this fund.
Financial inclusion—reasons for hope 115
charges can make banks willingly come forward and open bank accounts in such cases.
The business model of BCs is hazy. Cost recovery has to take place at three levels: (i) BC agent level, (ii) network manager level if there is a separate man-ager, and (iii) bank level. Unless total costs of the system comprising all those involved in financial service delivery are recovered, the arrangement will not work. Within the chain, all levels recover costs, otherwise there would be disruptions caused by at-trition. Banks are to bear costs in the initial stage and bring customers in. But the compensation packages of banks are offering thin incentives that might not generate active interest from competent agents.
There are as many as seven streams of cost that have to be reckoned in the BC model, according to MicroSave.9 These are fee payable to agents, market-ing and promotion costs, channel management ex-penses, processing transaction costs, cost of working and liquidity, technology investments and overhead costs. The extent of costs would vary depending on the model, nature of relationship and technology in use. There are two approaches to paying a BC for e-services. The first is to pay per transaction, per customer, and so on. The other approach is to pay a fee ad valorem to business volumes generated. Both have their merits and demerits, and usually a com-bination of the two models would be used. Based on a study of three different types of BCs, MicroSave came to the following conclusions:
• Thetransaction-basedmodeltiesBCearningsdirectly to work activities performed. A com-mission of 0.5 per cent on deposits and with-drawals discourages transactions of less than about ` 150 to ` 200. Sadly, recurring deposits of < ` 100, which might appeal to poor savers, could bankrupt the BC as the cost of service delivery exceeds the income.
• Thebalance-basedmodeltiesBCearningstotheoverall balance/health of their clients’ accounts. While this creates incentives for BCs to invest in client education, balances may be very small at first, even if transactions are frequent. This makes the path to sustainability slower and less predictable.
• RevenuesearnedbytheBCsfromtheiragents(li-censing and franchise fees, security deposits, and so on) have no material impact on the profitabil-ity of the business models studied.
• Client enrolment fees are valuable but supple-mentary.
The models observed in the field places the last person in the field under pressure. The agent of ex-isting BCs such as FINO carry most of the risks and investments on themselves and the compensation
other soft interventions. Four projects that actually target enrolment of customers had been sanctioned out of a total of 14. National funds of this type are ill-equipped to sanction and monitor small projects in different parts of the country. While small grants are critical for innovative pilots, activities on a large scale should be supported for achieving impact. Viability gap funding for a variety of institutions could be offered through a normative framework that provides a fixed sum per customer acquired in under-banked locations with back loading of part of funding for accounts that had been active over three years. The fund should seek to achieve a large foot-print in its projects. The FITF had sanctioned 18 projects of which many were for card based custom-er acquisition projects. A biometric mobile phone based project and implementation of core banking solution for a cooperative bank in northeast were among the non-traditional initiatives supported. FITF too should make investment in technology easier through a norm based support based on the technology and number of customers that would be acquired. A clearer articulation of the objectives of both the funds is necessary. A timeline should also be drawn up for completing investments out of the funds as otherwise; the funds might remain unspent even after the inclusion objective is achieved.
Apart from the central government and RBI, state governments also have a role to pay in the in-clusion sphere. Some states had taken the initiative to support issuance of smart card for NREGS, no-frills-accounts and distribution of insurance prod-ucts. Apart from taking proactive steps to acceler-ate the pace of inclusion, state governments have a responsibility to desist from actions that adversely impact players in the sector. Some of the state gov-ernments are quite keen to make welfare payments of several types through bank accounts. They have been instrumental in making the beneficiaries and recipients of payments to open bank accounts and, at the same time, coordinated the opening of ac-counts with the banks concerned. Small payments to a large number of people once credited into the account entail transaction costs for banks. Since these accounts do not carry any significant balance, banks are unable to earn any revenue from the float funds. To compensate the banks for the transaction costs, some of the states have been providing a fee for handling such accounts. Recognizing that this is a very essential service that enables corruption-free and leakage-free transfer of funds to the persons con-cerned and also that the state avoids costs, all govern-ment payments through bank accounts to vulnerable sections of people should provide transaction costs to banks. Reimbursement of reasonable service
116 MICROFINANCE INDIA
The banks and higher tier institutions seem to be absolving themselves of the responsibility of inclu-sion after planning, and placing the burden of imple-mentation on the small agent in the field without a realistic assessment of the compensation needed.
The notion that BC models would breakeven within short periods is not well founded. Since a new network with technology based architecture is being built, there would be significant costs that need to be amortized and recovered over a period of time. Investments in the inclusion space have to be seen as project investments and treated as such within the business for taking appropriate decisions. The strate-gizing and planning that follow the investment mod-el would target volumes, costs and earnings. Tech-nology costs should be minimized and the inclusion programme should not be a victim to the ambitions of technology. Smart, cost-effective technologies that do not demand too much training of the agents and customers should be brought in. Patient capital is needed in the inclusion sphere. Inclusion business can make surpluses only when customers are able to access and use a range of services.
unique idenTiFicaTion nuMbeR and inclusion
The Unique Identification (UID) project is gather-ing pace with registrars for issue of UID numbers being enrolled. The expectations from UID are many. The expectations from the financial sector are that UID will solve all problems relating to KYC for the customer. UID will identify the customer, the place of residence and enable authentication through biometrics. Banks are required to follow customer identification procedures while opening new accounts, to reduce the risk of fraud and money laundering. The know-your-resident (KYR) verifi-cation process carried out before issue of UID will meet the standards of verification set by banks for KYC for opening accounts. The strong authentica-tion that the UID will offer, combined with its KYR standards, can remove the need for such individual KYC by banks for basic, no-frills-accounts and sig-nificantly bring down KYC costs for banks. The UID’s clear authentication and verification process-es will allow banks to network with village-based BCs such as SHGs and kirana stores. Customers will be able to withdraw money and make deposits at the local BC. Multiple BCs at the local level will also give customers a choice of BCs. This will make customers, particularly in villages, less vulnerable to local power structures, and lower the risk of being exploited by BCs. The UID will mitigate the high customer acquisition costs, high transaction costs
does not seem adequate enough. The field agent has to provide a security deposit, cover the cost of the POS terminal, attend to cash management and meet her travel and incidental costs even when the entire range of services are not made available through her.
Who will be willing to work as BC staff?
The FINO BC model10 offers no-frills-account services involving savings and withdrawals. Each Customer Service Point (CSP) at the client level reports to the Block Coordinator, who is in turn, monitored by a District Coordinator. The CSP is a contract employee of FINO Fintech foundation, who is a local resident, and is given a fixed remu-neration of ` 750 plus a commission of 50 paise on every transaction irrespective of the amount transacted. These CSPs work an average of four hours per day and have this job as either the only source of income or as a part-time business. On an average, each CSP handles around 700–800 clients in her/his service area. Each CSP is provided with a POS machine for transactions and has to deposit an initial amount of ` 10000 with FINO Fintech foundation (` 5000 for the POS and ` 5000 for the CSP) as guarantee money. A transaction limit of ` 5000 is imposed on the CSP and once the limit is breached, the POS machine of the CSP gets blocked. It would then require a visit by the Block Coordinator to collect the cash and unlock the machine to carry out further transactions.
The FINO CSPs found it difficult to sustain the business, as the income obtained from the present BC model was difficult to cover the costs incurred. The door-to-door services provided by the CSPs added to their cost. Apart from this, only 30 per cent to 40 per cent of the clients were active which further reduced the commissions for the CSP. However, it was feasible for CSPs who ran kirana stores, as majority of their clients visited the store as part of their daily chores and also made transactions with the CSP; he made fewer doorstep services than other CSPs who were housewives or working in other companies. On interactions with the clients, the team could infer that the transaction limits imposed on the CSP was a major hindrance to the clients in uti-lizing these services efficiently and frequently. Many a times, any client who wants to withdraw or deposit amount that is greater than the limit would have to inform the CSP prior hand. Thus, it would usually take around three days to com-plete the transaction, consequently undermining the efficiency of the system.
Financial inclusion—reasons for hope 117
and fixed IT costs that we now face in bringing bank accounts to the poor.
The UID’s authentication processes will allow banks to verify poor residents both in person and remotely. Rural residents will be able to transact electronically with each other as well as with indi-viduals and firms outside the village. This will re-duce their dependence on cash, and lower costs for transactions.
insTiTuTions in The Field WoRking on inclusion
In the midst of debates on what will work and what will not as also their comparative costs and benefits, some banks have gone ahead with their plans for making intensive efforts. Since branch-less banking with agents is uncharted territory for most Indian banks, experimentation and testing became a requirement. SBI, the largest public sec-tor bank and HDFC Bank, a leading private sector bank, have taken significant measures in the inclu-sion sphere.
UIDAI’s micro-payment solution11
A stable and secure channel for the delivery of micro-payments will be central to successful, widespread financial access. A UID-enabled Bank Account (UEBA) linked to a UID number can provide this chan-nel. A customer can access their UEBA through a BC operating a handheld microATM device. A UEBA provides four basic banking features:
1. Convenient store of cash for savings, with a facility for making electronic deposits and withdrawals in micro-amounts.
2. Convenient way to make payments.3. Fast channel for sending and receiving remittances.4. Balance queries, and provides a history of transactions.
Transactions on the UEBA function essentially as a prepaid system, similar to that used by mobile operators. This enables local BCs such as SHGs and kirana shops to offer basic banking services at low risk to the bank. The customers are already familiar with this model and comfortable with paying for talk-time, an electronic good. The BC starts out by depositing a certain amount with the banking institu-tion. This ‘prepaid balance’ paid up by the BC to the bank changes with every transaction the BC makes. It decreases when a customer makes a deposit transaction, when some part of it is transferred to the customer’s account and increases when a customer withdraws money.
When the customer is making a deposit, she pays physical cash to the BC, who subsequently makes an electronic transfer from the BC account to the customer account. When making a withdrawal, the electronic transfer is made from the customer account to the BC account, and the BC hands out physical cash to the customer.
This transfer from physical cash to its electronic equivalent has precedence across India—including villages—in the purchase of mobile prepaid cards. The bulk of mobile subscribers have prepaid subscrip-tions, and each time a customer purchases talk-time for his phone in the form of ` 10 or ` 50 prepaid cards, he is exchanging physical cash for electronic cash in the form of talk-time.
The primary advantage of this approach is that even as it runs electronic transactions at the account level, thus bringing down the costs of cash management for banks, it also supports physical cash transac-tions at the local level—which is an important component of rural banking.
state bank and inclusion
SBI has a deep commitment for financial inclusion. The variety of activities undertaken by the bank and the numbers reported are truly inspiring. The bank brings in the excluded population to the bank through a variety of means and technologies. To in-crease its direct outreach, the Bank has opened about 374 rural and 321 semi-urban (total 695) branches during the financial year 2009–10. The Bank has appointed about 26,800 CSP/outlets of BCs/BC to increase the outreach of its network. Some of the national level organisations such as India Post, ITC, National Bulk Handling Corporation and Reliance Dairy are acting as BCs of SBI. The alliance with India Post has been scaled up nationwide and now covers more than 5,200 post-offices across all States.
The Bank is the market leader (market share around 31 per cent) in SHG-Bank Credit Link-age Programme (SBLP) having credit linked so far 17.13 lakh SHGs (3.40 lakh SHGs credit linked dur-ing financial year 2009–10). The Bank has rolled out several unique products like SHG Credit Card,

118 MICROFINANCE INDIA
SHG Sahayog Niwas and SHG Gold Card. A new scheme for financing NGOs/MFIs for on-lending to SHGs was introduced. The Micro Insurance prod-uct—Grameen Shakti—now covers 1 million lives. The Bank is the major player in Electronic Benefit Transfer (EBT) project of government benefit pay-ments, with participation in five states.
The mammoth moves nimble with technology
Multiple IT enabled channels for Financial In-clusion: SBI has brought in a range of technolo-gies in terms of platform, solution, operational details and service contents to serve the excluded with minimal costs. Some of these channels are:
• SBITinyCard:Tiny Smart Card is biometrical-ly enabled Contact-less/Contact cards operable at dedicated POT/POS device machine. The op-erations through the POS/POO device support both offline and online/real time transactions in customers’ account. Above 16 lakh custom-ers enrolled during the financial year (cumula-tive more than 39 lakh customers). Tiny card now support Savings Bank, Recurring Deposit, SB–cum–Overdraft and Remittance products. Tiny Card for SHG customers with authorized signatories and finger print validation operable at BC/CSP/POS near to their place of residence has been introduced. Approximately, 24000 SHG groups and 155000 SHG members with tiny cards for individuals have been covered during the financial year 2009–10.
• Kiosk Banking: Internet enabled PC (Kiosk) with bio-metric validation capacities are in fixed locations with online/real time transac-tion support. The Bank has rolled out a Com-mon Service Centers set up under e-governance project. Major Service Centre Agencies (SCAs) like SREI Sahaj and 3-i Infotech are engaged as BCs. In 49 districts, 240 CSPs have been set up under the CSCs.
The bank is partnering with Department of Information Technology of Government of India for launching of kiosks. The bank is on the verge of appointing more SCAs for expanding kiosk based banking services.
• CellPhoneMessagingChannel: With a mo-bile solutions provider (EKO) the bank is offer-ing a cost-effective model of customer acquisi-tion and transactions. This works on low cost simple mobile phones well-secured through PIN based authorization. More than 680 CSPs had brought in 48000 customers through this channel by March 2010.
HDFC Bank and inclusion12
The rural branches of the bank (33 per cent) apart from offering banking products and services also function as hubs for other inclusion initiatives such as direct linkages to SHGs and JLGs, bank on wheels, POS terminals and information tech-nology enabled kiosks, and other information and communication technology (ICT) backed initiatives in these locations.
Lending to self-help groups and Microfinance InstitutionsThe bank has been working with various SHGs in order to cover a wider consumer base than through its own branch network. The groups work with the objective of providing credit for income generation activities, (often by providing training, vocational guidance and marketing support to their mem-bers). The bank has lent to over 45000 SHGs cover-ing 7 lakh households. The Bank works with these groups either by appointing BCs or through its own branch network. The bank has opened 27 branches catering exclusively to SHGs. The Bank also extends loans to MFIs for on-lending to financially exclud-ed households or in many cases to them through SHGs. This programme is currently spread across the country covering 18 states with tie-ups with 110 accredited MFIs. As on 31 March 2010, over ` 1400 crore of loans from the Bank have reached approximately 2 million households. The Bank tar-gets specific sectors to capture the supply chain of certain crops from the production stage to the sales stage. On the basis of these cash flows, it is able to finance specific needs of the farmers. This is fur-ther supported by using BCs closer to their respec-tive locations and helping them to create a savings and banking habit. This model has currently been implemented with dairy and sugarcane farmers. The initiative currently underway includes the ap-pointment of milk societies as BCs, through whom individual member farmers can open account with the bank. The societies route all payments (for milk or sugar cane) to the farmers through this account.
PromotingfinancialawarenessIn addition to providing various products and ser-vices to the financially excluded, the Bank conducts various training programmes, in local languages and covers not only the customers but also various intermediaries such as the Bank’s BCs. Through these programmes, the Bank provides credit coun-selling and information on savings habit, better utilization of savings, features of savings products, credit utilization, asset creation, insurance, income generation programme, and so on.

Financial inclusion—reasons for hope 119
HDFC Bank, despite being a private sector bank with significant shareholding from foreign inves-tors, has made a deep commitment to inclusion. The Bank’s financial inclusion initiatives have been integrated across its various businesses, across product groups. The bank has made inclusion ef-forts a part of its business. Bank intends bringing 10 million households currently excluded from basic banking services under the fold of this pro-gramme. It has been testing a mobile branch mod-el to serve populations in a hilly terrain in Tamil Nadu. The mobile branch, apart from serving populations in these areas, also solves cash man-agement problems of SHGs and MFIs in the area. The mobile branch is reportedly able to breakeven within a short time.
There are dedicated NGOs and MFIs that work in the inclusion space. The work they do goes beyond financial inclusion in case of their customers. IDF financial services, based in Bangalore, shared an on-going initiative in Karnataka. The model brings out the potential that could be tapped while deepening services with the customers.
insuRance in inclusion
The case of insurance coverage, however, is quali-tatively much poorer than originally feared. While insurance coverage has been increasing over the last two years, the type of coverage that the clients get does not seem to be the ones that suit them best. Very often credit insurance that secures lives of people for the duration of the loan is counted as insurance coverage for the purpose of financial in-clusion. Health insurance of a type which does not really offer the promised benefits to the customers has been a sore problem. Under the name of micro-insurance, most of the products that are marketed are not designed with the small vulnerable popula-tion in mind. The coverage, the exclusions, the pre-mium rates, the intervals of collection of premium and also the mode of collection and payment, the claim settlement procedure and the reality of low rate of settlement of claims have all ensured that the micro-insurance products are not popular among the people. In order to expand insurance coverage, simple products that are affordable and effective in risk coverage must be innovated. The Insurance Regulatory and Development Authority (IRDA) has a role to ensure that product innovations actu-ally drive insurance inclusion among people. The distribution models and agent remuneration in the specific context of vulnerable people are other issues deserving attention.
BC/BF initiative of IDF Sujeevana—beyond financial inclusion13
Sujeevana is a programme providing for finan-cial inclusion and livelihood security of rural poor. IDF has piloted it in Kunigal taluk, one of the most backward taluk in Karnataka. It is sup-ported by Hivos, an international aid agency. SBI provided banking services to the poor through IDF Sujeevana team. Agriculture Man Ecology Foundation provided resource support through IDF for propagation of sustainable agriculture practice. The salient features of Sujeevana are:
• Organizingthefinanciallyexcludedtenant,smalland marginal farmers, women into SHGs and developing thrift culture, health banking habits and imbibing the spirit of financial literacy.
• Organizingtherepresentativesofthesegroupsinto village level body known as krushikara koota (farmers clubs).
• Participatory experimentation, adoption andextension of sustainable agriculture like Sys-tem of Rice Intensification and similar prac-tices for minor millets, sugar cane, saving on labour, water, substitution of costly fertilizers and pesticides to increase in productivity.
• Primaryvalueadditionandcollectivemarket-ing of agro produce.
• Availingfinancialservicesongroupguaranteemode (JLG and SHG finance) from SBI, through BC/BF services of IDF Sujeevana team.
• Federatingall thegroups intoanapexmutualbenefit trust to function as a self-governed com-munity based organization for the socio-eco-nomic and cultural development of the member groups and its constituents. Farmers’ federation was formally launched in June this year.
The pilot which took off during financial year 2009–10, facilitated bank linkages to 94 farmers groups covering 1407 farmers from 19 villages with Kisan card credit assistance of ` 2.95 crore, more than half of which is now repaid with monthly and regular repayment of the loan by the members. Women groups were provided microfinance assis-tance through IDF FSPL. Currently 8000 farming households mostly financially excluded in 184 vil-lages have been organized into groups.
Of these organized groups, 900 members were covered under SBI group insurance. During fi-nancial year 2010–11, the old and new groups are now being linked to SBI by providing BC services to avail credit, deposit and insurance services.
120 MICROFINANCE INDIA
To conclude, inclusion should not be treated as a passing fad. RBI’s insistence on banks planning for inclusion and following up on implementation would have a salutary effect on those banks that had not taken inclusion agenda seriously. Of the challenges to inclusion, the most important is the one relating to training of BCs and their staff on a risk free trans-action framework. The major impediment to rapid
adoption of BC arrangements or mainstreaming improved technology in inclusion is that of invest-ment costs and lack of a viable revenue model. The objective of inclusion emanates from public policy. The funding of commercial institutions implement-ing public policy should come from the state. To the extent costs are not recoverable from the customer the deficit should be funded by the state.

Financial inclusion—reasons for hope 121
anneX 10.1 Rbi instructions on business correspondents
RBI/2009-10/238DBOD.No.BL.BC. 63 /22.01.009/2009-10
November 30, 2009All Commercial Banks (including RRBs and LABs)
Dear SirFinancialInclusionbyExtensionofBankingServices–UseofBusinessCorrespondents(BCs)As announced in the Annual Policy Statement for the year 2009-10, a Working Group was constituted by Reserve Bank of India to examine the experience to date of the Business Correspondent (BC) model and suggest measures, to enlarge the category of persons that can act as BCs, keeping in view the regulatory and supervisory framework and consumer protection issues. The Working Group has submitted its report which has been placed on the Bank’s website on August 19, 2009. The recommendations of the working group have since been accepted by Reserve Bank of India with slight modifications. Accordingly, banks are advised to take necessary action for implementing the various recommendations of the Working Group as indicated in the enclosure.2. Banks are permitted to appoint the following entities as BCs, in addition to the entities presently permit-ted: (i) Individual kirana/medical /fair price shop owners (ii) Individual Public Call Office (PCO) operators (iii) Agents of Small Savings schemes of Government of India/Insurance Companies (iv) Individuals who own Petrol Pumps (v) Retired teachers and (vi) Authorised functionaries of well run Self Help Groups (SHGs) linked to banks.3. With a view to ensuring the viability of the BC model, banks (and not BCs) are permitted to collect reason-able service charges from the customer, in a transparent manner under a Board-approved policy. Considering the profile of the clientele to whom banking services are being delivered through the BC model, banks should ensure that the service charges/fees collected from the customer for delivery of banking services through the BC model is not only fair and reasonable but also seen to be so. A copy of the Board-approved policy in this regard may be forwarded to us (The Chief General Manager-in-charge, Reserve Bank of India, Department of Banking Operations and Development, Central Office, World Trade Centre, Centre -1, Cuffe Parade, Colaba, Mumbai – 400 005 in the case of Scheduled Commercial Banks and LABs and The Chief General Manager, Reserve Bank of India, Rural Planning and Credit Department, Central Office, Central Office Building, 10th Floor, Shahid Bhagat Singh Marg, Mumbai – 400 001 in the case of RRBs). Banks should in particular ensure that there are no complaints from the customer about the charges being non-transparent/not reasonable. Any unfair practices adopted by banks in this regard would be viewed seriously by Reserve Bank of India.4. With the inclusion of the above entities, it is estimated that there will be substantial addition to the avail-able universe of BCs. Keeping in view the operational and other risks implied, banks are advised to ensure that they carry out suitable due diligence in respect of the entities proposed to be appointed as BCs and also institute additional safeguards as may be considered appropriate to minimise the agency risks. ICT solu-tions that ensure proper authentication and other security measures may be adopted to minimise the risk while upscaling the model as already advised. Further, banks may ensure that while appointing the above entities as BCs, the fundamental principle that the individuals are residents of the area in which they pro-pose to operate as BCs, stands fulfilled.5. As regards the North Eastern Region, it has been decided to implement the recommendation made by the Committee on Financial Sector Plan (CFSP) for the North Eastern Region (Chairperson: Smt. Usha Thorat) regarding the entities which can be appointed as BCs in the North Eastern Region. Accordingly, where a local organization/association not falling under any of the forms of organizations listed in the Reserve Bank guidelines is proposed to be appointed by a bank as Business Correspondent after due diligence and is rec-ommended by the DCC for being approved as Business Correspondent, the same would be considered by the Regional Office of the Reserve Bank for granting suitable exemption from the Reserve Bank guidelines for appointing such entities as BCs. Banks may therefore approach the Regional Director of the Reserve Bank at Guwahati for the purpose.
122 MICROFINANCE INDIA
6. Further, banks are also permitted to allow, with suitable and adequate safeguards, the BCs in the North Eastern Region to account for the transactions in the bank’s books latest by the end of the second working day from the date of the transaction.7. Regarding cases referred to DCCs for relaxation of criteria in respect of the maximum distance between the place of business of the BC and the base branch, the DCCs may give their decision at the earliest, and in any case within a period of three months, from the date of reference to them. In case no decision is con-veyed by DCCs within this period, the banks are permitted to treat it as a ‘no objection’ for relaxation of the distance criterion.
Yours faithfully(P.VijayaBhaskar)Chief General Manager-in-charge
enclosure
action required to be taken by banks based on the recommendations of the Working group to Review the business correspondent Model
sl. no. Recommendation of the Working group action required to be taken by banks
1
Realising the full potential of the bc model Given the right impetus, the BC model has the potential to speed up the process of financial inclusion in the country and bring the vast majority of population within the banking fold. The Group recognises the fact that the process of financial inclusion involves the three critical aspects of (a) access to banking markets, (b) access to credit markets and (c) financial education. The BC model should, therefore, encompass each of the above three as-pects in order to be able to address the issue of financial inclusion in a holistic manner. The full scope of the model can be realised not just by opening no-frills accounts but by synthesising the above three aspects as integral com-ponents of the model. Towards this end, there should be proper understanding and appreciation of the BC model by all stakeholders, in particular, by banks. Banks need to appreciate the benefits arising out of adopting the ‘branchless’ BC model and implement the same with mis-sionary zeal so as to achieve the ultimate goal of financial inclusion. (Paragraph 3.20)
Banks to implement the Business Correspondent model to achieve greater penetration of banking services.
2
cash handling Banks could think in terms of streamlining cash man-agement by adopting ‘Cash Routes’ (linking various BCs which are in close proximity to each other to a base branch) wherever warranted with suitable cash transit insurance to be borne by the banks. (Paragraph 3.22)
For streamlining cash management, banks may consider adopting ‘Cash Routes’ linking various BCs which are in close proximity to each other to a base branch) wherever warranted with suitable cash transit insurance.
(continued)
Financial inclusion—reasons for hope 123
sl. no. Recommendation of the Working group action required to be taken by banks
3
Financial education and consumer protection (i) Banks need to scale up their efforts substantially towards educating the clientele in their respective vernacular languages regarding the benefits of banking habit. For this purpose, extending necessary financial support from the Financial Inclusion Fund administered by NABARD may be considered. (Paragraph 3.23)
(i) Banks may scale up their efforts substantially towards educating their clientele in their respec-tive vernacular languages regarding the benefits of banking habit.
(ii) Information regarding BCs engaged by banks may be placed on the banks’ websites. The Annual Reports of banks should also include the progress in respect of extending banking services through the BC model and the initiatives taken by banks in this regard. Banks may also use print and electronic media (including in the vernacular language) to give wide publicity about implementation of BC model by them. (Paragraph 3.24) (iii) The banks may educate their customers through various means – print, electronic, etc. - the role of the BC and their obligation towards the customers, in the vernacular language. (Paragraph 3.25) (iv) The banks need to ensure the preservation and pro-tection of the security and confidentiality of customer information in the custody or possession of the BCs. (Paragraph 3.26) (v) Banks may put in an appropriate grievance redres-sal mechanism, which should be widely publicised and also placed in public domain. The details of the grievance redressal officer should be displayed at the premises of the BC as also at the base branch and made available by the bank/BC at the request of the customer.(Paragraph 3.27)
(ii) Information regarding BCs engaged by banks may be placed on the respective banks’ websites. The Annual Report of the banks should also include the progress in respect of extending banking services through the BC model and the initiatives taken by banks in this regard. Banks may also use print and electronic media (includ-ing in the vernacular language) to give wide publicity about implementation of the BC model by them. (iii) Banks may educate their customers through various means – print, electronic etc., - the role of the BC and their obligation towards the custom-ers, in the vernacular language. (iv) Banks should ensure the preservation and protection of the security and confidentiality of the customer information in the custody or pos-session of the BCs. (v) Banks may put in place an appropriate grievance redressal mechanism, which should be widely publicised and also placed in public domain. The details of the grievance redressal of-ficer should be displayed at the premises of the BC as also at the base branch and made available by the bank/BC at the request of the customer.
4
ensuring viability of bc model (i) The BC model can succeed only if the banks own up the BCs as their agents. Banks may need to have a relook at the compensation structure for BCs. (Paragraph 3.28) (ii)The range of services to be delivered through the BC should be ramped up to include suitable small savings, micro-credit, micro-insurance, small value remittances etc. (Paragraph 3.29) (iii) Banks may be permitted to collect reasonable service charges from the customer, in a transparent manner, for delivering services through the BC model. Suitable guidelines may be issued by RBI in this regard, especially keeping in view the profile of customers us-ing these services. (Paragraph 3.30). (iv) Banks may bear the initial set up cost of the BCs and extend a handholding support to the BCs, at least dur-ing the initial stages. Banks may also need to bear the costs relating to transit insurance of the cash handled by BCs. (Paragraph 3.31) (v) In order to improve the viability of the BC model, banks may consider providing reasonable temporary overdrafts to the BCs free of interest charges. (Paragraph 3.32)
(i) Banks may have a relook at the compensation structure for BCs to effectively ramp up the use of the BC scheme for banking penetration. (ii) Banks may ramp up the range of services to be delivered through the BC model to include suitable small savings, micro-credit, micro-insur-ance, small value remittances etc., Please see paragraph 3 of the Circular. (iv) Banks may consider bearing the initial set up cost and other costs of the BCs and extend a handholding support to the BCs, at least during the initial stages. (v) Banks may consider providing reasonable temporary overdrafts to the BCs.
(continued)

124 MICROFINANCE INDIA
sl. no. Recommendation of the Working group action required to be taken by banks
5
Risk Mitigation Measures To address the various risks involved in rendering banking services through the BC model, banks need to put in place suitable and adequate risk mitiga-tion measures. Further, banks may be guided by the instructions contained in the guidelines on ‘Outsourc-ing of Financial Services’ issued by RBI on November 3, 2006, as relevant, while implementing the BC model.(Paragraph 3.35)
Banks may put in place suitable and adequate risk mitigation measures to address the various risks involved in rendering banking services through the BC model. Banks may also be guided by the instructions contained in the guidelines on ‘Outsourcing of Financial Services’ issued by RBI on November 3, 2006, as relevant while implementing the BC model.
6
adoption of appropriate technology Banks may adhere to the RBI guidelines on adoption of appropriate technology while implementing the BC model. (Paragraph 3.37)
Banks may adhere to the extant RBI guide-lines on adoption of appropriate technology as contained in the circular DBOD.No.Leg.BC./ 94/09.07.005/2006-07 dated May 7, 2007, while implementing the BC model.
7
Training for the bcs Banks may also develop suitable training modules in the local language/s, in order to provide proper attitudi-nal orientation and skills to the BCs. Indian Institute of Banking & Finance (IIBF) has already developed training modules for BCs. These modules may be translated in vernacular languages and leveraged extensively so as to reach a wider group. (Paragraph 3.38)
Banks may develop suitable training modules in the local language/s, in order to provide proper attitudinal orientation and skills to the BCs.
anneX 10.214
projects sanctioned under FiF during 2009–10
• Pilot project to establishFarmers’ ServiceCentres/VillageKnowledgeCentres (VKCs),mobile creditcounselling centres, promotion of financial literacy and farmer education through mass media to pro-mote financial inclusion in South Malabar district of Kerala for setting up eight Farmers’ Service Centres/VKCs in eight districts.
• ViabilitygapfundingfortheBiometriccardprojectthroughBC/BFmodelinNERforSmartcardbasedaccounts.
• Support forCertificateCourse forBusinessCorrespondents (BCs) andBusinessFacilitators (BFs) toIndian Institute of Banking & Finance (IIBF) to cover 20,000 candidates over a period of 2 years, i.e., 2009–10 and 2010–11.
• SupporttoKozhikodeDCCBforsettingupofCreditCounsellingandLivelihoodPromotionCentre.• SupporttoThrissurDCCBforsettingupofInformationDisseminationcumHumanResourceDevelop-
ment Centre.• FinancialinclusionthroughBC/BFmodelinVidarbhaforcomprehensiveFIthroughFinancialLiteracy
training Conduct of 10 Training of trainers covering 300 resource persons drawn from SHG leaders, FCs and retired bank personnel. Households not covered by the banking sector to be included under no-frills-accounts and SHGs.
• Using post-office as Business Correspondent of RRB to utilize branches of postal department forbusiness expansion in Uttarakhand. Post-office to offer two services, viz., collection of deposits and disbursements of loans and collection of repayments.
• Micro-creditprogrammeinNagalandwithVillageDevelopmentBoards(VDBs)asintermediariesforaugmenting the corpus of 107 VDBs in Longleng and Kiphire districts of Nagaland.
• CapacitybuildingprogrammeforRRBandpost-officeforusingpost-officeasBCofRRBthroughfivetraining programmes for staff of post-offices/banks in Uttarakhand.
• ProjectforFinancialResourceCentreatRRBtocatertothecapacitybuildingandresearchneedsforupscaling financial inclusion in four districts, i.e., Murshidabad, Nadia, North and South 24 Parganas of West Bengal.
Financial inclusion—reasons for hope 125
• TotalfinancialinclusionprojectbyDCCBthroughonedaycampfollowedbybaselevelsurvey,coveringfinancial literacy and actual provision of financial services by opening savings bank account /KCC/GCC accounts in five zones, i.e., Arambagh, Tarakeswar, Chanditala, Sreerampore and Chinsurah of Hooghly district resulting in opening of at least 150 account per camp.
• ProjectforfinancialinclusionthroughFCactingasBFofRRBinAssam.Itinvolvesfourtrainingpro-grammes for members of 11 FCs identified by the bank. A total of 100 members of the FC will be trained in Morigaon district.
• FinancialliteracybyRRBinAssaminNalbaridistrict.• CapacityBuildingProgrammeforLDMsofbanksconductedbyBIRD,Lucknow.
anneX 10.315 projects sanctioned under FiTF during 2009–10
• Pilot project for extendingbanking services in tenbankbranches (oneCustomer ServicePoints perbranch) in Pali district of Rajasthan through BCs and enabling technology by RRB and providing finan-cial services to 1,20,512 households through seventy four branches.
• FinancialInclusionProjectforimplementingCoreBantlingSolutionthroughusageofCOINsoftwarede-veloped by National informatics Centre (NIC) in Sikkim by a Cooperative Bank, six branches and 10 Multi Purpose Credit Societies (MPCS) in the first phase and five MPCS in the immediate second phase.
• PilotProjectforextendingfinancialservicesto5000newcustomersthroughECandenablingcontactlesssmart card and biometric finger print scanning technology in Chamba district of Himachal Pradesh by RRB.
• IntroductionofGraminBanksmartcardinNainitalandAlmoradistrictscovering5000customersbyRRB on pilot basis in the service area of two of their branches.
• ToprovidebankingservicesthroughonelakhnewaccountsusingBCmodelandbiometricenabledmobile services by a commercial bank for transaction at Village Customer Service Points in 194 villages in five blocks of three districts (Mandvi and Nakhtrana blocks of Kutch district, Kankrej and Bhabhar blocks of Banaskantha district and Silvassa block of UT of Dadra & Nagar Haveli).
• Project to provide financial services to 1,25,000 rural households by implementing ICT solution forFinancial Inclusion in 569 villages of Kanpur Dehat district of Uttar Pradesh by RRB.
• InstallationoffourATMsinAndamanandNicobarIslandsbyaCooperativeBankwheretheservicesofbanks have not penetrated thereby providing banking facilities at their doorsteps to local populace.
• CardbasedICTsolutionbyRRB,engaging30BCsinthreedistricts,viz.,PapumPare,WestSiangandUpper Subansiri of Amnachal Pradesh for opening 30,000 card based accounts in two years.
• CardbasedICTsolutionbyRRB,engaging104BCsintwodistricts,viz.,Sonitpur&.Sibsagardistrictsin Assam to open minimum 1,04,000 card based accounts.
• Tofostersocialandeconomicdevelopmentoftheruralpeoplebyextendingbankingservicesinremoterural areas through 43 bank branches in West Singhbhum and Gum la districts in Jharkhand to open 1,00,000 accounts.
• ImplementationofpilotprojectthroughBCmodelusingcardbasedICTsolutionsbyRRBinGulbargaand Bidar districts in Karnataka to cover 4,50,000 accounts.
• CardbasedICTsolutionbyRRB,engaging100BCsinthetwohillytribaldistrictsofKarbiAnglongandNorth Cachar Hills in Assam to open minimum 1,00,000 card based accounts through 50 branches.
• CardbasedICTsolutionbyRRBinBahraichandShrawastidistrictsinUttarPradeshtocover1,50,000new accounts.
• CardbasedICTsolutionbyRRBforopening40,000newaccountsinfourblocksoftwodistricts,viz.,Aizawal and Kolasib in Mizoram.
• ImplementationofpilotprojectthroughBCmodelusingcardbasedICTsolutionbyRRBinBellaryandChitradurga districts in Karnataka covering 7,06,000 beneficiaries.
• CardbasedICTsolutionbyRRBforopeningof1,20,000accountsintwodistricts,viz.,WestTripuraandDhalai of Tripura.
• ImplementationofpilotprojectthroughBCmodelbyRRBusingcardbasedICTsolutionsinHamirpurdistrict of Uttar Pradesh to cover 64,420 beneficiaries.
• ToprovidefinancialservicestotheunbankedpopulationinGopalganjdistrictofBiharthroughcardbased ICT solution by RRB to cover 1,90,000 new accounts.
126 MICROFINANCE INDIA
noTes 1. Data sourced from ‘Policy issues and role banking
system in financial inclusion’, N. Srinivasan, EPW, July 2007. Based on mid-year population estimates 2004–05; ‘Basic statistical Returns 2009’, RBI; ‘India Post Annual report 2010’; ‘No of members of PACS’, database of National Federation of State Coopera-tive Banks (NAFSCOB).
2. Report of The Expert Committee on harnessing the India Post Network in financial inclusion, Chaired by Ajay Shah. June 2010.
3. The study was carried out by CMF-IFMR for CMR-BIRD, funded by NABARD.
4. RBI/2009-10/243DBOD.No.BL.BC. 65/22.01.001/ 2009–10.
5. RBI/ 2009-10/233RPCD.CO.LBS. HLC.BC.No.43/ 02.19.10/ 2009–10.
6. Cited from Indian Banks web site.
7. Till end of June 2010, banks could charge a rate of interest not exceeding their Prime Lending Rate on loans up to ` 200000.
8. Dr Shetty is advisor to the EPW Research Foundation. 9. ‘Making business correspondence work in India—
Focus Note 24’, Carolina Laureti and Brett Hudson Matthews MicroSave.
10. Based on blog by Farjana Nazeeb, IFMR Finance Foundation in IFMR blog.
11. Excerpted from ‘From Exclusion To Inclusion With Micropayments’, Unique Identification Authority of India.
12. Based on discussions with Manohara Raj, Vice President, HDFC Bank, and annual report of HDFC Bank 2009–10.
13. Discussions with Vivekanand Salimath, CEO, IDF Financial services, Karnataka.
14. Extract from NABARD Annual report 2009–10. 15. Extract from NABARD Annual report 2009–10.
• ToprovidefinancialtransactionfacilityinvillagesbyestablishingPointofTransactionwithinfrastruc-ture and technical support to cover 60,000 beneficiaries in Latehar district by RRB in Jharkhand.
anneX 10.4 Recommendations of the expert committee on harnessing the india post network
1. India Post should deliver lightweight, low cost bank accounts to all Indian citizens and especially to the financially excluded population.
2. India Post should look for ways to leverage its low cost platform by providing India Post branded ac-counts to other strategic partners.
3. India Post achieving high volumes of money-orders where payments of as little as ` 10 are achieved at a charge of less than ` 0.1 sans subsidy.
4. India Post should evolve the money-order to become a mechanism for transferring money from one POSB account to another—not just cash.
5. India Post must build a payments infrastructure, connecting up all POSB accounts and accounts of its partners, to develop a person to person money transfer capability through mobiles, internet, etc.
6. India Post must elicit a large number of partners in terms of financial inclusion players, mobile service providers and innovative new technological choices.
7. India Post must work closely with a diverse array of government agencies so that their G2P payments requirements are met through a combination of POSB accounts held by citizens.
8. India Post should play a role in the emergency credit aspect of financial inclusion, through a platform building approach where private lenders deliver credit to the poor.
9. India Post should request the addition of its financial inclusion project into the Terms of Reference of the recently announced Technology Advisory Group for Unique Projects.
10. The role of the Post-Office Savings Bank as an agent of the Ministry of Finance should be revisited and expanded to enable India Post to play a larger, direct role in financial inclusion and build appropriate enabling architecture.

11Chapter
An agenda for the future
Microfinance has possibly gone past the age of ma-turity. Sadhan projected in the Side by Side report 2009 that the sector would grow to ` 2000 billion in loans and 440 million in clients by 2015. The large projected size is both exciting and threaten-ing. The challenges that have emerged in the last two years are second (and some third) generation problems that visit an idea which has grown into a full blown business and mainstream activity. As long as the sector was small and seen to be strug-gling, there were few issues raised by those who were in the media, academics and also in politics. The attention then resulted in wonderment at the presumption that such a model could cover mil-lions and that too with profits. With the sector hav-ing grown so huge and touching almost 100 million accounts, it has attracted attention of several people in policy, government and opinion making. The challenges faced by the sector are two fold. One set of challenges have been set up by the microfinance institutions (MFIs) themselves by decisions taken by them on their business model, competition poli-cies and operational processes. Their conduct, both internal and external, is seen to be cutting corners and engaging in one-upmanship, bordering on in-sensitivity to customers. The other set of challenges has been thrown from outside which comprise the expectations of others from a responsible microfi-nance sector. The state expects that microfinance will be a disciplined and responsible sector that provides services to vulnerable people in a man-ner consistent with their economic status. The state very much desires that microfinance sector should remain profitable but not profit seeking. The state would like to use soft-handed minimum regulation on the sector in order to provide the space necessary for innovation and expansion across the country. But
it would not be happy to see the institutions grow into self-serving monopolies making use of the soft regulation.
The Reserve Bank of India (RBI) on its part would like the institutions to exercise self-restraint on their market conduct and ensure that systemic insecurities are not caused. More than the volume of business as a proportion of the financial sector size, it is the significant number of poor people covered that is a cause for concern in the policy establishment. The unorganized and mostly voice-less customer base expects reasonable service qual-ity based on trust and sensitive treatment of their impoverished circumstances. The customer back-lash in some locations has spoken loud enough. The bad press and negative image built in certain parts of the country is due to a few errant institu-tions or misinformation. However, the misgivings have to be dealt with. Where do the MFIs and the sector go from here?
The MFIs need to exhibit that they are relevant and appropriate institutions to deal with the prob-lems of poor. This is done by a combination of good governance practices, introducing good business practices and investing in development of products that suit the customers. Revisiting the ethics of do-ing business—from the choice of investors to design of recovery practices—seems a priority. MFIs should prefer those investors and shareholders with moder-ate profit expectations and patience. Pursuit of high valuation through the capital market route might be an adventure for a few institutions but such institu-tions would lose their prestige and premium status in a market that still values social performance. While access to capital market for mainstream funds is a desirable and appropriate goal, securing high en-terprise valuation is an extremely risky manoeuvre.

128 MICROFINANCE INDIA
The National Bank for Agricultural and Rural Development (NABARD) should resume its leader-ship of the SHG bank linkage programme (SBLP) movement and become a champion of socially mo-bilized financial intermediation processes. Greater attention is necessary to improve quality of groups that have already been linked and the new groups coming up in other states. There is a need to stop further formation and linkage of groups in the southern states, so that multiple group membership do not become epidemic. Apex institutions in the fi-nancial sector have a role in determining the utility of financial federations of self-help groups (SHGs) and find ways and means of their formation, stabi-lization and financing. Without an enabling policy relating to SHG federations, the momentum built in the SHG movement cannot be sustained. The use of different funding mechanisms could see consider-able improvement and benefit the sector positively in creating the desired impact on inclusion, out-reach and deepening of services.
There seem to be considerable problems with the direction of the sector, both the commercial and non-commercial parts. SHGs and MFIs seem to fo-cus on the better-off clients. The poor do not seem to figure highly in their scheme of business. If the poor are to be left out of the financial systems that have been designed specifically with them as the original clients, then with what would they be served? The premise of setting up of the SHG movement and MFIs was that of creating an affordable alternative to provide these people services at their doorstep. If that expectation is belied, there is no reason why these new institutional frameworks deserve policy support, soft regulation or public approbation.
There is a need to revisit the mission of the mi-crofinance movement. The original mission has not been in the reckoning in recent practice. The drift that is setting in has a clear direction. The direction is towards commercialization, profits and choosing customers who would help them realize the same. Unless the vision is reset and the mission reaffirmed within a reasonable period of time, microfinance movement runs the risk of becoming another mind-less mainstream movement sans social relevance.
But the picture is not all that dark. There are already indications that many right thinking institutions and leaders are taking a close look at their social performance practices and indicators. Some MFIs are examining their interest rates. Market discipline is sought to be enforced through peer pressure. Grievance handling mechanisms and independent arbiters have been brought into being. Funders are
Institutional energies will be diverted to protecting the market valuation and shareholder value. Techni-cal justifications of capital market profits not coming from the customers have their place, but it is naïve to assume that such justifications would counter the emotional argument that investors enrich them-selves from the misery of poor. The industry must set what would be the norms for reasonable valu-ation and reasonable profits. Institutions posting high return-on-assets have not gone unnoticed. The high return-on-assets has been justified as a necessity for feeding the growth engine. However, the choice to grow fast is purely institutional. The customers do not require the institutions to grow at a frenetic pace within a short period of time. Customers can pay the cost of service, but not the cost of ambitious growth, much less the cost of fancy market valuations.
In an analysis of data of costs and yields, 14 out of 30 MFIs were seen to have increased their yields when the cost of operations declined. It is difficult to justify that MFIs—growing or otherwise—need to increase the rates of interest and earn higher yields on their loan portfolio even when the cost of operation declines. This certainly does not reflect a social mindset and has little to do with institutions that work with poor and vulnerable clients. The sec-tor needs to have greater levels of transparency in dealing with customers and other stake holders. Not only the true prices paid by customers should be declared openly but further information relating to real recovery rates, governance practices and pro-cesses adopted in the transformation of institutions should also be open for public scrutiny. The fact that many of these institutions are funded with public grants to some extent and with public funds as loans to a large extent casts an obligation on them to be transparent. If institutions want to pursue opaque practices and seek high profits, then they possibly should cease to be MFIs.
The regulator should possibly overcome its re-luctance to offer guidance and enforce the same across the sector. Some of the proposed actions at the macro level such as delinking microfinance from priority sector lending (PSL) instead of spe-cifically penalizing institutions which engage in un-desirable practices are not the best way of dealing with an emerging sector. The press reports that RBI had written to some MFIs to reduce interest rates, moderate return-on-assets and adopt transparent practices are encouraging. This is the kind of spe-cific action that would make expectations known and improve compliance among MFIs.
An agenda for the future 129
discussing ways of acting in concert against deviant behaviour. The last frontier in this series of coping measures is that of making equity investments more responsible. The sector has the leadership and the maturity to find solutions to this as well. Even when all this is done, there is a need to be vigilant about the direction of the sector. Large businesses have the resources to stray into misadventures. How to rein in such instincts and focus on the original mission
over the long term is the challenge. Establishing and sustaining the microfinance sector’s relevance to customers’ lives and livelihoods is the best mitigation against political risk and unfavourable attention from policy. The sector has to work that much harder in promoting its status among customers from being ‘useful’ to ‘indispensable’. That comes not from shallow services, but from deeper engagement with customers’ livelihoods.

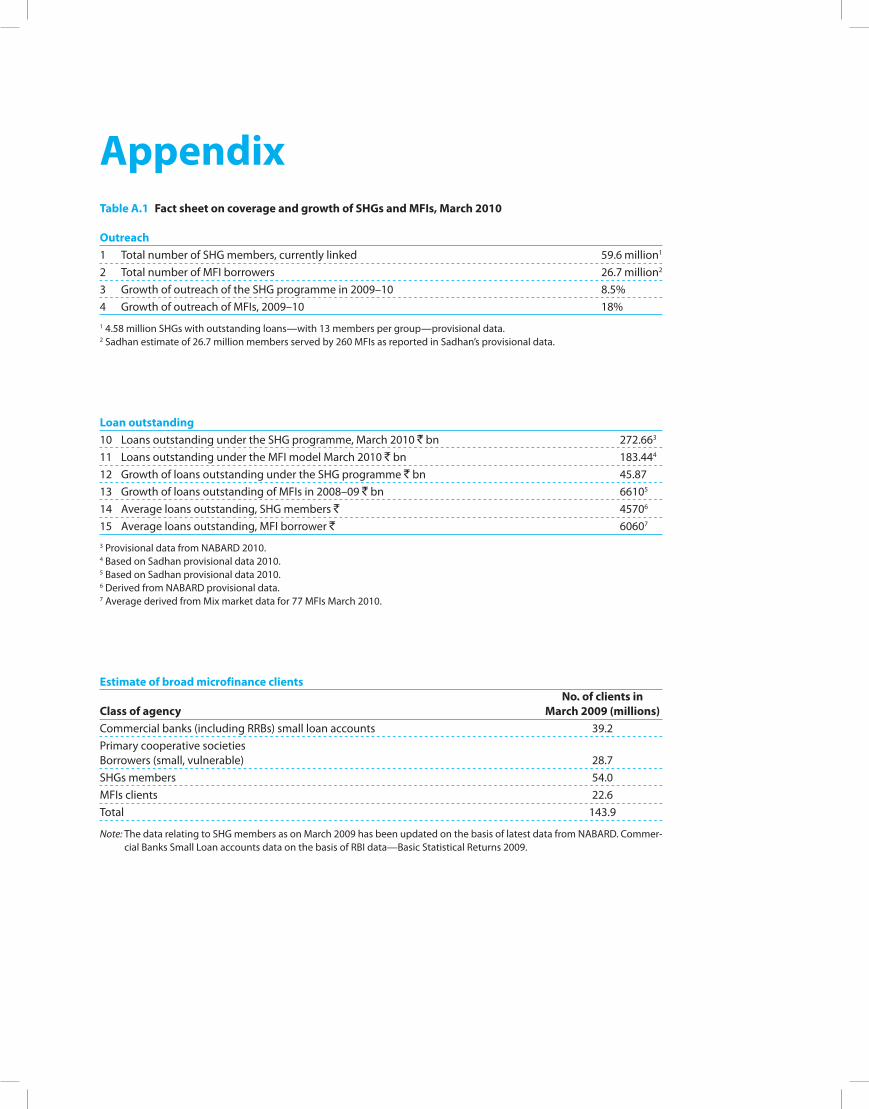
AppendixTable A.1 Fact sheet on coverage and growth of SHGs and MFIs, March 2010
Outreach1 Total number of SHG members, currently linked 59.6 million1
2 Total number of MFI borrowers 26.7 million2
3 Growth of outreach of the SHG programme in 2009–10 8.5%4 Growth of outreach of MFIs, 2009–10 18%1 4.58 million SHGs with outstanding loans—with 13 members per group—provisional data.2 Sadhan estimate of 26.7 million members served by 260 MFIs as reported in Sadhan’s provisional data.
Loan outstanding10 Loans outstanding under the SHG programme, March 2010 ` bn 272.663
11 Loans outstanding under the MFI model March 2010 ` bn 183.444
12 Growth of loans outstanding under the SHG programme ` bn 45.8713 Growth of loans outstanding of MFIs in 2008–09 ` bn 66105
14 Average loans outstanding, SHG members ` 45706
15 Average loans outstanding, MFI borrower ` 60607
3 Provisional data from NABARD 2010.4 Based on Sadhan provisional data 2010. 5 Based on Sadhan provisional data 2010.6 Derived from NABARD provisional data.7 Average derived from Mix market data for 77 MFIs March 2010.
Estimate of broad microfinance clients No. of clients in Class of agency March 2009 (millions)Commercial banks (including RRBs) small loan accounts 39.2Primary cooperative societies Borrowers (small, vulnerable) 28.7SHGs members 54.0MFIs clients 22.6Total 143.9
Note: The data relating to SHG members as on March 2009 has been updated on the basis of latest data from NABARD. Commer-cial Banks Small Loan accounts data on the basis of RBI data—Basic Statistical Returns 2009.
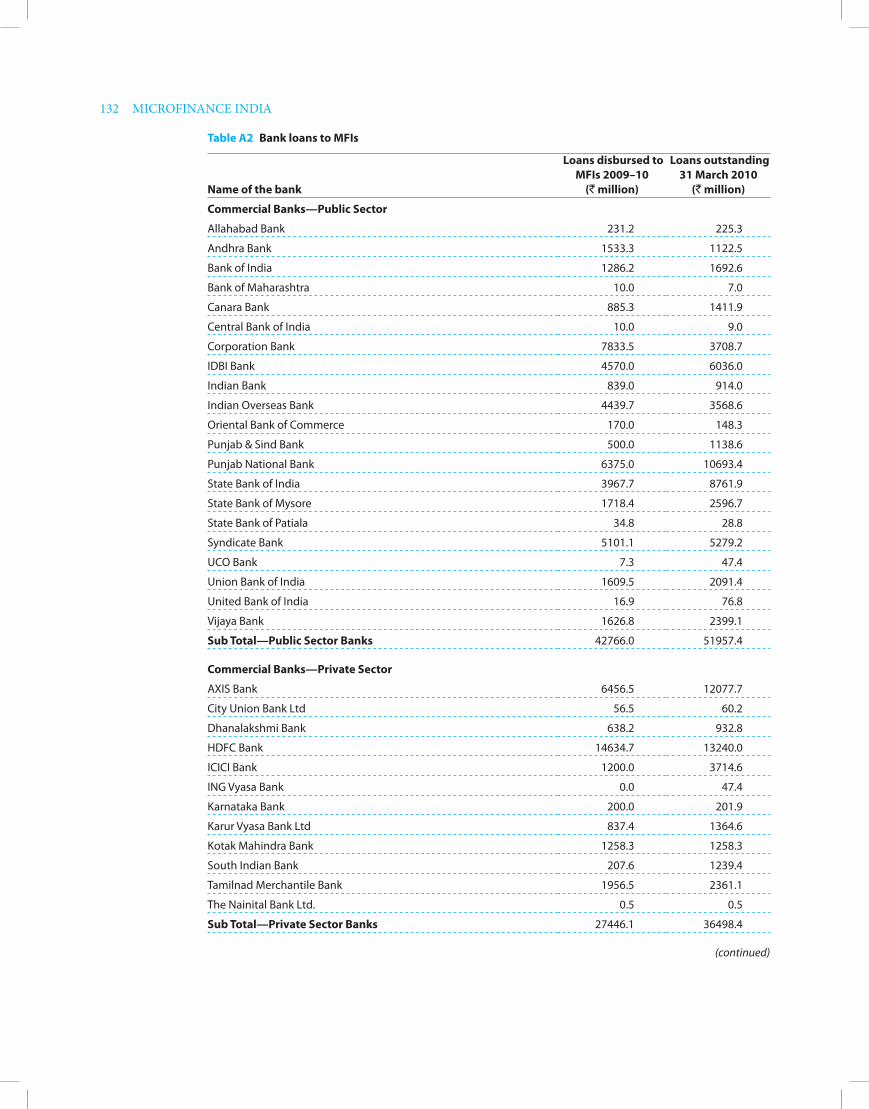
132 MICROFINANCE INDIA
Table A2 Bank loans to MFIs
Name of the bank
Loans disbursed to MFIs 2009–10
(` million)
Loans outstanding 31 March 2010
(` million)
Commercial Banks—Public Sector
Allahabad Bank 231.2 225.3
Andhra Bank 1533.3 1122.5
Bank of India 1286.2 1692.6
Bank of Maharashtra 10.0 7.0
Canara Bank 885.3 1411.9
Central Bank of India 10.0 9.0
Corporation Bank 7833.5 3708.7
IDBI Bank 4570.0 6036.0
Indian Bank 839.0 914.0
Indian Overseas Bank 4439.7 3568.6
Oriental Bank of Commerce 170.0 148.3
Punjab & Sind Bank 500.0 1138.6
Punjab National Bank 6375.0 10693.4
State Bank of India 3967.7 8761.9
State Bank of Mysore 1718.4 2596.7
State Bank of Patiala 34.8 28.8
Syndicate Bank 5101.1 5279.2
UCO Bank 7.3 47.4
Union Bank of India 1609.5 2091.4
United Bank of India 16.9 76.8
Vijaya Bank 1626.8 2399.1
Sub Total—Public Sector Banks 42766.0 51957.4
Commercial Banks—Private Sector
AXIS Bank 6456.5 12077.7
City Union Bank Ltd 56.5 60.2
Dhanalakshmi Bank 638.2 932.8
HDFC Bank 14634.7 13240.0
ICICI Bank 1200.0 3714.6
ING Vyasa Bank 0.0 47.4
Karnataka Bank 200.0 201.9
Karur Vyasa Bank Ltd 837.4 1364.6
Kotak Mahindra Bank 1258.3 1258.3
South Indian Bank 207.6 1239.4
Tamilnad Merchantile Bank 1956.5 2361.1
The Nainital Bank Ltd. 0.5 0.5
Sub Total—Private Sector Banks 27446.1 36498.4
(continued)
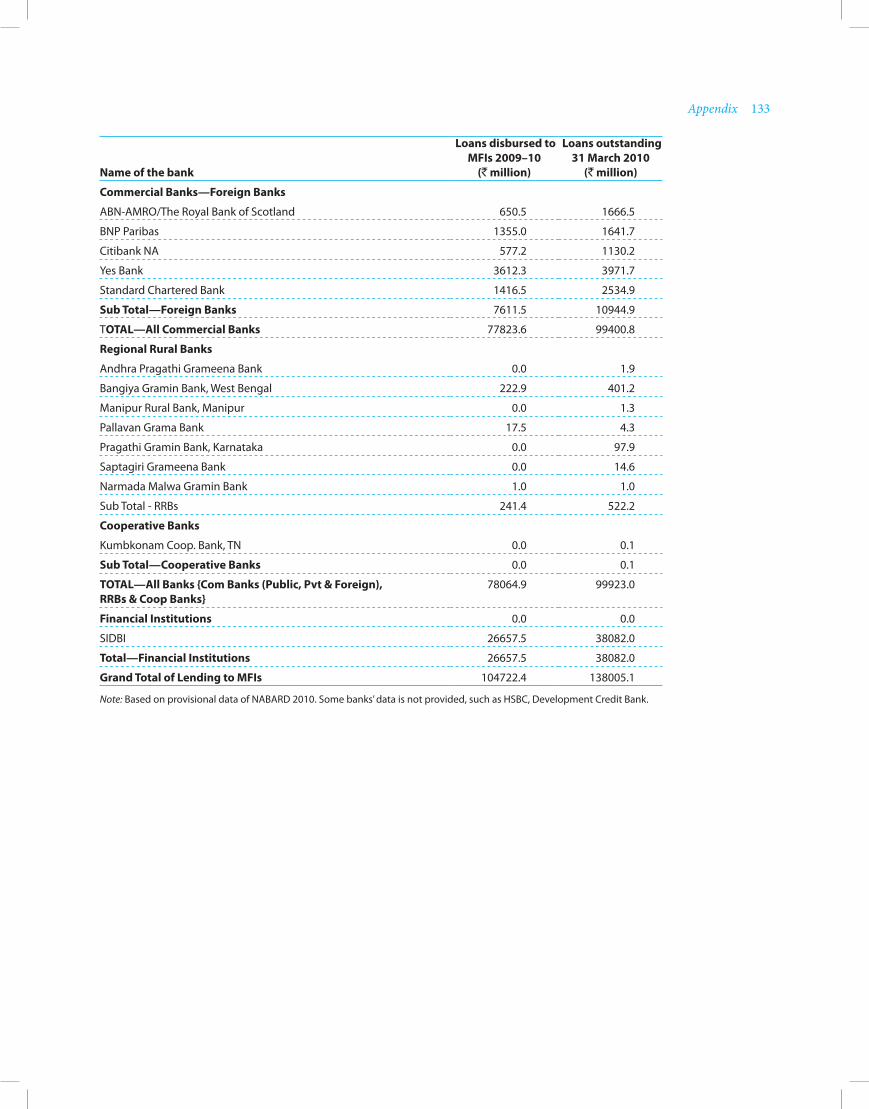
Appendix 133
Name of the bank
Loans disbursed to MFIs 2009–10
(` million)
Loans outstanding 31 March 2010
(` million)
Commercial Banks—Foreign Banks
ABN-AMRO/The Royal Bank of Scotland 650.5 1666.5
BNP Paribas 1355.0 1641.7
Citibank NA 577.2 1130.2
Yes Bank 3612.3 3971.7
Standard Chartered Bank 1416.5 2534.9
Sub Total—Foreign Banks 7611.5 10944.9
TOTAL—All Commercial Banks 77823.6 99400.8
Regional Rural Banks
Andhra Pragathi Grameena Bank 0.0 1.9
Bangiya Gramin Bank, West Bengal 222.9 401.2
Manipur Rural Bank, Manipur 0.0 1.3
Pallavan Grama Bank 17.5 4.3
Pragathi Gramin Bank, Karnataka 0.0 97.9
Saptagiri Grameena Bank 0.0 14.6
Narmada Malwa Gramin Bank 1.0 1.0
Sub Total - RRBs 241.4 522.2
Cooperative Banks
Kumbkonam Coop. Bank, TN 0.0 0.1
Sub Total—Cooperative Banks 0.0 0.1
TOTAL—All Banks {Com Banks (Public, Pvt & Foreign), RRBs & Coop Banks}
78064.9 99923.0
Financial Institutions 0.0 0.0
SIDBI 26657.5 38082.0
Total—Financial Institutions 26657.5 38082.0
Grand Total of Lending to MFIs 104722.4 138005.1
Note: Based on provisional data of NABARD 2010. Some banks’ data is not provided, such as HSBC, Development Credit Bank.
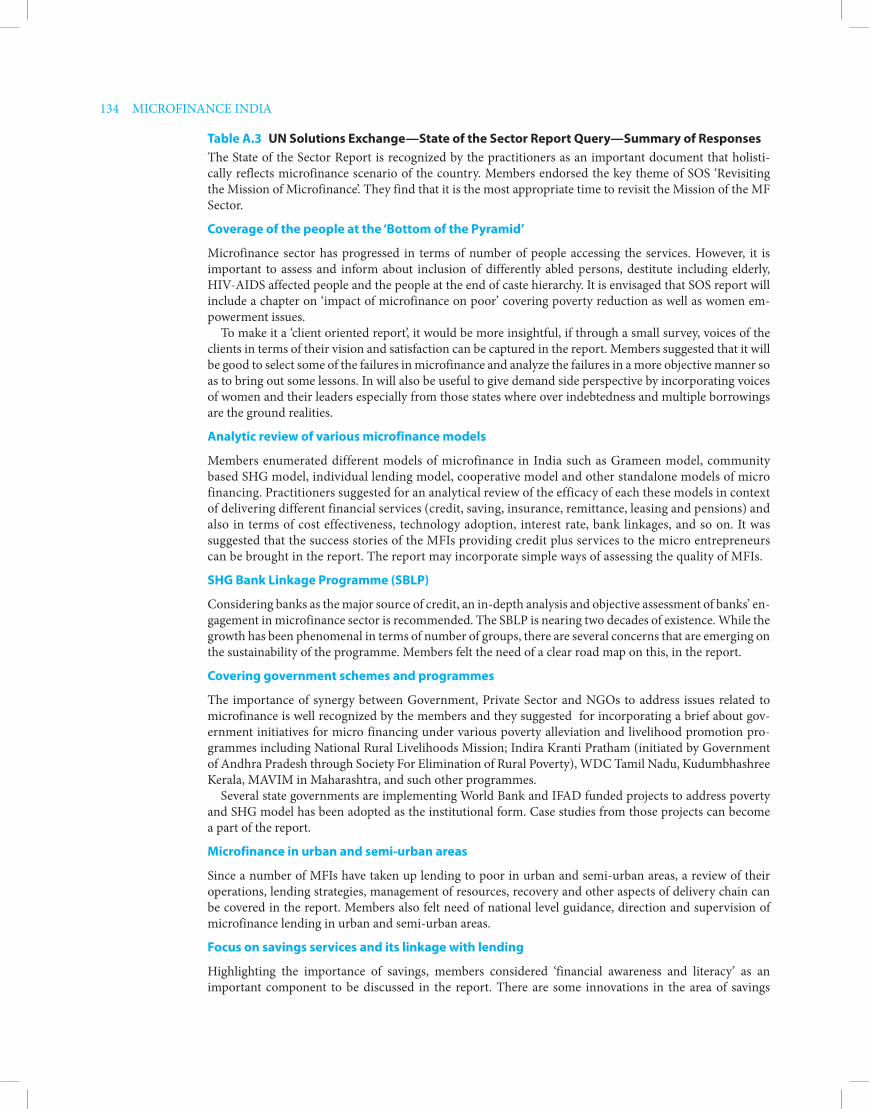
134 MICROFINANCE INDIA
Table A.3 UN Solutions Exchange—State of the Sector Report Query—Summary of ResponsesThe State of the Sector Report is recognized by the practitioners as an important document that holisti-cally reflects microfinance scenario of the country. Members endorsed the key theme of SOS ‘Revisiting the Mission of Microfinance’. They find that it is the most appropriate time to revisit the Mission of the MF Sector.
Coverage of the people at the ‘Bottom of the Pyramid’
Microfinance sector has progressed in terms of number of people accessing the services. However, it is important to assess and inform about inclusion of differently abled persons, destitute including elderly, HIV-AIDS affected people and the people at the end of caste hierarchy. It is envisaged that SOS report will include a chapter on ‘impact of microfinance on poor’ covering poverty reduction as well as women em-powerment issues.
To make it a ‘client oriented report’, it would be more insightful, if through a small survey, voices of the clients in terms of their vision and satisfaction can be captured in the report. Members suggested that it will be good to select some of the failures in microfinance and analyze the failures in a more objective manner so as to bring out some lessons. In will also be useful to give demand side perspective by incorporating voices of women and their leaders especially from those states where over indebtedness and multiple borrowings are the ground realities.
Analytic review of various microfinance models
Members enumerated different models of microfinance in India such as Grameen model, community based SHG model, individual lending model, cooperative model and other standalone models of micro financing. Practitioners suggested for an analytical review of the efficacy of each these models in context of delivering different financial services (credit, saving, insurance, remittance, leasing and pensions) and also in terms of cost effectiveness, technology adoption, interest rate, bank linkages, and so on. It was suggested that the success stories of the MFIs providing credit plus services to the micro entrepreneurs can be brought in the report. The report may incorporate simple ways of assessing the quality of MFIs.
SHG Bank Linkage Programme (SBLP)
Considering banks as the major source of credit, an in-depth analysis and objective assessment of banks’ en-gagement in microfinance sector is recommended. The SBLP is nearing two decades of existence. While the growth has been phenomenal in terms of number of groups, there are several concerns that are emerging on the sustainability of the programme. Members felt the need of a clear road map on this, in the report.
Covering government schemes and programmes
The importance of synergy between Government, Private Sector and NGOs to address issues related to microfinance is well recognized by the members and they suggested for incorporating a brief about gov-ernment initiatives for micro financing under various poverty alleviation and livelihood promotion pro-grammes including National Rural Livelihoods Mission; Indira Kranti Pratham (initiated by Government of Andhra Pradesh through Society For Elimination of Rural Poverty), WDC Tamil Nadu, Kudumbhashree Kerala, MAVIM in Maharashtra, and such other programmes.
Several state governments are implementing World Bank and IFAD funded projects to address poverty and SHG model has been adopted as the institutional form. Case studies from those projects can become a part of the report.
Microfinance in urban and semi-urban areas
Since a number of MFIs have taken up lending to poor in urban and semi-urban areas, a review of their operations, lending strategies, management of resources, recovery and other aspects of delivery chain can be covered in the report. Members also felt need of national level guidance, direction and supervision of microfinance lending in urban and semi-urban areas.
Focus on savings services and its linkage with lending
Highlighting the importance of savings, members considered ‘financial awareness and literacy’ as an important component to be discussed in the report. There are some innovations in the area of savings
Appendix 135
mobilization by SHGs and SHG federations and the optimum utilization of those savings. Report can include some case studies on successful experiments on savings. Practitioners also recommended for including small savings activities of India Post in the report, as it provides the first opportunity of secure savings to millions of Indians. It will be good to examine data/information on the existing small savings infrastructure and on any possible linkages of such savings of the poor with various micro-lending efforts.
Financing SHG-federations
The perceptions and opinions of bankers in context of their approach towards microfinance and the type of support they contemplate are important for the growth of the microfinance sector. In the recent past, SHG-federations have started financial intermediation in addition to social intermediation and there are significant lessons to be learnt. Studies on ‘best practices in SHG-federations’ have also been initiated at the national level. It is important to highlight the progress of lending to SHG-federations by the banks and key issues related to it.
Micro-insurance
Since IRDA enacted the Micro Insurance Regulation five years back, members recommend that it is the right time to have a short survey on the micro-insurance experiences of MFIs and share the results in the report. Besides outreach, claim ratios, claims turn around time, claim rejection ratio and the way in which MFIs subsidize distribution of micro-insurance products could be studied to assess the efficacy of MFIs and need for reviewing regulation on micro insurance.
Cooperatives and local area banks
On cooperatives, members felt that lending by the traditional cooperatives has been below ` 50000 per bor-rower, in most of the cases, but still it is not been recognized as microfinance lending. Recommending for the coverage of cooperatives, it is recognized that multi-state cooperatives could be a good tool to provide multitude of services to rural people. Mentioning about the role of Local Area Bank and importance of its coverage in SOS, members shared about a Coastal Local Area Bank, based in Vijayawada, Andhra Pradesh in context of providing finance at low interest rates with a system of weekly repayment system.
Other recommended areas to be covered in the SOS Report 2010
• Landscape of institutional infrastructure in the country:Mapping of variety of organizations havingdifferent legal entities and levels of functioning, that is, commercial banks, RRBs, Cooperative Banks NBFC-MFIs and NGO-MFIs.
• Analysisofmostdeprived/financiallyexcludedregionsinthecountry:Analysisoforganizations,Banks,NGOs, cooperatives, and so on, in terms of numbers and proximity.
• StatusofBusinessCorrespondent/Facilitatormodelofmicrofinanceandotherinnovationsandexperi-mentation in microfinance lending.
• StatusreportontheimplementationofthecodeofconductbyMFIs:Interestrates,MultipleBorrowings,Recovery Practices adopted.
• Views,opinionandvisionofpolicymakersonmicrofinanceincludingincometaxissues.• RegulationsforMFIs/MFOs:Settingupofindependentregulatory/supervisorybodyforMFIsoutside
the proposed set up in NABARD.• Technology based initiatives: Covering examples of the successful mobile banking experiments like
‘M-Pesa’, Kenya. Horizontal and vertical expansion of experiments like ‘Nokia - Yes Bank Mobile pilot’, Pune, utilizing Financial Inclusion Technology Fund.
• Analysis of governance andmanagement processes in IndianMFIs including corporate governance:Understanding and role of senior management and board members, audit arrangements, consistency of the compensation approaches and ethical values of institutions, incentive structure, recovery practices, grievance redressal and transparency to borrowers, and so on.
• Ananalyticalreviewonraisingequity:prosandconsbetweenmemberdrivenequityandseekingequitysupport from those having commercial agenda with no real concern for social agenda.
• Enumeration of some of the important risk factors in microfinance sector and proactive safetymeasures.
136 MICROFINANCE INDIA
Finally, giving examples of Access Africa programme supported by CARE International, CARE India’s South Asia Microfinance Investment Fund (SATMIF) and the South Asia Resource Team (SART), and many other such network and programmes, members emphasized on including the role of donor agencies in the report. They also recommended for a review on funders performance in terms of allocating funds in different geographical areas.
In a nutshell, microfinance practitioners envisage that SOS 2010, will be a client oriented report covering various microfinance programmes including government initiated schemes, projects of international agen-cies, NABARD promoted SBLP, microfinance products and services, financing SHG-federations, microfi-nance regulations, governance in MFIs and innovative models of microfinance.
Table A.4 List of SOS specific activitiesExperience sharing workshop of private sector and foreign Banks, at CAB Pune done jointly with Access
Development Services.Workshop of Service Providers in Microfinance, with Planet Finance.Round Table of microfinance HR practitioners, at Unitus, Bangalore.Session on SOS with practitioners, arranged by UNSE and UNDP at Jaipur as part of the UNSE Annual
Forum.Round Table with Staff of IFMR group of institutions, arranged by CMF.Query on the UNSE-MF platform in the microfinance and poverty community, asking members to share
their views on structure, content and presentation of SOS 2009 and also information on new models, in-novations and experiments. The query elicited 28 responses.
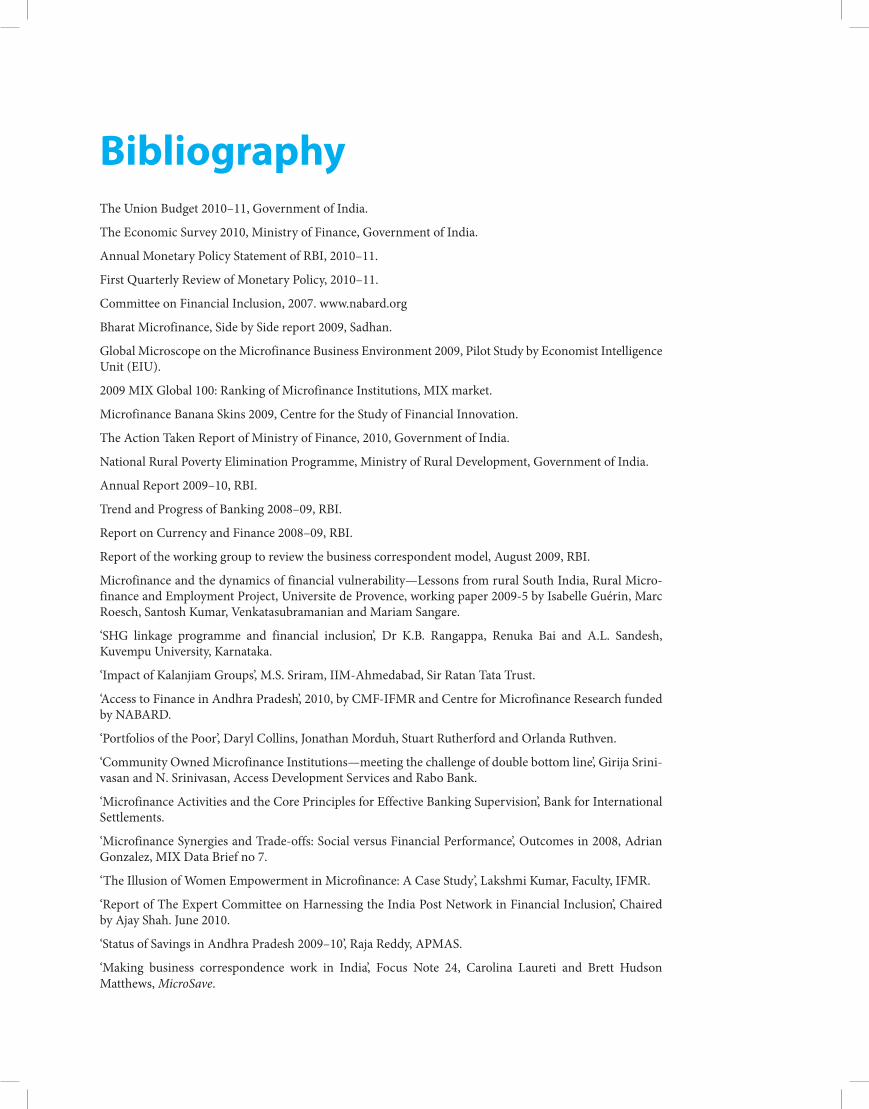
BibliographyThe Union Budget 2010–11, Government of India.
The Economic Survey 2010, Ministry of Finance, Government of India.
Annual Monetary Policy Statement of RBI, 2010–11.
First Quarterly Review of Monetary Policy, 2010–11.
Committee on Financial Inclusion, 2007. www.nabard.org
Bharat Microfinance, Side by Side report 2009, Sadhan.
Global Microscope on the Microfinance Business Environment 2009, Pilot Study by Economist Intelligence Unit (EIU).
2009 MIX Global 100: Ranking of Microfinance Institutions, MIX market.
Microfinance Banana Skins 2009, Centre for the Study of Financial Innovation.
The Action Taken Report of Ministry of Finance, 2010, Government of India.
National Rural Poverty Elimination Programme, Ministry of Rural Development, Government of India.
Annual Report 2009–10, RBI.
Trend and Progress of Banking 2008–09, RBI.
Report on Currency and Finance 2008–09, RBI.
Report of the working group to review the business correspondent model, August 2009, RBI.
Microfinance and the dynamics of financial vulnerability—Lessons from rural South India, Rural Micro-finance and Employment Project, Universite de Provence, working paper 2009-5 by Isabelle Guérin, Marc Roesch, Santosh Kumar, Venkatasubramanian and Mariam Sangare.
‘SHG linkage programme and financial inclusion’, Dr K.B. Rangappa, Renuka Bai and A.L. Sandesh, Kuvempu University, Karnataka.
‘Impact of Kalanjiam Groups’, M.S. Sriram, IIM-Ahmedabad, Sir Ratan Tata Trust.
‘Access to Finance in Andhra Pradesh’, 2010, by CMF-IFMR and Centre for Microfinance Research funded by NABARD.
‘Portfolios of the Poor’, Daryl Collins, Jonathan Morduh, Stuart Rutherford and Orlanda Ruthven.
‘Community Owned Microfinance Institutions—meeting the challenge of double bottom line’, Girija Srini-vasan and N. Srinivasan, Access Development Services and Rabo Bank.
‘Microfinance Activities and the Core Principles for Effective Banking Supervision’, Bank for International Settlements.
‘Microfinance Synergies and Trade-offs: Social versus Financial Performance’, Outcomes in 2008, Adrian Gonzalez, MIX Data Brief no 7.
‘The Illusion of Women Empowerment in Microfinance: A Case Study’, Lakshmi Kumar, Faculty, IFMR.
‘Report of The Expert Committee on Harnessing the India Post Network in Financial Inclusion’, Chaired by Ajay Shah. June 2010.
‘Status of Savings in Andhra Pradesh 2009–10’, Raja Reddy, APMAS.
‘Making business correspondence work in India’, Focus Note 24, Carolina Laureti and Brett Hudson Matthews, MicroSave.
138 MICROFINANCE INDIA
‘From Exclusion To Inclusion With Micropayments’, Unique Identification Authority of India.
‘Microfinance Industry in India’, March 2010, Lok Capital.
‘MFI Pricing and Valuation—an analysis of key drivers’, Discussion Note, Nitin Chaudhary, Suyash Rai, 2009, IFMR Trust.
‘Civil Society Initiatives’, Girija Srinivasan, in Shankar datta and Vipin Sharma (eds), The State of India’s livelihoods: The 4P Report 2008. ACCES and The Livelihood School.
‘2009 MIX Global 100 Composite: Rankings of Microfinance Institutions Dec 2009’, Microfinance Informa-tion Exchange.
‘The Microbanking Bulletin No. 18’, Spring 2010, Microfinance Information Exchange.
‘The India Microfinance Diagnostic 2008’, Rauf Khalaf, Kathrin Haerdle and N. Srinivasan, Frankfurt School of Economiccs and Finance for KFW-IFC.
‘Survey on Technology in Microfinance—Microfinance Insights’, November/December 2009.
‘Speeding Financial Inclusion’, Sameer Kochhar, 2009, Skoch Development Foundation.
‘Cost-Benefit and Usage Behaviour analysis of No Frills Accounts: Study report on Cuddalore district’, S. Thaygarajan and Jayram Venkatesh, 2009, CMF-IFMR.
‘Customer protection in branchless banking—India Background Paper’, N. Srinivasan, 2009, CGA.
‘Business Correspondents and Facilitators: The Story So Far’, Yeshu Bansal and N. Srinivasan, April–June 2009, CAB Calling.
‘Consolidated Reply on Query: State of Sector Report 2010 for Microfinance—Experiences’, Examples Compiled by Navin Anand, Resource Person and Monika Khanna, July 2010, UN Solutions Exchange.
Consolidated Reply on Query: Microfinance through Post-Offices for Financial Inclusion—compiled by Navin Anand, Resource Person and Monika Khanna—UN Solutions Exchange
Microfinance India—State of the Sector Report, 2009.
Microfinance India—State of the Sector Report, 2008.
RBI Banking Statistics, 2009.
NABARD Annual Report, 2008–09.
India Post Annual Report, 2008–09.
Status of Microfinance in India—2008–09, NABARD.
Progress of Primary Agricultural Credit Societies, 2008–09, National Federation of State Cooperative Banks.
Annual Report 2009–10, State Bank of India.
Annul Report 2009–10, HDFC Bank.
Annual Report 2009–10, Ministry of Finance, Government of India.
The 61st Round of NSSO Survey, MOSPI, Government of India.
Impact and Sustainability of SHG Bank Linkage Programme, 2007, carried out by National Council of Applied Economic Research, supported by GTZ and NABARD.
‘Towards an inclusive financial system, Financial Services Demand and Utilisation by India’s Low Income Workforce’, 2007, IIMS Dataworks Research Report www.fwwbindia.org.
‘The Lights and Shades, A Study of SHGs in India’, 2006, EDA Rural Systems and APMAS.
‘Revisiting Bank linked Self Help Groups—A Study of Rajasthan State’, RBI occasional paper, Monsoon 2007, Navin Bhatia, DGM, RBI.

Bibliography 139
‘How India Earns, Spends and Saves’, 2008, NCAER for Max Newyork life.
‘From Strength to strength, SEWA insurance’, Shalini Sinha for ILO, SEWA and Plan International.
Building Security for the Poor, 2007, UNDP.
‘Beyond Good Intentions: Measuring the Social Performance of Microfinance Institutions’, Focus Note Number 41, 2007 C-GAP.
‘Savings Services for the Poor’, Madeline Hirschland and Kumarian Press (eds), Bloomfield.
‘Member Savings’, Rutherford, Stuart, MicroSave Briefing Notes on Grameen II # 2, MicroSave.
State of the Sector, 2006, Prabhu Ghate.
State of the Sector, 2007, Prabhu Ghate.
India Microfinance Review, 2007–08, M-CRIL.
Survey of Small Borrowal Accounts, RBI Bulletin, June 2008–September 2009.
www.indianmicrofinance.com
www.themix.org
www.forbes.com
www.microcapital.org/
www.thehindubusinessline.com
www.microsave.org
www.solutionexchange-un.net.in

About the AuthorN. Srinivasan has been involved with the Development Finance and Rural Development sectors for three decades. He has been associated with several policy and strategy initiatives during his tenure with the RBI and NABARD, of which he was Chief General Manager for seven years. He has also authored the Microfi-nance India: State of the Sector Report 2008 and 2009 brought out by ACCESS Development Services and published by SAGE Publications. He is presently a leading consultant engaged with the World Bank, CGAP, IFAD, ADB, UNDP, UNOPS, GTZ, Microsave and the Government of India. As an advisor, he is on the boards of institutions in the microfinance sector in India and abroad in various capacities such as trustee and director.