microelasticity of red blood cells in sickle cell disease
TRANSCRIPT
Microelasticity of red blood cells in sickle cell diseaseJ L Maciaszek1, B Andemariam2, and G Lykotrafitis1*1Department of Mechanical Engineering, University of Connecticut, Storrs, Connecticut, USA2Department of Medicine, University of Connecticut Health Center, Farmington, Connecticut, USA
The manuscript was received on 10 November 2010 and was accepted after revision for publication on 11 January 2011
DOI: 10.1177/0309324711398809
Abstract: Translation of cellular mechanics findings is crucial in many diseases, includingAlzheimer’s disease, Parkinson’s disease, type II diabetes, malaria, sickle cell disease, andcancer. Atomic force microscopy (AFM) is appropriate for measuring mechanical propertiesof living and fixed cells due to its high force sensitivity and its ability to measure local andoverall properties of individual cells under physiological conditions. A systemic force–displacement curve analysis is reported on the quantification of material stiffness via AFMusing two theoretical models derived from the Hertz model. This analysis was applied to redblood cells from patients with sickle cell disease to determine the Young’s modulus of thesecells in the oxygenated and deoxygenated state. Sickle cell disease pathophysiology is a con-sequence of the polymerization of sickle hemoglobin in red blood cells upon partial deoxy-genation and the impaired flow of these cells in the microcirculation. A model is presentedfor a four-sided pyramidal indenter that is subsequently shown to have a better fit to theobtained data than that using a model of a parabolic indenter. It is concluded that deoxy-genation and therapeutic treatment have a significant impact on the stiffness. This analysispresents a new approach to addressing medical disorders.
Keywords: atomic force microscopy, cellular mechanics, elasticity, Young’s modulus,
nanoindentation
1 INTRODUCTION
A detailed knowledge of the mechanical properties
of the cell is required if an understanding is to
be obtained on how mechanical stresses and
deformations regulate cellular functions including
fundamental cell processes including mechano-
transduction, growth, differentiation, protein and
DNA synthesis, motility, and apoptosis [1, 2]. The
most common approach reported to study cell
mechanics is to determine the stiffness or an
apparent elastic modulus of the cell, assuming that
it is an elastic body. Atomic force microscopy
(AFM) [3] is appropriate for measuring the
mechanical properties of living and fixed cells due to
its high force sensitivity and its ability to measure
local and overall properties of individual cells under
physiological conditions [4–10]. AFM allows simulta-
neous evaluation of the local mechanical properties
and the morphology of the living cells at a high spa-
tial resolution and force sensitivity. The basic tech-
nique for quantitative study of the mechanical
characteristics of cells and tissues via AFM is force–
displacement curve analysis. By recording the force–
displacement curves on the sample surface, vertical
deflection of the cantilever represents a basis for
estimation of a sample’s Young’s modulus. In the
current study, force–displacement curve analysis is
used to explore the pathophysiology of sickle cell
disease. Understanding the relationship between
proteins and cellular material properties will allow
for detection of diseases and new approaches to
addressing medical disorders [11].
*Corresponding author: Department of Mechanical Engineering,
University of Connecticut, 191 Auditorium Road, Unit 3139,
Storrs, CT 06269, USA.
e-mail: [email protected]
368 SPECIAL ISSUE PAPER
J. Strain Analysis Vol. 46
2 SICKLE CELL DISEASE
This paper studies the Young’s modulus of red
blood cells (RBCs, erythrocytes) from patients with
sickle cell disease (SCD), a severe disease caused by
polymerization of abnormal hemoglobin [12],
a globular protein which transports oxygen from
the lungs to tissues [13]. Hemoglobin (Hb) is
formed by two type a and two type b polypeptide
chains. In sickle cell hemoglobin (HbS), the normal
sequence of Val-His-Leu-Thr-Pro-Glu-Glu-Lys is
changed to Val-His-Leu-Thr-Pro-Val-Glu-Lys, with
the amino acid valine substituting for the glutamic
acid in the b6 site. The replacement of two charged
groups by two hydrophobic ones leads to polymeri-
zation of deoxygenated Hb and to formation of long
stiff rod-like fibres [14–16], which force RBCs to
assume a wide variety of irregular shapes [17]. The
fibres form non-covalent cross-links and create
a gel that gives RBCs their irregular shapes and
alters their viscoelastic behaviour, increases their
rigidity, fragility, and cytoadherence [16, 18–21].
Other factors such as lowered pH, RBC dehydration,
and hyperthermia are also known to prompt sick-
ling [22]. Pathology in SCD begins with loss of
deformability and increased cell adherence of the
sickle cells resulting in serious and often life-
threatening complications such as chronic hemo-
lytic anemia and vaso-occlusion [20, 23–25]. People
who display a sickle cell trait (SCT) have only one
abnormal hemoglobin b gene producing thus both
normal hemoglobin (HbA) and sickle hemoglobin
HbS with a prevalence of HbA [26, 27].
In the case of SCD, it has been hypothesized that
increased association of HbS with the membrane
proteins contributes to the change of the mechanical
behaviour of sickle erythrocytes [28]. HbS can alter
the mechanical properties of RBCs not only by
extending the spectrin filaments, and by the interac-
tion between HbS filaments and the lipid bilayer but
also by altering the functionality of the membrane
proteins [29]. It is known that Hb interacts with the
spectrin network via the protein band 3 [30–32] and
the introduction of HbS has recently been found to
have an effect on the mechanical properties of SCT
erythrocytes [33]. In the present study, AFM techni-
ques are used to measure the Young’s modulus of
RBCs from patients with SCD under both oxygenated
and fully deoxygenated conditions.
3 PROBING CELL ELASTICITY USING AFM
In the current work, nanoindentation of RBCs is per-
formed in order to measure the local cell stiffness.
The measurements are performed via AFM by push-
ing a tip onto the surface of the sample at the position
of interest. From the resulting force–displacement
curves the local Young’s modulus is determined.
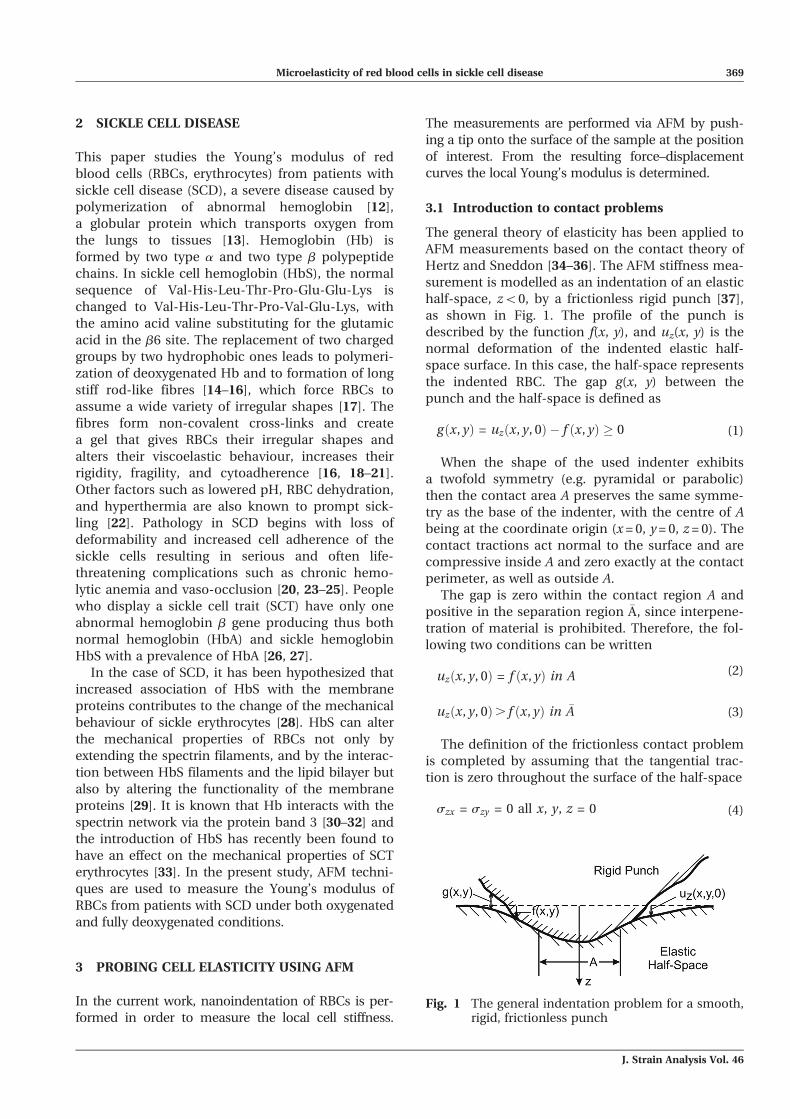
3.1 Introduction to contact problems
The general theory of elasticity has been applied to
AFM measurements based on the contact theory of
Hertz and Sneddon [34–36]. The AFM stiffness mea-
surement is modelled as an indentation of an elastic
half-space, z\0, by a frictionless rigid punch [37],
as shown in Fig. 1. The profile of the punch is
described by the function f(x, y), and uz(x, y) is the
normal deformation of the indented elastic half-
space surface. In this case, the half-space represents
the indented RBC. The gap g(x, y) between the
punch and the half-space is defined as
gðx, yÞ = uzðx, y, 0Þ � f ðx, yÞ � 0 (1)
When the shape of the used indenter exhibits
a twofold symmetry (e.g. pyramidal or parabolic)
then the contact area A preserves the same symme-
try as the base of the indenter, with the centre of A
being at the coordinate origin (x = 0, y = 0, z = 0). The
contact tractions act normal to the surface and are
compressive inside A and zero exactly at the contact
perimeter, as well as outside A.
The gap is zero within the contact region A and
positive in the separation region �A, since interpene-
tration of material is prohibited. Therefore, the fol-
lowing two conditions can be written
uzðx, y, 0Þ = f ðx, yÞ in A (2)
uzðx, y, 0Þ. f ðx, yÞ in �A (3)
The definition of the frictionless contact problem
is completed by assuming that the tangential trac-
tion is zero throughout the surface of the half-space
szx = szy = 0 all x, y, z = 0 (4)
Fig. 1 The general indentation problem for a smooth,rigid, frictionless punch
Microelasticity of red blood cells in sickle cell disease 369
J. Strain Analysis Vol. 46

and that the contact pressure pðx; yÞ= � szzðx, y, 0Þis zero in the separation region �A and positive in
the contact region �A, that is
pðx; yÞ = 0 in �A (5)
pðx; yÞ. 0 in A (6)
If the contact region A is specified, the equality
conditions (2), (4), (5) define a well-posed boundary
value problem for the half-plane which has a unique
solution. Then, the total contact force is obtained by
Pz =
ZZA
p x, yð Þdxdy (7)
The inequalities (3) and (6) serve to determine
the extent of the contact area for the contact prob-
lem, but it has been shown [38] that the value of A,
which satisfies equations (3) and (6), maximizes the
total force Pz given by equation (7).
In the case of a spherical indenter, by solving the
boundary contact problem as performed by Hertz
[35], the following result is obtained
Pz rsð Þ = p0
ffiffiffiffiffiffiffiffiffiffiffiffiffiffiffia2 � r2
s
q(8)
where s = rj j = r2 + r2s � 2rrs cos u + u2
z
� �1=2is the
distance between source (rs, 0, 0) and observation
point r, u, uzð Þ is the angular distance, and
p0 = 2E�
pR 1� v2� �
, where E is the Young’s modulus.
The contact radius, a, is given in terms of the applied
force, F, and the Poisson’s ratio, n, of the sample
a =4
33
1� v2
E3FR
� �1=3
(9)
Sneddon extended the Hertz model from a spherical
indenter to an indenter of arbitrary profile deforming
elastic half-space [36, 39]. Solutions of the boundary
contact problem for other tip geometries with twofold
symmetry generated models for parabolic [40–42] and
pyramidal [39, 43–45] indenters. The general solution
for force as a function of indentation for a parabolic
indenter can be approximated as
Fparabolic =4
3
ffiffiffiffiffiffiffiffiRE 0p
u3=2z (10)
where E# is the reduced Young’s modulus of the
tip–sample system defined as
1
E 0=
1� v2
E(11)
The general solution for force as a function of
indentation for a pyramidal indenter [43–45] can be
approximated as
Fpyramid =3E tan u
4 1� v2ð Þu2z (12)
3.2 Contact problems in AFM
In a force curve on a sample indented via AFM, the
indentation, uz, is equal to
uz = d � d (13)
where d is the deflection of the cantilever on the
rigid substrate and d is the deflection of the cantile-
ver on the indented half-space. In this particular
study, d is the deflection of the cantilever on the
poly-l-lysine coated mica substrate and d is the
deflection of the cantilever on the indented erythro-
cyte surface.
Three important assumptions used in the Hertz–
Sneddon model are:
(a) the indenter must have a parabolic shape;
(b) the indented sample is assumed to be
extremely thick in comparison to the indenta-
tion depth;
(c) there is no adhesive interaction between the
sample and the indenter.
The first assumption remains a valid one for the
case when a spherical tip radius is much larger than
the indentation depth (uz\0.3R) [46]. The second
assumption states that elastic models based on
Hertz–Sneddon contact mechanics are accurate
when the indentation depth is small compared to the
thickness of the cell. This corresponds with the well-
known fact that the effect of the substrate over which
the cells are placed is negligible if the indentation
depth is less than 10 per cent of the total thickness of
the specimen [47]. In cases where the third assump-
tion is not satisfied, the Johnson–Kendall–Roberts
(JKR) model should be applied to incorporate the
effect of adhesion [48]. The JKR model considers
the effect of contact pressure and adhesion within
the area of contact. In the current study, no pull-off
or rupture forces were observed in the experimental
force–distance curves as shown in Fig. 2. This can be
attributed to the fact that the AFM indenter used in
these experiments was not functionalized. Therefore,
the Hertz–Sneddon model appropriately describes
the measurements in the present study.
370 J L Maciaszek, B Andemariam, and G Lykotrafitis
J. Strain Analysis Vol. 46

While in the current work only the elastic behav-
iour of RBCs is studied, RBCs have been found to
exhibit viscoelastic behaviour under repetitive
deformations [49]. The viscoelastic properties of
normal RBCs have been studied via magnetic twist-
ing cytometry. Results indicate that G#, the storage
modulus which represents the Young’s modulus, is
nearly constant for different frequencies, whereas
G$, the loss modulus, increases with frequency
[50]. This result suggests that the measurement of
the effective Young’s modulus presented in this
work remains valid when repetitive loading is
applied, at least for normal RBCs. Finally, it should
be noted that AFM has been used to measure the
viscoelastic behaviour of epithelial cells [44, 45]. In
principle, the used methods can be used to perform
viscoelasticity measurements on normal and path-
ological RBCs.
3.2.1 Parabolic tip
When the shape of the AFM tip is approximated by
a paraboloid with a radius of curvature R at the
apex, the force Fparabolic as a function of indentation
uz is described by the following equation [40–42]
Fparabolic =4
3
ffiffiffiffiffiffiffiffiRE 0p
u3=2z (14)
where E# is the reduced Young’s modulus of the
tip–sample system defined as
1
E 0=
1� v2sample
Etip+
1� v2sample
Esample
(15)
where Etip, ntip, and Esample, nsample are the Young’s
moduli and the Poisson’s ratios for the materials of
the tip and the sample, respectively. If Esample�Etip
(in the case of Si3N4 tips, the Young’s modulus is
150 GPa [51]), E# can be simplified to
E =Esample
1� v2sample
(16)
Poisson’s ratio, n, is defined as the ratio of the
transverse, or orthogonal, strain to the strain along
the direction of elongation. It is useful for determin-
ing how much the material extends orthogonally to
the direction in which the force is applied. The
value of n is always between zero and 0.5 [52, 53].
3.2.2 Pyramidal tip
When the shape of the AFM tip is a four-sided pyra-
midal indenter, the force Fpyramid as a function of
indentation uz is described by the following equa-
tion [39, 43–45]
Fpyramid =3E tan u
4 1� v2ð Þu2z (17)
with an effective radius of contact a = uz tan u� ffiffiffi
2p
with u defined as nominal angle of the pyramidal
geometry [43–45].
4 METHODS
Experiments were carried out using an Asylum
MFP 3D-BIO (Asylum Research, Santa Barbara,
California) AFM equipped with a ‘liquid cell’ set-up.
4.1 RBC preparation
Whole blood was drawn from patients with
SCD during clinical visits to the Lea Center for
Hematologic Disorders at the University of
Connecticut Health Center (UCHC) following the
guidelines of the Human Subjects Protection Office
at UCHC. Blood was drawn by venipuncture into
5 IU/ml heparin and centrifuged at 400 g for 15 min
at 25 �C to isolate the RBCs. The yellowish superna-
tant containing plasma and the white fluffy coat on
the pellet was discarded. All buffers were pre-
warmed to 37 �C prior to use. RBCs were washed
three times with phosphate-buffered saline (PBS)
and finally re-suspended in PBS at a concentration
of 5 per cent. Deoxygenated RBCs were obtained by
bubbling N2 through a suspension of RBCs in
a sealed flask for 1 h. The state of deoxygenation of
the erythrocytes was expected to be maintained for
1–1.5 h [54] and experiments were performed
during this time.
Fig. 2 Force–distance curves obtained during theretraction cycle of the indention. The absence ofa pull-off force, or rupture force, indicates thatthere is no adhesion present between thesample and the indenter during experimentation
Microelasticity of red blood cells in sickle cell disease 371
J. Strain Analysis Vol. 46

4.2 Erythrocyte immobilization
Cells were immobilized on AFM grade mica
(Novascan Technologies, Inc., Ames, Iowa) coated
with poly-l-lysine (PLL) (Sigma-Aldrich, St. Louis,
Missouri) to increase cell adherence. 150 ml of 1 mg/
ml PLL solution was allowed to adsorb for 5 min to
an unmodified mica surface, and excess solution
was drained away. RBCs of 0.5 per cent concentration
in PBS were allowed to adhere to each PLL-coated
mica surface for 10 min in the incubator. Unattached
cells were removed by gentle rinsing of the slide with
PBS solution at 25 �C. For imaging, fixation was per-
formed by a 1 min treatment of the cells with 0.5 per
cent glutaraldehyde (Sigma-Aldrich, St. Louis,
Missori) in PBS buffer. The sample was again rinsed
several times with PBS and a volume of PBS was
added for experiments. Glutaraldehyde was not
employed for stiffness measurements.
4.3 Imaging
Erythrocytes were imaged in tapping mode with
a scan rate of 0.2 Hz, and the minimal force neces-
sary to obtain good image contrast was determined
by gradually increasing the force applied to the
sample from zero force (non-contact) to the neces-
sary minimal force. Silicon nitride probes with a nom-
inal spring constant of 0.01 N/m (Veeco Probes,
Camarillo, California) were employed for imaging.
4.4 Measurements
Erythrocyte’s stiffness measurements were carried out
in contact mode using silicon nitride cantilevers with
a nominal spring constant of 0.03 N/m (Veeco Probes,
Camarillo, California). Exact values for the cantilever
spring constants were obtained via a thermal-noise-
based method implemented by the manufacturer and
were used in all calculations. Probes had nominal tip
radii R of 20 nm and nominal angle u of 20�, as pro-
vided by the manufacturer. Tip height was 2.5 mm, as
provided by the manufacturer. All measurements
were performed in PBS at 25 �C. Local elastic proper-
ties of erythrocytes were quantitatively determined
from the force–distance curves. The force curves were
generated at a loading rate of 15 000 pN/s, and for
both the oxygenated and deoxygenated states more
than 500 measurements were collected.
4.5 Data processing
Data was imported into MATLAB (The MathWorks,
Natick, Massachusetts) and the value of E was
obtained by fitting the theoretical curves generated
by equation (2) and equation (5) to the
experimental data up to a minimum depth of
250 nm, which is approximately 10 per cent of the
total thickness of the cell. The method is in agree-
ment with the well-known fact that the effect of the
substrate over which the cells are placed is negligi-
ble if the indentation depth is less than 10 per cent
of the total thickness of the specimen [47].
5 RESULTS
5.1 Morphology of SCD erythrocytes via
AFM imaging
Under both oxygenated and deoxygenated states,
highly irregular morphologies were observed in the
RBC samples. Normal RBCs are characterized by
a biconcave shape which not only increases the sur-
face area and facilitates O2 and CO2 diffusion into
and out of the cell [55, 56] but also increases the
compliance of the erythrocytes [57]. Polymerization
of Hb fibres forces RBCs to assume a wide variety of
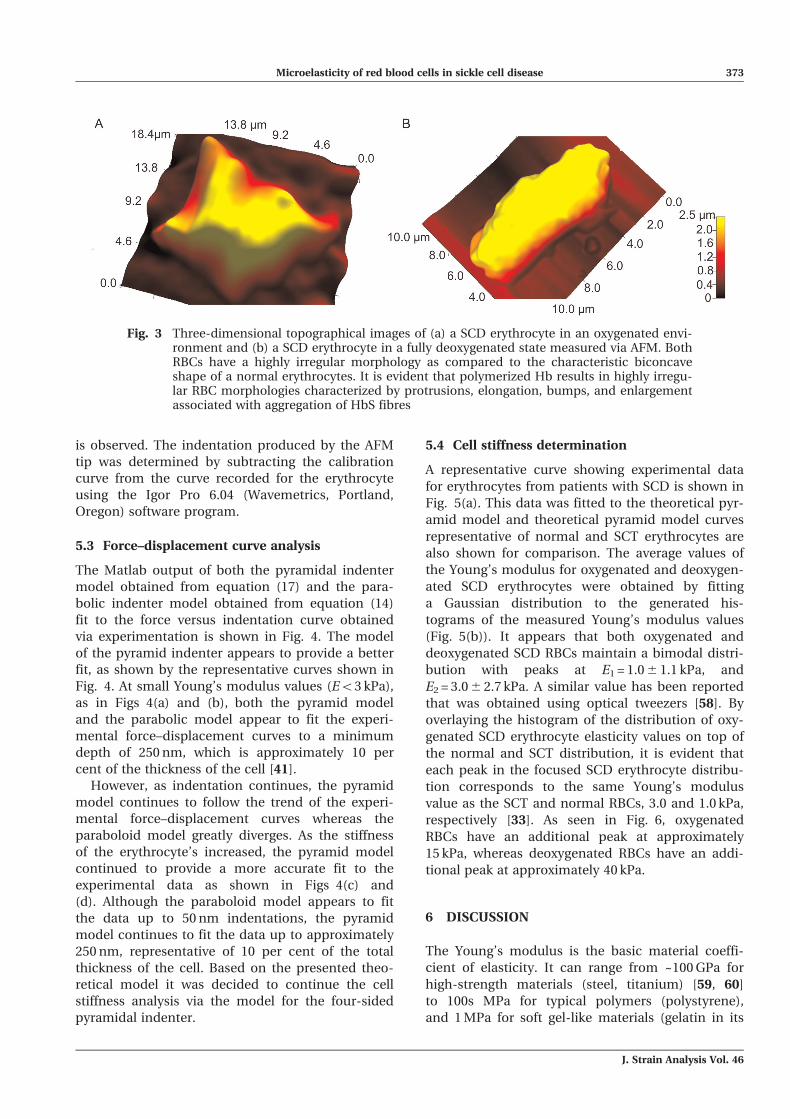
irregular shapes [17]. Two representative examples
are shown in Fig. 3. Repeated cycles of oxygenation
and deoxygenation lead to irreversible sickling,
a phenomenon that it is thought to have occurred
to the erythrocyte in Fig. 3(a), imaged under oxy-
genated conditions. This cell is characterized by
protrusions likely resulting from polymerized Hb
fibres and also an enlarged morphology. Upon
deoxygenation, as in Fig. 3(b), HbS fibres are
expected to polymerize and aggregate, thus forming
the highly elongated and irregular structure shown.
In addition, this cell also contains bumps and sur-
face irregularities which are possibly associated
with protruding polymerized HbS fibres and
changes in the RBC membrane cortex.
5.2 Determination of the indentation depth
The quantitative determination of the elastic prop-
erties of a particular material can be obtained from
the relationship between the applied force F and
the indentation depth d using equation (14) and
equation (17). When force is measured on a hard
substrate, the cantilever deflection is proportional
to the relative sample position resulting in a linear
slope for the portion of the curve where the tip and
the sample are in contact. When soft samples such
as erythrocytes are investigated, the recorded canti-
lever deflection as a function of the relative sample
position is not linear owing to the deformable struc-
ture of the RBC. Prior to taking force measurements
on the RBC surface, the force is measured on the
PLL-coated mica substrate. This curve is used for
calibration since no permanent sample deformation
372 J L Maciaszek, B Andemariam, and G Lykotrafitis
J. Strain Analysis Vol. 46
is observed. The indentation produced by the AFM
tip was determined by subtracting the calibration
curve from the curve recorded for the erythrocyte
using the Igor Pro 6.04 (Wavemetrics, Portland,
Oregon) software program.
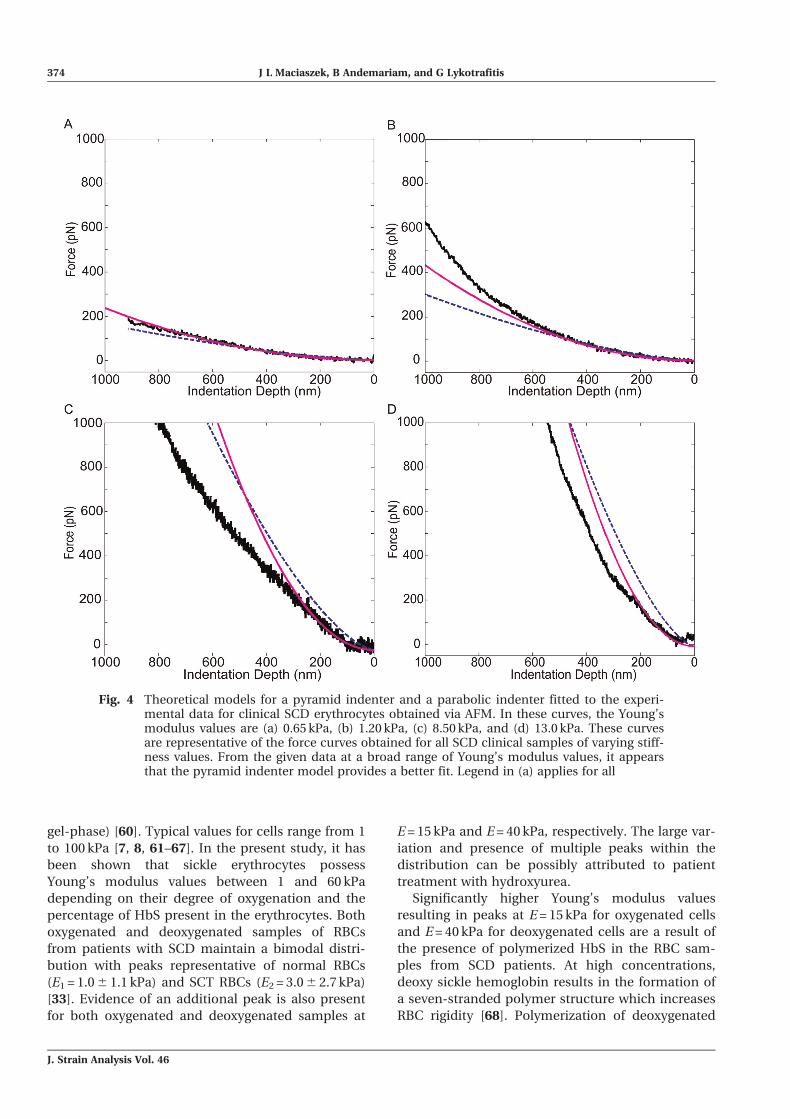
5.3 Force–displacement curve analysis
The Matlab output of both the pyramidal indenter
model obtained from equation (17) and the para-
bolic indenter model obtained from equation (14)
fit to the force versus indentation curve obtained
via experimentation is shown in Fig. 4. The model
of the pyramid indenter appears to provide a better
fit, as shown by the representative curves shown in
Fig. 4. At small Young’s modulus values (E\3 kPa),
as in Figs 4(a) and (b), both the pyramid model
and the parabolic model appear to fit the experi-
mental force–displacement curves to a minimum
depth of 250 nm, which is approximately 10 per
cent of the thickness of the cell [41].
However, as indentation continues, the pyramid
model continues to follow the trend of the experi-
mental force–displacement curves whereas the
paraboloid model greatly diverges. As the stiffness
of the erythrocyte’s increased, the pyramid model
continued to provide a more accurate fit to the
experimental data as shown in Figs 4(c) and
(d). Although the paraboloid model appears to fit
the data up to 50 nm indentations, the pyramid
model continues to fit the data up to approximately
250 nm, representative of 10 per cent of the total
thickness of the cell. Based on the presented theo-
retical model it was decided to continue the cell
stiffness analysis via the model for the four-sided
pyramidal indenter.
5.4 Cell stiffness determination
A representative curve showing experimental data
for erythrocytes from patients with SCD is shown in
Fig. 5(a). This data was fitted to the theoretical pyr-
amid model and theoretical pyramid model curves
representative of normal and SCT erythrocytes are
also shown for comparison. The average values of
the Young’s modulus for oxygenated and deoxygen-
ated SCD erythrocytes were obtained by fitting
a Gaussian distribution to the generated his-
tograms of the measured Young’s modulus values
(Fig. 5(b)). It appears that both oxygenated and
deoxygenated SCD RBCs maintain a bimodal distri-
bution with peaks at E1 = 1.0 6 1.1 kPa, and
E2 = 3.0 6 2.7 kPa. A similar value has been reported
that was obtained using optical tweezers [58]. By
overlaying the histogram of the distribution of oxy-
genated SCD erythrocyte elasticity values on top of
the normal and SCT distribution, it is evident that
each peak in the focused SCD erythrocyte distribu-
tion corresponds to the same Young’s modulus
value as the SCT and normal RBCs, 3.0 and 1.0 kPa,
respectively [33]. As seen in Fig. 6, oxygenated
RBCs have an additional peak at approximately
15 kPa, whereas deoxygenated RBCs have an addi-
tional peak at approximately 40 kPa.
6 DISCUSSION
The Young’s modulus is the basic material coeffi-
cient of elasticity. It can range from ~100 GPa for
high-strength materials (steel, titanium) [59, 60]
to 100s MPa for typical polymers (polystyrene),
and 1 MPa for soft gel-like materials (gelatin in its
Fig. 3 Three-dimensional topographical images of (a) a SCD erythrocyte in an oxygenated envi-ronment and (b) a SCD erythrocyte in a fully deoxygenated state measured via AFM. BothRBCs have a highly irregular morphology as compared to the characteristic biconcaveshape of a normal erythrocytes. It is evident that polymerized Hb results in highly irregu-lar RBC morphologies characterized by protrusions, elongation, bumps, and enlargementassociated with aggregation of HbS fibres
Microelasticity of red blood cells in sickle cell disease 373
J. Strain Analysis Vol. 46
gel-phase) [60]. Typical values for cells range from 1
to 100 kPa [7, 8, 61–67]. In the present study, it has
been shown that sickle erythrocytes possess
Young’s modulus values between 1 and 60 kPa
depending on their degree of oxygenation and the
percentage of HbS present in the erythrocytes. Both
oxygenated and deoxygenated samples of RBCs
from patients with SCD maintain a bimodal distri-
bution with peaks representative of normal RBCs
(E1 = 1.0 6 1.1 kPa) and SCT RBCs (E2 = 3.0 6 2.7 kPa)
[33]. Evidence of an additional peak is also present
for both oxygenated and deoxygenated samples at
E = 15 kPa and E = 40 kPa, respectively. The large var-
iation and presence of multiple peaks within the
distribution can be possibly attributed to patient
treatment with hydroxyurea.
Significantly higher Young’s modulus values
resulting in peaks at E = 15 kPa for oxygenated cells
and E = 40 kPa for deoxygenated cells are a result of
the presence of polymerized HbS in the RBC sam-
ples from SCD patients. At high concentrations,
deoxy sickle hemoglobin results in the formation of
a seven-stranded polymer structure which increases
RBC rigidity [68]. Polymerization of deoxygenated
Fig. 4 Theoretical models for a pyramid indenter and a parabolic indenter fitted to the experi-mental data for clinical SCD erythrocytes obtained via AFM. In these curves, the Young’smodulus values are (a) 0.65 kPa, (b) 1.20 kPa, (c) 8.50 kPa, and (d) 13.0 kPa. These curvesare representative of the force curves obtained for all SCD clinical samples of varying stiff-ness values. From the given data at a broad range of Young’s modulus values, it appearsthat the pyramid indenter model provides a better fit. Legend in (a) applies for all
374 J L Maciaszek, B Andemariam, and G Lykotrafitis
J. Strain Analysis Vol. 46

HbS is dependent on intraerythrocytic HbS concen-
tration, degree of cell oxygenation, pH, and the
intracellular concentration of HbF. Polymerized
HbS fibres form non-covalent cross-links and create
a gel that results in increased rigidity of RBCs [16,
18–21]. In addition, spectrin, which is the main pro-
tein responsible for the mechanical strength of the
erythrocyte, has been found to bind to hemoglobin
via the band 3 protein that binds almost exclusively
to hemoglobin fibres [32, 69]. Thus, in the deoxy-
genated state, interaction between the HbS fibres
that are connected to the membrane and the
HbS fibres in the cytoplasm could also contribute
to the measured increase in stiffness [70]. The data
obtained in this study shows evidence of a minimal
doubling of the Young’s modulus upon full deoxy-
genation of SCD erythrocytes. This can present
major problems in SCD patients because rigid
sickle RBC can cause microcirculatory obstruction,
resulting in vaso-occlusive crisis.
The small Young’s modulus values found in the
present study for both oxygenated and deoxygen-
ated SCD erythrocytes are likely due to hydroxyurea
treatment, a variable in the obtained clinical sam-
ples. Hydroxyurea is the only approved medication
Fig. 5 Experimental data for Young’s modulus. (a) The data shows the theoretical pyramidmodel (equation (4)) fitted to the experimental data for normal, SCT, and SCD erythro-cytes. In these curves, the Young’s modulus values for the normal, SCT, and both oxy-genated and deoxygenated SCD RBCs are 1.30, 3.30, and 7.0 kPa, respectively. Curvesshown are representative of the 500–600 force curves obtained for each normal andSCT RBCs, and 1000 + curves for SCD clinical samples. (b) Histograms of the Young’smodulus values determined for RBCs from normal, SCT, and both oxygenated anddeoxygenated SCD erythrocytes. Values for normal RBCs are Enormal = 1.10 6 0.40 kPaand SCT RBCs are ESCT = 3.05 6 1.09 kPa. SCD clinical samples reveal a bimodal distri-bution with E1 = 1.0 6 1.1 kPa, and E2 = 3.0 6 2.7 kPa, as well as higher (E . 7.0 kPa)values
Fig. 6 Histograms of the Young’s modulus deter-mined for SCD RBCs maintained in oxygen-ated and deoxygenated environments. TheYoung’s modulus values obtained from fit-ting the theoretical pyramid indenter model tothe experimental data were fitted with theGaussian distribution. The full distributionshows evidence of an additional peak appear-ing around 15 kPa for the oxygenated RBCsand 40 kPa for the deoxygenated RBCs
Microelasticity of red blood cells in sickle cell disease 375
J. Strain Analysis Vol. 46
for the treatment of SCD in adults; there are no
approved drugs for children [71, 72]. Hydroxyurea
stimulates the production of fetal hemoglobin
(HbF) in patients with SCD, which inhibits sickling
[73] by preventing effective contact between adja-
cent HbS molecules and also by forming mixed
hybrids with HbS that have greater solubility than
HbS polymers [72]. Increases in HbF contribute to
an increase in total Hb and a decrease in hemolysis
with the release of free hemoglobin [71]. It has been
proposed that hydroxyurea increases HbF indirectly
by killing rapidly dividing late erythroid cells, caus-
ing recruitment of more primitive erythroid precur-
sors which in turn produce high levels of HbF, or by
acting directly on the primitive precursors thereby
stimulating HbF production, the exact mechanism
by which hydroxyurea induces HbF is unclear [72].
7 CONCLUSIONS
In summary, the present study suggests a significant
impact of deoxy sickle hemoglobin in significantly
increasing the rigidity of SCD erythrocytes, thus
resulting in vaso-occlusive crisis. The presented
data leads to the conclusion that Young’s moduli
and standard deviations were E1 = 1.0 6 1.1 kPa and
E2 = 3.0 6 2.7 kPa for both oxygenated and deoxy-
genated SCD erythrocytes. Deoxygenated SCD ery-
throcytes also possessed an additional peak at
E = 40 kPa, whereas oxygenated SCD erythrocytes
possessed an additional peak at the significantly
lower value of E = 15 kPa. However, in contrast to
normal RBCs and SCT RBCs, SCD erythrocytes sub-
stantially deviate from the characteristic biconcave
shape and possess highly irregular morphologies
characterized by protrusions, elongation, bumps,
and enlargement associated with aggregation of
HbS fibres.
� Authors 2011
REFERENCES
1 Janmey, P. A. The cytoskeleton and cell signaling:component localization and mechanical coupling.Physiol. Rev., 1998, 78(3), 763–781.
2 Huang, S. and Ingber, D. E. The structural andmechanical complexity of cell-growth control.Nature Cell Biol., 1999, 1(5), E131–E138.
3 Binnig, G., Quate, C. F., and Gerber, C. Atomicforce microscope. Phys. Rev. Lett., 1986, 56, 930–933.
4 Suresh, S. Nanomedicine - elastic clues in cancerdetection. Nature Nanotechnol., 2007, 2(12), 748–749.
5 Radmacher, M. Measuring the elastic properties ofbiological samples with the AFM. IEEE Engng Med.Biol. Mag., 1997, 16(2), 47–57.
6 Rotsch, C., Braet, F., Wisse, E., and Radmacher, M.et al. AFM imaging and elasticity measurementson living rat liver macrophages. Cell Biol. Int.,1997, 21(11), 685–696.
7 Radmacher, M., Fritz, M., Kacher, C. M.,Cleveland, J. P., and Hansma, P. K. Measuring theviscoelastic properties of human platelets with theatomic force microscope. Biophys. J., 1996, 70(1),556–567.
8 Cross, S. E., Jin, Y. S., Rao, J., and Gimzewski,J. K. Nanomechanical analysis of cells from cancerpatients. Nature Nanotechnol., 2007, 2(12), 780–783.
9 Iyer, S., Gaikwad, R. M., Subba-Rao, V.,Woodworth, C. D., and Sokolov, I. Atomic forcemicroscopy detects differences in the surfacebrush of normal and cancerous cells. Nature Nano-technol., 2009, 4(6), 389–393.
10 Li, Q. S., Lee, G. Y. H., Ong, C. N., and Lim, C. T.AFM indentation study of breast cancer cells. Bio-chem. Biophys. Res. Commun., 2008, 374(4), 609–613. DOI: 10.1016/j.bbrc.2008.07.078.
11 Buehler, M. J. and Yung, Y. C. Deformation andfailure of protein materials in physiologicallyextreme conditions and disease. Nature Mater.,2009, 8(3), 175–188.
12 Steinberg, M. H. and Brugnara, C. Pathophysio-logical-based approaches to treatment of sickle celldisease. Ann. Rev. Med., 2003, 54(1), 89–112.
13 Alberts, B., Johnson, A., Lewis, J., Ralf, M.,Roberts, K., and Walter, P. Molecular biology ofthe cell, 2002 (Garland, New York).
14 Ferrone, F. A. Polymerization and sickle cell dis-ease: a molecular view. Microcirculation, 2004,11(2), 115–128.
15 Noguchi, C. T. and Schechter, A. N. Sickle hemoglo-bin polymerization in solution and in cells. Ann. Rev.Biophys. Biophys. Chem., 1985, 14, 239–263.
16 Turner, M. S., Wang, J. C., Jones, C. W., Ferrone,F. A., Josephs, R., and Briehl, R. W. Fluctuationsin self-assembled sickle hemoglobin fibers. Lang-muir, 2002, 18(19), 7182–7187.
17 Christoph, G. W., Hofrichter, J., and Eaton, W. A.Understanding the shape of sickled red cells. Bio-phys. J., 2005, 88(2), 1371–1376.
18 Wang, J. C., Turner, M. S., Agarwal, G., Kwong, S.,Josephs, R., Ferrone, F. A., and Briehl, R. W.Micromechanics of isolated sickle cell hemoglobinfibers: bending moduli and persistence lengths.J. Molec. Biol., 2002, 315(4), 601–612.
19 Jones, C. W., Wang, J. C., Ferrone, F. A., Briehl,R. W., and Turner, M. S. Interactions betweensickle hemoglobin fibers. Faraday Discuss., 2003,123, 221–236.
20 Aprelev, A., Rotter, M. A., Etzion, Z., Bookchin, R.M., Briehl, R. W., and Ferrone, F. A. The effectsof erythrocyte membranes on the nucleation ofsickle hemoglobin. Biophys. J., 2005, 88(4), 2815–2822.
376 J L Maciaszek, B Andemariam, and G Lykotrafitis
J. Strain Analysis Vol. 46
21 Wang, J. C., Kwong, S., Ferrone, F. A., Turner, M.S., and Briehl, R. W. Fiber depolymerization: frac-ture, fragments, vanishing times, and stochasticsin sickle hemoglobin. Biophys. J., 2009, 96(2), 655–670.
22 Connes, P., Reid, H., Hardy-Dessources, M. D.,Morrison, E., and Hue, O. Physiological responsesof sickle cell trait carriers during exercise. SportsMed., 2008, 38(11), 931–946.
23 Embury, S. H. The clinical pathophysiology ofsickle-cell disease. Ann. Rev. Med., 1986, 37,361–376.
24 Kaul, D. K., Fabry, M. E., and Nagel, R. L. Thepathophysiology of vascular obstruction in thesickle syndromes. Blood Rev., 1996, 10(1), 29–44.
25 Ballas, S. K. and Mohandas, N. Pathophysiology ofvaso-occlusion. Hematol.-Oncol. Clinics N. Am.,1996, 10(6), 1221–1239.
26 Neel, J. V., Wells, I. C., and Itano, H. A. Familialdifferences in the proportion of abnormal hemo-globin present in the sickle cell trait. J. Clin.Invest., 1951, 30(10), 1120–1124.
27 Wells, I. C. and Itano, H. A. Ratio of sickle-cellanemia hemoglobin to normal hemoglobin in sick-lemics. J. Biol. Chem., 1951, 188(1), 65–74.
28 Mohandas, N. and Evans, E. Mechanical-proper-ties of the red-cell membrane in relation tomolecular-structure and genetic-defects. Ann. Rev.Biophys. Biomed., 1994, 23, 787–818.
29 Statius Van Eps, L. W. Sickle cell disease. In Atlasof diseases of the kidney (Ed. Schrier, R. W.), vol. 4,Current Medicine, Inc., Philadelphia, 1999.
30 Fortier, N., Snyder, L. M., Garver, F., Kiefer, C.,McKenney, J., and Mohandas, N. The relationshipbetween in vivo generated hemoglobin skeletalprotein complex and increased red-cell membranerigidity. Blood, 1988, 71(5), 1427–1431.
31 Snyder, L. M., Leb, L., Piotrowski, J.,Sauberman, N., Liu, S. C., and Fortier, N. L. Irre-versible spectrin hemoglobin crosslinking in vivo -a marker for red-cell senescence. Br. J. Haematol.,1983, 53(3), 379–384.
32 Walder, J. A., Chatterjee, R., Steck, T. L., Low, P.S., Musso, G. F., Kaiser, E. T., Rogers, P. H., andArnone, A. The interaction of hemoglobin with thecytoplasmic domain of band-3 of the human-erythrocyte membrane. J. Biol. Chem., 1984,259(16), 238–246.
33 Maciaszek, J. L. and Lykotrafitis, G. Sickle celltrait erythrocytes are significantly stiffer thannormal. J. Biomech., 2011, 44(4), 657–661.
34 Timoshenko, S. P. and Goodier, J. N. Theory ofelasticity, third edition, 1970 (McGraw-Hill, NewYork).
35 Hertz, H. On the contact of elastic solids. J. ReineAng. Math., 1881, 92, 156–171.
36 Sneddon, I. The relation between load and pene-tration in axisymmetric Boussinesq problem fora punch of arbitrary profile. Int. J. Engng Sci., 1965,3, 47–57.
37 Barber, J. R. and Billings, D. A. An approximatesolution for the contact area elastic compliance of
a smooth punch of arbitrary shape. Int. J. Mech.Sci., 1990, 32(12), 991–997.
38 Barber, J. R. Determining the contact area inelastic-indentation problems. J. Strain Anal., 1974,9(4), 230–232.
39 Giannakopoulos, A. E. Elastic and viscoelasticindentation of flat surfaces by pyramid indentors.J. Mech. Phys. Solids, 2006, 54(7), 1305–1332.
40 Dulinska, I., Targosz, M., Strojny, W., Lekka, M.,Czuba, P., Balwierz, W., and Szymonski, M. Stiff-ness of normal and pathological erythrocytes stud-ied by means of atomic force microscopy.J. Biochem. Biophys. Methods, 2006, 66(1–3), 1–11.
41 Hategan, A., Law, R., Kahn, S., and Discher, D. E.Adhesively-tensed cell membranes: lysis kineticsand atomic force microscopy probing. Biophys. J.,2003, 85(4), 2746–2759.
42 Kuznetsova, T. G., Starodubtseva, M. N., Yego-renkov, N. I., Chizhik, S. A., and Zhdanov, R. I.Atomic force microscopy probing of cell elasticity.Micron, 2007, 38, 824–833.
43 Bilodeau, G. G. Regular pyramid punch problem.J. Appl. Mech., 1992, 59(3), 519–523.
44 Rico, F., Roca-Cusachs, P., Gavara, N., Farre, F.,Rotger, M., and Navajas, D. Probing mechanicalproperties of living cells by atomic force micros-copy with blunted pyramidal cantilever tips. Phys.Rev. E, Stat. Nonlinear Sost Matter Phys., 2005,72(2), 1–10.
45 Alcaraz, J., Buscemi, L., Grabulosa, M., Trepat, X.,Fabry, B., Farre, R., and Navajas, D. Microrheol-ogy of human lung epithelial cells measured byatomic force microscopy. Biophys. J., 2003, 84(3),2071–2079.
46 Mahaffy, R. E., Shih, C. K., Mackintosh, F. C., andKas, J. Scanning probe-based frequency-depen-dent microrheology of polymer gels and biologicalcells. Phys. Rev. Lett., 2000, 85(4), 880–883.
47 Dimitriadis, E. K., Horkay, F., Maresca, J.,Kachar, B., and Chadwick, R. S. Determination ofelastic moduli of thin layers of soft material usingthe atomic force microscope. Biophys. J., 2002,82(5), 2798–2810.
48 Johnson, K. L., Kendall, K., and Roberts, A. D.Surface energy and the contact of elastic solids.Proc. Roy. Soc. Lond. A, Math. Phys. Sci., 1971,324(1558), 301–313.
49 Puig-de-Morales-Marinkovic, M., Turner, K. T.,Butler, J. P., Fredberg, J. J., and Suresh, S. Visco-elasticity of the human red blood cell. Am. J. Phy-siol.-Cell Physiol., 2007, 293(2), C597–C605.
50 Zhu, C., Bao, G., and Wang, N. Cell mechanics:mechanical response, cell adhesion, and moleculardeformation. Ann. Rev. Biomed. Engng, 2000, 2,189–226.
51 Vinckier, A. and Semenza, G. Measuring elasticityof biological materials by atomic force microscopy.FEBS Lett., 1998, 430(1–2), 12–16.
52 Heuberger, M., Dietler, G., and Schlapbach, L.Mapping the local Young’s modulus by analysis ofthe elastic deformations occurring in atomic-forcemicroscopy. Nanotechnology, 1995, 6(1), 12–23.
Microelasticity of red blood cells in sickle cell disease 377
J. Strain Analysis Vol. 46

53 Vanlandingham, M. R., Mcknight, S. H., Pal-mese, G. R., Elings, J. R., Huang, X., Bogetti, T. A.,Eduljee, R. F., and Gillespie, J. W. Nanoscaleindentation of polymer systems using the atomicforce microscope. J. Adhes., 1997, 64(1-4), 31–59.
54 Tuvia, S., Levin, S., and Korenstein, R. Oxygena-tion-deoxygenation cycle of erythrocytes modu-lates submicron cell-membrane fluctuations.Biophys. J., 1992, 63(2), 599–602.
55 Mohandas, N. and Gallagher, P. G. Red cell mem-brane: past, present, and future. Blood, 2008,112(10), 3939–3948.
56 Alberts, B., Bray, D., Lewis, J., Raff, M.,Roberts, K., and Walter, P. Molecular biology ofthe cell, 1983 (Garland Science, London).
57 Li, J., Dao, M., Lim, C. T., and Suresh, S. Spectrin-level modeling of the cytoskeleton and opticaltweezers stretching of the erythrocyte. Biophys. J.,2005, 88(5), 3707–3719.
58 Dao, M., Lim, C. T., and Suresh, S. Mechanics ofthe human red blood cell deformed by opticaltweezers. J. Mech. Phys. Solids, 2003, 51(11-12),2259–2280.
59 Gray, D. E. American Institute of Physics handbook,1972 (McGraw-Hill, New York).
60 Fung, Y. C. Biomechanics: mechanical properties ofliving tissues, 1981 (Springer, New York).
61 Cai, X. F., Xing, X. B., Cai, J. Y., Chen, Q., Wu, S.,and Huang, F. Connection between biomechanicsand cytoskeleton structure of lymphocyte andjurkat cells: an AFM study. Micron, 2010, 41(3),257–262.
62 Cai, X. F., Yang, X. X., Cai, J. Y., Wu, S., andChen, Q. Atomic force microscope-related studymembrane-associated cytotoxicity in human ptery-gium fibroblasts induced by mitomycin c. J. PhysChem B, 2010, 114(11), 3833–3839.
63 Schafer, A. and Radmacher, M. Influence ofmyosin ii activity on stiffness of fibroblast cells.Acta Biomater., 2005, 1(3), 273–280.
64 Yim, E. K. F., Darling, E. M., Kulangara, K.,Guilak, F., and Leong, K. W. Nanotopography-induced changes in focal adhesions, cytoskeletalorganization, and mechanical properties of humanmesenchymal stem cells. Biomaterials, 2010, 31(6),1299–1306.
65 Domke, J., Dannohl, S., Parak, W. J., Muller, O.,Aicher, W. K., and Radmacher, M. Substratedependent differences in morphology and elastic-ity of living osteoblasts investigated by atomicforce microscopy. Colloids Surf. B, Biointerfaces,2000, 19(4), 367–379.
66 Simon, A., Cohen-Bouhacina, T., Porte, M. C.,Aime, J. P., Amedee, J., Bareille, R., and Baguey, C.Characterization of dynamic cellular adhesion of oste-oblasts using atomic force microscopy. Cytometry.Part A: J. Inter. Soc. Analytical Cytology, 2003, 54(1),36–47.
67 Takai, E., Costa, K. D., Shaheen, A., Hung, C. T.,and Guo, X. E. Osteoblast elastic modulus mea-sured by atomic force microscopy is substrate
dependent. Ann. Biomed. Engng, 2005, 33(7), 963–971.
68 Turner, M. S., Briehl, R. W., Wang, J. C., Ferrone,F. A., and Josephs, R. Anisotropy in sickle hemo-globin fibers from variations in bending and twist.J. Molec. Biol., 2006, 357(5), 1422–1427.
69 von Ruckmann, B., Jons, T., Dolle, F., Drenc-khahn, D., and Schubert, D. Cytoskeleton-mem-brane connections in the human erythrocytemembrane: band 4.1 binds to tetrameric band 3protein. Biochim. Biophys. Acta, Biomembranes,1997, 1325(2), 226–234.
70 Brugnara, C. Red cell membrane in sickle cell dis-ease. In Disorders of hemoglobin: genetics, patho-physiology, and clinical management (Eds M. H.Steinberg, B. G. Forget, D. R. Higgs, and R. L.Nagel), 2001, pp. 550–576 (Cambridge UniversityPress, New York).
71 Strouse, J. J., Lanzkron, S., Beach, M. C.,Haywood, C., Park, H., Witkop, C., Wilson, R. F.,Bass, E. B., and Segal, J. B. Hydroxyurea for sicklecell disease: a systematic review for efficacy and tox-icity in children. Pediatrics, 2008, 122(6), 1332–1342.
72 Halsey, C. and Roberts, I. A. G. The role ofhydroxyurea in sickle cell disease. Br. J. Haematol.,2003, 120(2), 177–186.
73 Charache, S., Dover, G. J., and Moore, R. D. et al.Hydroxyurea – effects on hemoglobin-f productionin patients with sickle-cell-anemia. Blood, 1992,79(10), 2555–2565.
APPENDIX
Notation
a radius of contact of tip with sample
A contact region of indentation�A separation region of indentation
d deflection of cantilever on the indented
half-space
E Young’s modulus
E# reduced Young’s modulus
E1 Young’s modulus of first bimodal peak
of oxy- and deoxy- samples
E2 Young’s modulus of second bimodal
peak of oxy- and deoxy- samples
Enormal Young’s modulus of normal
erythrocytes
Esample Young’s modulus of the sample
ESCT Young’s modulus of SCT erythrocytes
Etip Young’s modulus of the tip
f profile of the punch
F force
Fparabolic force approximated by parabolic tip
Fpyramid force approximated by pyramidal tip
g gap between the punch and the half-
space
378 J L Maciaszek, B Andemariam, and G Lykotrafitis
J. Strain Analysis Vol. 46

G# storage modulus
G$ loss modulus
p contact pressure
Pz total contact force
rs radius of spherical tip
R radius of curvature of tip
uz normal deformation of the indented
elastic half-space surface
v Poisson’s ratio
vsample Poisson’s ratio of the sample
vtip Poisson’s ratio of the tip
d deflection of the cantilever on the rigid
substrate
Y nominal angle of tip
s tangential traction on half-space
Microelasticity of red blood cells in sickle cell disease 379
J. Strain Analysis Vol. 46