microcontroller based physiological ...docs.neu.edu.tr/library/6348780395.pdfmicrocontroller based...
TRANSCRIPT

MICROCONTROLLER BASED PHYSIOLOGICAL MONITORING SYSTEM WITH GSM TECHNOLOGY
A THESIS SUBMITTED TO THE GRADUATE
SCHOOL OF APPLIED SCIENCES
OF
NEAR EAST UNIVERSITY
BY
MUHAMMAD ABID ANWAR
In Partial Fulfillment of the Requirements for the Degree of Master of Science
in Electrical and Electronic Engineering
NICOSIA, 2015


i
I hereby declare that all information in this document has been obtained and presented in
accordance with academic rules and ethical conduct. I also declare that, as required by these
rules and conduct, I have fully cited and referenced all material and results that are not original to
this work.
Name, Surname: Muhammad Abid, Anwar
Date:
Signature:

ii
ACKNOWLEDGMENTS
I feel a deep sense of obligation and greatly thank my project supervisor Asst. Prof. Dr. Ali
Serener who is always there for me help and without their help and encouragement, it would have
been impossible for me to achieve this task. I feel greatly indebted for his sincere guidance.I
would like to thank my friends in Near East University Master Program (Saqlian Ali Raza,
Muhammad Awais ). It is my bound duty to pay tributes to all my worthy all staff members of
the department of Electrical and Electronics engineering. Finally, I would like to thank all of my
Teachers & my Parents.
iii
I am dedicating this project to my Parents, my brother and sisters.

iv
ABSTRACT
In this modern era of technologies, it is essential to have monitoring systems especially for
security or heath purposes. Many hospitals are lacking in real time patient monitoring systems
and they check physiological parameters manually using various instruments. Therefore
monitoring these parameters becomes a tedious process and could lead to death.
In this thesis we designed and simulated a system which can help with real time monitoring in
multiple patients (ten patients). This system can monitor several physiological parameters at a
time including pulse rate, body temperature, glucose level, hemoglobin level and patient state
index continuously. Remotely monitoring a patient encouraged by many doctors in their too
much busy schedule. Therefore, to avoid over loading a doctor, he/she should be provided with
the latest readings of his/her patients. Only abnormality is reported to the doctor and if no report
is received, normality is assumed. Efficient monitoring requires live comparison of the values
reported and stored in memory. For the sake of facilitation, the system is capable of monitoring
multiple patients at one instant and measuring five vital signs for better diagnosis. All
information is transfered to the micro-controller. This microcontroller board analyses data and if
any abnormality is observed, it sends warning and emergency messages to a doctor. The
reporting process is made through GSM technology via SMS service and the values transmitted
are also shown at the very place where patient is kept. Doctor can analyse all the patients'
statuses inside and outside the hospital.
Keywords: GSM modem, microcontroller, physiological parameters, wireless system

v
ÖZET
Bu tezde gerçek zamanlı olarak hasta (on hasta) izleme sistemi tasarlanmıştır. Bu sistemde
fizyolojik parametreler olan nabız, vücut ısısı, glükoz seviyesi, hemoglobin seviyesi ve hasta
stabilizasyonu gözlemlenmektedir. Doktorun yoğunluğunu azaltmak için hastanın son bilgileri
doktora sunulur. Hastada normalin dışında bir gelişme olduğunda doktorla iletişime geçilir. Aksi
takdirde hastanın durumu iyi demektir. Sistem hafızadaki ve anlık verileri kıyaslayarak verimli
bir gözetim elde edebilir. Kullanıcının işini kolaylaştırmak için birden fazla hastanın bilgileri
ekranda gösterilebilir. Bütün bilgiler mikrodenetleyiciye yollanır. Mikrodenetleyici bigileri
analiz edip anormal bir durum olduğunda doktora uyarı ve acil mesajı yollar. Uyarı doktora SMS
olarak yollanır. Bu sayede doktor hastane içerisinde ve dışında hastayı kontrol edip
gözlemleyebilir.
Anahtar sözcükler: Mikrodenetleyiciye, fizyolojik parametreler, glükoz seviyesi, hasta
stabilizasyonu
vi
CONTENTS
ACKNOWLEDGMENTS ................................................................................................. iii
ABSTRACT ....................................................................................................................... iv
ÖZET ...................................................................................................................................v
CONTENTS........................................................................................................................ vi
LIST OF TABLES ..............................................................................................................x
LIST OF FIGURES............................................................................................................ xi
ABBREVIATIONS .......................................................................................................... xiii
CHAPTER ONE: INTRODUCTION .................................................................................1
1.1 Overview .............................................................................................................1
1.2 Introduction .........................................................................................................1
1.3 Literature Background .........................................................................................2
1.4 Summary .............................................................................................................6
CHAPTER TWO: PHYSIOLOGICAL PARAMETERS..................................................7
2.1 Overview .............................................................................................................7
2.2 Heart Rate ............................................................................................................7
2.2.1 Heart Rate Measurement Techniques ...........................................................7
2.3 Continuous Glucose Monitoring (CGM) ..............................................................9
2.4 Body Temperature ............................................................................................. 11
2.5 MASIMO........................................................................................................... 13
2.6 Top Features of Masimo’s Radical-7 Pulse ........................................................ 14
2.6.1 Displayed Parameters ................................................................................ 14
2.6.2 Analyze Patient Trends .............................................................................. 15
2.6.3 Normal View ............................................................................................. 15
2.6.4 Trend View ............................................................................................... 16
2.7 Hemoglobin Level ............................................................................................. 16

vii
2.7.1 Functions of Blood in Hemoglobin ............................................................ 17
2.8 Normal range of hemoglobin .............................................................................. 17
2.8.1 Low Level Hemoglobin ............................................................................. 18
2.8.2 High Level Hemoglobin ............................................................................ 18
2.9 Bleeding Detection ............................................................................................. 19
2.10 Hemoglobin Measured ....................................................................................... 19
2.11 Patient State Index Monitor ................................................................................ 20
2.11.1 Electroencephalography (EEG)................................................................ 20
2.11.2 Normal EEG ............................................................................................ 20
2.11.3 Abnormal EEG Waves ............................................................................ 21
2.11.4 Patient State Index Monitoring ................................................................ 21
2.11.5 Patient’s State Index ................................................................................ 21
2.11.6 Patient state index guidelines ................................................................... 21
2.12 Sensor Application ............................................................................................. 23
2.13 Summary ........................................................................................................... 24
CHAPTER THREE: FUNDAMENTAL COMPONENTS ............................................. 25
3.1 Overview ........................................................................................................... 25
3.2 Microcontroller .................................................................................................. 25
3.3 Components of a Microcontroller ....................................................................... 26
3.3.1 Read Only Memory ................................................................................... 26
3.3.2 Random Access Memory ........................................................................... 26
3.3.3 Electrical Erasable Programming ROM (EEPROM) .................................. 26
3.3.4 Program Counter ....................................................................................... 26
3.3.5 Central Processing Unit (CPU) .................................................................. 26
3.3.6 Input/Output Ports ..................................................................................... 27
3.3.7 Oscillators ................................................................................................. 27
3.3.8 Timers ....................................................................................................... 27
3.3.9 Serial Communication ............................................................................... 27
3.3.10 USART ................................................................................................... 27
3.3.11 Watch dog timer (WDT) .......................................................................... 28
3.3.12 Pulse-width modulation (PWM) .............................................................. 28

viii
3.4 PIC-18F4520 Micro-controller ........................................................................... 28
3.4.1 Top Feature of PIC-18F4520 ..................................................................... 28
3.5 GSM Modem ..................................................................................................... 29
3.6 LCD ................................................................................................................... 30
3.7 Voltage Regulator LM7805 ................................................................................ 31
3.8 Buzzer ............................................................................................................... 32
3.9 Serial Port Interface MAX 232 ........................................................................... 32
3.10 Summary ........................................................................................................... 33
CHAPTER FOUR: DESIGN, SIMULATION AND ANALYSIS ................................... 34
4.1 Overview ........................................................................................................... 34
4.2 Aim.................................................................................................................... 34
4.3 Design ............................................................................................................... 34
4.4 Patient Monitoring System ................................................................................. 35
4.5 Proteus Simulation Software .............................................................................. 37
4.6 Patient Monitoring Unit ..................................................................................... 40
4.6.1 Body Temperature Measurement ............................................................... 41
4.6.2 Pulse Rate Measurement ............................................................................ 42
4.6.3 Continuous Glucose Monitoring (CGM) .................................................... 43
4.6.4 Hemoglobin Level Measurement ............................................................... 43
4.6.5 Patient state index Monitor ........................................................................ 44
4.7 Local Observation Unit ...................................................................................... 44
4.7.1 Microcontroller ......................................................................................... 45
4.7.2 Display unit ............................................................................................... 46
4.7.3 Buzzer Alarm ............................................................................................ 47
4.7.4 Serial Port connector ................................................................................. 48
4.8 Remote Transmission Unit ................................................................................. 49
4.8.1 GSM Transmitter....................................................................................... 49
4.9 Simulation and Analysis of 10 Patients Monitoring ............................................ 50
4.10 Results ............................................................................................................... 51
4.11 Discussion and Comparision .............................................................................. 61
4.12 Summary ........................................................................................................... 63

ix
CHAPTER FIVE: CONCLUSIONS AND FUTURE WORKS....................................... 64
REFERENCES .................................................................................................................. 65

x
LIST OF TABLES
Table 2.1: Normal range values of hemoglobin for different age ...………………………..18
Table 4.1: Critical values for Measured Physiological Parameters………………………....35
xi
LIST OF FIGURES
Figure 1.1: Flow chart ..........................................................................................................5
Figure 2.1: Transmitter and receiver ....................................................................................8
Figure 2.2: Photo diode .......................................................................................................9
Figure 2.3: Glucose monitoring ...........................................................................................9
Figure 2.4: Wireless monitor ............................................................................................. 10
Figure 2.5: Dexcom sensor ................................................................................................ 11
Figure 2.6: LM35 sensor .................................................................................................. 11
Figure 2.7: LM35 isolate from capacitive load ................................................................... 12
Figure 2.8: LM35 with R-C ............................................................................................... 12
Figure 2.9: To-92 .............................................................................................................. 13
Figure 2.10: Multiple vital physiological parameters ........................................................ 14
Figure 2.11: Display parameters ....................................................................................... 14
Figure 2.12: Analyze patient Trends ................................................................................. 15
Figure 2.13: Normal view ................................................................................................. 15
Figure 2.14: Trend view ................................................................................................... 16
Figure 2.15: Hemoglobin ................................................................................................... 17
Figure 2.16: Hemoglobin meter ......................................................................................... 20
Figure 2.17: Patient state index guidelines ......................................................................... 22
Figure 2.18: EEG four channel ......................................................................................... 23
Figure 2.19: Brain sensor ................................................................................................... 23
Figure 3.1: Basic block diagram of microcontroller ............................................................ 25
Figure 3.2: Pin diagram of PIC-18F4520 .......................................................................... 29
Figure 3.3: GSM modem .................................................................................................. 30
Figure 3.4: LCD ................................................................................................................ 31
Figure 3.5: Voltage regulator .............................................................................................. 31
Figure 3.6: Interfacing circuit of serial port........................................................................ 32
Figure 4.1: Patient monitoring systems .............................................................................. 36
Figure 4.2(a): Circuit diagram of patient monitoring system .............................................. 38
Figure 4.2(b): Circuit diagram of patient monitoring system .............................................. 38

xii
Figure 4.3: Block diagram showing physiological signs being sent to a microcontroller .... 40
Figure 4.4: Body temperature sensors ............................. ......................................................41
Figure 4.5: Pulse rate sensors ......................................... ......................................................42
Figure 4.6: Wireless glucose monitor devices ................. ......................................................43
Figure 4.7: Hemoglobin measuring sensor ...................... ......................................................43
Figure 4.8: Patient state index monitor sensors .............. ......................................................44
Figure 4.9: Block diagram showing physiological measurements ...................................... 44
Figure 4.10: PIC-18F4520 ............................................. ......................................................45
Figure 4.11: LCD (Display unit) ..................................... ......................................................46
Figure 4.12: Buzzer alarm .............................................. ......................................................47
Figure 4.13: Serial port .................................................. ......................................................48
Figure 4.14: Block diagram showing messages being sent to doctor’s mobile ........... .........49
Figure 4.15: GSM modem connect with microcontroller and serial port..............................49
Figure 4.16: System LCD displays ............................................................................... ......50
Figure 4.17: Messagesbeing sent due to low pulse rate and high glucose level.....................52
Figure 4.18: Emergency message for high hemoglobin and low heart rate...........................54
Figure 4.19: Multiple patient information evalution ............................................................56
Figure 4.20: High temperature emergency for patient no.9....................................................58
Figure 4.21: High temperature emergency for patient no.8....................................................60

xiii
ABBREVIATIONS
CGM: Continuously Glucose Monitoring
BPM: Beats Per Minute
CO2: Carbon dioxide
g/dl: Grams per deciliters
EEG: Electroencephalography
PSI: Patient’s State Index
MCU: Microcontroller unit
ROM: Read Only Memory
RAM: Random Access Memory
EEPROM: Electrical Erasable Programming ROM
CPU: Central Processing Unit
CU: Control Unit
ALU: Arithmetic Logic Unit
UART: Universal Asynchronous Receiver / Transmitter
WDT: Watch dog timer
PWM: Pulse-width modulation
GPRS: General Packet radio service
LCD: Liquid crystal display
R/W: Read/Write
ER: Emergency room
ICU: Intensive care unit
1
CHAPTER ONE
INTRODUCTION
1.1 Overview
A monitoring system is a system where by one can observe and assess how something relates
and reacts to a specific subject. Patient monitoring system is a technique which enables repeated
or constant observation and measurement of physiological vital parameter of a patient for the
purpose of guiding clinical decisions which includes when to make beneficial surgery and
assessment of these interventions.
1.2 Introduction
A remote patient monitoring system might become necessary to monitor critical physiological
parameters of patients such as body temperature, heart rate, glucose level, and hemoglobin level
and patient state index.
In this thesis, a system has been designed for wireless monitoring of patients so that a doctor can
analyze patients in an intensive care unit (ICU) remotely by keeping a close eye on his/her
various important health physiological parameters. Five vital physiological parameters (Heart
rate, body temperature, glucose level, hemoglobin level, patient state index) for multiple patients
are taken into consideration. All values are measured with a fix time interval and saved in the
memory. If all values are within the limits then the system measures all physiological parameters
continuously and displays them on the LCD. If any crosses the limit, then the system switches to
warning/emergency and sends the patient's condition to the doctor.
In the patient monitoring system, all the simulations have been done with the Proteus software.
This is a virtual simulation software which enables designer to design a flexible and reliable
prototype. With the extensive component libraries, compatibility, different formats and
reliability, the said tool is better option for design of VLSI system. It provides so many
impressive features like simulation run time environment, measuring real time voltage, current,
frequency and waveforms at desired nodes or loops of circuit simulations.

2
Along with the simulation software, the programming code requires to be tested in any
simulation software that will tell the programmer that code is running according to intention.
Therefore, in the thesis, Keil Micro Vision is used for testing of code. It has some comparable
and salient features like selection of so many programming IC’s, loading of programming
through a single click, adjusting flexibility of frequency parameters and importing and exporting
files in so many formats.
Chapter 2 explains system parameters which could be used to measure physiological parameters
of the patients.
Chapter 3 describes fundamental components in detail, explaining how each component works
Chapter 4 explains the designed and simulation of this system and analyzes it with different test
cases.
Chapter 5 summarizes the conclusions obtained from the suggested analysis.
1.3 Literature Background
Nowadays, in most hospital’s Intensive care units, all patients need continuous monitoring of
important physiological parameters like heart rate, body temperature, glucose level, hemoglobin
level, patient state index. When any parameter crosses the safe range, a nurse inspecting the
patient manually pages the doctor. Thus, doctors may suffer from burn out due to manual
monitoring of the patients.
To prevent all of the above problems we designed a wireless portable which is an easy to operate
microcontroller based physiological monitoring system between a doctor and the patient that
reduces the doctor's load and the patient risks. With this design doctor's can assess patient’s
health condition anywhere with GSM technology. Sensors are used to measure all physiological
vital parameters [6].
There are many wireless standards that can be used for wireless monitoring such as Bluetooth,
Zigbee, wireless LAN and GSM [1, 2, 3]. Bluetooth is low cost wireless solution for short range
but it has limitations like more software overload and it can serve less number of users due to its
network technology named pico net[1]. Zigbee is also a low cost, low power wireless solution
but has limitations on data rate and uses heavy software protocol [1, 2]. Wireless LAN is very
good for sharing data but it is not suitable for wireless sensors because of use of heavy,
expensive equipment and more power consumption [1].

3
Several wireless monitoring systems have been presented in the literature [1, 2, 3]. Most recent
progress in a patient monitoring system is that it uses sensors to monitor different physiological
parameters and if a parameter is approaching some critical limit, warning or emergency message
is sent to a doctor. Additionally continuous monitoring report can also be saved to a central
storage unit [2, 3]. It uses two modules, one on the patient's side and the other on doctors.
Patients module with the patient consists of sensors attached to a microcontroller that collects the
patient's information and transmits the data. The module on the doctor's side will receive the
patient information and decode it, so he/she can be observe and monitor many patients at the
same time. During monitoring, if any physiological parameter goes of the scale , an audio alarm
is generated and if a doctor is not around an alert message is sent to him/her through a GSM
module attached with the receiver unit [2].
When Patient Monitoring System is started it shows a message on LCD that system is measuring
heart Rate, hemoglobin, body temperature, Patient state index and glucose level. After taking the
specified values from different sensors, the values are then stored in the system for further
processing. The system does the same after pre-defined time interval and keeps track of values
taken from ten patients. Now, parallel with this, system also compares that values to the two
threshold levels (i.e. Warning and Emergency) with the range specified for normal operation. If
the values are lying in the normal range after compared from the range values, all the 5 vital
signs of 10 patients will be directly stored to the memory location written in coding of
microcontroller. This will be happening until some outstanding value (abnormality case) that is
not lying in the normal range is recorded. If so happens, then system will display that abnormal
values to the LCD and it will also send a warning message to the doctor’s contact through GSM
along with the warning and message content having that outstanding value. If any value from
above mentioned values for one cycle is reported as greater than the warning threshold, then
system will display that abnormal values to the LCD and GSM module will send an emergency
situation message to the doctor’s contact saved in microcontroller’s memory. After sending
whether the warning message or emergency message, the system will continue to take readings
from the sensors and compare the values. This process will be cyclic so, that the live data may be
interpreted for further processing. It can be seen from the flow diagram that system is doing
parallel processing in order to achieve accuracy. While sending a warning message to the doctor,
it might happen that values may go at such level where emergency should be displayed. The

4
system will be taking the values at that instant and will be comparing as well. Therefore, better
sophistication of the system, it is required that no value will be misinterpreted or left unattended.
Great care has been taken while analyzing the process flow as depicted in the flow diagram
(Figure 1.1).

5
No
Yes
Yes
No
Figure 1.1: Flow chart of patient monitoring system
STOP
Is data within normal range?
Show data on LCD and send to GSM module
Send message to doctor
Switch to the emergency
Measuring Heart Rate, Hemoglobin, Body Temperature, Patient State Index and
Glucose level at fix intervals and Check them are in normal range or not?
Measuring Heart Rate, Hemoglobin, Body Temperature, Patient State Index and
Glucose level at fix intervals and Check them are in normal range or not?
Is data within normal range?
START

6
1.4 Summary
In this chapter was an introduction of this thesis. we discussed why we need this type of
microcontroller based physiological monitoring system with the increase of emergency in
hosipital. Our research contribution has been explained to improve this system and get better
results.

7
CHAPTER TWO
PHYSIOLOGICAL PARAMETERS
2.1 Overview
In this chapter, we are going to briefly describe the paramedical components that need
evaluation.
2.2 Heart Rate
Pulse rate is a speed of heart which can be measured by the number of heart beats per time of
unit. It generally indicates the beats per minute (bpm) [7]. pulse rate will vary because human
needs to absorb oxygen and discharge carbon dioxide. Both of them will changes physical
exercise, sleeping, sickness condition and due to drugs. There are several ways in which the
pulse rate can increase or decrease from the normal range. The normal value of pulse rate is
between 60 to100 (bpm). If the value of pulse rate is going below 60 (bpm) it means we are in a
bradycardia. This is a major problem for the heart would not be able to pump blood to some parts
or all parts of human body. When the heart beat is quicker, than the normal heart rate it is called
tachycardia. A normal adult heart beats is between 60 to 100 (bpm) [8].
In tachycardia when the heart beat is above 100 bpm the heart will then be working very fast the
heart beat would have to be handled by electrical signals.
2.2.1 Heart Rate Measurement Techniques
We can measure the heart rate by finding the pulse of the heart. Heart rate pulse is founded at
any point on the human body. The two most commonly spots used to take a pulse are at the
radial artery (wrist) and the carotid artery (neck). These two methods are most probable and
much reliable method to measure the heart rate in any emergency situations. When we measure
the heart rate with radial artery, then we put the index and second fingers of one hand on inside
the wrist of the other hand, place our fingers under the base of the other hand’s thumb to get the
radial pulse. The easiest way to find a pulse is with carotid artery: with carotid artery (neck)
locate both index fingers of one hand on the side of the neck near the windpipe.

8
In this thesis we will explain a microcontroller based heart rate measurement technique which
uses optical sensors to measure the changing in blood level at fingertip with each heart beat.
Heart beat sensor has been made to provide digital output [9]. This digital output will be
connected to microcontroller to measure the pulse rate in beats per minute. It works on the
principle of light modulation by flow of blood through finger each and every pulse.These devices
contain an infrared transmitter (LED) and an infrared sensor photo-transistor. The infrared diode
transmits an infrared emission towards the fingertip and the photodiode detects the light which is
reflected back. The strength of emission light depends on by the blood level in the fingertip.
Each pulse rate a bit changes the amount of reflected infrared light |that could be detected from
the photodiode. Using a suitable signaling situation, this change in the amplitude of the reflected
light may is changed to a pulse. These pulses is usually measured by the microcontroller to
discover or find out the pulse rate, after that signal amplified and filtered suitable signal that is
fed into a microcontroller for evaluation the pulse rate values and display. The microcontroller
measures the number of pulses over a fixed time interval and shows on LCD as shown in Figure
2.1 and Figure 2.2 [10].
Figure 2.1: Transmitter and receiver for finger tip sensor

9
Figure 2.2: Photo diode [9]
2.3 Continuous Glucose Monitoring (CGM)
Continuous glucose monitoring helps people which diabetes to control and prevent its related
problems. For continuous glucose monitoring system, patients can make decisions about food
and physical activities. The most common methods are by picking a figure tip with a device to
get a blood sample. The glucose meter will then glucose level measure. With this the continuous
system that is introduced can then be used as an aid for treatment of diabetes. Patients can use,
every day a little wearable tool, for the continuous glucose monitoring. This will determine the
required level of insulin and it also minimizes the risks of hypoglycaemic.
Figure 2.3: Glucose monitoring device [4]
There are many benefits of performing continuous glucose monitoring. The glucose levels are
not always constant this means it keeps on changing during work, patient is exercise eating food
etc. Finger prick is one method to measure glucose level. If we do finger stick test routinely, this
only provides brief picture relative to the blood sugar level. Ideally to get an accurate reading of

10
general glucose levels one would record data in short intervals of 1 and 5 minutes. This is not
realistic using the finger test method. Continuous glucose monitoring (CGM) utilizes a small
device injected under the skin to evaluate blood sugar. The device is constantly in place for few
days to a week, and then need to be changed. A transmitter transmits data relating to blood sugar
levels by using radio waves from the chip of the device [25]. The patient must has to check
glucose levels using a glucose meter to program the devices, because at this time approved CGM
products quite a bit less accurate and reliable as normal blood glucose meters. Patient must
ensure blood sugar levels using a meter before make a modification in treatment. CGM
techniques are more costly as compared to regular glucose monitoring system. Continuous
glucose monitoring (CGM) devices made by abbott dexcom are approved by the U.S. Food and
Drug Administration. This device gives real time measurements of blood sugar levels, showing
result in 1 and 5 minute interval [12].
Figure 2.4: Wireless glucose monitor device [4]
It produces actual-meter dimensions, regarding sugar levels, together with blood sugar levels.
Users can download information from the equipment to some computer system, for tracking
patterns and styles; can display trend charts which the patient can keep track of, from the display
screen on the device (Figure 2.5).

11
Figure 2.5: Dexcom sensor [37]
2.4 Body Temperature
With LM35 (Figure 2.6) it is possible to measure temperature more accurately as compared to
using a thermometer. The LM35 sensor circuitry is sealed and never subject to oxidation. LM35
produces a large amount of output voltage as compare to thermocouples. The voltage of LM35
does not need to be amplified. The LM35 are accurate integrated-circuit temperature sensors,
[29] the output voltage of LM35 is linearly proportional to the Celsius temperature. The LM35
provides the advantage over linear temperature sensors calibrated in ° Kelvin, because the user is
not really necessary to subtract a huge constant voltage from its output to get easy centigrade
scaling. The high-precision type of the LM35 does not need any kind of external calibration to
provide standard accuracies of ±1⁄4°C at room temperature and ±3⁄4°C over a full −55 to +150°C
temperature range. The LM35 low output impedance, linear output, as well as accurate inherent
calibration make interfacing to read-out or control circuitry particularly easy and also can used
with single power supplies [30].
Figure 2.6: LM35 sensor [31]
Probably the majority of micro power circuits, the LM35 have a limited capability to drive heavy
capacitive loads. LM35 has ability to work itself on 50 pf without having safety measures. In

12
case if the loads are expected, it is possible to insulate the load with a resistor shows in (Figure
2.7) as well as we can enhance the threshold of capacitance using a series R-C circuit through
output to ground which is also showin Figure 2.8
Figure 2.7: LM35 isolate from capacitive load [31]
Figure 2.8: LM35 with R-C [31]
LM35 could be used such as other integrated-circuit temperature sensors. It is usually fixed to a
surface; its temperature will be within about 0.01˚C of the surface temperature [31]. The air
temperature are depends on a surface temperature. If the surface temperature high and low the air
temperature behaves likes same it should be high or low. The LM35 will probably die between
the surface and air temperature. It is extremely true that with plastic package of TO-92 copper
leads carry heat into the device with the principle of the thermal path (Figure 2.9). It is
temperature could be closer to the air temperature rather than to the surface temperature.

13
Figure 2.9: TO-92
The most effective way to achieve this is usually to cover these wires using a bead of epoxy that
can ensure that the leads and wiring are all at the same.
2.5 MASIMO
It is an international medical company which builds and manufactures modern non-invasive
monitoring system, such as medical devices and a variety of sensors. MASIMO is an award
winning and vital medical technology company. which provides patient more care reduce and
patient risk in emergency and ICU.
MASIMO’S Radical-7 Pulse CO-OXIMETRY device can measure these parameters
continuously (Figure 2.10).
Pulse Rate (BPM)
Functional Oxygen Saturation
Perfusion Index
Total Hemoglobin
Oxygen Content
Methemoglobin
All these vital parameters above can be measured by one disposable sensor. There is one more
sensor with this device that can measure three different parameters:
Brain level (BL)
End-Tidal Carbon Dioxide

14
Regional Oximetry
Figure 2.10: Multiple vital physiological parameters [4]
2.6 Top Features of Masimo’s Radical-7 Pulse
2.6.1 Displayed Parameters
We are able to change easily displayed parameters having a quick touch. Doctor's are able to
move the vital parameter the display and then there is no way of losing the record of any vital
values (Figure 2.11).
Figure 2.11: Display parameters [4]

15
2.6.2 Analyze Patient Trends
This feature provides the capability to check more parameters by using a very quick touch
(Figure 2.12). Doctor can move and expand parameters for real time evaluation [15].
Figure 2.12: Analyze patient trends [4]
2.6.3 Normal View
This feature provides a continuous monitoring using a normal view we can monitor multiple
parameters shows the normal view output result of multiple parameters values (Figure 2.13).
Figure 2.13: Normal view [4]

16
2.6.4 Trend View
The trend feature provides one-touch accessibility to essential parameter trending information to
immediately examine a patient's condition and illness intensity (Figure 2.14).
Figure 2.14: Trend view [4]
2.7 Hemoglobin Level
Hemoglobin is a sophisticated protein. This is obtained in red blood cells which containing the
iron molecule. The main functionality of hemoglobin is usually to carry oxygen in the lungs
towards the body tissues, and to exchange the oxygen for carbon dioxide (co2), and after carry
the carbon monoxide back to the lungs, where it is exchanged for oxygen. The iron molecule in
hemoglobin helps maintain the normal shape of red blood cells.
The name is derived from the combination of two words hemo and globin, the hemo is the first
part which contains iron atoms that can hold oxygen with iron and second part is globin which
produces the protein.
Oxygen is one of the most important elements necessary to maintain human life. If a sufficient
supply of oxygen is not circulated during the entire body to essential organs and tissues, brain
damage organ failure and death can happen [4].

17
Figure 2.15: Hemoglobin [4]
2.7.1 Functions of Blood in Hemoglobin
Hemoglobin contains in the red blood cells which provide blood it quality color. It acts to hurdle
oxygen on the lung towards the tissues we can measure the power of hemoglobin by using
diluted blood with suitable solution and measure in the electronic instrument that needs to know
the amount is absorbed when it is passed via the solution. This condition is called anemia
(anemia, means less than normal levels of red blood cells in a person blood). The term is derived
from the Greek term anemia, meaning lack of blood quantity. The body of human normally
carries 6 liter of blood. A human blood performs several functions carries O2 the function which
from lung to tissues and tissues to lungs performed by the red cells, carries waste elements from
tissues to organ an also maintains the PH of body with the buffer system [23].
2.8 Normal range of hemoglobin
The normal hemoglobin level is indicated as a quantity of or level of hemoglobin in grams per
deciliters of complete blood. The standard ranges for normal hemoglobin are based upon the age
starting in adolescence and the gender of the person. The normal range of hemoglobin is show in
table.

18
Table 2.1: Normal range values of hemoglobin for different age
2.8.1 Low Level Hemoglobin
Low level hemoglobin is called, anima or a low red blood count. Less than normal quantity of
red cells is called anima and hemoglobin demonstrates this number. Few reasons for anima are.
Waste or lose of blood during upsetting injuries, bleeding
Health deficiency means iron vitamin B 12 and vitamin BC
Bone narrow problems
It also happens by failure of kidneys
2.8.2 High Level Hemoglobin
High hemoglobin levels means that measured hemoglobin levels are above the top of the limits
of normal for the age and sex of the person. As an example, a 19 year old who has a detected
hemoglobin level of above 17.7 g/dl would have a high hemoglobin level. Several reasons for
high hemoglobin levels are listed below:
Advance lung diseases, one of them is Emphysema
A disease inside the bone marrow and abuse from the drug
Hemoglobin is high by chemically raising red blood cells
Living at a high altitude
Cancer
Smoking

19
Blood doping
2.9 Bleeding Detection
The majority of injuries are caused by avoidance. It really needs to identify the patient has
experience to major bleeding to avoid it and enhance the patient care and also helps the clinical
inside and outside the operating room which can monitor and detect the bleeding. It affects
nearly 35% of patients in surgery, for patient that is late in detection of bleeding. Will increase
risks and costs. Lab test give a late result by inserting a painful needle in a patients body is time
consuming. Here are some benefits of this sensor; we can continuously measure hemoglobin
with spot checking. We don’t need to insert a needle and very fast result in short time. It is user
friendly and also helps the hospital staff to measure the hemoglobin increase efficiently. I t will
also reduce the risk of accidental needle stick... Patients can get results very rapidly without
having to wait for lab result. It is more benefitial for patients to have communication with their
doctors [20].
2.10 Hemoglobin Measured
Over 500 thousand Hemoglobin tests, detecting popular blood stream disorders, like anemia are
performed on a yearly basis. It is the most frequent technically coherent blood test out. With this
very first, brand new, discovery of technology “MASIMO is non-invasive and continual total
hemoglobin keeping track of technology makes it possible for hemoglobin examination without a
hurtful needle stick. Red blood examination increases the risk and cost to all hospitals. Lots of
transfusions are considered unnecessary; it is impotent to reduce these transfusions (Figure 2.16).
This product has developed non-invasive and continues hemoglobin monitoring that helps
hospital optimized transfusions decision by giving real time trending in hemoglobin and also
provides helps to reduce the blood transfusions with low and high loss surgery [4].

20
Figure 2.16: Hemoglobin measuring meter [4]
2.11 Patient State Index Monitor
2.11.1 Electroencephalography (EEG)
EEG is a test which can observe electrical activity in our brain, using very tiny metal discs which
are attached to your head. The human brain cell communicates by using electrical impulses. This
is also works whilst the patient is a sleep, as the brain is active. EEG is main diagnosis test for
epilepsy [33, 17]. There are many kinds of brain waves which show the brain activity.
alpha waves are a type of brain wave working frequently between 8-12c/s. This wave exists only
in present working condition. When the patients eyes are usually closed. When we are physically
alert and when you eyes are open, alpha waves disappears. beta waves frequency is 13-30 c/c.
beta rays are found when you take high doses of specific medicine i-e benzodiazepines. The third
one is delta wave which works under three cycles per second. It is usually found when a child is
in a sleeping condition. The last one is theta wave. It has frequency between 4-7c/s but it works
same as delta waves. The only difference is in frequency.
2.11.2 Normal EEG
In patients that are awake EEG generally indicates the alpha and beta rays with normal EEG. The
results of both sides of the brain show patterns of electrical activity. During the EEG test one
light used which is called flashing light is widely used for the test of brain. This can have a quick
feed back or response after every flash, only when waves are in normal conditions [32].

21
2.11.3 Abnormal EEG Waves
When the brain shows different electrical waves at both sides it means EEG is not in normal
condition. It displays unexpected bursts of electrical activity in the brain. These situations cause
brain tumor, accidental injury, heart attacks. In abnormal condition EEG provides mostly delta
and of theta waves, these results will determines brain illness and brain injury [33]. When EEG
displays strait lines which means that brain function has stopped due to insufficient oxygen.
Flow of blood inside the brain. This can happen when patient is in comma.
2.11.4 Patient state index Monitoring
Brain monitoring is used to enhance the patient’s care and reduce the risk of death when the
patient is under the anesthesia (anesthesia, which is a temporary state consisting
of unconsciousness, loss of memory, lack of pain, and muscle relaxation).
Brain monitoring increases the usage and accessibility of advanced nervous monitoring
technology in hospitals. It additionally represents a vital development for the practice of
anesthesia. EEG data provides details about both sides of the brain to help quick detection of
asymmetrical activity.
2.11.5 Patient’s State Index
Patient’s State Index (PSI) is a way of measuring brain activity that shows the patient’s present
level of anesthesia and gives additional information to improve anesthesia control and
accomplish electric assessment. It also provides a cost effective solution that can help obtain
targeted sedation during all phases of anesthesia inside ICU.
2.11.6 Patient state index guidelines
Brain monitoring function uses this monitoring device. It helps the anesthesia provider, transmits
required level of sedation. It works on a sophisticated algorithm to determine the patient state
index value by measuring anesthetic depth. The patient state index corresponds to a patient's
current level of anesthesia along a scale of zero to hundred, where a hundred s being fully awake.
Guidelines for interpreting the entire range of values are presented below. We can see patient’s
brain condition by reading the PSI range. Which shows the patient condition in the diagram

22
(2.17) 25-50 value is range of optimal hypnotic state for normal anesthesia? In color diagram
numeric patient state index value is shown that is color code for the fast and immediate response
of the patient [21].
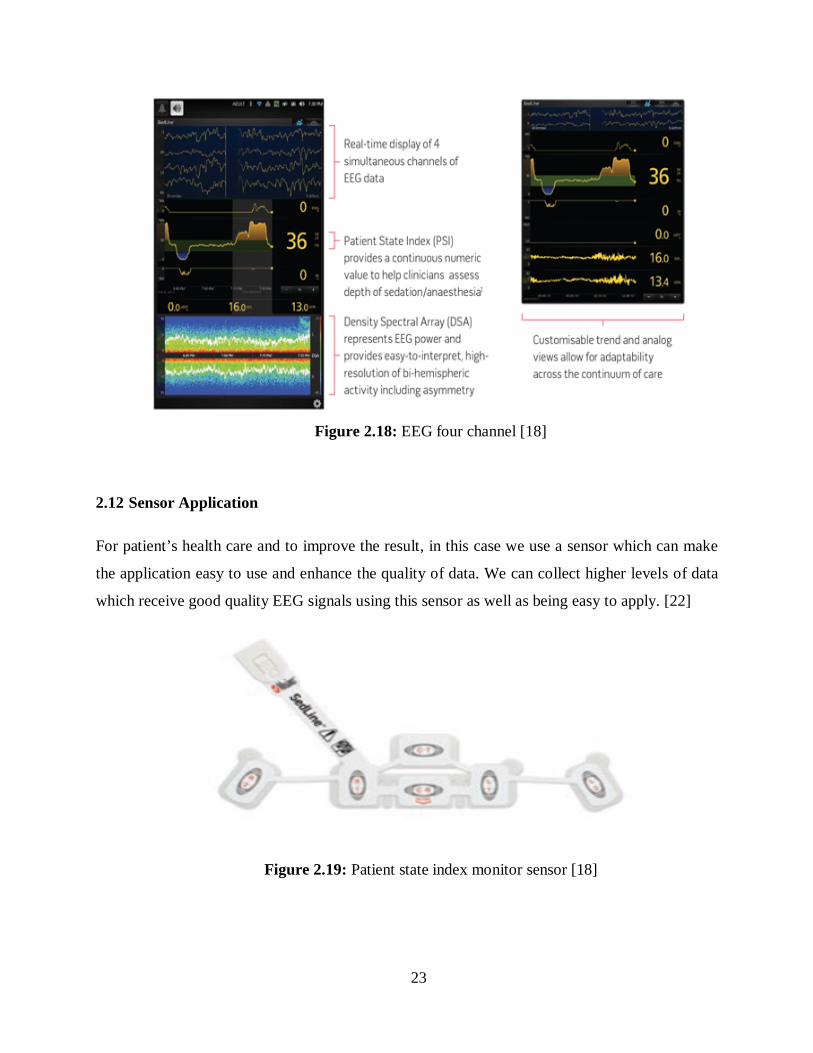
Real-time, four channels EEG which show the information like a wave from design a density
spectral array allow very easy and quick confirmation of PSI value. There are many advantage of
PSI. The PSI technique gives very fast assessment as well as provides the color coded and
numerical value which clearly indicate the amount of anesthesia. It also provides very early
result using density, spectral array and also easy to interpret high definable graphic of
hemispheric activity.
Figure 2.17: Patient state index guidelines [18]
23
Figure 2.18: EEG four channel [18]
2.12 Sensor Application
For patient’s health care and to improve the result, in this case we use a sensor which can make
the application easy to use and enhance the quality of data. We can collect higher levels of data
which receive good quality EEG signals using this sensor as well as being easy to apply. [22]
Figure 2.19: Patient state index monitor sensor [18]

24
2.13 Summary
In this chapter was explained five vital parameters sensor device which measured the patient
vital physiological parametres, like as Heart Rate, Body Temperature, Glucose level,
Hemoglobin and patient state index.
25
CHAPTER THREE
FUNDAMENTAL COMPONENTS
3.1 Overview
In this chapter, we are going to briefly describe the fundamental components that need for
simulation.
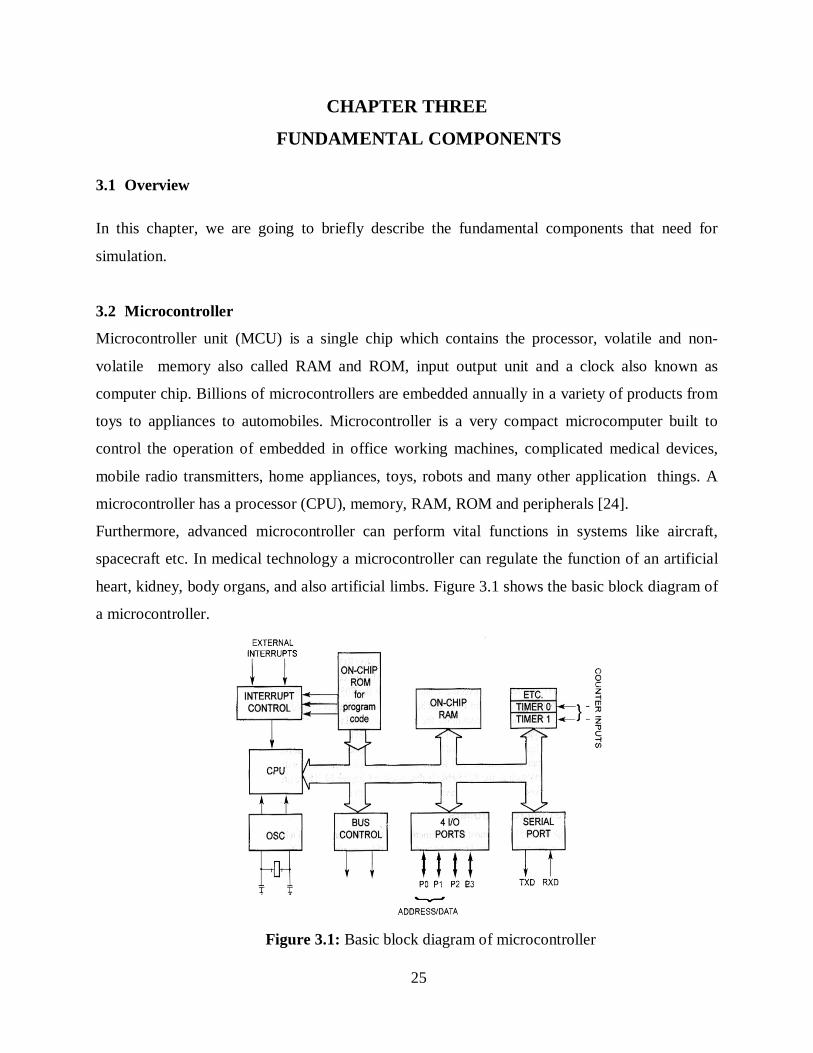
3.2 Microcontroller
Microcontroller unit (MCU) is a single chip which contains the processor, volatile and non-
volatile memory also called RAM and ROM, input output unit and a clock also known as
computer chip. Billions of microcontrollers are embedded annually in a variety of products from
toys to appliances to automobiles. Microcontroller is a very compact microcomputer built to
control the operation of embedded in office working machines, complicated medical devices,
mobile radio transmitters, home appliances, toys, robots and many other application things. A
microcontroller has a processor (CPU), memory, RAM, ROM and peripherals [24].
Furthermore, advanced microcontroller can perform vital functions in systems like aircraft,
spacecraft etc. In medical technology a microcontroller can regulate the function of an artificial
heart, kidney, body organs, and also artificial limbs. Figure 3.1 shows the basic block diagram of
a microcontroller.
Figure 3.1: Basic block diagram of microcontroller

26
3.3 Components of a Microcontroller
The components of a microcontroller are discussed in the following sections.
3.3.1 Read Only Memory
ROM is utilized to store the executed data permanently. ROM is usually integrated in the
microcontroller or additionally added as an external chip. A microcontroller will be less costly
and the program is usually longer if Read Only Memory is designed for the external chip. ROM
used internally is smaller but much expensive.
3.3.2 Random Access Memory
RAM is usually a volatile memory that can be used to store the data temporary. Data which is
stored in the memory will be cleared if the power supply is off.
3.3.3 Electrical Erasable Programming ROM (EEPROM)
This is a special type of memory which is not available in all microcontrollers. EEPROM is a
type of PROM which can be used to remove the data with an electrical charge. Like other types
of PROM, EEPROM stores the data if the power supply is turned off. It works more slowly as
compared to the RAM.
3.3.4 Program Counter
Program counter is an engine running the program and points to the memory address that
contains the next instructions to execute. The value of the counter is increased by 1 after each
instruction executed, so that the program can execute only one instruction at a time.
3.3.5 Central Processing Unit (CPU)
The Central Processing Unit (CPU) is responsible for interpreting and executing most of the
commands from the computer's hardware and software. The CPU could be considered the
"brains" of the computer. In the CPU, the primary components are the ALU (Arithmetic Logic
Unit) that performs mathematical, logical, and decision operations and the The CU (control

27
unit) ,which extracts instructions from memory and decodes and executes them, calling on the
ALU when necessary.
3.3.6 Input/Output Ports
These are used for making the microcontroller practical which is important to communicate the
computer peripheral. Every microcontroller has several registers called ports attached to the
microcontroller pins. A port that allows improving operation using the user requirement.
3.3.7 Oscillators
Pulses generated with oscillators enable harmonical function of circuits in a microcomputer. An
oscillator is always designed to use quartz crystal for frequency stabilizing. Additionally it can
be run without elements for frequency stabilizing like (RC-oscillators). It is very important to say
that program instruction will not be executed at the rate imposed with the oscillator but many
time slower.
3.3.8 Timers
A timer is the method by which the microcontroller measures the passing of time such as for a
clock, a pause/wait command, timer interrupts etc.
3.3.9 Serial Communication
A serial connection in a microcontroller is useful for communication. With serial communication
we can use it to program the controller from a computer, use it to output data from your
controller to your computer.
3.3.10 USART
The UART (Universal Asynchronous Receiver / Transmitter) is very useful in a microcontroller
for communicating the serial data to a computer. USART converts incoming parallel data to
serial data.

28
3.3.11 Watch dog timer (WDT)
Watch dog timer is an electronic timer that is used to detect and recover if something goes wrong
with an electronic system and the system does not recover on its own.
3.3.12 Pulse-width modulation (PWM)
This is a modulation technique that is employed in communications systems to encode the
amplitude of a signal into the width of the pulse. The main use of PWM is to control the power
supplied to the electronic devices.
3.4 PIC-18F4520 Micro-controller
It has an extended structure depending on the PIC-18F4520 that provides. The latest features,
such as extended instruction set, power management’s modes, very fast speed, and increased
USART. It also provides computational performance at less cost and enhances the flash program
memory [27].
3.4.1 Top Feature of PIC-18F4520
This microcontroller enhances the program memory and data EEPROMS which are performing
huge number of erase/write cycles which are approximately 100,000 to program memory and for
EEPROMS it is 1,000,000. With a PIC microcontroller, this could be to write a program memory
spaces under interval control. PIC-18F45320 microcontroller extended the instructions set and
added new instructions and an indexed mode. In PWM mode, this provides four modulated
outputs for handling half and full bridge drivers. Additional features include auto shutdown for
disabling PWM outputs on interrupt and auto restart to reactivate outputs when condition has
cleared. It also improves the USART which provides stable operation for application [28].
The PIC-18F4520 microcontroller can work with its CPU core disabled but the peripherals are
still active, so the power consumption of the system can be reduced. The power requirements for
Timer and the Watchdog Timer are reduced and minimize the power consumption during the
code execution. Figure 3.2 show the pin diagram of PIC-18F4520 microcontroller.

29
Figure 3.2: Pin diagram of PIC-18F4520 [13]
3.5 GSM Modem
This is a special type of modem that allows a SIM card, and it can works like a cell phone. If a
GSM modem is attached to a computer that can be permits the computer to use the GSM modem
to connect the mobile network. Even though these types of GSM modems normally helpful to
provide mobile internet connectivity and with GSM we can send and receive SMS and MMS
message like a cell phone operators.
GSM modem is usually a modem device which can be connecting with a computer with a serial
port communication, USB device and the Bluetooth. GSM modem |can be used as a general term
to refer any modem in which can be facilitates more than one of the protocols in the GSM, such
as 2G and 3G. General packet radio service (GPRS) is usually a packet data service
and enhanced Data rate (EDGE) both are use for enhanced the data rate in communication
system as well both have very fast speed and designed for the GSM.
GSM modem which can be facilitates like SMS services that can be use to send and receive
messages. The cellular operator charges for this message sending and receiving |just as if| |it had
been done directly on a cell phone. To execute these tasks, a GSM modem should have facilitates
30
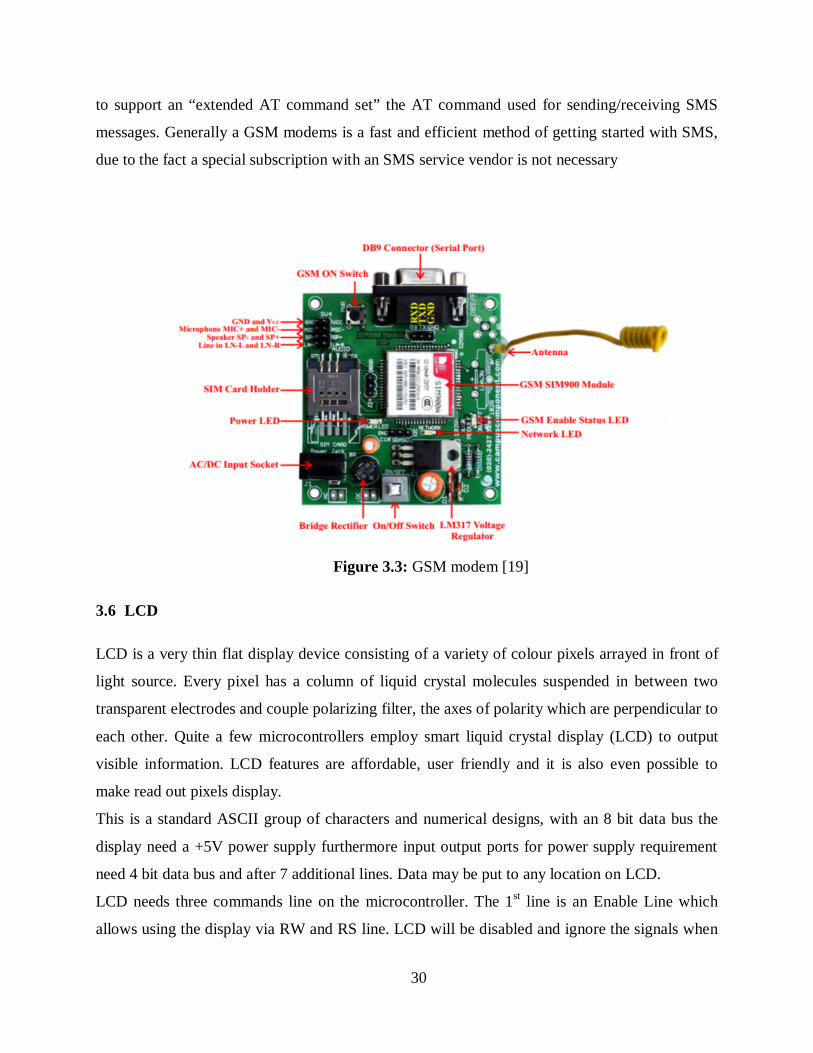
to support an “extended AT command set” the AT command used for sending/receiving SMS
messages. Generally a GSM modems is a fast and efficient method of getting started with SMS,
due to the fact a special subscription with an SMS service vendor is not necessary
Figure 3.3: GSM modem [19]
3.6 LCD
LCD is a very thin flat display device consisting of a variety of colour pixels arrayed in front of
light source. Every pixel has a column of liquid crystal molecules suspended in between two
transparent electrodes and couple polarizing filter, the axes of polarity which are perpendicular to
each other. Quite a few microcontrollers employ smart liquid crystal display (LCD) to output
visible information. LCD features are affordable, user friendly and it is also even possible to
make read out pixels display.
This is a standard ASCII group of characters and numerical designs, with an 8 bit data bus the
display need a +5V power supply furthermore input output ports for power supply requirement
need 4 bit data bus and after 7 additional lines. Data may be put to any location on LCD.
LCD needs three commands line on the microcontroller. The 1st line is an Enable Line which
allows using the display via RW and RS line. LCD will be disabled and ignore the signals when

31
the enable line is low from RW or RS and LCD checks the status of the two controller lines and
reacts accordingly if line is high, Read/Write(R/W), this line can determine the direction of
information between the LCD and microcontroller. Data information writes on LCD when it is
Low and we can read data on LCD when it is high. Register selects (RS); by using RS line LCD
interprets any type of data on data lines. Instructions written on the LCD are if it is low and
character written to the LCD when it is high.
Figure 3.4: LCD [5]
3.7 Voltage Regulator LM7805
LM7805 voltage regulators are designed for a wide range of applications. These applications
include on card regulation for elimination of noise and distribution problems associated with
single point regulation. Each of these regulators can deliver up to 1.5 A of output current. In
addition to being used as fixed-voltage regulators, these devices can be used with external
components to obtain adjustable output voltages and currents, and also can be used as the power-
pass element in precision regulators.
Figure 3.5: Voltage regulator [14]

32
3.8 Buzzer
A buzzer or beeper is an audio signaling device which may be mechanically, electromechanically
and piezoelectric. Typical uses of buzzer include alarm devices, timers and confirmation of user
input.
3.9 Serial Port Interface MAX 232
Serial port interface is a parallel interface which sends and receives 8 bits data at the same time
over 8 individual wires. This way data will be transferred very quickly, however each cable will
be bulkier because of the number of individual wires it contains. Parallel port is generally used to
connect a personal computer to a printer. A serial port can send and receive data only 1 bit at a
time. Although it takes time to transfer each bite of data, this way only few bites are required, so
full duplex communication can be done.
In full duplex communication we can send and receive data at a same time, hence we can send
data using three separate wires and receive data on another three wires as well as common signal
ground wire [28].
Figure 3.6: Interfacing circuit of serial port [6]

33
3.10 Summary
This chapter was about hardware components which we really need for simulation. In this
chapter we were explained the funtion of each fundamental components that how is works.

34
CHAPTER FOUR
DESIGN, SIMULATION AND ANALYSIS
4.1 Overview
The goal of this chapter is to describe the design and simulation of a hardware system that can be
used to monitor up to 10 patients in a hospital. This system is to check each patient’s body
temperature, heart rate, hemoglobin level, and patient state index monitor and glucose levels. If
the value of any measured physiological parameter crosses a set value, this device can send
warning or emergency messages using GSM technology to a remote doctor’s mobile in the form
of SMS. Measurements are done using multiple devices connected to the patients’ body. Then,
this information is send to a microcontroller for processing.
4.2 Aim
In emergency cases and risky situations, the doctor’s visit to the patient is important and the
unavailability of a local doctor may result in death. It is the aim of the system designed here to
warn, either locally or remotely, a doctor when a physiological measurement indicates something
critical. The system may provide connectivity using GSM technology (SMS to be precise)
between the patient and the doctor/paramedical staff for immediate attention.
4.3 Design
Patient monitoring system designed here uses various devices for physiological measurements,
such as the measurement of body temperature, heart rate, hemoglobin level, brain level and
glucose level, and sends all data to a local microcontroller so that the patient’s health could be
monitored by a doctor anywhere inside or outside the hospital. This monitoring system may be
used for multiple patients in an emergency room (ER) oran intensive care unit (ICU) where
multi-patient information is collected from multiple sensors. LM35 sensors may be used for body
temperature and MASIMO radical-7 pulse co-oximetry devices may be used for continuous
hemoglobin level and brain level. For pulse rate, fingertip sensors and for glucose level,

35
continuous glucose measurement (CGM) devices produced by companies like Abbott and
DEXCOM may be used.
4.4 Patient Monitoring System
Block diagram of the patient monitoring system is shown in Figure 4.1. A microcontroller is
used to obtain information from multiple devices that values of physiological measurements,
which may then be locally displayed on LCD screens, saved or transmitted using GSM
technology.
When a patient’s physiological parameter crosses an internally set value, then this device may
turn on a buzzer to warn a local doctor of emergency or send a warning message to the doctor’s
cell phone. This way, long distance specialist advice could be sought in order to provide
enhanced medical facilities to areas that lacks basic infrastructure.
Table 4.1 shows the values of physiological parameters that trigger warning messages or
emergency messages.
Table 4.1: Critical values for Measured Physiological Parameters
Physiological Parameters Low value High Value Emergency Warning
Body temperature (oF) 80 120 >120 >110 or <80
Glucose level (mg/dL) 80 120 >120 >110 or <80
Pulse rate (beats/min.) 80 120 >120 >110 or <80
Hemoglobin level (g/dL) 13.8 17.2 >17.2 >15.2or<13.8
Patient state index Monitor 25 100 >100 >75or<25

36
Figure 4.1: Block diagram of patient monitoring systems

37
4.5 Proteus Simulation Software
It is simulation software for different designs with micro controller. Proteus is very popular
because use of all microcontroller inside it. Therefore, it is a very useful tool to evaluate the
programs and embedded design for electronics. We can simulate our programming of
microcontroller with proteus simulating software. After simulating we are able to make directly
PCB design by using this software.
The very important feature regarding Proteus is usually having the ability to simulate the
particular discussion between computer and microcontroller with analogue and digital electronics
connected with this. Although, the Proteus has special capacity to operate a real time simulation
regarding and determined to microcontroller methods. Proteus is a tangible which can do a large
amount of simulation with single face function. The Proteus comes with precise characteristics
and research for text messaging. This is very beneficial to be considered debugging help
allowing for this designer to find out the problems in the software application as well as
hardware is much quicker when compared with others.
Figure 4.2(A) and figure 4.2(B) shows the circuit diagram of the monitoring system. This system
can be divided into three main units:
Patient Monitoring Unit
Local Observation Unit
Remote Transmission Unit

38
Figure 4.2 a: Circuit diagram of patient monitoring system

39
Figure 4.2 b: Circuit diagram of patient monitoring system
40
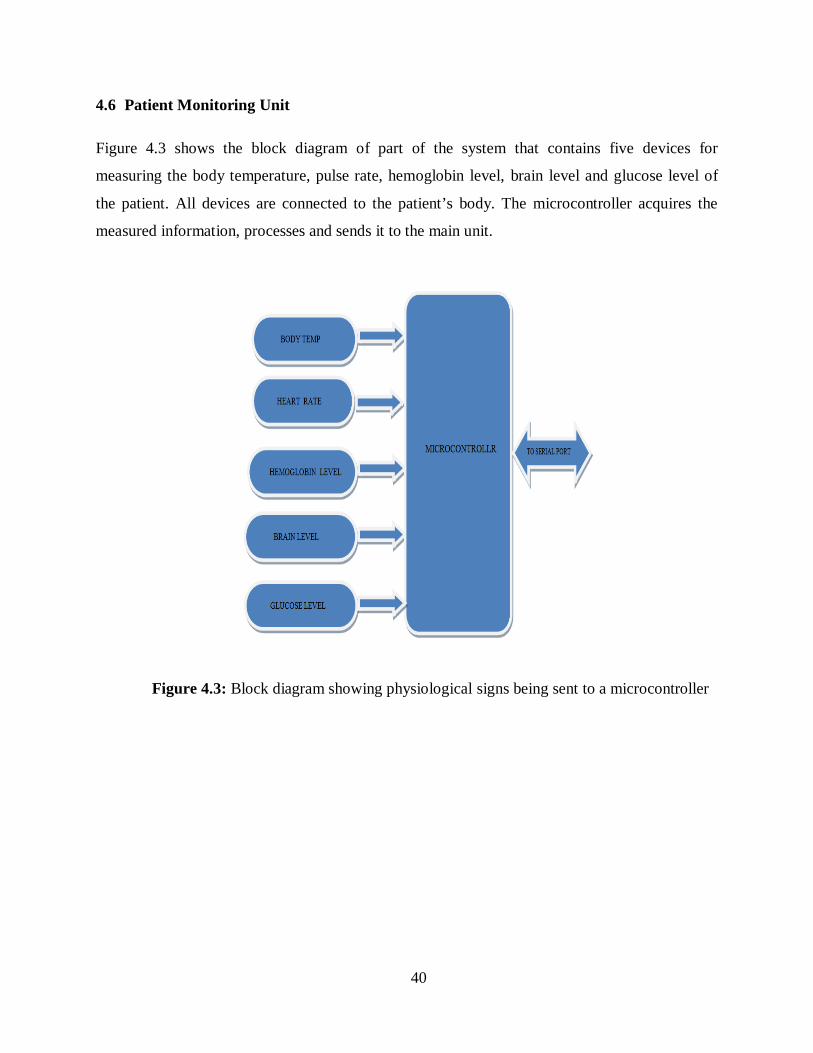
4.6 Patient Monitoring Unit
Figure 4.3 shows the block diagram of part of the system that contains five devices for
measuring the body temperature, pulse rate, hemoglobin level, brain level and glucose level of
the patient. All devices are connected to the patient’s body. The microcontroller acquires the
measured information, processes and sends it to the main unit.
Figure 4.3: Block diagram showing physiological signs being sent to a microcontroller

41
4.6.1 Body Temperature Measurement
This body temperature sensor shows in Figure 4.4, which is usually called an analog temperature
sensor, offers a voltage output which changes linearly relative to the temperature of the body.
When the temperature increases its mean voltage also increases. Increasing and decreasing the
voltage temperature will generate an analog signal which is directly proportional to the
temperature.
Figure 4.4: Body temperature sensor

42
4.6.2 Pulse Rate Measurement
The heart rate sensor contains a light emitting diode (LED) and a light detection resistor (LDR)
parallel to each other. The patient just needs to put his/her finger in between them to measure the
heart rate.
Figure 4.5 Pulse rate sensor

43
4.6.3 Continuous Glucose Monitoring (CGM)
A very small sensor is inserted into the patient’s skin to test the glucose level. Measured values
are then sent to the microcontroller through serial port.
Figure 4.6: Wireless glucose monitor device
4.6.4 Hemoglobin Level Measurement
Radical-7 co-oximetry sensor may be used to measure the hemoglobin level of the patient. Data
is then sent to the microcontroller through serial port.
Figure 4.7: Hemoglobin measuring sensor

44
4.6.5 Patient state index Monitor
It is used to enhance the patient’s care and reduce the risk of death when the patient is under the
anesthesia (anesthesia, is a temporary state consisting of unconsciousness, loss of memory, lack
of pain, and muscle relaxation). A sensor is attached to the patient’s brain which measures the
patient brain status all these values are sent to the microcontroller through serial port.
Figure 4.8: Patient state index monitor sensor
4.7 Local Observation Unit
Figure 4.9 shows the local observation unit which contains a microcontroller, a serial port, an
LCD, and an alarm.
Figure 4.9: Block diagram showing physiological measurements being displayed, saved
or used for local warning

45
4.7.1 Microcontroller
PIC-18F4520 microcontroller is a vital part of the main unit. PIC-18F4520 microcontroller
processes the measured data at fixed time intervals and sends the results to LCD, GSM
transmitter or buzzer alarm [34].
Figure 4.10: PIC-18F4520

46
4.7.2 Display unit
LCD is a 14 or 16 pin display unit which shows the measured information. 16 pin LCD is much
better than 14 pin as it contains extra functions and better features capabilities [34].
Figure 4.11: LCD (Display unit)

47
4.7.3 Buzzer Alarm
A buzzer or beeper is an audio signaling device which may be mechanical, electro mechanical
and piezoelectric. Typical uses of buzzer include alarm devices, timers and confirmation of user
input.
Figure 4.12: Buzzer alarm

48
4.7.4 Serial Port connector
Various devices collect data from sensors and want to transmit it to a different unit, just like a pc,
for further processing. Serial communication is used to send data to and from the
microcontroller. Serial communication in PIC-18F4520 microcontroller explains the interfacing
of the microcontroller with a computer via RS232 interface. With PIC-18F4520 microcontroller
has an inbuilt UART to carry out serial data. The communication within PIC-18F4520 is done in
the actual asynchronous method. A serial port, like other Computer ports, is a physical user
interface to establish data transfer between computer and an external hardware.
Figure 4.13: Serial port connector

49
4.8 Remote Transmission Unit
The third part of this system is the remote transmission unit where a doctor can observe the
patient’s condition via SMS. This way the doctor will have relevant and up-to-date information
about the patient's health and can instruct paramedical staff further action.
Figure 4.14: Block diagram showing messages being sent to doctor’s mobile
4.8.1 GSM Transmitter
A GSM transmitter is used as a wireless communication tool between the doctor and the patients.
After processing, microcontroller sends all data to GSM transmitter for transmission to the
doctor’s mobile in the form of SMS.
Figure 4.15: GSM Modem connect with microcontroller and serial port

50
4.9 Simulation and Analysis of 10 Patients Monitoring
The following sections analyze five different cases where warning and emergency messages are
displayed and transmitted during continuous monitoring of patients. Messages are sent to the
phone number displayed on the virtual terminal boxes.
Designed circuit includes two LCDs. LCD2 on the left is for glucose, hemoglobin, patient state
index and body temperature measurements and the other is for pulse rate measurements (Figure
4.6).
Figure 4.14: System LCD displays
51
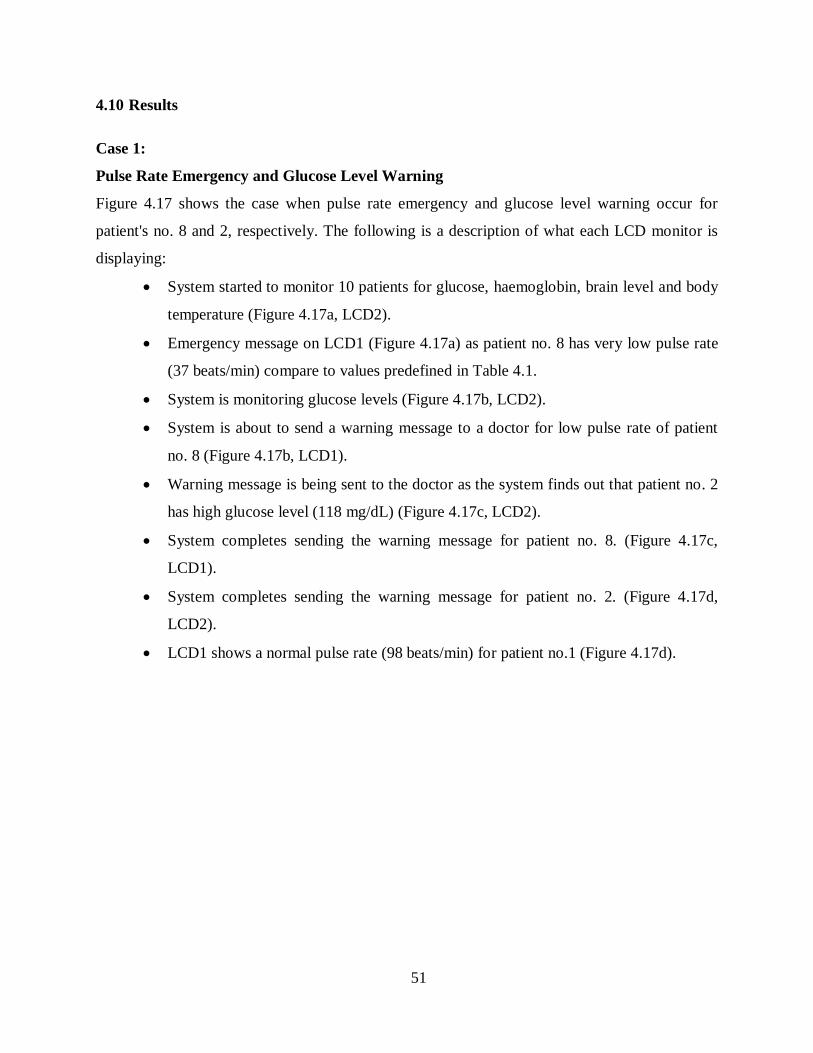
4.10 Results
Case 1: Pulse Rate Emergency and Glucose Level Warning
Figure 4.17 shows the case when pulse rate emergency and glucose level warning occur for
patient's no. 8 and 2, respectively. The following is a description of what each LCD monitor is
displaying:
System started to monitor 10 patients for glucose, haemoglobin, brain level and body
temperature (Figure 4.17a, LCD2).
Emergency message on LCD1 (Figure 4.17a) as patient no. 8 has very low pulse rate
(37 beats/min) compare to values predefined in Table 4.1.
System is monitoring glucose levels (Figure 4.17b, LCD2).
System is about to send a warning message to a doctor for low pulse rate of patient
no. 8 (Figure 4.17b, LCD1).
Warning message is being sent to the doctor as the system finds out that patient no. 2
has high glucose level (118 mg/dL) (Figure 4.17c, LCD2).
System completes sending the warning message for patient no. 8. (Figure 4.17c,
LCD1).
System completes sending the warning message for patient no. 2. (Figure 4.17d,
LCD2).
LCD1 shows a normal pulse rate (98 beats/min) for patient no.1 (Figure 4.17d).

52
(a) Pulse rate emergency (37 beats/min.) for patient no. 8 (LCD1)
(b) Emergency message being sent for patient no 8 (LCD1) and glucose monitoring for another patient (LCD2)
(c) Glucose warning being sent for patient no. 2 (LCD2) and low pulse rate emergency message sent for patient no.8 (LCD1)
(d) Glucose warning message sent for patient no.2(LCD2) Normal pulse rate (98 beats/min.) for patient no. 1(LCD1)
Figure 4.17: Messages being sent due to low pulse rate and high glucose level
53
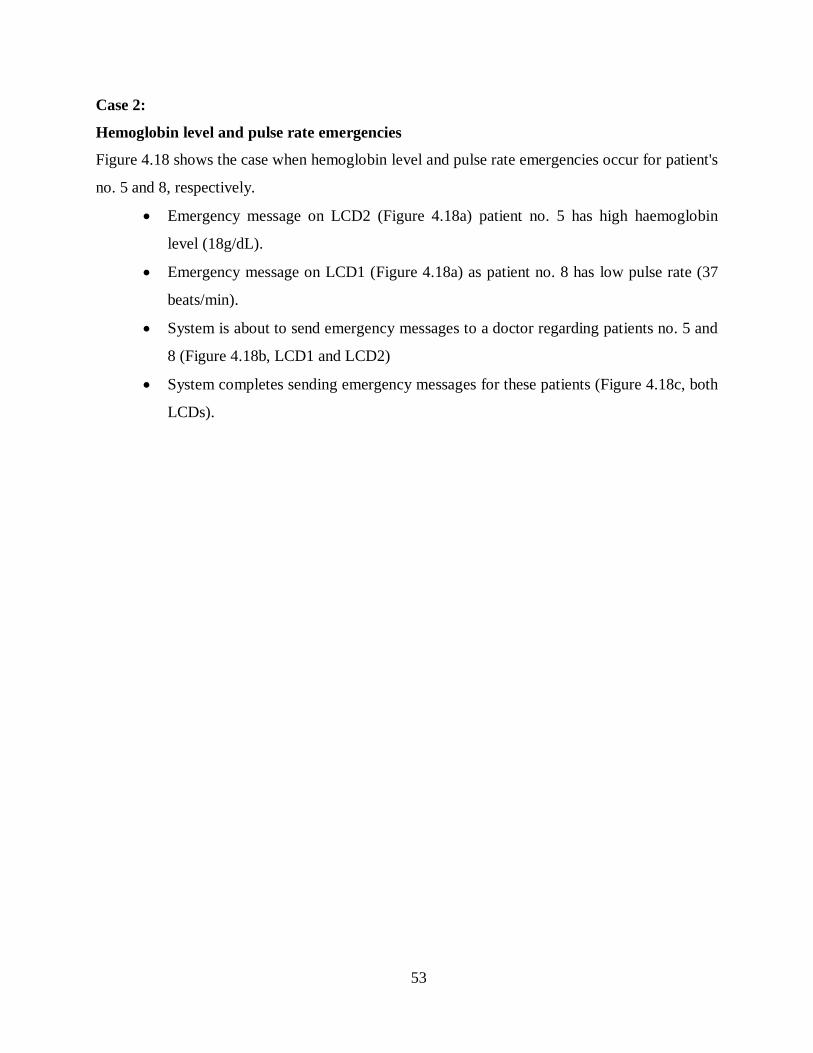
Case 2:
Hemoglobin level and pulse rate emergencies
Figure 4.18 shows the case when hemoglobin level and pulse rate emergencies occur for patient's
no. 5 and 8, respectively.
Emergency message on LCD2 (Figure 4.18a) patient no. 5 has high haemoglobin
level (18g/dL).
Emergency message on LCD1 (Figure 4.18a) as patient no. 8 has low pulse rate (37
beats/min).
System is about to send emergency messages to a doctor regarding patients no. 5 and
8 (Figure 4.18b, LCD1 and LCD2)
System completes sending emergency messages for these patients (Figure 4.18c, both
LCDs).

54
Figure 4.18: Emergency messages for high hemoglobin and low heart rate
(a) Hemoglobin emergency (18 g/dL) for patient no. 5 (LCD2). Pulse rate emergency (37 beats/min) for patient no.8 (LCD1)
(b) Emergency messages being sent for patient no.5 for high hemoglobin level (LCD2) and patient no.8 for low pulse rate (LCD1)
(c) Both emergency messages sent (LCDs 1 and 2)
55
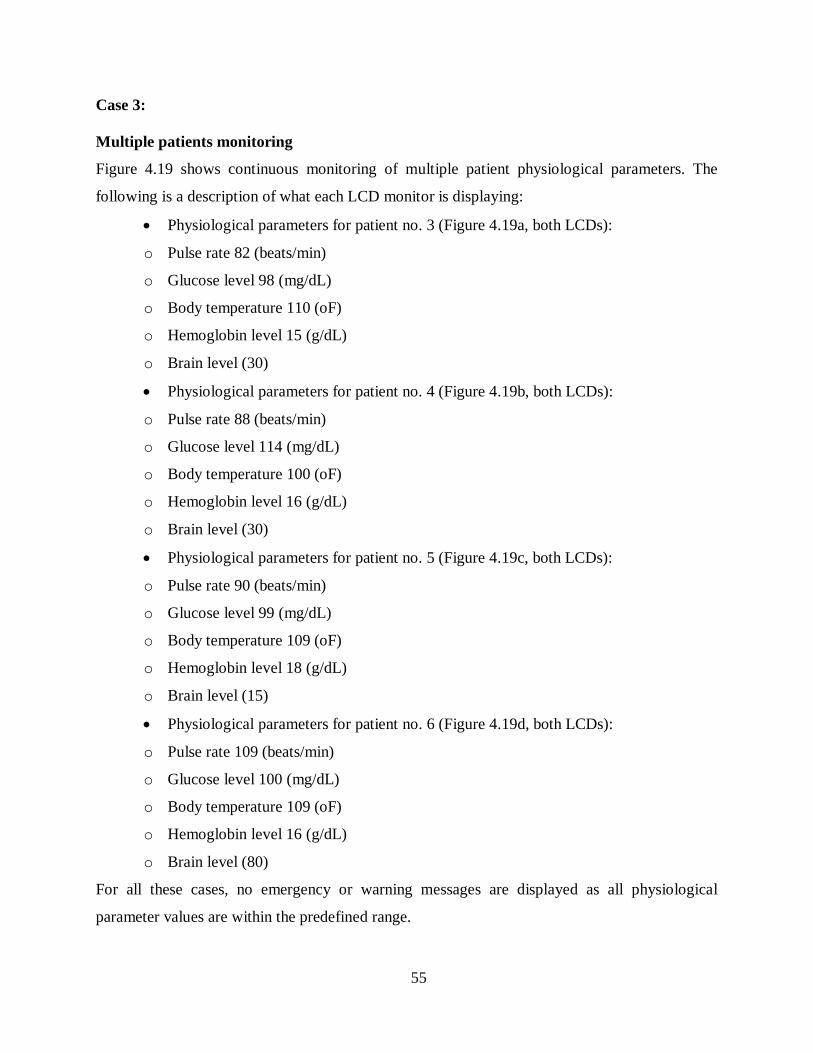
Case 3: Multiple patients monitoring
Figure 4.19 shows continuous monitoring of multiple patient physiological parameters. The
following is a description of what each LCD monitor is displaying:
Physiological parameters for patient no. 3 (Figure 4.19a, both LCDs):
o Pulse rate 82 (beats/min)
o Glucose level 98 (mg/dL)
o Body temperature 110 (oF)
o Hemoglobin level 15 (g/dL)
o Brain level (30)
Physiological parameters for patient no. 4 (Figure 4.19b, both LCDs):
o Pulse rate 88 (beats/min)
o Glucose level 114 (mg/dL)
o Body temperature 100 (oF)
o Hemoglobin level 16 (g/dL)
o Brain level (30)
Physiological parameters for patient no. 5 (Figure 4.19c, both LCDs):
o Pulse rate 90 (beats/min)
o Glucose level 99 (mg/dL)
o Body temperature 109 (oF)
o Hemoglobin level 18 (g/dL)
o Brain level (15)
Physiological parameters for patient no. 6 (Figure 4.19d, both LCDs):
o Pulse rate 109 (beats/min)
o Glucose level 100 (mg/dL)
o Body temperature 109 (oF)
o Hemoglobin level 16 (g/dL)
o Brain level (80)
For all these cases, no emergency or warning messages are displayed as all physiological
parameter values are within the predefined range.

56
(a) Continuous physiological parameter monitoring for patient no.3
(b) Continuous physiological parameter monitoring for patient no.4
(c) Continuous physiological parameter monitoring for patient no.5
(d) Continuous physiological parameter monitoring for patient no.6
Figure 4.19: Multiple patient information evaluation

57
Case 4:
High body temperature emergency for patient no.9
Figure 4.20 shows the case when high body temperature emergency occurs for patient no. 9. The
following is a description of what each LCD monitor is displaying:
Emergency for patient no. 9. Very high body temperature (127 oF) (Figure 4.20a,
LCD2).
Patient no. 1 is being monitored. His/her pulse rate is normal at 98 beats/min. (Figure
4.20a, LCD1)
System is sending an emergency message for patient no. 9 (Figure 4.20b, LCD2).
Pulse rate of patient no. 2 is being monitored. It is 102 beats/min. (Figure 4.20b,
LCD1)
Emergency message is sent to a doctor for patient no. 9 (Figure 4.20c, LCD2).
Patient no. 3 is being monitored. His/her pulse rate is 82 beats/min. (Figure 4.20b,
LCD1)

58
(a) Emergency message for patient no.9 due to high temperature (127 oF) on LCD2. Normal pulse rate (98 beats/min.) for patient no. 1.
(b) Emergency message being sent for patient no. 9 (LCD2).Monitoring the pulse rate of patient no.2(102 beats/min)
(c) Emergency message sent (LCD2). System is monitoring pulse rate of patient no. 3 (LCD1)
Figure 4.20: High temperature emergencies for patient no.9

59
Case 5:
High temperature emergency for patient no.8
In this case, a doctor is being warned as patient no. 8 has high temperature (Figure 4.21). The
following is a description of what each LCD monitor is displaying:
Patient no. 8 has a high temperature at 122 oF (Figure 4.21a, LCD2).
Patient no. 2 has a pulse rate of 102 beats/min. (Figure 4.21a, LCD1).
System is sending an emergency message for patient no. 8 (Figure 4.21b, LCD2).
Patient no. 3 has a pulse rate of 82 beats/min. (Figure 4.21b, LCD1).
System finished sending the message for patient no. 9 (Figure 4.21c, LCD2).
Patient no. 4 has a pulse rate of 88 beats/min. (Figure 4.21c, LCD1).

60
(a) High temperature emergency (122 oF) for patient no.8 on LCD2. LCD 1 shows a normal pulse rate for patient no.2 (102 beats/min.)
(b) Emergency message being sent for patient no. 8 (LCD2). Monitoring the pulse rate for patient no.3(82 beats/min)
(c) Emergency message sent (LCD2). System is monitoring pulse rate of patient no. 4 (LCD1)
Figure 4.21: High temperature emergency for patient no.8

61
4.11 Discussion and Comparision
The monitoring of the patient’s vital signs is carried out by manually practiced since so many
years. But due to the congestion and advent of new technology appealed to have such type of
monitoring system that will not require a dedicated paramedical staff member for the job. So
basic motivation was taken from the remote patient monitoring system with earlier
communication channel devices like infrared and Bluetooth. In these types of monitoring
systems, the receiving node should be placed near vicinity of the patient and some has to take
values from hub or server system. So the problem persisted for bounding someone to be limited
at hospital vicinity. With the arrival of GSM (Global system for Mobile) technology, the said
problem is addressed as the values or readings are directly transmitted to the receiver far away
from the sender’s location. So the word “remotely” was given actual meaning in this regards.
The problem in that type of the system arises when there is some exceptional situation arises.
The receiver node (doctor) will be always receiving too many messages even if the patient is
under normal conditions and there is no need for those values. So, one advancement in my
proposed method is that it is not always sending each value to doctor or whoever is attending.
There are two thresholds values for intimation to doctor about abnormality. One is Warning
Message that contains those values of abnormality for which doctor should give attention. The
other is Emergency Message that contains those values that must be seen by doctor or should be
addressed at immediate basis.
The systems developed before that are capable for transmitting the values taken directly from
the sensors over GSM Module but through my proposed method, the values coming from the
sensors and the measuring device (MASIMO) which is connect to the patient's and this device
can measure multiple vital parameters and the output of the device will be directly fed to the PC
and then microcontroller get all information via serial port, it is being compared with the average
values stored in the system’s database.
The database is developed through normal tendency of the values of vital signs. Then after the
values are compared, decisions are made under programming code whether the value should be
treated as normal value, Emergency or Warning. The values are being stored as well as fed to the
microcontroller. Microcontroller will take values from PC and Sensors directly connected to it.
So storing and analyzing is done in parallel. Earlier systems are only capable for monitoring
basic vital signs like temperature and heart beat rate but my proposed system will monitor five

62
vital signs Heart Rate, Hemoglobin level, Body Temperature, Patient state index and Glucose
level.
The earlier systems are only measuring the vital signs of just one patient at one time but my
proposed system will take ten patients in parallel and will compare and analyze 50 values at one
instant. So in this respect, more sophistication and better applicability is achieved through
availability of more clients and quick response if any abnormality occurs. The reliability is
ensured by the prominent and well known simulation software like Keil® and Proteus Micro
vision ® so that ease of use and efficient modification can be adopted through inherited features
of the software. Expansion in design or flexibility in design can be achieved by using common
type of algorithms and programming language as well as fully-featured software.
The proposed system has been design showed results in different case.
Case 1:
Pulse Rate Emergency and Glucose Level Warning
Figure 4.17 shows the case when pulse rate emergency and glucose level warning occur
for patient's no. 8 and 2, respectively.
Case 2:
Hemoglobin level and pulse rate emergencies
Figure 4.18 shows the case when hemoglobin level and pulse rate emergencies occur for patient's
no. 5 and 8, respectively.
Case 3: Multiple patients monitoring
Figure 4.19 shows continuous monitoring of multiple patient physiological parameters. The
following is a description of what each LCD monitor is displaying.
Case 4:
High body temperature emergency for patient no.9
Figure 4.20 shows the case when high body temperature emergency occurs for patient no. 9.
Case 5:
High temperature emergency for patient no.8
In this case, a doctor is being warned as patient no. 8 has high temperature (Figure 4.21). The
following is a description of what each LCD monitor is displaying:
63
4.12 Summary
In this chapter we discussed about the design and simulation of a hardware system that can be
used to monitor up to ten patients . Patient monitoring system designed here uses various devices
for physiological measurements, such as the measurement of body temperature, heart rate,
hemoglobin level, patient state index and glucose level, and sends all data to a local
microcontroller. Few different cases have been discussed to see different output results.

64
CHAPTER FIVE
CONCLUSIONS AND FUTURE WORKS
This thesis designs and simulates a patient monitoring system that can be connected to various
physiological measuring instruments in order to analyze the results and alert local or remote
medical staff whenever a critical measurement is taken. Local alert is carried out using a buzzer
alarm, whereas a remote doctor is cautioned with an SMS sent to his/her mobile using GSM
technology. The system is to take inputs from medical devices measuring patient body
temperature, related to the readings is displayed on two different LCDs.heart rate, hemoglobin
level, brain level and glucose levels, and a microcontroller is used to analyse the results. Any
information Simulations are carried out in order to observe how this system reacts to critical
measurements of patient pulse rate, glucose level, hemoglobin level and body temperature. It can
be seen from these simulations that the patient monitoring system is able to easily detect
whenever any physiological parameter goes out of a predefined range and warn related local or
remote staff for proper and timely care. This can be done for one as well as multiple patients.
Remote monitoring capability of this system is especially useful as it provides the following
advantages: (a) reduces the cost of hiring staff (b) reduces the cost of needing to expand hospital
space in order to care for more patients (c) multiple patients can be monitored at the same time
(d) patients can get help at home (e) effective for those who need constant monitoring such as
elderly or people who are disabled (f) emergency patients can be given priority over chronic
patients.
Future work includes enhancing the present system in order to analyze additional physiological
parameters and care for more patients. On top of data transmission, voice or video transmission
capability may also be added so that the patient may give remote medical staff a better
description of what is actually wrong.

65
REFERENCES
[1] Shin, D. (2007). Patient monitoring system using sensor network based on the
zigbee radio. In Proceedings of the 6th International Conference on Information
Technology. (pp. 313– 315) Tokyo:University of Ulson Collage of Medicine of Korea.
[2] Alamri, A., Ansari, S., Hassan, M., Hossain, M., Alelaiwi, A., & Hossain,M. (2013).
Wireless patient health monitoring system. In Proceedings of 7th International
Workshop on Enterprise Networking and Computing in Healthcare Industry (pp 31–
36). Trivandrum: King Fahd University.
[3] Jain, P., Nitin, P., Preeti N. Jain, & Trupti. (2012). An embedded, GSM based,
multiparameter, real-time patient monitoring system and control. World Congress on
Information and Communication Technologies. 987 – 992. IEEE.
[4] Rubin, R., & Peyrot, M. (2001). Psychological issues and treatments for people with
diabetes. Journal Of Clinical Psychology, 57(4), 457-478.
[5] Ramanathan, P. (2014). Analysis of the Building Stability Using MEMS in Wireless
Sensor Networks. International Journal of Computer Science & Information
Technologies, 5(1), 77-79.
[6] Dally, W. (2001). Route packets, not wires. In Proceedings 2001 Conference on
Chip Interconnection Networks Design of Automation (pp. 684-689). IEEE.
[7] Brage, S., Brage, N. (2005). Reliability and validity of the combined heart rate and
movement sensor Actiheart. European Journal of Clinical Nutrition, 59(4), 561-570.
[8] Musialek, P., Lei, M., Brown, H. F., Paterson, D. J., & Casadei, B. (1997). Nitric
oxide can increase heart rate by stimulating the hyperpolarization-activated inward
current. Circulation Research, 81(1), 60-68.
[9] Malhi, K., Mukhopadhyay, S. C., Schnepper, J., Haefke, M., & Ewald, H. (2012). A
Zigbee-based wearable physiological parameters monitoring system. Sensors Journal,
IEEE, 12(3), 423-430.
[10] Pouwelse, J., Langendoen, K., & Sips, H. (2001, July). Dynamic voltage scaling on
a low-power microprocessor. In Proceedings of the 7th annual International
Conference on Mobile Computing and Networking (pp. 251-259). ACM.

66
[11] Shepherd, R. (2001). Bluetooth wireless technology in the home. Electronics &
Communication Engineering Journal, 13(5), 195-203.
[12] Cox, M. (2009). An Overview of Continuous Glucose Monitoring Systems.
Journal of Pediatric Health Care, 23(5), 344–347.
[13] Primicanta, A. (2010, June). ZigBee-GSM based automatic meter reading system.
In proceeding International Conference on Intelligent and Advanced Systems (pp. 1-
5). IEEE.
[14] Person, A., & Christian L. (2006). Specifications for a Smart Alarm Clock.
Voltage regulator, from http://en.wikipedia.org/wiki/Voltage_regulator/2010/09/19
[15] Olwal, A., Feiner, S., & Heyman, S. (2008, April). Rubbing and tapping for precise
and rapid selection on touch-screen displays. In Proceedings of the SIGCHI
Conference on Human Factors in Computing Systems (pp. 295-304). ACM.
[16] Robinson, L. J., Thompson, J. M., Gallagher, P., Goswami, U., Young, A. H.,
Ferrier, I. N., & Moore, P. B. (2006). A meta-analysis of cognitive deficits in
euthymic patients with bipolar disorder. Journal of Affective Disorders, 93(1), 105-
115.
[17] Horstman, J. (2010). The Scientific American Brave New Brain. John Wiley &
Sons.
[18] Prichep, L. (2004). The Patient State Index as an indicator of the level of hypnosis
under general anaesthesia. British Journal Of Anaesthesia, 92(3), 393-399.
[19] Elena, M., Quero, J. M., Tarrida, C. L., & Franquelo, L. G. (2002, October). Design
of a mobile telecardiology system using GPRS/GSM technology. In Proceeding of
the Second Joint EMBS/BMES Conference (pp. 1168-1180), Houston October.
[20] Agrawal, A. (2013). Patient Safety. Springer.
[21] Sinha, P. K., & Koshy, T. (2007). Monitoring devices for measuring the depth of
anaesthesia-An overview. Indian Journal of Anaesthesia, 51(5), 365.
[22] Hagenouw, R., Kalli, I., Coleman, B., Engel, T., Feldman, J., Gardner, R., ... &
Kochs, E. (1996). Anesthesia and Intensive Care, Rotterdam, The Netherlands.
International Journal of Clinical Monitoring and Computing, 13, 113-137.
[23] Wingerd, B. (2013). The human body concepts of anatomy and physiology.
Lippincott Williams & Wilkins.

67
[24] Mazidi, M. A., Mazidi, J. G., & McKinlay, R. D. (2006). The 8051 Microcontroller
and embedded systems: using Assembly and C (Vol. 626). Pearson/Prentice Hall.
[25] Rubin, R., & Peyrot, M. (2001). Psychological issues and treatments for people
with diabetes. Journal of Clinical Psychology, 57(4), 457-478.
[26] Hameed, L. D. J. A., & Ibrahim, K. W. (2014). Control Of Appliance By SMS
Using Pic18f4550 Microcontroller. Journal of Engineering & Development, 301-311.
[27] Huang, H. C., Siao, C. J., & Chen, Y. G. (2013, October). The rehabilitation system
of finger joints. In Proceeding 13th International Conference on Control, Automation
and Systems (pp. 1055-1060). IEEE.
[28] Sulaiman, M. H., Mustafa, M. W., Azmi, A., Aliman, O., & Abdul Rahim, S. R.
(2012, June). Optimal allocation and sizing of distributed generation in distribution`
system via firefly algorithm. In Proceedings of the International Conference in Power
Engineering and Optimization pedco melaka (pp. 84-89). IEEE.
[29] Rubin, R., & Peyrot, M. (2001). Psychological issues and treatments for people
with diabetes. Journal of Clinical Psychology, 57(4), 457-478.
[30] Malhi, K., Mukhopadhyay, S. C., Schnepper, J., Haefke, M., & Ewald, H. (2012). A
Zigbee-based wearable physiological parameters monitoring system. Sensors Journal,
IEEE, 12(3), 423-430.
[31] Qiu, Balraj, A., Patvardhan, A., Renuka Devi, V., Aiswarya, R., & Prasen, V.
(2010, March). Embedded temperature monitoring and control unit. In Proceeding on
the International Conference on Recent Trends in Information, Telecommunication
and Computing (ITC) (pp. 293-297). IEEE.
[32] Williams, B. J. (2011). Exploring the psychic brain: on neuroscience and psi
phenomena. Australian Journal of Parapsychology, 11(2), 154.
[33] Horstman, J. (2010). The Scientific American Brave New Brain. John Wiley &
Sons.