microbial community structure and dynamics in the largest
TRANSCRIPT

Microbial Community Structure and Dynamics in the LargestNatural French Lake (Lake Bourget)
J. Comte1, S. Jacquet2, S. Viboud1, D. Fontvieille1, A. Millery1, G. Paolini3 and I. Domaizon1
(1) UMR CARRTEL, Universite de Savoie, Equipe de Microbiologie Aquatique, 73376 Le Bourget-du-Lac Cedex, France(2) UMR CARRTEL, Station INRA d�Hydrobiologie Lacustre, Equipe de Microbiologie Aquatique, 74203 Thonon Cedex, France(3) Cellule Technique de l�Aquarium du Bourget, 73100 Aix-les-Bains France
Received: 22 October 2003 / Accepted: 10 August 2004 / Online publication: 29 May 2006
Abstract
We investigated the dynamics and diversity of hetero-trophic bacteria, autotrophic and heterotrophic flagel-lates, and ciliates from March to July 2002 in the surfacewaters (0–50 m) of Lake Bourget. The heterotrophicbacteria consisted mainly of ‘‘small’’ cocci, but filaments(>2 lm), commonly considered to be grazing-resistantforms under increased nanoflagellate grazing, were alsodetected. These elongated cells mainly belonged to theCytophaga-Flavobacterium (CF) cluster, and were mostabundant during spring and early summer, when mixo-trophic or heterotrophic flagellates were the main bacte-rial predators. The CF group strongly dominatedfluorescent in situ hybridization–detected cells fromMarch to June, whereas clear changes were observed inearly summer when Beta-proteobacteria and Alpha-pro-teobacteria increased concomitantly with maximal protistgrazing pressures. The analysis of protist communitystructure revealed that the flagellates consisted mainly ofcryptomonad forms. The dynamics of Cryptomonas sp.and Dinobryon sp. suggested the potential importance ofmixotrophs as consumers of bacteria. This point wasverified by an experimental approach based on fluorescentmicrobeads to assess the potential grazing impact of allprotist taxa in the epilimnion. From the results, threedistinct periods in the functioning of the epilimneticmicrobial loop were identified. In early spring, mixo-trophic and heterotrophic flagellates constituted the mainbacterivores, and were regulated by the availability of theirresources mainly during April (phase 1). Once the ‘‘clearwater phase’’ was established, the predation pressure ofmetazooplankton represented a strong top-down force onall microbial compartments. During this period only
mixotrophic flagellates occasionally exerted a significantbacterivory pressure (phase 2). Finally, the early summerwas characterized by the highest protozoan grazing im-pact and by a rapid shift in the carbon pathway transfer,with a fast change-over of the main predators contribu-tion, i.e., mixotrophic, heterotrophic flagellates and cili-ates in bacterial mortality. The high abundance of ciliatesduring this period was consistent with the high densitiesof resources (heterotrophic nanoflagellates, algae, bacte-ria) in deep layers containing the most chlorophyll. Bac-teria, as ciliates, responded clearly to increasingphytoplankton abundance, and although bacterial grazingimpact could vary largely, bacterial abundance seemed tobe primarily bottom-up regulated (phase 3).
Introduction
Pelagic microbial ecosystems are characterized by acomplex set of dynamic interactions between organisms.Competition for nutrients and light, commensalism be-tween autotrophs and heterotrophic bacteria, recycling ofmaterial, cell lysis, and predation are typical processesimplicated in the ecological interactions between viruses,bacteria, micro-algae, and their predators (flagellates,ciliates, microzooplankton). Top-down (grazing), bot-tom-up (nutrient availability, amount of prey) controlsand viral lysis are primarily responsible for microbialpopulation structure and diversity, and they operatesimultaneously rather than separately.
Since the seminal papers of Pomeroy [57] and Azamet al. [6], heterotrophic bacteria have been shown to play acrucial role in aquatic ecosystems, as the principaldecomposers of organic matter [79], and as a main foodsource for microorganisms at the base of the trophic web[28, 37, 70]. The regulation of bacterial biomass, produc-tivity, and community structure by nutrients (both organicand inorganic) and grazing (by single-cell and multicel-
Correspondence to: I. Domaizon; E-mail: [email protected]
72 DOI: 10.1007/s00248-004-0230-4 d Volume 52, 72–89 (2006) d � Springer Science+Business Media, Inc. 2006

lular zooplankton) is thus a central issue in aquaticmicrobial ecology [50, 53, 70]. Heterotrophic nanoflagel-lates have long been viewed to be mainly responsible forbacterial biomass control [13, 55, 65]. Some studies havealso pointed out that ciliates [39, 44, 69], metazoans such asDaphnia and copepods [1, 21, 38, 82], as well as lytic viruses[12, 54, 60] may also play key roles in structuring theheterotrophic bacterial community. For example, protistpredation has been shown to induce some important shiftsin the structure and composition of bacterial communities,as a result of the potential selective predation on particularbacterial size classes or specific groups [28, 29, 37, 41, 55].To understand the complex interactions in microbial foodwebs, special attention has to be paid to fine dissection ofmicrobial compartments in order to identify relevantfunctional groups. Some studies recently stressed theimportance of developing a functional partitioning of allplanktonic compartments to distinguish possible carbonpathways within the pelagic food webs [23, 32]. Forexample, it appeared that mixotrophs, which are usuallyconsidered unimportant bacterial grazers, could play asignificant role in bacterivory and should be introduced ingeneral models of food webs [30]. Bacteria were, until re-cently, considered to be a homogeneous functional unit,but the development of the fluorescent in situ hybridiza-tion (FISH) technique has now made it possible to deter-mine the relative abundance of different phylogeneticgroups of bacteria. This technique allowed better analysesof seasonal successions within these groups, which aim toidentify regulating factors [2, 26, 56]. Several studies havesuggested that bacteria belonging to the Cytophaga-Flauobacterium (CF) cluster could be preferentially grazedby hetorotrophic nanoflagellates (HNF) or ciliates [37, 43].The FISH technique has also revealed that grazing-resistantmorphotypes (typically filaments and aggregates) canbe found in the major phylogenetic groups, such as thealpha-proteobacteria and beta-proteobacteria, and theCytophaga-Flavobacterium phylum [37, 70].
Understanding how the microbial food web worksalso requires consideration of the seasonal dynamics ofmicrobial communities [17, 31, 56]. The combinationand the importance as structuring forces of top-downand bottom-up controls show seasonal variations thatplay an important role in the structure and dynamics ofthe bacterial community, as demonstrated by Muylaertet al. [53] for eutrophic lakes.
The present article describes, for the first time, thestructure and dynamics of the microbial community(heterotrophic bacteria, picocyanobacteria, flagellates,and ciliates) in Lake Bourget over a period covering theonset of thermal stratification (March to July 2002). Ouraims were (1) to investigate the changes in microbialabundance and biomass according to season and depth(we chose not to consider only general functional groupsbut to dissect all investigated compartments); (2) to
examine the changes in bacterial composition and thedevelopment of forms resistant to protist grazing; and (3)to analyze the relative importance of mixotrophy withinthe protist community. This allowed us to propose aconceptual scenario for the succession of bacterial pre-dators in Lake Bourget, and hence of how the microbialfood web works over a well-defined period of time. Tosupport our hypotheses on regulation pathways, anassessment of protozoan grazing rates on bacteria wasused. These data provided an essential basis from whichto develop studies on microbial communities in LakeBourget; notably, it allowed us to conceptualize furtherexperimental approaches (Domaizon et al., in prep.).
Methods
Study Site and Sampling Strategy. The mesotrophicLake Bourget (45�44¢N, 05�51¢W, 231 m altitude) is lo-cated in the eastern part of France at the edge of the Alps. Itis a monomictic, and elongated (18 km long, 3 km wide),north–south orientated lake, with an area of 42 · 106 m2, atotal volume of 3.5 · 109 m3, a maximum and averagedepth of 145 and 80 m, respectively, and a water residencetime of approximately 10 years. Water samples were col-lected from March to July 2002 at five depths (2, 6, 10, 30,and 50 m) at the reference station located in the middle anddeepest part of the lake, referred to as point B. This stationis more than 1.5 km from each bank, and more than 5 and10 km from the two main freshwater inputs to the lake. Theanalysis of bacterial composition by the FISH technique(see below) was only performed at the 2 and 50 m depths.
Physicochemical Variables. Nutrient concentra-tions (N total, NH4
+, NO3), P total, PO43)) have been
measured at the hydrobiological station Institut NationalRecherche Agronomique (INRA) [4] (details available athttp://www.thonon-inra-chimie.net/pages/public/analy-ses.asp). The concentration of dissolved organic carbon(DOC) was measured with a carbon analyzer (Labtoc, UVpromoted persulfate oxidation, IR detection) in watersamples (15 mL) filtered through a 0.2-lm pore sizepolycarbonate filter (data not shown). A conductivity-temperature-depth measuring device (CTD SEABIRD SBE19 Seacat profiler) was used to obtain vertical profiles fromthe surface to the bottom of the water temperature gradientand of the oxygen concentration, using an oxygen probe, apolarographic YSI 5739 electrode (data not shown).
The chlorophyll a (Chla) was measured in situ usinga submersible spectrofluorometer that was calibrated toperform the survey of chlorophyll vertical distribution onthe basis of the chlorophyll fluorescencse intensity at 680nm (due to photosystem II core pigments) [46]. For adetailed description and functioning of this FluoroProbe,see Beutler et al. [8] and Leboulanger et al. [46].
COMTE ET AL.: MICROBIAL COMMUNITY STRUCTURE AND DYNAMICS IN THE LAKE BOURGET 73

Microorganism Counts. A 1-mL sample for bac-teria was fixed with formaldehyde (final concentration:3.7%), and stored at 4�C until it was analyzed (within 3days after sampling). Heterotrophic bacteria were con-centrated on black polycarbonate membranes (diameter:47 mm, pore size: 0.2 lm) by filtering under reducedpressure of <150 mm Hg. Cells were stained by coveringthe filter with Di Aminido Phenyl Indol (DAPI) (finalconcentration: 0.04 lg mL)1) according to technique ofPorter and Feig [58]. Microscopic counting was per-formed using an epifluorescence microscope (Nikon,Eclipse TE200). Besides the DAPI-stained small cells, wefound filamentous bacteria (>2 lm). The biovolume ofmore than 400 bacteria was measured using a semi-automatic image analysis system (Lucia 4.6, LaboratoryImaging Ltd, Czech Republic) and was converted tocarbon units using the allometric relationship proposedby Loferer-Kroßbacher et al. [38].
The frequency of dividing cells was determined andused as an estimator of bacterial productivity. We dem-onstrated through a seasonal study (May to August) thatin Lake Bourget the [3H]thymidine incorporation rateinto bacterial DNA is significantly correlated with thenumber of dividing cells (NDC) (r = 0.74, n = 18, P <0.01): [3H]thymidine incorporation = 0.0084 ·NDC ) 0.0354 ([3H]thymidine: nmole L)1 h)1 ; NDC:107 cells L–1) (Domaizon et al., unpublished).
Under green light, the phycoerythrin content of thepicocyanobacteria produced a red-orange autofluores-cence [74], which made it possible to count thepicocyanobacteria collected on 0.8-lm polycarbonatemembranes using epifluorescence microscopy. The meanbiovolume was determined by the same image-analysissystem used for heterotrophic bacteria. The conversionfactor of 360 fgC lm)3 was used to obtain the biomass ofpicocyanobacteria [76].
Glutaraldehyde (1% final concentration) was used tofix the flagellates. Samples were filtered (pressure <100mm Hg) on polycarbonate membranes (diameter: 25 mm,pore size: 0.8 lm), then stained with primulin [14] andstored at the most a few days at )20�C until analysis.Slides were examined under UV light to count the het-erotrophic nanoflagellates, and under blue light to countthe autotrophic flagellates at 1250 · magnification. Greenlight (545 nm) was useful to display phycoerythrin-con-taining flagellates. Flagellate counts were converted into
biomass using a conversion factor of 220 fgC lm)3 [11].Ciliates were preserved with mercuric bichloride (25%)and identified and counted (within 15 days after sam-pling) according to the method Sime Ngando et al. [67].The sedimentation of samples was carried out over 48 h inan Uthermhol column, and the observation was recordedwith an inverted microscope at a 1250 · magnification.The C content of ciliates was calculated from the biovo-lume using the conversion factor of 190 fgC lm)3 [61].
FISH. Five Carbonindocyanine 3 (CY3)-labeledoligonucleotide probes (Microsynth, Swiss) were used inthis study (Table. 1). As described by Alfreider et al. [2],cells fixed with formaldehyde (3.7%) were collected onwhite polycarbonate membranes (diameter: 25 mm, poresize: 0.2 lm) by applying reduced pressure <150 mm Hg;they were then stored at )20�C until analysis. Each filterwas cut into several sections, which were placed on glassslides and covered with 20 lL of a hybridization bufferprewarmed to 46�C. This buffer (0.9 M NaCl, 20 mMTris/HCl (pH = 7.4), 0.01% sodium dodecyl sulfate[SDS] was used with variable concentrations of for-mamide depending on the probe (ARC915, EUB338,ALF968: 20%); (BET42a, CF319a, GAM42a: 35%) plus 1lL of CY3-labeled oligonucleotide probe (50 ng lL)1).The BET42a probe was used with a competitor oligo-nucleotide. Samples were then incubated for 90 min at46�C. The filters were rinsed with 48�C prewarmedwashing buffer (450 mM NaCl for EUB338, ALF968,ARC915 or 100 mM for BET42a, CF319a, GAM42a, 20mM Tris HCl pH = 7.4, 5 mM EDTA, 0.01% SDS) andincubated for 15 min at 48�C. After drying, filter sectionswere stained with 10 lL of DAPI (10 lg mL)1) for 10 minin the dark at ambient temperature. The filters were thenrinsed in ethanol (70%) for 30 s, dried, and mounted onslides with Citifluor. The slides were examined under anepifluorescence microscope (Nikon Eclipse TE200) fittedwith a camera (Nikon Digital camera DXM 1200) undergreen light (detection of CY3-labeled bacteria) and underUV light (DAPI-stained cells) at 1250 · magnification.Each filter was counted using the semi-automatic imageanalysis system (Lucia 4.6, Laboratory Imaging Ltd).
Assessment of Protozoan Bacterivory. Grazingrates of ciliates and flagellates (heterotrophic andpotentially mixotrophic) on heterotrophic bacteria were
Table 1. Oligonucleotide probes used in this study
Probe Specificity Sequence of probe Target site %FAa Reference
EUB338 Bacteria GCTGCCTCCCGTAGGAGT 16S (338–355) 20 [4]ALF968 Alpha subclass of proteobacteria GGTAAGGTTCTGCGCGTT 16S (968–986) 20 [45]BET42a Beta subclass of proteobacteria GCCTTCCCACTTCGTTT 23S (1027–1043) 35 [39]CF319a Cytophaga flavobacterium cluster TGGTCCGTGTCTCAGTAC 16S (319–336) 35 [40]ARCH915 Archaea GTGCTCCCCCGCCAATTCCT 16S (915–935) 35 [64]aPercentage of formamide.
74 COMTE ET AL.: MICROBIAL COMMUNITY STRUCTURE AND DYNAMICS IN THE LAKE BOURGET

estimated from the ingestion of fluorescent micro-beads.We conducted three experiments of in situ grazingmeasurement, in surface layers (0–10 m) from March toAugust 2003 in order to estimate clearance rates for eachtaxon. The detailed protocol and discussion of themethod are presented in Domaizon et al. [23]. Experi-ments were conducted in duplicate in 250-mL glasscontainers where 0.5-lm tracer particles (FluoresbritePlain Microspheres, Polysciences) were added. The con-centration of the microspheres in each experimentalbottle was from 5% to 20% of the bacterial concentrationin the lake. Based on preliminary measurements of pre-dation kinetics realized in pre-alpine lakes [23; Domaizonunpublished], we chose an incubation time of 15 min.We analyzed samples at 0 min and 15 min in eachexperimental bottle. Ice-cold glutaraldehyde was added toeach sample (2% final concentration) for minimizing theegestion of particles [65]. The microbeads ingested byflagellates were counted after filtering each sample (30mL) onto an 0.8-lm polycarbonate black membrane(Nucleopore) and staining by primulin according to theprotocol described by Caron [14]. Flagellates and mi-crobeads were observed at a 1250 · magnification underUV and blue light. Briefly, UV light allowed display ofmicrobeads and all flagellates that were primulin-stained.On the same microscopic field, pigmented flagellateswere distinguished by switching on blue light to observethe autofluorescence of chlorophyll a. Taxa that hadplastids and ingested microbeads were considered asmixotrophs. Beads ingested by ciliates were observed byinverted microscopy after sedimentation. Clearance rates(nL flagellate)1 h)1 or nL ciliate)1 h)1) were calculatedfor each taxon by dividing the number of ingested beadsper hour by the bead concentration in the bottle. Theclearance rates fell within the range of values publishedfor freshwater systems [15, 17, 23, 73, Jacquet et al.submitted] and correlated poorly from one date to an-other. The mean clearance rate measured for each taxon(Table 2) was used to assess the potential grazing impactof flagellates and ciliates during our seasonal study.Ingestion rates of each taxon (bacteria grazer)1 h)1) werecalculated by multiplying the corresponding clearancerate by the heterotrophic bacteria concentration. Thegrazing impact (bacteria h)1 L)1) of a taxon was esti-mated by multiplying its ingestion rate by its actualconcentration.
Statistical Analysis. All statistical analyses wereperformed using the Statistica Ed. ‘‘99 software package(Tulsa, OK). Because of the sample size, we used the non-parametric U-test (Mann-Whitney) and the Kruskal-Wallis test to analyze the differences in the abundance ofthe phylogenetic groups identified in the study and theabundance and biomass of bacteria and protists, relativeto time and space, respectively. Spearman rank correla-
tions were done in order to highlight the relationshipsbetween microbial components.
Results
Physicochemical Variables. The temperature fluctu-ated between 5.8�C and 23.5�C throughout the studyperiod, and thermal stratification appeared from themiddle of May, with a thermocline around 10 m depth.The lowest value for water transparency was observed onApril 2, whereas the clear water phase appeared at thebeginning of May with a maximum transparency value of12 m and continued until the end of May. A first peak ofchlorophyll a concentration was recorded on April 2(13.66 lg L)1). A subsequent decrease was recorded untilthe end of May, and a gradual increase followed duringearly summer, with a maximum observed on June 19(21.61 lg L)1); (Fig. 1).
Table 2. Mean clearance rates (SD) of the main protist taxa,based on fluorescent microbead ingestion (n = 6, from March toAugust in 0–10 m layers of lake Bourget)
Mean clearance rate (SD)nL grazer)1 h)1
Non pigmented FlagellatesSpumella 2.2 (0.6)Katablepharis 5.0 (2.7)Undetermined
Cryptomonads3.5 (1.9)
Uniflagellated 1.6 (0.3)Pigmented Flagellates
Dinobryon 2.4 (0.4)Cryptomonas sp1 1.7 (0.98)Cryptomonas sp2 7.5 (3.5)
CiliatesStrobilidium sp1 37.7 (11.2)Strobilidium sp2 13.9 (5.4)Strobilidium sp3 61.3 (6.1)Strobilidium
delicatessum1.8
Oligotrichida Lohmanniella 1.5 (1.1)Strombidium sp1 9.1Strombidium sp2 11.2Halteria sp1 2.0 (1.4)Halteria sp2 18.1 (6.5)
Haptorida Dinophrya psp 32.5Mesodinium psp 8.1
Prostomatida Holophrya psp1 26.5 (5.2)Holophrya psp2 12.3 (2.6)Urotricha sp1 21.5 (8.6)Urotricha sp2 3.7Urotricha psp 7.0 (2.7)Coleps sp1 2.7Coleps sp2 3.9 (2.5)
Peritrichida Vorticella 18Hymenostomatida Glaucoma 2
Tetrahymena 8Scuticociliatida Uronema 15 (5.6)
Cyclidium 5.3 (4.1)Colpoda Colpoda 19
COMTE ET AL.: MICROBIAL COMMUNITY STRUCTURE AND DYNAMICS IN THE LAKE BOURGET 75

Ammonium concentrations fluctuated between 0.001and 0.037 mg L)1, whereas those of nitrate and totalnitrogen (Nt) reached values of 0.70 and 0.88 mg L)1,respectively. Maximum concentrations of PO4
3) and Ptot
were 0.026 mg L)1 on April 2 and 0.049 mg L)1 on April11, respectively. Nutrient concentrations revealed distinctvertical gradients from early stratification to the end ofthe study. Typically, concentrations of NO3
), Nt, PO43),
and Ptot declined in the epilimnion from the beginning ofMay. In contrast, NH4
+ concentrations were higher in theupper layer from May to June (data not shown).
Although a slight increase in dissolved organic car-bon (DOC) concentration was observed from March toJuly at 10, 30, and 50 m depths, these deep layers dis-played relatively constant concentrations (mean: 2.78,2.65, and 2.60 mg L)1at 10, 30, and 50 m, respectively),compared to those in the upper layers, where DOCreached peak values of 4.96 and 4.42 mg L)1 (at 2 m and6 m, respectively) on March 22 (data not shown).
Autotrophic Picoplankton. Picophytoplanktoniccells were massively dominated by phycoerythrin-con-taining picocyanobacteria. Maximum abundances forpicocyanobacteria were recorded in the three upper layers(2 m, 6 m, and 10 m) on July 3, and concentrationsranged from 4.5 · 102 cells mL)1—i.e., 0.1 lgC L)1—onMarch 22 at 50 m, to 6.9 105 cells mL)1, i.e., 101.8 lgCL)1—on July 3 at 10 m (Fig. 2A). Picocyanobacteria weremainly solitary cells; microcolonies were rarely observedduring the study. Synechoccocus-like cells (mean diame-ter: 1.05 lm, mean biovolume: 0.39 lm3), which largelydominated the picocyanobacterial community, ac-counted for 85.23% of the total picocyanobacteria duringthe study. Like the observations reported by Crosbie et al.[19] in Lake Mondsee, we found no clear spring peak insolitary picocyanobacteria. The weak stratification inMarch-April could explain the absence of the spring peakthat is observed in others mesotrophic lakes [19].
Abundance and Biomass of Heterotrophic Bacte-
ria. The abundance and biomass of heterotrophicbacteria fluctuated between 5.95 · 105 bacteria mL)1, i.e.,15.1 lgC L)1 (March 22), and 9.98 · 106 bacteria mL)1, i.e.,161 lgC L)1 (May 6); (Fig. 2B). The values recorded forthese parameters increased in the epilimnion at the end ofthe spring bloom and remained high until the end of thestudy. In contrast, the values at 30 m and 50 m depth werefairly stable. Heterotrophic bacteria consisted mainly ofsmall cocci (mean biovolume: 0.08 lm3), but filaments (>2lm length) were regularly observed. Maximum filamentconcentrations were recorded on June 19 at both depths,and could reach 3.6 · 104 bacteria mL)1 (2 m). In theeuphotic layer, two filament abundance peaks were re-corded on April 25 and June 19. Although the filamentabundance values were similar, the size structure within thefilaments was different on these two dates. The analysis ofthe bacterial size structure revealed that on April 25, thedominant size class was the 5–10 lm class, which ac-counted for 45% of all filaments, and the maximum lengthof the filaments was about 30 lm. In contrast, on June 19,larger filaments were observed (up to 70 lm), with the ‘‘>30 lm’’ size class accounting for 7% of the total filaments,whereas the dominant group (44% of filaments) belongedto the smallest size class of filaments (2–5 lm).
FDC. The frequency of dividing cells (FDC)fluctuated between 1.2% and 9.1% and was highest in the
Figure 1. Seasonal changes in chlorophyll a (Chla) concentrationsfrom March to July 2002.
Figure 2. Seasonal changes in picocyanobacteria (A) and hetero-trophic bacteria (B) abundances from March to July 2002.
76 COMTE ET AL.: MICROBIAL COMMUNITY STRUCTURE AND DYNAMICS IN THE LAKE BOURGET

epilimnion and lowest at 30 m and 50 m depths. Thehighest values for FDC occurred on 22 March, at thebeginning of the spring phytoplankton peak (5.5%, 7.5%,and 9.1% at 2 m, 6 m, and 10 m, respectively); anotherseries of high values was recorded later, on 12 April. Forall depths, minimal values for FDC were observed duringthe clear water phase (6 May to 23 May). Based on therelation we established between NDC and [3H]thymidinewe could estimate bacterial production varying between3.2 · 106 and 2.5 · 108 bacteria L)1Æh)1.
FISH. The efficiency of detection with the eu-bacterial probe EUB338 relative to DAPI, ranged from9.2% (March 11, 50 m) to 62.8% (March 22, 50 m),(mean: 23.5%, all depths), whereas the archibacterialprobe ARC915 identified between 0.04% and 8.9% ofDAPI-stained cells (mean: 3.57%, all depths). Althoughconcentrations of archaebacteria were similar at bothdepths, their mean relative abundance was higher at 50 mthan at 2 m depth (mean: 18.5% and 10.4% of totalidentified cells (EUB+ARC), respectively at 50 m and 2m,representing 4.7% and 2.4% of DAPI stained cells). In thehypolimnion, local archaebacteria concentrations couldbe higher than those of Cytophaga-Flavobacterium andBeta-proteobacteria (two of the main bacterial groupsobserved during the study), and could represent up to49.3% of total detected cells (EUB+ARC) at 50 m (11April), whereas the maximum relative abundance at 2 mdepth was only 17.5% of total detected cells (March 22).
The fraction of bacteria detected by EUB338 was ra-ther low (from 9.2% to 62.8% of DAPI-stained cells), butthere was no covariation of the fraction of bacteria de-
tected by EUB338 with bacterial abundance, chlorophyllconcentrations, Dissolved Organic Carbon (DOC), ortemperature. Maxima and minima of Eubacteria countswere often concomitant with those of DAPI cell counts.The linear regression analysis between the DAPI cellcounts and EUB cell counts during this study yielded an r2
of 0.68 (n = 18, P < 0.02).Eubacterial concentrations were significantly higher in
the surface layers (P = 0.001) (Fig. 3A). Similarly,the mean abundances recorded for the differentbacterial groups (Alpha-, Beta-, Gamma-proteobacteria,Cytophaga-Flavobacterium) were always higher in theepilimnetic layers than in the hypolimnion (Fig. 3A).These bacterial groups represented from 14.5% to 77.8% ofcells detected with EUB338. Alpha-proteobacteria were theminority group at both depths, with a maximum con-centration recorded on July 3 at 2 m and 50 m (4.3 · 104
and 1.2 · 104 bacteria mL)1, respectively). However, thesehighest values accounted for only 5.2% (2 m) and 4.1% (50m) of Eubacteria (Fig. 3A). At 50 m Beta-proteobacteriaabundances remained rather low and stable throughoutthe study, whereas at 2 m depth, maximum values wererecorded on April 11 and July 3. Then, Beta-proteobacteriaaccounted for 16.1% (April 11) and 15.4% (July 3) of theEUB. Beta filaments were regularly observed, and couldaccount for up to 30% of total Beta-proteobacteria (April25: 2 m). In the epilimnion, Beta filaments accounted for 0to 25% (mean: 7.65%) of DAPI-stained filaments, whereasin the deeper layer, these percentages ranged from 0 to100% (mean: 25.5%); (Fig. 3B). Gamma-proteobacteriarepresented the second most abundant group, and ac-counted on average for 6.4% and 11.9% of Eubacteria,
Figure 3. Seasonal changes in the abundance of the different phylogenetic bacterial groups at 2 m and 50 m depths from March to July2002. (A, B): Alpha-proteobacteria (Alpha), Beta-proteobacteria (Beta), Gamma-proteobacteria (Gamma), and Cytophaga flavobacterium(CF); (C, D): small and filamentous cells.
COMTE ET AL.: MICROBIAL COMMUNITY STRUCTURE AND DYNAMICS IN THE LAKE BOURGET 77

respectively, at 2m and 50 m. Bacterial filamentous formswere rarely detected with Gamma-preoteobacteria probes.
At both depths, CF constituted the main bacterialgroup, with maximum values of 3.6 · 105 bacteria mL)1
on April 11 at 2 m and 6.4 · 104 bacteria mL)1 on March22 at 50 m (Fig. 3A). When maximum abundances werereached, CF represented 51.4% (2 m, April 11) and 43.3%(50 m, April 11) of the EUB338-detected cells. Filamentscould account for up to 17.4% of CF cells (maximum onJune 19 at 2 m). Peaks of abundance for CF filaments wereobserved on April 25 and June 19 in the epilimnion, whileat 50 m, filament concentrations remained low except onJune 19 (Fig. 3B). Cytophaga-Flavobacterium filamentsaccounted for between 0 and 87.8% of the DAPI-stainedfilaments at 2 m depth (mean: 61.11%), whereas in thehypolimnion, the low proportion of filaments within thisgroup (mean: 23.9%) suggested that most of the DAPI-stained filaments were not identified by FISH.
We observed seasonal variations in the relative con-tributions of the four bacterial groups (Alpha, Beta,Gamma, CF), especially at 2 m depth (Fig. 3A). Duringthe mixing period, the structure within the four groupswas quite similar at 2 m and 50 m, and was generallycharacterized by the marked dominance of the CF group,and the relatively low abundances of Alpha- and Beta-proteobacteria. From March to the end of May only oneexception was noted, when, on April 11, the fraction ofBeta-proteobacteria increased markedly at both depths.Then, when thermal stratification occurred, and moreespecially in June and July, at 2 m, the proportion of CFgradually decreased, while the Alpha- and Beta-groupsincreased to reach their maximum relative abundance onJuly 3 (16.8% and 49.5% of EUB338-detected cells,respectively). At 50 m depth, the fraction of the Beta-group also increased on 23 May (clear water phase) and19 June, but it was replaced by Alpha-proteobacteria bythe end of the study (Fig. 3A). We noted, at 2 m depth,that the abundances and fractions of Alpha- and Beta-proteobacteria covaried with the abundance of hetero-trophic flagellates (r = 0.81 and r = 0.83, respectively).
Taxonomic Composition, Abundance, and Biomass of
Flagellates. In most cases, flagellates could be identi-fied to the genus level. A total of 13 taxa were identified.Within heterotrophic flagellates, major taxa such as Ki-netoplastids, Chrysomonads (Heterokonts), and Crypto-monads Kathablepharis sp. could be identified under themicroscope. Some other flagellates, particularly the col-orless Cryptomonads (5–10 lm long) and small unifla-gellate cells (2–6 lm long Oikomonas-type cells), whichcould not be identified unequivocally, were referred to as:‘‘unidentified heterotrophic Cryptomonads’’ (UHC) and‘‘unidentified heterotrophic uniflagellates’’ (UHU). Thecryptomonads Cryptomonas and Rhodomonas andthe Chrysophytes Dinobryon and Chrysidalis dominated
the pigmented flagellate community. More occasionallyoften, we observed the Chrysophytes Ochromonas andMallomonas and the Euchlorophytes Chlamydomonas. Ofthese, Dinobryon, Ochromonas, and Cryptomonas were themain species known to develop phagotrophic activity [18,66, 68]. Flagellate abundance and biomass fluctuated from1.9 · 102 cells mL)1, i.e., 2.4 lgC L)1 (April 25, 50 mdepth) to 6.6 · 103 cells mL)1, i.e., 8.3 · 101 lgC L)1
(April 25 , 2 m depth). In the upper layers, peak abun-dances were observed during April (max: 6.6 · 103 cellsmL)1) and June (max: 5.6 · 103 cells mL)1), while in thebottom layers, no clear variation was observed. In theeuphotic zone, at all sampling dates, pigmented flagellatesoutnumbered the HNF. Heterotrophic flagellate abun-dance ranged from 7.3 · 101 to 3.2 · 103 cells mL)1. Twoabundance peaks were recorded. The first peak occurredin mid-April throughout the depth of the water column,with a maximum value of 2.3 · 103 cells mL)1 (April 11, 2m) and the second, on July 3, was essentially located in theupper layers (max: 3.24 · 103 cells mL)1, 6 m) (Fig. 4A).The heterotrophic flagellate size structure displayed somemajor seasonal variations. The ‘‘>5 lm’’ size fraction ofHNF was composed of Cryptomonads (Katablepharis)and some Kinetoplastids (Bodo). The small size fraction(from 2 to 5 lm), composed of Spumella and severalundetermined flagellates represented a large part of thetotal flagellate community in the bottom layers (45% and
Figure 4. Seasonal changes in of heterotrophic (A) and pigmentedflagellate (B) abundances from March to July 2002.
78 COMTE ET AL.: MICROBIAL COMMUNITY STRUCTURE AND DYNAMICS IN THE LAKE BOURGET
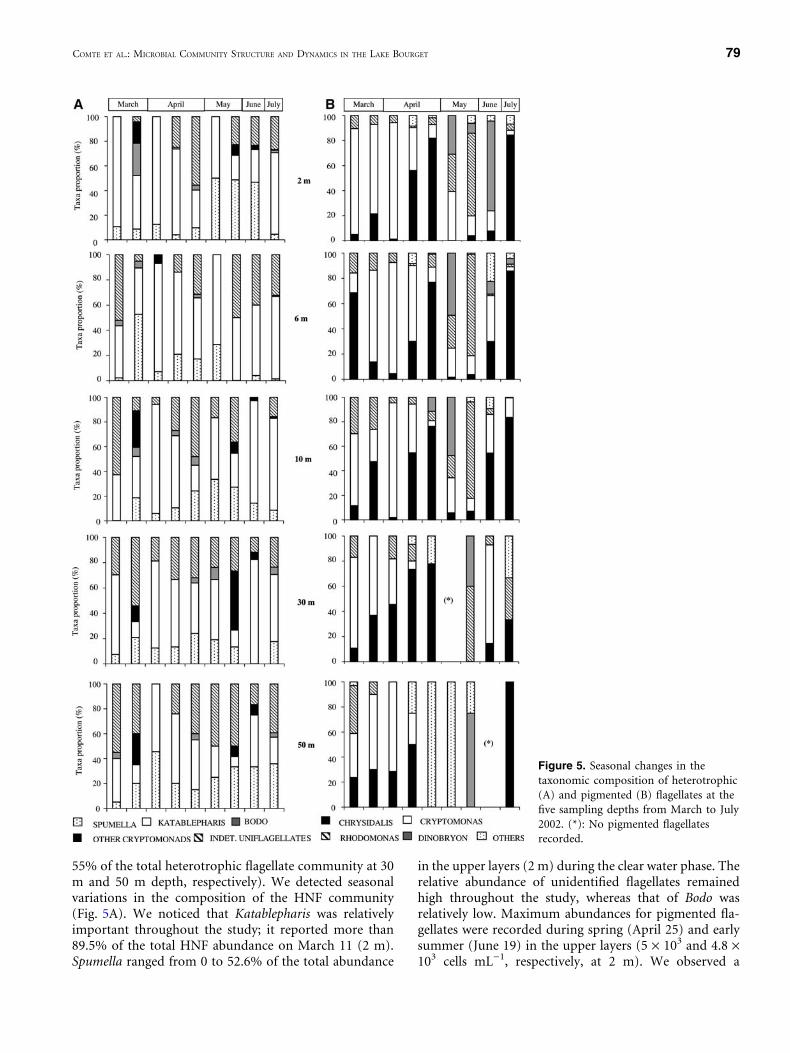
55% of the total heterotrophic flagellate community at 30m and 50 m depth, respectively). We detected seasonalvariations in the composition of the HNF community(Fig. 5A). We noticed that Katablepharis was relativelyimportant throughout the study; it reported more than89.5% of the total HNF abundance on March 11 (2 m).Spumella ranged from 0 to 52.6% of the total abundance
in the upper layers (2 m) during the clear water phase. Therelative abundance of unidentified flagellates remainedhigh throughout the study, whereas that of Bodo wasrelatively low. Maximum abundances for pigmented fla-gellates were recorded during spring (April 25) and earlysummer (June 19) in the upper layers (5 · 103 and 4.8 ·103 cells mL)1, respectively, at 2 m). We observed a
Figure 5. Seasonal changes in thetaxonomic composition of heterotrophic(A) and pigmented (B) flagellates at thefive sampling depths from March to July2002. (*): No pigmented flagellatesrecorded.
COMTE ET AL.: MICROBIAL COMMUNITY STRUCTURE AND DYNAMICS IN THE LAKE BOURGET 79
concentration gradient of pigmented flagellates as a resultof their photosynthetic activity (Fig. 4B). Most of thepigmented flagellates ranged in size from 8 to 20 lm. AllChrysidalis spp. identified were <5 lm in size, and thesesmall flagellates could occasionally dominate the pig-mented flagellates (85.7% and 100%, respectively at 6 mand 50 m on July 3). We noticed a wide seasonal evolutionof the composition of the pigmented flagellates (Fig. 5B).The mixotrophic species Dinobryon was sporadically re-corded from May to June, and could account for up to71% and 75% of the pigmented community (on June 19at 2 m and on May 23 at 50 m, respectively), whereas theCryptomonads Cryptomonas and Rhodomonas were reg-ularly observed and displayed major variations in theirrelative abundance throughout the study (Fig. 5B). Therewas no correlation between heterotrophic flagellates andtotal bacterial abundance. Only Dinobryon and Bodo werecorrelated with bacterial abundance (P = 0.01 at 6 m andP = 0.03 at 30 m depth, respectively). The bacterivorousactivity of these taxa has been reported in different lakesthat vary from their trophic status [17, 23, 30, 68].
Statistical analyses indicated that positive correla-tions existed between specific bacterial groups and het-erotrophic flagellate abundances at 2 m depth. Alpha-and Beta-proteobacteria abundances were positivelylinked with heterotrophic flagellate abundance (P = 0.01and P = 0.04, respectively). Filament formation withinthe Beta and CF groups was also closely correlated withheterotrophic flagellates (P = 0.04) and the total flagel-late abundances (P = 0.009), suggesting grazing resis-tance toward bacterivores (see Discussion).
Taxonomic Composition, Abundance, and Biomass of
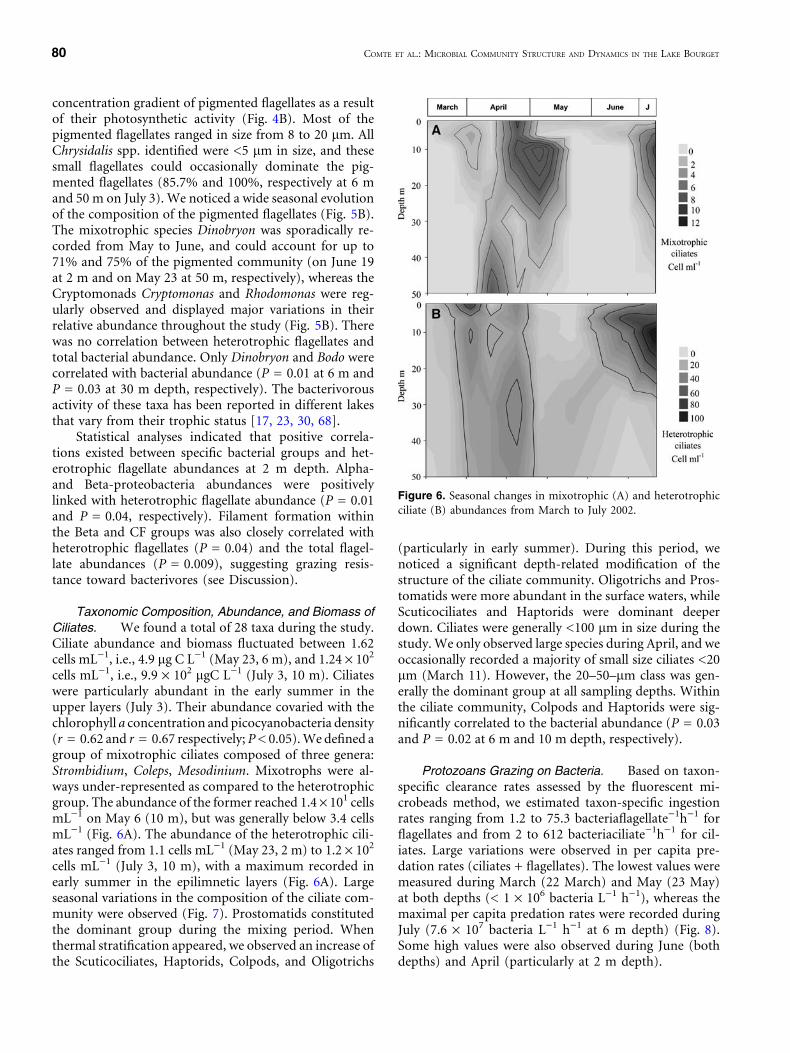
Ciliates. We found a total of 28 taxa during the study.Ciliate abundance and biomass fluctuated between 1.62cells mL)1, i.e., 4.9 lg C L)1 (May 23, 6 m), and 1.24 · 102
cells mL)1, i.e., 9.9 · 102 lgC L)1 (July 3, 10 m). Ciliateswere particularly abundant in the early summer in theupper layers (July 3). Their abundance covaried with thechlorophyll a concentration and picocyanobacteria density(r = 0.62 and r = 0.67 respectively; P < 0.05). We defined agroup of mixotrophic ciliates composed of three genera:Strombidium, Coleps, Mesodinium. Mixotrophs were al-ways under-represented as compared to the heterotrophicgroup. The abundance of the former reached 1.4 · 101 cellsmL)1 on May 6 (10 m), but was generally below 3.4 cellsmL)1 (Fig. 6A). The abundance of the heterotrophic cili-ates ranged from 1.1 cells mL)1 (May 23, 2 m) to 1.2 · 102
cells mL)1 (July 3, 10 m), with a maximum recorded inearly summer in the epilimnetic layers (Fig. 6A). Largeseasonal variations in the composition of the ciliate com-munity were observed (Fig. 7). Prostomatids constitutedthe dominant group during the mixing period. Whenthermal stratification appeared, we observed an increase ofthe Scuticociliates, Haptorids, Colpods, and Oligotrichs
(particularly in early summer). During this period, wenoticed a significant depth-related modification of thestructure of the ciliate community. Oligotrichs and Pros-tomatids were more abundant in the surface waters, whileScuticociliates and Haptorids were dominant deeperdown. Ciliates were generally <100 lm in size during thestudy. We only observed large species during April, and weoccasionally recorded a majority of small size ciliates <20lm (March 11). However, the 20–50–lm class was gen-erally the dominant group at all sampling depths. Withinthe ciliate community, Colpods and Haptorids were sig-nificantly correlated to the bacterial abundance (P = 0.03and P = 0.02 at 6 m and 10 m depth, respectively).
Protozoans Grazing on Bacteria. Based on taxon-specific clearance rates assessed by the fluorescent mi-crobeads method, we estimated taxon-specific ingestionrates ranging from 1.2 to 75.3 bacteriaflagellate)1h)1 forflagellates and from 2 to 612 bacteriaciliate)1h)1 for cil-iates. Large variations were observed in per capita pre-dation rates (ciliates + flagellates). The lowest values weremeasured during March (22 March) and May (23 May)at both depths (< 1 · 106 bacteria L)1 h)1), whereas themaximal per capita predation rates were recorded duringJuly (7.6 · 107 bacteria L)1 h)1 at 6 m depth) (Fig. 8).Some high values were also observed during June (bothdepths) and April (particularly at 2 m depth).
Figure 6. Seasonal changes in mixotrophic (A) and heterotrophicciliate (B) abundances from March to July 2002.
80 COMTE ET AL.: MICROBIAL COMMUNITY STRUCTURE AND DYNAMICS IN THE LAKE BOURGET

Flagellates predation rates (mixotrohs+heterotrophs)fluctuated between 0.7 · 106 bacteria L)1 h)1and 7.0 ·107 bacteria L)1 h)1. The highest grazing rates were re-corded on April, June and July (maximum on 3 July at 6m depth) (Fig. 8). Katablepharis and small uniflagellates(UHU) generally represented the main bacterial grazerswithin heterotrophic flagellates, while Spumella had amore sporadic impact. On account of the relatively highingestion rates of Dinobryon and some Cryptomonas, thegrazing impact of mixotrophs could exceed over that ofheterotrophs, for example on 2 April (2 m, 6 m, and 10m) or during the clear water phase (on 6 May, especiallyat 2 m depth).
Grazing impact of ciliates was lower than that assessedfor flagellates (Fig. 8). The maximal ciliate predation ratewas recorded on 3 July at 10 m depth and reached 1.5 · 107
bacteria L)1 h)1. High predation rates were also measuredat 6 m depth on 19 June and 3 July. According to fluo-
Figure 7. Seasonal changes in the taxonomic composition of cil-iates at the five sampling depths from March to July 2002. (*):missing data.
Figure 8. Assessment of protozoan grazing rates (bacteria mL)1
h)1) at 2 m, 6 m, and 10 m depth.
COMTE ET AL.: MICROBIAL COMMUNITY STRUCTURE AND DYNAMICS IN THE LAKE BOURGET 81

rescent microbeads technique, the highest predation ratesat 6 m and 10 m depths were due primarily to grazingpressure of Scuticociliates (mainly Uronema), Oligotrichs(mainly Strobilidium, Lohmaniella, and Halteria), someProstomatids (Urotricha), and Colpods (Colpoda). At 2 mdepth the predation impact of ciliates was generally lowerthan that measured at 6 m and 10 m depth, except on 2April when Prostomatids (Urotricha) and Oligotrichs(Strobilidium) were responsible for per-capita grazing ratesof 5.5 · 106 bacteria L)1 h)1.
Discussion
Limitations of the FISH Technique. One of the limi-tations of the FISH method is that the efficiency of thedetection of target cells varies widely. Bouvier and delGiorgio [10] reported that the percentage of cells de-tected using the common EUB338 probe (% EUB) variesfrom 29% to 79% in lakes and ponds. This calculationmatches the range in the proportion of cells hybridizedusing any Eubacterial probe for lakes, which ranges typ-ically from 30% to 80% (reviewed in Glockner et al. [26]and Pernthaler et al. [56]). On average, during the courseof the present study, 23.6 (2 m) and 27.2% (50 m) ofDAPI-stained cells were identified as bacteria, with arange from 12.5% to 69.1%. Zwisler et al. [83] recentlyreported similar low percentages of detection during astudy on spatio-temporal dynamics of bacterioplanktonin Lake Constance. The detection of cells by means ofspecific rRNA oligonucleotide probes may depend on (1)the number of ribosome per cell, (2) the accessibility ofthe target and the penetration of the probe into the cell,and (3) the signal intensity. Many studies have high-lighted these problems [10, 20, 51] and this topic will notbe further developed here.
Many improvements have recently been obtained: thefixation (4% paraformaldehyde) and the use of enzymatictreatment (lysosyme), for example, were proposed to in-crease the permeability of Gram-positive bacteria [9]. Theapplication of polyribonucleotide and helper probes sig-nificantly improved the probe signal [22, 27]. During thepresent study attempts were made to improve the detec-tion of cells by increasing cell permeability (use of lyso-syme), but that procedure failed (data not shown). Weused CY3, one of the most intense fluorochromes, but wedid not apply helper probes; therefore, it is not surprisingthat detection rate by EUB probe was low [83]. Moreover,in our study, the low detection efficiency may be related tothe small amount of ribosome linked to a low bacterialactivity, as suggested by Kemp et al. [42]. Indeed, a pre-vious study conducted between 1998 and 2002 on LakeBourget showed that the percentage of active bacteria (asrevealed by CTC methods) was always significantly lowerthan the percentages found in other subalpine lakes (Vi-boud, unpublished). Although fractions of FISH-detected
bacteria were rater low during this study, the modificationin bacterial group proportions were useful to highlightchanges in bacterial structure. Groups such as Actino-bacteria, which may be an important bacterioplanktongroup in freshwater ecosystems [27], were not counted inthis study.
Composition and Structure of Microbial Communi-
ties. The concentrations and seasonal dynamics ofheterotrophic bacteria in Lake Bourget were similar tothose reported for mesotrophic Lake Constance [83] andLake (Leman) Geneva (Jacquet, unpublished). The iden-tification of the phylogenetic groups, as revealed by FISH,showed clearly differing periods in the structure of thebacterial community. Several studies have reported thatthe Beta-proteobacteria constitute a dominant fraction infreshwater systems [26, 83]. According to Glockner et al.[26], this subclass may account for 16% (range 3–32%) oftotal DAPI counts in lakes, whereas the CF phylum onlyappears to account for 0 to 18% (mean: 7%). In contrast, inLake Bourget, we observed a considerable dominance ofthe CF group, and, Beta-proteobacteria or Gamma-pro-teobacteria constituted the second most abundant bacte-rial group. The CF cluster also constituted the largestfraction of filamentous morphotypes, as previously ob-served by other authors [56, 70]. These elongated cells aregenerally considered to be resistant to nanoplanktonicgrazers [29, 37, 59, 71]. Interestingly, the highest concen-trations of these filaments were indeed recorded duringspring and in early summer, when flagellates were the maingrazers. It is noteworthy that FISH revealed that grazing-resistant morphotypes can be found in the major phylo-genetic groups, as previously reported [37, 70]. The pro-portions of the different bacterial groups usually revealrelatively low seasonal and spatial variations [56, 83]. Incontrast, we observed clear modifications in the structureof the bacterial communities, especially in the upper layers.From March to May, CF dominated considerably; incontrast, during early summer (July 3), the abundance ofCF dropped, whereas that of Beta-proteobacteria in-creased. This modification in the bacterial structure couldbe linked either to a modification in nutrient quality or toselected predation pressure on the CF cluster. Indeed, it iswell known that the seasonal changes in organic matterquality constitute a strong structuring factor for microbialcommunities [54, 55]. Similar to the study by Zwisler et al.[83], we observed the highest abundance of CF during thespring phytoplankton bloom, when polymeric substratesand labile organic substrates were dominant (data notshown). Cytophaga-Flaobacterium are known to degradepolymeric substrates of a labile and rather recalcitrantnature [18, 43]. Concerning the possible impact of pre-dation, we hypothesized that, although filament formationshould allow CF cells to escape flagellate grazing, thisstrategy was less efficient in early summer, when ciliates
82 COMTE ET AL.: MICROBIAL COMMUNITY STRUCTURE AND DYNAMICS IN THE LAKE BOURGET

predation pressure increased. During that period, the cil-iates were mainly represented by Halteria and Strobilidium,which are known to be important bacterial consumers inmesotrophic to eutrophic freshwater systems, with a stronggrazing impact on a wide prey spectrum [39, 44, 69]. Ourgrazing assessment using the microbead technique allowedus to confirm the significant role of Oligotrichs in ciliatepredation pressure on bacteria. Moreover, the CF cells,which are characterized by having a higher mean biovo-lume than other groups, are probably more susceptible tociliate predation [39]. In laboratory experiments of en-hanced protozoan grazing, several authors have previouslydemonstrated that CF are preferentially grazed by bacte-rivores [37, 43, 56]. Studies in freshwater and marine sys-tems demonstrated that Alpha-proteobacteria show higherresistance to grazing pressure exerted by flagellates com-pared to other eubacterial subgroups [37, 45]. In contrast,Jardillier et al. [33] showed that, in the epilimnion of thereservoir Sep, Alpha-proteobacteria were subjected to thehighest grazing rates when compared to Beta-proetobac-teria and CF. The apparent contradictions in the literatureas regards the selectivity of bacterivores on eubacterialsubgroups (Alpha-, Beta-, Gamma-proteobacteria; Cy-tophaga Flavobacterium) are probably due to the differ-ences existing in the bacterivores� community compositionin the various studies. Our results showed that in the epi-limnion (1) the decrease in CF abundance was concomi-tant with highest protozoan grazing rates and (2) theabundances and fractions of Alpha- and Beta-proteobac-teria covaried with heterotrophic flagellates abundance,suggesting that these groups were not highly susceptible tohigh predation rates of flagellates. This kind of link(grazers–bacterial groups) appeared clearly only in theepilimnion.
Both the relatively high richness of ciliate taxa (28genera) and their concentrations were similar to thosereported during previous studies performed in othermesotrophic lakes [51]. The values recorded in LakeBourget for HNF abundance and biomass were also in theusual range observed in mesotrophic or eutrophic lakes[5]. In fact, our results revealed that the values for LakeBourget were closer to those measured in slightly eutrophiclakes. In mesotrophic systems, HNF biomass is usually verylow in spring and reaches its maximum in early summer,while in slightly eutrophic lakes, the HNF population peaksin spring and declines sharply in early summer [5]. In ourstudy, the marked dominance of Cryptomonad formswithin the heterotrophic flagellate community was ratherunusual, and contrasted with the results of several authors,who all reported Chrysomonads as being the main group[64, 73]. In Lake Bourget, Cryptomonads dominated thepigmented flagellates, and these include some taxa classi-fied as mixotrophs, such as Cryptomonas. Potentiallymixotrophic flagellates were largely present during oursurvey. Dinobryon, which is known to exhibit bacterivore
behaviour, was abundant during the clear water phase andon June 19, while Cryptomonas (which dominated theflagellate community during spring) constituted a poten-tially important bacterial grazer. Our estimation based onfluorescent microbeads allowed us to support thesehypotheses; however, as discussed below, the importanceof mixotrophic species as bacterial grazers was lower thanthat previously observed in the epilimnion of the oligo-trophic Lake Annecy [23].
Regulation of Bacteria. The distribution of theheterotrophic bacteria and protist abundance, as well asour estimation of protozoan grazing rates, indicated thatthe availability of resources and the increase in temper-ature seemed to be the main structuring factors for het-erotrophic bacteria compared to protist predation. Peakconcentrations of heterotrophic bacteria were recorded inthe epilimnion during the spring (April) and earlysummer phytoplankton bloom (July). Increases in protistabundance induced no drop in bacterial abundance,suggesting that predation was not of major importance inthe regulation of bacterial abundance at that time. Theassessment of the protozoan grazing impact allowed us toconfirm this hypothesis, showing that the highest percapita grazing rates recorded in April, June, and Julyinduced no reduction in total bacterial abundance andthat potential protozoan grazing represented from 1% to48% of bacterial production, which revealed a moderateimpact when compared to similar measurements from inother lakes [7, 15, 23].
Obviously, the absence of direct measurements ofbacterial production using radiolabeled thymidine orleucine incorporation during this study prevents us fromdrawing firm conclusions about these estimated values,and our results should be considered in that light.However, the moderate and highly variable impact ofprotozoan grazing on bacteria regulation in the epilim-nion of Lake Bourget is not surprising. Three in situexperiments performed in 2003 in order to compareprotozoan and virus-induced mortality of heterotrophicbacteria in this lake showed similar variations in flagel-lates grazing rates and demonstrated that the virus-mediated mortality (measured by the dilution method)could occasionally exceed flagellate grazing (Jacquet et al.,submitted). Viruses are known to be potential importantcontrolling agents in planktonic community composi-tion, diversity, and succession, playing a key role in cellmortality and nutrient cycles [7, 12, 60, 78], however,these points will be not further developed here.
Protozoan grazing did not appear as the mainregulator of bacterial abundance in this study, but graz-ing-induced modifications were observed in both thestructure of the phylogenetic bacterial groups, as previ-ously discussed, and in the bacterial size structure. Weassumed that the increase in the proportion of filamen-
COMTE ET AL.: MICROBIAL COMMUNITY STRUCTURE AND DYNAMICS IN THE LAKE BOURGET 83

tous forms within the heterotrophic bacteria was one ofthe consequences of the highest bacterivore pressures byflagellates. Mixotrophic and heterotrophic flagellatesalternately represented the main bacterivores during thisstudy, ciliates played a significant role as bacterivoresonly in July. The maximum biomass of filaments couldamount to 16.6% of the total bacterial biomass (19 June).This percentage was smaller than that reported in otherfield studies in mesotrophic to eutrophic lakes, in whichthe elongated cell biomass proportion fluctuated between20% and 50% [36, 55, 67]. The mechanism that controlsa grazing-mediated switch from single-celled bacterialcommunities to filamentous-dominated bacterial com-munities is still under discussion [41, 68]. Although theupper grazing size limit is still not well defined, fila-mentous bacteria are considered by numerous authors tobe protected against nanoflagellate predation [28, 29, 37,41, 68, 71]. However, according to Wu et al. [81], sizealone is not sufficient to define a refuge for filamentousbacteria from nanoflagellates predation. They demon-strated that direct-interception-feeding nanoflagellates(Ochromonas sp.) successfully consumed different testedfilamentous strains (among which were four Beta-pro-teobacteria) [81]. According to those authors, theinvestigated filamentous bacteria are not protected fromnanoflagellate predation but have a selective advantagedue to the decrease in the flagellates� ingestion efficiencywith increasing length of bacteria.
Regulation of Protists. Heterotrophic nanoflagel-lates are usually considered to be the main bacterivores[13, 40, 55], but some studies have highlighted the lack ofcoupling between heterotrophic bacteria and HNF [25,80]. We did not find any significant correlation betweenthese two compartments. Wieltschnig et al. [80] suggestedthat this weak or absent coupling could be explained, onthe one hand, by the relatively low impact of HNF grazingon bacterial abundance and, on the other hand, by the factthat HNF abundance is regulated to a greater extent bypredator abundance (top-down) than prey abundance(bottom-up). Our results on the relative grazing impact ofheterotrophic, mixotrophic flagellates and ciliates actuallyshowed that HNF were not always the main bacteri-vores—for example during the clear water phase. To as-sess the top-down control of HNF, Gasol [24] proposed amodel that estimates the importance of predation in theregulation of HNF communities in a given system. Hedefined the relationship between the abundance of bac-teria and HNF as the ‘‘Maximal Attainable Abundance’’(MAA) line. This line corresponds to the highest attain-able HNF abundance when bacteria constitute the onlyavailable prey. Empirical data suggest that this maximumattainable HNF abundance is rarely reached, and this iswhy Gasol computed a second line, known as the ‘‘MeanRealized Abundance’’ (MRA), based on large series of data
from marine and freshwater ecosystems. The simulta-neous observations of bacterial and HNF abundance canbe plotted in a bivariate space, which includes the MRAand MAA lines. Points near the MAA line would indicatea bottom-up control of HNF abundance, whereas pointssituated below the MRA line would indicate a top-downform of control. We applied this model to our data(Fig. 9), and found a stronger top-down control of HNFabundance. In addition, this impact was more strongly
Figure 9. Simultaneous observations of bacterial and HNF abun-dances (Log) from March to July 2002 in Lake Bourget plotted onthe framework devised by Gasol (1994). MAA: ‘‘maximum attain-able abundance’’ line; MRA: ‘‘mean realized abundance.’’
84 COMTE ET AL.: MICROBIAL COMMUNITY STRUCTURE AND DYNAMICS IN THE LAKE BOURGET
marked during the clear water phase (6 and 23 May) thanat other sampling dates. The high predation impact dur-ing May was clearly linked to the presence of large cla-docerans (especially Daphnia), particularly at the 2 m, 6m, and 10 m depths. The top-down control was unclear inthe deeper layers (data not shown), where concentrationof zooplankton was low (Avois-Jacquet, unpublished).During early spring, the dates for which HNF seemed tobe strongly regulated by the availability of their prey were12 April and 25 April; the points corresponding to thisperiod were near to the MAA line, indicating bottom-upcontrol at 2 m, 6 m, and 10 m. A similar level of controlappeared on 3 July, but only at 2 m, and 6 m depth; weassume that, at 10 m depth, ciliates may significantlyparticipate to predation pressure on small flagellates,leading to a higher predation control.
Ciliates seemed to be mostly dependent on resourceavailability (i.e., prey abundance) throughout the periodof interest, except in May, when the metazooplanktonwere responsible for a large proportion of the microbialmortality. The high ciliate abundance was associated withthe development of a deep chlorophyll maximum (DCM)(6–10 m), which usually occurs in lakes of mediumproductivity such as the mesotrophic Lake Bourget. Asreported by Weisse et al. [77] in Lake Constance during aspring phytoplankton bloom, bacteria and ciliates re-sponded rapidly to increasing phytoplankton biomass,whereas the heterophic flagellate increase was restrainedby grazing feeding impacts of ciliates and metazoo-plankton. The main ciliate species identified during thisstudy were not mixotrophic, but were feeding on algaeand HNF. Hence the higher densities of ciliates in theepilimnion and DCM layers were consistent with thehigher densities of resources in these layers (HNF, algae,and bacteria). Simek et al. [69] reported the importantrole of Halteria, which displayed a high uptake andclearance rate on picoplankton, a large spectrum of preyaccording to their omnivorous nature, a high growthrate, and relatively low vulnerability to zooplanktonicpredation in the reservoirs of rlmov (Czech Republic)and Sau (Spain). Ciliates, and particularly the small Ol-igotrichs, are also known to have high grazing rates onHNF [1, 16]. In Lake Bourget, Halteria was particularlyabundant during early summer, when total ciliateabundance was at its greatest concentration.
A detailed analysis of zooplankton, notably of thecopepods, should provide very useful additional infor-mation to our data, especially for improving our inter-pretation of top-down effects on ciliates and flagellates.Yoshida et al. [82] recently pointed out the contrastingaffects of cladocerans and copepods on microbialplankton in Lake Biwa. They showed that the relation-ships between macrozooplankton and microbial planktoncannot be fully understood without taking into accountboth the feeding characteristics of the macrozooplankton,
and the food web structure, the subsidized algal resource,and nutrient regeneration from the macrozooplankton.
Distinct Periods in Microbial Loop Function-
ing. Our results allow us to distinguish an unambig-uous seasonal succession in the microbial communitystructure and, more especially, a seasonal succession ofthe main bacterivores (Fig. 10). This succession wasparticularly clear in the upper layers (2 m, 6 m, and 10m) whereas in the hypolimnion, seasonal variations werelower and did not allow us to draw a similar scenario.During spring, the relatively high proportion of flagel-lates compared to ciliates, as well as the assessment oftaxon-specific grazing rates, suggests that flagellates play amajor role as bacterial grazers during this period. Al-though HNF are generally recognized as the primaryconsumers of bacterioplankton and picoplankton in bothmarine and freshwater ecosystems, recent studies haveshown the importance of mixotrophs as bacterial con-sumers [23, 30, 65]. In the oligotrophic Lake Annecy, itwas demonstrated that mixotrophic flagellates (especiallyDinobryon and Cryptomonas) could represent an impor-tant link in the flux of material through planktonic foodwebs throughout a rather long period [23]. Unlike inLake Bourget, the potential bacterial activity of mixo-trophs occurs in a more occasional way. Cryptomonas,and Ochromonas, which are known bacterivores [23, 30,34] were particularly abundant during April, whereasDinobryon peaked later (mainly in two sampling dates inMay and June). Heterotrophic flagellates were alsoabundant during April and dominated bacterial grazers atseveral times. During April, both mixotrophic and het-erotrophic flagellates, each in its turn, were responsible ofhigh bacterial grazing rates. Nevertheless, this springtimepredation pressure did not affect bacterial abundance,which increased during this period following the phyto-planktonic bloom. Bacteria were probably primarilybottom-up regulated as previously discussed. The highconcentrations of bacterial filaments (especially in theCytophaga-Flavobacterium cluster) during spring sug-gested strong resistance to grazing by flagellates [29, 59,71]. During the clear water phase, the presence of largezooplankton produced severe predation pressure onbacteria and protists, and their abundance decreased.Several authors have reported similar observations, andhave shown that large filtering feeders, such as cladoc-erans (Daphnia), can modify the bacterial communitystructure through both direct grazing and indirect cas-cade effects due to grazing on protist bacterivores [1, 21,35]. At the beginning of the clear water phase (6 May)only mixotrophic flagellates were still responsible forquite considerable bacterivorous behavior among pro-tists. Finally, during early summer, the lower abundanceof large filters and the occurrence of the second phyto-plankton peak allowed a significant increase in bacterial
COMTE ET AL.: MICROBIAL COMMUNITY STRUCTURE AND DYNAMICS IN THE LAKE BOURGET 85

abundance. This bacterial increase continued, althoughflagellates and ciliates, in turn, reached their maximumabundance. This period was characterized by a rapid shiftin the carbon pathway transfer within the microbial foodweb, with a fast succession of the dominant bacterivores.The mixotrophic flagellate Dinobryon was the mostabundant bacterial grazer on June 19, On July 3, ciliateshad increased massively and consumed bacteria as well asHNF at 10 m depth, while in the upper layers (2 m, and 6m) heterotrophic picoflagellates (undetermined unifla-gellates) and Katablepharis were the main bacterivores.Bacteria, flagellates, and ciliates, which increased con-comitantly, seem to be mainly bottom-up regulated.However, the predation impact on heterotrophic flagel-lates varied according to depth and seemed to be ofgreater importance at 10 m depth. During early summer,we observed a change in the bacterial community struc-ture, characterized by an increase in the Alpha and Betagroups of proteobacteria in the upper layers, whereas theCF group declined. This may suggest a preferential pre-dation of CF by protist grazers, which presented thehighest grazing impact. The quantity and/or quality ofnutrient may also be a determinant in the structure of thephylogenetic bacterial groups, which could highlightmore favorable environmental conditions for Alpha- andBeta-proteobacteria groups than for the CF cluster. It is
probable that combined effects of resources and preda-tion could be considered, determinants of bacterialstructure as recently showed by Jardillier et al. [33]. Last,it is noteworthy that the seasonal succession observed atthe reference station of the Lake (north basin) was thesame as that at another pelagic point (the central point inthe south basin—maximum depth: 112 m), where similardata were collected. Indeed, no significant differences inthe microbial structure or dynamics were recorded at thetwo basins (data not shown).
Conclusions and Research Perspectives
Our study highlights the importance of taking each indi-vidual protist species or at least genus into account, and notconsidering flagellates and ciliates as a uniform group inpelagic ecosystems. The seasonal succession of the mainbacterivores observed in this study, and their impact onbacterial structure and dynamics is probably not only rel-evant for the investigated ecosystem Lake Bourget. More-over these results provide a basis for future experimentalfield studies to test the impact of planktonic predation onthe structure and dynamics of microbial communities andthe way their regulation proceeds. This is of particularinterest in light of how little is known about the biogeo-chemical consequences of bacterial grazing.
Figure 10. Conceptual scenario for the seasonal succession of bacterivores and of the microbial food web structure in upper layers (0–10m) of Lake Bourget between March and July 2002. Cf: cytophaga-Flavobacterium cluster.
86 COMTE ET AL.: MICROBIAL COMMUNITY STRUCTURE AND DYNAMICS IN THE LAKE BOURGET

Acknowledgments
We acknowledge the valuable laboratory assistance pro-vided by M. Ammar-Khellouf and J-P. Bosse. We aregrateful to U. Dorigo for her critical reading of an earlierversion of the manuscript. The English text has beenchecked by Monika Ghosh.
References
1. Adrian, R, Whicham, SA, Butler, NM (2001) Trophic interactionsbetween zooplankton and the microbial community in contrastingfood webs: the epilimnion and deep chlorophyll maximum of amesotrophic lake. Aquat Microb Ecol 24: 83–97
2. Alfreider, A, Pernthaler, J, Amann, R, Sattler, B, Glockner, FO,Wille, A, Psenner, R (1996) Community analysis of the bacterialassemblages in the winter cover and pelagic layers of a highmountain lake by in situ hybridization. Appl Environ Microbiol 62:2138–2144
3. Amann, R, Binder, BJ, Olson, RJ, Chisholm, SW, Devereux, R,Stahl, DA (1990) Combination of 16S rRNA-targeted oligonu-cleotide probes with flow cytometry for analyzing mixed microbialpopulations. Appl Environ Microbiol 56: 1919–1925
4. American Public Health Association (APHA) (1992) In: Green-berg, A, Clesceri, L, Eaton, A (Eds.) Standard Methods forExamination of Water and Wastewater. Washington,18th edition.
5. Auer, B, Arndt, H (2001) Taxonomic composition and biomass ofheterotrophic flagellates in relation to lake trophy and season.Freshwater Biology 46: 959–972
6. Azam, F, Fenchel, T, Field, JG, Gray, JS, Meyer, LA, Thingstad, TF(1983) The ecological role of water column microbes in the sea.Mar Ecol Prog Ser 10: 257–263
7. Bettarel, Y, Amblard, C, Sime Ngando, T, Carrias, JF, Sargos, D,Garabetian, F, Lavandier, P (2003) Viral Lysis, Flagellate GrazingPotential and Bacterial Production in Lake Pavin. Microb Ecol 42:119–127
8. Beutler, M, Wiltshire, KH, Meyer, B, Moldaenke, C, Luring, C,Meyerhofer, M, Hansen, UP, Dau, H (2002) A fluorometricmethod for the differentiation of algal populations in vivo andin situ. Photosynth Res 72: 39–53
9. Bidneko, E, Mercier, C, Tremblay, J, Tailliez, P, Kulakauskas, S(1998) Estimation of the state of the bacterial cell wall by fluo-rescent in situ hybridization. Appl Environ Microbiol 64: 3059–3062
10. Bouvier, T, Del Giorgio, PA (2003) Factors influencing thedetection of bacterial cells using fluorescence in situ hybridization(FISH): a quantitative review of published reports. FEMS Micro-biol Ecol 44: 3–15
11. Børsheim, KY, Bratbak, G (1987) Cell volume to cell carbonconversion factors for a bacterivorous monas sp enriched fromseawater. Mar Ecol Prog Ser 36: 171–175
12. Bratbak, G, Heldal, M, Thingstad, TF, Riemann, B, Haslund,OH (1992) Incorporation of viruses into the budget ofmicrobial C-transfer: A first approach. Mar Ecol Prog Ser 83:273–280
13. Callieri, C, Karjalainen, SM, Passoni, S (2002) Grazing by ciliatesand heterotrophic nanoflagellates on picocyanobacteria in lagoMaggiore. J Plankton Res 24: 785–796
14. Caron, DA (1983) Technique for enumeration of heterotrophicand phototrophic nanoplankton, using epifluorescence micros-copy, and comparison with other procedure. Appl EnvironMicrobiol 46: 491–498
15. Carrias, JF, Amblard, C, Bourdier, G (1996) Protistan bacterivoryin an oligotrophic lake: importance of ciliates and flagellates.Microb Ecol 31: 249–268
16. Cleven, AJ (1996) Indirectly fluorescently labelled flagellates(IFLF): a tool to estimate the predation on free-living heterotro-phic flagellates. J Plankton Res 18: 429–442
17. Cleven, AJ, Weisse, T (2001) Seasonal succession and taxon specificbacterial grazing rates of heterotrophic nanoflagellates in LakeConstance. Aquat Microb Ecol 23: 147–161
18. Cottrell, MT, Kirchman, DL (2000) Natural assemblages of marineproteobacteria and members of Cytophaga flavobacter clusterconsuming low- and high- molecular weight dissolved organicmatter. Appl Environ Microbiol 66: 1692–1697
19. Crosbie, ND, Teubner, K, Weisse, T (2003) Flow-cytometricmapping provides novel insghts into the seasonal and verticaldistributions of freshwater autotrophic picoplankton. Aquat Mic-rob Ecol 33: 53–66
20. Daims, H, Bruhl, A, Amann, R, Schleifer, KH, Wagner, M (1999)The domain specific probe EUB338 is insufficient for the detectionof all bacteria: development and evaluation of a more compre-hensive probe set. Syst Appl Microbiol 22: 434–444
21. Degans, H, Zollner, E, Van der Gucht, K, De Meester, L, Jurgens, K(2002) Rapid Daphnia-mediated changes in microbial communitystructure: an experimental study. FEMS Microbiol Ecol 42: 137–149
22. Delong, EF, Taylor, LT, Marsh, TL, Preston, CM (1999) Visuali-zation and enumeration of marine planktonic Archae and bacteriaby using polyribonucleotide probes anf fluorescent in situhybridization. Appl Environ Microbiol 65: 5554–5563
23. Domaizon, I, Viboud, S, Fontvieille, D (2003) Taxon specific andseasonal variations in flagellates grazing on heterotrophic bacteriain the oligotrophic Lake Annecy — Importance of mixotrophy.FEMS Microbiol Ecol 46: 3117–3329
24. Gasol, JM (1994) A framework for the assessment of top-down vsbottom-up control of heterotrophic nanoflagellate abundance.Mar Ecol Prog Ser 113: 291–300
25. Gasol, JM, Vaque, D (1993) Lack of coupling between heterotro-phic nanoflagellates and bacteria: a general phenomenon acrossaquatic systems? Limnol Oceanogr 38: 657–665
26. Glockner, FO, Fuchs, B, Amann, R (1999) Bacterioplanktoncompositions of lakes and oceans: a first comparison based onfluorescence in situ hybridization. Appl Environ Microbiol 65:3721–3726
27. Glockner, FO, Zaichikov, E, Belkova, N, Denissova, L, Pernthaler,J, Pernthaler, A, Amann, R (2000) Comparative 16S rRNA analysisof lake bacterioplankton reveals globally distributed phylogeneticclusters including an abundant group of Actinobacteria. ApplEnviron Microbiol 66: 5053–5065
28. Hahn, MW, Hofle, MG (1999) Flagellate predation on a bacterialmodel community: Interplay of size-selective grazing, specificbacterial cell size, and bacterial community composition. ApplEnviron Microbiol 65: 4863–4872
29. Hahn, MW, Hofle, MG (2001) Grazing of protozoa and its effect onpopulations of aquatic bacteria. FEMS Microbiol Ecol 35: 113–121
30. Hitchman, RB, Jones, HLJ (2000) The role of mixotrophic protistsin the population dynamics of the microbial food web in a smallartificial ponds. Freshwater Biology 43: 231–241
31. Hofle, MG, Haas, H, Dominik, K (1999) Seasonal dynamics ofbacterioplankton community structure in a eutrophic lake asdetermined by 5S rRNA analysis. Appl Environ Microbiol 65:3164–3174
32. Hulot, FD, Lacroix, G, Lescher-Moutoue, F, Loreau, M (2000)Functional diversity governs ecosystem response to nutrientenrichment. Nature 405: 340–344
33. Jardillier, L, Basset, M, Domaizon, I, Belan, A, Amblard, C, Ri-chardot, M, Debroas, D (2004) Bottom-up and top-down control
COMTE ET AL.: MICROBIAL COMMUNITY STRUCTURE AND DYNAMICS IN THE LAKE BOURGET 87

of bacterial community composition in the euphotic zone of areservoir. Aquat Microb Ecol 35: 259–273
34. Jones, RI (2000) Mixotrophy in planktonic protist: an overview.Freshwater Biology 45: 219–226
35. Jurgens, K (1994) Impact of Daphnia on planktonic microbial foodwebs-a review. Mar Microb Food Webs 8: 295–324
36. Jurgens, K, Stolpe, G (1995) Seasonal dynamics of crustacean,zooplankton, heterotrophic nanoflagellates and bacteria in a shal-low, eutrophic lake. Freshwater Biology 33: 27–38
37. Jurgens, K, Pernthaler, J, Schalla, S, Amann, R (1999) Morpho-logical and compositional changes in a planktonic bacterial com-munity in response to enhanced protozoan grazing. Appl EnvironMicrobiol 65: 1241–1250
38. Jurgens, K, Jeppesen, E (2000) The impact of metazooplankton onthe structure of the microbial food web in a shallow, hypertrophiclake. J Plankton Res 22: 1047–1070
39. Jurgens, K, Simek, K (2000) Functionnal response and particle sizeselection of Halteria cf. grandinella, a common freshwater oligo-trichous ciliate. Aquat Microb Ecol 22: 57–68
40. Jurgens, K, Gasol, JM, Vaque, D (2000) Bacteria-flagellate couplingin microcosm experiments in the central Atlantic ocean. J Exp MarBiol Ecol 245: 127–147
41. Jurgens, K, Matz, C (2002) Predation as a shaping force for thephenotypic and genotypic composition of planktonic bacteria.Antonie van Leeuwenhoek 81: 413–434
42. Kemp, PF, Lee, S, LaRoch, J (1993) Estimating the growth rate ofslowly growing marine bacteria from RNA content. Appl EnvironMicrobiol 59: 2594–2601
43. Kirchman, DL (2001) The ecology of Cytophaga flavobacterium inaquatic environments. FEMS Microbiol Ecol 39: 91–100
44. Kisand, V, Zingel, P (2000) Dominance of ciliate grazing on bacteriaduring spring in a shallow eutrophic lake. Aquat Microb Ecol 22: 142
45. Lebaron, P, Servais, P, Trousselier, M, Courties, C, Muyzer, G,Bernard, L, Schafer, H, Pukall, R, Stackebrandt, E, Guindulain, T,Vives-Rego, J (2000) Microbial community dynamics in Medi-terranean nutrient enriched seawater mesocosms: changes, activityand composition. FEMS Microbiol Ecol 34: 255–266
46. Leboulanger, C, Dorigo, U, Jacquet, S, Le Berre, B, Paolini, G,Humbert, JF (2002) Application of a submersible spectrofluo-rometer for rapid monitoring of freshwater cyanobacterial blooms:a case study. Aquat Microb Ecol 30: 83–89
47. Loferer-Kroßbacher, M, Klima, J, Psenner, R (1998) Determinationof bacterial cell dry mass by transmission electron microscopy anddensitometric image analysis. Appl Environ Microbiol 64: 688–694
48. Manz, W, Amann, R, Ludwig, W, Wagner, M, Schleifer, KH (1992)Phylogenetic oligodeoxynucleotide probes for the major subclassesof Proteobacteria: problems and solutions. Syst Appl Microbiol 15:593–600
49. Manz, W, Amann, R, Ludwig, W, Vancanneyt, M, Schleifer, KH(1996) Application of a suite of 16S rRNA-targeted probes designedto investigate bacteria of the phylum Cytophaga-Flavobacterium-bacteroides in the natural environment. Microbiology 142: 1097–1106
50. Methe, BA, Zehr, JP (1999) Diversity of bacterial communities in,Adirondack lakes: do species assemblages reflect lake chemistry?Hydrobiologia 401: 77–96
51. Moter, A, Gobel, UB (2000) Fluorescence in situ hybridisation(FISH) for direct visualization of microorganisms. J MicrobialMethods 41: 85–112
52. Muller, H (1989) The relative importance of different ciliate taxain the pelagic food web of lake Constance. Microb Ecol 18: 261–273
53. Muylaert, K, Van der Gucht, K, Vloemans, N, De Meester, L, Gillis,M, Vyverman, W (2002) Relationship between bacterial commu-
nity composition and bottom-up versus top-down variables in foureutrophic shallow lakes. Appl Environ Microbiol 68: 4740–4750
54. Noble, RT, Middelboe, M, Fuhrman, JA (1999) Effects of viralenrichment on the mortality and growth of heterotrophic bacte-rioplankton. Aquat Microb Ecol 18: 1–13
55. Pernthaler, A, Simek, K, Sattler, B, Schwarzenbacher, B, Bobkova,J, Psenner, R (1996) Short term changes of protozoan control onautotrophic picoplankton in an oligomesotrophic lake. J PlanktonRes 18: 443–462
56. Pernthaler, J, Glockner, FO, Unterholzner, S, Alfreider, A, Psenner,R, Amann, R (1998) Seasonal community and populationdynamics of pelagic bacteria and archea in high mountain lake.Appl Environ Microbiol 64: 4299–4306
57. Pomeroy, LR (1974) The ocean�s food web, a changing paradigm.Bioscience 24: 499–504
58. Porter, KG, Feig, YS (1980) The use of DAPI for identifying andcounting aquatic microflora. Limnol Oceanogr 25: 943–948
59. Posch, T, Simek, K, Vrba, J, Pernthaler, J, Nedoma, J, Sattler, B,Sonntag, B, Psenner, R (1999) Predator-induced changes of bac-terial size-structure and productivity studied on an experimentalmicrobial community. Aquat Microb Ecol 18: 235–246
60. Proctor, LM, Fuhrman, JA (1992) Mortality of marine bacteria inresponse to enrichments of the virus size fraction from seawater.Mar Ecol Prog Ser 87: 283–293
61. Putt, M, Stoecker, DK (1989) An experimentally determined car-bon: volume ratio for marine oligotrichous ciliates from estuarineand coastal waters. Limnol Oceanogr 34: 1097–1103
62. Ribes, M, Coma, R, Gili, J (1999) Seasonal variation of particulateorganic carbon, dissolved organic carbon and the contribution ofmicrobial communities to the live particulate organic carbon in ashallow near-bottom ecosystem at the North western Mediterra-nean Sea. J Plankton Res 21: 1077–1100
63. Rosenstock, B, Simon, M (2001) Sources and sinks of dissolvedfree amino acids and protein in a large and deep mesotrophic lake.Limnol Oceanogr 46: 644–654
64. Sanders, RW, Porter, KG, Bennett, SJ, Debiase, AE (1989) Seasonalpatterns of bacterivory by flagellates, ciliates, rotifers and cladoc-erans in a freshwater planktonic community. Limnol Oceanogr 34:673–687
65. Sanders, RW, Berninger, UG, Lim, EL, Kemp, PF, Caron, DA(2000) Heterotrophic and mixotrophic nanoplankton predation inthe Sargasso Sea and on Georges Bank. Mar Ecol Prog Ser 192:103–118
66. Sime-Ngando, T, Hartman, P, Groliere, CA (1990) Rapid quanti-fication of planktonic ciliates: comparison of improved livecounting with other methods. Appl Environ Microbiol 56: 2234–2242
67. Sime-Ngando, T, Bourdier, G, Amblard, C, Pinel-Alloul, B (1991)Short-term variations in specific biovolumes of different bacterialforms in aquatic ecosystems. Microb Ecol 21: 211–226
68. Simek, K, Vrba, J, Pernthaler, J, Posch, T, Hartman, P, Ned-oma, J, Psenner, R (1997) Morphological and compositionshifts in an experimental bacterial community influenced byprotists with contrasting feeding modes. Appl Environ Micro-biol 63: 587–595
69. Simek, K, Jurgens, K, Nedoma, J, Comerma, M, Armengol, J(2000) Ecological role and bacterial grazing of Halteria sp: smallfreshwater oligotrichs as dominant pelagic ciliate bacterivores.Aquat Microb Ecol 22: 43–56
70. Simek, K, Pernthaler, J, Weinbauer, MG, Hornak, K, Dolan, J,Nedoma, J, Masin, M, Amann, R (2001) Changes in bacterialcommunity composition and dynamics and viral mortality ratesassociated with enhanced flagellates grazing in a mesoeutrophicreservoir. Appl Environ Microbiol 67: 2723–2733
88 COMTE ET AL.: MICROBIAL COMMUNITY STRUCTURE AND DYNAMICS IN THE LAKE BOURGET

71. Sommaruga, R, Psenner, R (1995) Permanent presence of grazing-resistant bacteria in a hypertrophic lake. Appl Environ Microbiol61: 3457–3459
72. Stahl, DA, Amann, R (1991) Development and application ofnucleic acid probes. In: Goodfellow, M, Stackebrandt, E (Eds.)Nucleic Acid Techniques in Bacterial Systematics. John Wiley &Sons, Chichester, UK, pp 205–248
73. Thouvenot, A, Richardot, M, Debroas, D, Devaux, J (1999) Bac-terivory of metazooplankton, ciliates and flagellates in a newlyflooded reservoir. J Plankton Res 21: 1659–1679
74. Tsuji, T, Ohki, K, Fujita, Y (1986) Determination of photosyn-thetic pigment composition in an individual phytoplankton cell inseas and lakes using fluorescence microscopy: properties of thefluorescence emitted from picophytoplankton cells. Mar Biol 93:343–349
75. Tranvik, LJ, Porter, J, Sieburth, JMc N (1989) Occurrence of bac-terivory in Cryptomonas, a common freshwater phytoplankter.Oecologia 78: 473–476
76. Verity, PG, Roberson, CY, Tronzo, CR, Andrews, MG, Nelson, JR,Sieracki, ME (1992) Relationships between cell volume and thecarbon and nitrogen content of marine photosynthetic nano-plankton. Limnol Oceanogr 37: 1434–1446
77. Weisse, T, Muller, H, Pinto-Coehlo, RM, Schweizer, A,Springmann, D, Baldringer, G (1990) Response of the microbialloop to the phytoplankton spring bloom in a prealpine lake.Limnol Oceanogr 35: 781–794
78. Weinbauer, Rassoulzadegan (2004) Are Viruses driving microbialdiversification and diversity? Environmental Microbiology 6(1), 1–11
79. Wetzel, RG (1982) Limnology. WB Saunders, Philadelphia
80. Wieltschnig, C, Kirschner, AKT, Steitz, A, Velimirov, B (2001)Weak coupling between heterotrophic nanoflagellates and bacte-ria in a eutrophic freshwater environment. Microb Ecol 42: 159–167
81. Wu, QL, Boegnik, J, Hahn, MW (2004) Successful predation offilamentous bacteria by a nanoflagellate challenges current modelsof flagellate bacterivory. Appl Environ Microbiol 70: 332–339
82. Yoshida, T, Gurung, TB, Kagami, M, Urabe, J (2001) Contrastingeffects of a cladoceran (Daphnia galeata) and a calanoid copepod(Eodiaptomus japonicus) on algal and microbial plankton in aJapanese lake. Lake Biwa. Oecologia 129: 602–610
83. Zwisler, W, Selje, N, Simon, M (2003) Seasonal patterns of thebacterioplankton community composition in a large mesotrophiclake. Aquat Microb Ecol 31: 211–225
COMTE ET AL.: MICROBIAL COMMUNITY STRUCTURE AND DYNAMICS IN THE LAKE BOURGET 89