micro fabrication by uv laser...
TRANSCRIPT

33Micro Fabrication by UV Laser PhotopolymerizationMemoirs of the School of Engineering, Nagoya UniversityVol.50, No.1/2 (1998)
MICRO FABRICATION BY UVLASER PHOTOPOLYMERIZATION
Katsumi YAMAGUCHI and Takeshi NAKAMOTO
Department of Mechanical Engineering
(Received November 4, 1998)
Abstract
This research deals with the development of simple and practical methods formanufacturing high aspect ratio (height/width) micro parts and three-dimensionalmicro parts. The first method is mask-based method in which an image is transferredto a liquid photopolymer by irradiating a UV laser through a patterned mask. Theirradiated portion of the photopolymer is then solidified and it becomes a high as-pect ratio polymer structure or mold. In the second and third methods, high aspectratio polymer structures are produced using a shaped UV laser beam writing and afocused UV laser beam writing, respectively. The desired product shape is obtainedby writing along the contour of the product on the surface of a liquid photopolymer.The written pattern then becomes solid so as to produce a solidified polymer struc-ture or mold. The fourth, three-dimensional micro part is produced by a focused UVlaser beam writing method. The accuracy of the solidified polymer when using thesemethods is examined. The examination is done theoretically and experimentally. Theoptimum conditions to produce high aspect ratio micro parts and three-dimensionalmicro parts are also verified. Various shapes of micro polymer structures are pro-duced using these methods.
Keywords: Micro fabrication, Photopolymer, UV laser, High aspect ratio micropart, Three-dimensional micro part, Accuracy, Mask-based method,Beam writing method, Diffraction of light, Absorption of light, Solidi-fication
Contents
1. Mask-Based Method............................................................................................................................. 351.1 Itroduction ........................................................................................................................................ 351.2 Manufacturing method ..................................................................................................................... 361.3 Theoretical analysis of pattern transfer ............................................................................................ 37
33

34 Katsumi Yamaguchi and Takeshi Nakamoto
1.4 The effect of the physical parameters ............................................................................................... 401.4.1 Wavelength, λ ....................................................................................................................... 401.4.2 Mask-polymer surface distance, h .........................................................................................401.4.3 Absorption coefficient, α ....................................................................................................... 411.4.4 Optimum condition for UV laser and present photopolymer ................................................ 41
1.5 Experiment on pattern transfer process ............................................................................................ 421.5.1 Experimental photopolymer .................................................................................................. 421.5.2 Experimental method ............................................................................................................ 43
1.6 Comparison of theoretical and experimental results ........................................................................ 431.7 The manufacturing of high aspect ratio products .............................................................................441.8 Conclusions ...................................................................................................................................... 46
2. Writing Method .................................................................................................................................... 492.1 Introduction ...................................................................................................................................... 492.2 Manufacturing method ..................................................................................................................... 492.3 Analysis of the shape of the solidified polymer ............................................................................... 50
2.3.1 Simulation ............................................................................................................................. 502.3.2 Comparison with experimental data ...................................................................................... 53
2.4 Profile simulation and experimental results ..................................................................................... 532.4.1 Rectangular profiles ............................................................................................................... 532.4.2 Circular profiles ..................................................................................................................... 54
2.5 Products in shaped beam writing ...................................................................................................... 542.6 Conclusions ...................................................................................................................................... 59
3. Direct Focused Beam Writing Method for Producing High Aspect Ratio Micro Part.................. 593.1 Introduction ...................................................................................................................................... 593.2 Manufacturing method ..................................................................................................................... 603.3 Basic equations to shape the solidified polymer .............................................................................. 613.4 Optimum conditions to obtain high aspect ratio structures .............................................................. 63
3.4.1 Physical parameters ............................................................................................................... 633.4.2 Effect of beam wavelength λ ................................................................................................. 633.4.3 Effect of aperture R and focal length f of lens ....................................................................... 653.4.4 Effect of absorption coefficient α ......................................................................................... 673.4.5 Effect of defocusing .............................................................................................................. 68
3.5 Comparison with experimental data ................................................................................................. 703.6 Examples of high aspect ratio products ............................................................................................ 713.7 Conclusions ...................................................................................................................................... 71
4. Manufacturing of Three-Dimensional Structures............................................................................. 714.1 Introduction ...................................................................................................................................... 714.2 Manufacturing method ..................................................................................................................... 714.3 Conditions for producing three-dimensional microstructures .......................................................... 714.4 Rectangular profile ........................................................................................................................... 754.5 Comparison with experimental data ................................................................................................. 764.6 Stacked structure .............................................................................................................................. 764.7 Conclusions ...................................................................................................................................... 78
Acknowledgement........................................................................................................................................ 78
References.................................................................................................................................................... 78

35Micro Fabrication by UV Laser Photopolymerization
1. Mask-Based Method
1.1 Introduction
The manufacture of micro mechanical parts has drawn great attention in recent years at bothresearch and development levels. The manufacturing of micro link and micro sliding mechanismswas a part of the pioneer research work done at AT&T Bell Laboratories1) and University of Cali-fornia, Berkeley2). The work was carried out by applying a lithography technique on a semicon-ductor material. The application of this method led to the manufacture of electro-static motors3)
and various sensors4,5).The material used to manufacture these micro mechanical parts is silicon, and part thickness
of only a few micrometers are possible. Considering the thickness limitation and alternative mate-rial properties with further expanded applications, thick metallic micromechanical parts may bedesirable. Several recent processes have been developed to meet these requirements6-24). The mostsuccessful of these processes is the so-called LIGA (Lithograph Galvanoformung und Abformung)process6-20). In this process, a thick (up to several hundred micrometers) photoresist pattern is madewith X-rays radiation from a synchrotron. Using the pattern as a mold, a high aspect ratio (height/width) metallic micro mechanical structure is made by an electroforming process. This process isused to produce various micromachined parts such as separation nozzles12), X-ray masks13) etc. Avariation of the LIGA process using sacrificial layer is the so-called SLIGA (Sacrificial-LIGA)process which produces flexible or free rotating microstructures7,8,14-16). The application of thismethod led to the manufacture of a planar magnetic micromotor15) microturbine7) etc. The process-ing sequence produce flanks for which the run-out is less than 0.3 µm in 100 µm height. However,from a practical point of view, synchrotron X-rays pose limitations because of size, expense andavailability constraints.
Several recent studies on three dimensional polymer structures and models describe details ofdirect writing and scanning processes24-27). In these methods, two dimensional polymer structuresare made by writing or scanning with a laser beam on the surface of a liquid photopolymer. Theirradiated portion of the liquid photopolymer is then solidified. Three dimensional solidified poly-mer structures are then attained by stacking the polymer layers on top of one another until thedesired height is reached. Various studies related to these methods have investigated the equipmentand processing steps in more detail. However, micro fabrication and the accuracy of the polymerstructures are not clarified in detail when using writing and scanning methods.
Three distinct methods are used to produce micro structures of various sizes and shapes. Thefirst method is mask-based method28,29) in which an image is transferred to a liquid photopolymerby irradiating a UV laser through a patterned mask as shown in Fig. 1-1 (a). The irradiated portionof the photopolymer is then solidified. Next, upon development, only the solidified portion be-comes a high aspect ratio micro polymer structure or micro mold. In the second method, highaspect ratio solidified polymer structures are produced by using direct writing a shaped UV laserbeam30) on the surface of a liquid photopolymer along the contour of the products as shown in Fig.1-1 (b). In the third method, polymer structures are produced by direct writing using a focused UVlaser beam31) as shown in Fig. 1-1 (c).
In this study, the shapes of the solidified polymer obtained by theoretical calculations are com-pared with those obtained experimentally. Using the theoretical and experimental results, variousmicro polymer structures with reasonably high accuracy are made.
This section examines the accuracy of the solidified photopolymer produced by mask-basedmethod. The simulation and results of the experiment on the pattern transfer process are describedin detail. The purpose of this section is to manufacture micromachine parts on the order of 0.01–1.0 mm in size in a relatively simple and economical way, compared to the present press forming.

36 Katsumi Yamaguchi and Takeshi Nakamoto
1.2 Manufacturing method
Fig. 1-2 shows the manufacturing method employed to produce high aspect ratiomicromechanical parts such as a gear. At first, laser beam is irradiated on the surface of the liquidphotopolymer passing through the mask as shown in (a). At this time the irradiated portion of theliquid photopolymer becomes solid. Next, upon development, only the solidified portion remainsas shown in (b). After the development, materials such as nickel are electroformed into an electri-cally conducting substrate shown in (c). Finally, upon removing the solidified photopolymer, themetallic gear remains as shown in (d). Fig. 1-2 shows a gear-making process. However, dependingon the irradiation, development and electroforming process repetition, a gear shaft assembly couldalso be made.
Fig. 1-1 Fabrication methods of micro structures
(a) Mask-based pattern transfer (b) Direct shaped beam writing (c) Direct focused beam writing
Fig. 1-2 Schematic diagram of mask-based method
(a) Irradiation (d) Product(c) Electroforming(b) Development

37Micro Fabrication by UV Laser Photopolymerization
1.3 Theoretical analysis of pattern transfer
This section deals with the processes of pattern transfer explained in Fig. 1-2 (a). In order toproduce thick and accurate products, the accuracy of the part dimension and the verticality of theside wall along the thickness are essential. The main factors affecting the accuracy are diffraction,absorption and fluorescence. The effect of fluorescence is not significant and is dealt with in Sec-tion 1.5.1. In this section, the effect of diffraction and absorption on the accuracy of pattern trans-fer are examined.
Fig. 1-3 shows the theoretical model used to simulate the shape of the solidified polymer. Fig.1-3 (a) shows the theoretical model used when a beam with uniform intensity is irradiated througha square mask onto the surface of the liquid polymer. Here Io is the beam intensity, λ the wave-length, a the length of the square, and h the distance between the mask and the surface of thepolymer. In this experiment, the mask and photopolymer surface distance h is far greater than thewavelength of the light source. Therefore, Fresnel’s diffraction theory can be applied to calculatethe effect of diffraction. Let the center of the mask be at x=0, y=0 and the depth of the polymer bealong z. The light intensity after diffraction at Id (x,y,z) can be expressed as follows32,33).
Where,
Fig. 1-3 Theoretical model
(a) Square beam (b) Circular beam
Id (x , y , z) = 14
Io [Cx2Cy
2 + Cx2Sy
2 + Sx2Cy
2 + Sx2Sy
2 ] (1-1)
Cx = cos 12
πu2 dup
1
p2
(1-2)
Sx = sin 12
πu2 dup
1
p2
(1-3)
C y = cos 12
πu2 duq
1
q2
(1-4)
S y = sin 12
πu2 duq
1
q2
(1-5)

38 Katsumi Yamaguchi and Takeshi Nakamoto
In these equations Cx, Sx, Cy and Sy are Fresnel’s integrals.When a beam is irradiated through a circular mask with a radius rc, as shown in Fig. 1-3 (b),
Id can be expressed as follows32,33).
The integrals in equation (1-11) are Fresnel’s integral as expressed in the cylindrical coordi-nate, and Jo is the 0 order type 1 Bessel function.
The intensity of the diffracted light decreases due to absorption of the light by the photopoly-mer. Let the absorption coefficient of the photopolymer for the incident light be α. The relation-ship between the absorption coefficient and light intensity at depth z, denoted as I, can be expressedas follows:
The irradiated energy per unit area, E, at (x,y,z) having been irradiated for the period of timet, can be expressed as follows.
Id (r , z) =4π 2 Io
λ 2 (h + z)2
× cosπρ 2
λ (h + z)Jo
2πρrλ (h + z)
ρ dρ0
rc
2
+ cosπρ 2
λ (h + z)Jo
2πρrλ (h + z)
ρ dρ0
rc
2
(1-11)
I (x , y , z) = Id ⋅ exp (– α z) (1-12)
p1
= 2m
xa – 1
2(1-6)
p2
= 2m
xa + 1
2(1-7)
q1
= 2m
ya – 1
2(1-8)
q2
= 2m
ya + 1
2(1-9)
m =2λ (h + z)
a2 (1-10)

39Micro Fabrication by UV Laser Photopolymerization
When the irradiated energy E (x,y,z) attains the threshold value Eo, the photopolymer is as-sumed to solidify. Therefore (x,y,z) satisfying equation (1-14) becomes the shape of the solidifiedpolymer.
Preliminary test were done to determine the value of α and Eo. When the incident light has theuniform intensity Io, the depth of solidified photopolymer z, can be expressed as follows34).
The photopolymer surface layer starts to solidify for the period of time to. The value of α, Eo
and to can be obtained from the relationship between the exposure time and the depth of the solidi-fied photopolymer. These results are illustrated in Fig. 1-4. The values obtained on the basis of thefigure are α = 6.94 × 10⁻³ (1/µm), to = 1.06 seconds and Eo = 0.34 mJ/mm2.
Fig. 1-5 shows a simulation of the shape of the solidified polymer obtained when using amask with the square and circular cross sections shown in (a) and (b), respectively. In these fig-ures, the solidified polymer is shown upside down for clarity. The simulations show that both thesquare and circular patterns form slightly tapered walls, though straight walls are desirable to makeprecise molds as shown in Fig. 1-2.
I (x , y , z) =Eo
t(1-14)
z = 1α loge
Io ⋅ t
Eo
= 1α loge
tto
(1-15)
Eo = Io ⋅ to (1-16)
Fig. 1-4 Experimental data obtained from the relationship between the exposure time anddepth of the solidified photopolymer
E (x , y , z , t ) = I (x , y , z) ⋅ t (1-13)

40 Katsumi Yamaguchi and Takeshi Nakamoto
1.4 The effect of the physical parameters
This section examines the effect of the physical parameters such as wavelength λ, absorptioncoefficient α, and the mask-polymer distance h, on the accuracy of the solidified polymer layerobtained when transferring mask patterns. As an example, a mask with a square cross section isused.
1.4.1 Wavelength, λFig. 1-6 (a), (b) and (c) show results of simulating the shape of the solidified polymer when
the wavelength, λ, of the irradiated beam is 0.2 × 10⁻³ µm, 0.325 µm and 10.6 µm for SOR (LIGAprocess), He-Cd laser (present research experimental apparatus) and CO2 laser (not practical butincluded for reference), respectively. Fig. 1-6 (d) presents a comparison of the cross sections of thesolidified polymer when varying the wavelength, λ. The figure indicates that the wavelength af-fects the accuracy of the pattern transfer. The production errors of the width at 100 µm depth are0.07 µm, 3 µm and 16 µm for λ = 0.2 × 10⁻³ µm, 0.325 µm and 10.6 µm, respectively.
1.4.2 Mask-polymer surface distance, h
Fig. 1-7 (a), (b) and (c) show simulations of the shape of the solidified polymer when thevalue of the mask-polymer surface distance, h, is 10 µm, 1000 µm and 100000 µm (not practicalbut included for reference), respectively. Fig. 1-7 (d) presents a comparison of the cross sectionswhen varying the mask-polymer surface distance, h. The smaller the mask-polymer surface dis-
(a) Square beam[a = 500 µm]
(b) Circular beam[rc = 250 µm]
Fig. 1-5 Simulation of the solidified polymer shape[Io = 1 mW/mm2, λ = 0.325 µm, h = 10 µm, α = 6.94 × 10⁻³
(1/µm), t = 10 sec]
(a) λ = 0.2 × 10⁻³ µm (b) λ = 0.325 µm (c) λ = 10.6 µm (d) Comparison of thecross sections
Fig. 1-6 Simulation of the solidified polymer shape[Io = 1 mW/mm2, a = 500 µm, h = 10 µm, α = 6.94 × 10⁻³ (1/µm), t = 10 sec]

41Micro Fabrication by UV Laser Photopolymerization
tance, the higher the accuracy of the pattern transfer. The production errors of the width at 100 µmdepth are 3 µm, 10 µm and 111 µm for h = 10 µm, 1000 µm and 100000 µm, respectively.
1.4.3 Absorption coefficient, α
Fig. 1-8 (a), (b) and (c) show simulations of the shape of the solidified polymer when thevalue of the absorption coefficient, α, is 6.94 × 10⁻³ (1/µm), 13.88 × 10⁻³ (1/µm) and 27.76 × 10⁻³
(1/µm), respectively. The values correspond to 2 and 4 times the absorption coefficient of the ex-perimental polymer (6.94 × 10⁻³ (1/µm)).
Fig. 1-8 (d) presents a comparison of the cross sections when varying the absorption coeffi-cient, α. The production errors of the width at 100 µm depth are almost the same for the absorptioncoefficients shown in Fig. 1-8 (d). However, the larger the absorption coefficient becomes, the moreirradiating time is necessary so as to achieve the same solidified depth. Therefore the solidifiedwidth becomes greater at the surface of the polymer. The production errors become 1 µm, 2 µmand 4 µm for α = 6.94 × 10⁻³ (1/µm), 13.88 × 10⁻³ (1/µm), 27.76 × 10⁻³ (1/µm), respectively, at theoptimum irradiating time.
When the mask-polymer surface distance h = 10 µm, the absorption coefficient α = 6.94 ×10⁻³ (1/µm) and the optimum irradiating time t = 2.1 sec, the production error of the width at 100µm depth are 0.03 µm, 1 µm for λ = 0.2 × 10⁻³ µm (SOR) and 0.325 µm (UV laser), respectively.
1.4.4 Optimum condition for UV laser and present photopolymer
The light source is a He-Cd Laser (wavelength 325 nm) in this experiment. And the absorp-tion coefficient of photopolymer used in this experiment is 6.94 × 10⁻³ (1/µm) described in Sec.1.3. Fig. 1-9 (a) shows a simulation of the solidified polymer in this condition. In this figure, the
(a) h = 10 µm (b) h = 1000 µm (c) h = 100000 µm (d) Comparison of thecross sections
Fig. 1-7 Simulation of the solidified polymer shape[Io = 1 mW/mm2, a = 500 µm, λ = 0.325 µm, α = 6.94 × 10⁻³ (1/µm), t = 10 sec]
(a) α = 0.694 × 10⁻³
(1/µm)(d) Comparison of the
cross sections
Fig. 1-8 Simulation of the solidified polymer shape[Io = 1 mW/mm2, a = 500 µm, λ= 0.325 µm, h = 10 µm, t = 10 sec]
(b) α = 13.88 × 10⁻³
(1/µm)(c) α = 27.76 × 10⁻³
(1/µm)

42 Katsumi Yamaguchi and Takeshi Nakamoto
solidified polymer is shown upside down for clarity. The right of Fig. 1-9 (b) shows a simulation ofthe shape of the cross section of the solidified polymer. As can be seen from the figure, as theirradiation time increases, the depth and width of the solidified polymer increase. The increment inthe width is very small and gradual as compared to the depth of the solidified polymer. The left ofthe Fig. 1-9 (b) shows the sidewall of the solidified polymer. In order to readily distinguish thesolidified shape, the x coordinate is magnified to 5 times that of the z coordinate. When the photo-polymer is solidified at the ideal condition of t = 6.6 seconds and depth of 100 µm, straight edgepattern transfer accuracy of ±0.5 µm is possible. Hence, for the both sides, the accuracy of patterntransfer is ±1 µm.
1.5 Experiment on pattern transfer process
1.5.1 Experimental photopolymer
The photopolymer used in this experiment is a product of Asahi Chemical Co., Ltd. The pho-topolymer material is an unsaturated polyester. The trade name is APR stamp resin (Katadori-20).This photopolymer is usually used for plate-making in the printing technology. The photopolymerhas a maximum sensitivity at a wavelength of 365 nm.
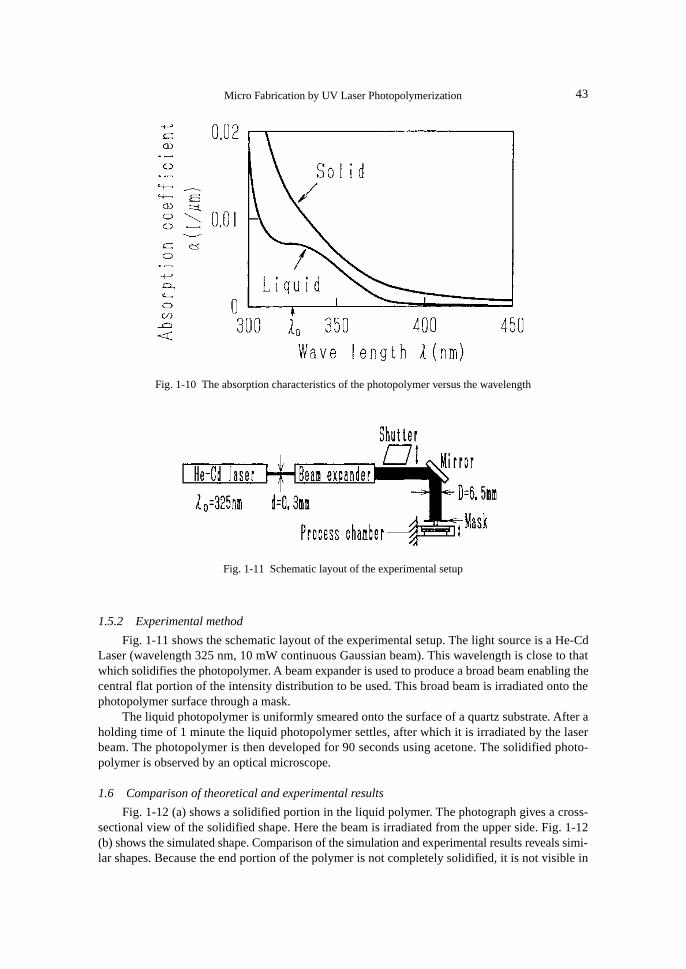
Fig. 1-10 shows the absorption characteristics of the photopolymer versus the wavelength.The absorption coefficient of the solid is larger than that of the liquid and the larger the wavelengththe better the transmittance. The irradiating light wavelength 325 nm which is used in this experi-ment was shown to be transmitted sufficiently in both liquid (before solidification) and solid (aftersolidification) photopolymer.
The fluorescence spectral analysis shows that the peak of the fluorescence spectrum is 390nm and 400 nm before and after solidification, respectively. The intensity of the light due to theeffect of fluorescence is very weak compared to the intensity of the incident light. Therefore, theeffect of the fluorescence is negligible compared to that of diffraction and absorption.
(a) Solidified polymer shape [t = 10 sec] (b) Cross section
Fig. 1-9 Simulation of the shape of the solidified photopolyer[Io = 0.32 mW/mm2, a = 500 µm, h = 10 µm]
43Micro Fabrication by UV Laser Photopolymerization
1.5.2 Experimental method
Fig. 1-11 shows the schematic layout of the experimental setup. The light source is a He-CdLaser (wavelength 325 nm, 10 mW continuous Gaussian beam). This wavelength is close to thatwhich solidifies the photopolymer. A beam expander is used to produce a broad beam enabling thecentral flat portion of the intensity distribution to be used. This broad beam is irradiated onto thephotopolymer surface through a mask.
The liquid photopolymer is uniformly smeared onto the surface of a quartz substrate. After aholding time of 1 minute the liquid photopolymer settles, after which it is irradiated by the laserbeam. The photopolymer is then developed for 90 seconds using acetone. The solidified photo-polymer is observed by an optical microscope.
1.6 Comparison of theoretical and experimental results
Fig. 1-12 (a) shows a solidified portion in the liquid polymer. The photograph gives a cross-sectional view of the solidified shape. Here the beam is irradiated from the upper side. Fig. 1-12(b) shows the simulated shape. Comparison of the simulation and experimental results reveals simi-lar shapes. Because the end portion of the polymer is not completely solidified, it is not visible in
Fig. 1-10 The absorption characteristics of the photopolymer versus the wavelength
Fig. 1-11 Schematic layout of the experimental setup

44 Katsumi Yamaguchi and Takeshi Nakamoto
(a). Fig. 1-12 (c) shows the simulation of the solidified polymer. In this figure the solidified poly-mer is shown upside down for clarity.
Next, upon development, only the solidified portion remains. Because the end of the polymeris not completely solidified, the developer dissolves the polymer more easily there; and the edgeshape of the solidified polymer becomes smooth by the surface tension. However, only the solidi-fied sidewalls are used in making a high aspect ratio micro-mold as shown in Fig. 1-2. Thereforethe shape of the end of the solidified polymer is not important.
1.7 The manufacturing of high aspect ratio products
The maximum depth of solidification for which we can expect a reasonably high accuracy isabout 100 µm. Beyond this limit the accuracy decreases. However, if a thicker wall is desired, the
Fig. 1-12 Comparison of experimental shapes and simulation of solidifed polymer[Io = 0.31 mW/mm2, a = 500 µm, λ = 0.325 µm, h = 1000 µm, α = 6.94 × 10⁻³ (1/µm), t = 7 sec]
(a) Experimental shape (b) Simulation of the crosssection
(c) Simulation of the solidified polymer
Fig. 1-13 Apparatus for stacking procedure

45Micro Fabrication by UV Laser Photopolymerization
following procedure is adopted.Fig. 1-13 shows the apparatus for this procedure. First, the liquid photopolymer is poured into
the process chamber with a depth of 100 µm. The first layer of the solidified photopolymer is thenmade by irradiation. Next, the table is moved 100 µm downwards and an equal amount of liquidfilm is spread on top of the solidified layer. The second layer is solidified by a second exposureand so on. After this stacking procedure is completed, the photopolymer is developed. Followingthis method, a high aspect ratio of reasonably high accuracy can be obtained.
In order to obtain a 1 µm accuracy at a depth of 1000 µm, the number of polymer layersrequired when using λ = 0.2 × 10⁻³ µm, 0.325 µm and 10.6 µm is 1, 10 and 40 layers, respectively.The simulations are done using the values of h = 10 µm and α = 6.94 × 10⁻³ (1/µm). The schematicdiagrams of simulations of the sidewall produced by the stacking method for various wavelengthare shown in Fig. 1-14.
Fig. 1-15 shows the scanning micrograph of the solidified photopolymer produced by the stack-ing method. The sidewall profiles of the micro-mold produced by the stacking method are mea-sured by stylus instrument as shown Fig. 1-16. The left shows the simulation profile and the rightshows the experimental profile.
The smaller the distance h, the smaller the increment in the width of the solidified polymer.For h = 10 µm, the simulation shows a productive error of 1 µm. An error of 1 µm, however, isdifficult to measure. Therefore a large distance h which results in a larger productive error (mea-surable) facilitates comparison of the simulation and experimental profile. The distance is thuskept at h = 1000 µm. The thickness of one layer is 100 µm.
The simulation and experimental profiles of the sidewalls have the surface waviness of 6 µmand 8 µm, respectively. The sidewall profiles of both simulation and experimental match closely.
Fig. 1-17 shows some example of a photopolymer mold obtained by the stacking method.Fig. 1-18 (a) and (b) indicate examples of a mold obtained by a single and two alternate masks,respectively.
Fig. 1-14Schematic diagrams of the simulation of the stackingmethod for various wavelengths[h = 10 µm, α = 6.94 × 10⁻³ (1/µm)]

46 Katsumi Yamaguchi and Takeshi Nakamoto
1.8 Conclusions
Based on the theoretical analysis and experimental results of the mask-based method, the fol-lowing conclusions can be obtained.(1) The shape and accuracy of the solidified photopolymer are estimated using both Fresnel’s
Fig. 1-15 Scanning micrograph of the solidified photopolymer produced by the stacking method
Fig. 1-16 Sidewall profiles of the micro polymer structure[Io = 0.32 mW/mm2, a = 500 µm, h = 1000 µm, t = 7 sec]

47Micro Fabrication by UV Laser Photopolymerization
diffraction theory and the theoretical considerations reached for the absorption of light.(2) The effect of the physical parameters on the shape and accuracy of the pattern transfer can be
examined by simulation.(3) In proximity transfer, for a depth of 100 µm, an accuracy of 0.03 µm and 1 µm can be ex-
pected from simulation using an SOR and UV laser source, respectively.(4) Using a UV laser and the stacking method, thick and high aspect ratio microstructures with
the sidewall surface waviness of 8 µm can be produced.(5) According to the theoretical analysis, an accuracy of ±1 µm could be attained when the dis-
tance between the mask and the surface of the photopolymer is 10 µm.
Fig. 1-17 Examples of photopolymer mold obtained by the stacking method

48 Katsumi Yamaguchi and Takeshi Nakamoto
(a) Photopolymer mold obtained by a single mask
(b) Photopolymer mold obtained by two alternate masks
Fig. 1-18 Examples of photopolymer mold obtained by a single mask and two alternate masks

49Micro Fabrication by UV Laser Photopolymerization
2. Writing Method
2.1 Introduction
Several recent studies on three dimensional polymer structures and models describe details ofmaskless fabrication processes24-27,30,31,35-37). Writing and scanning methods are maskless directbeam processes that provide a great deal of flexibility in designing various patterns. This is espe-cially beneficial when lower production volume is desired. In the scanning method, a focused beamis manipulated by various deflecting devices such as in galvanometer-type scanners26), polygonscanners27) and acousto-optical scanners36). The desired product shape is obtained by scanning theentire area using controlled exposure.
Direct writing along the contour of the product using a shaped beam is another method used37).In this method, various apertures are employed to shape the beam with the desired contour ob-tained by moving an X-Y table. In direct writing and scanning processes, when the polymer isirradiated, only two dimensional structures can be obtained. Three dimensional structures are thenattained by stacking the polymer layers on top of one another until the desired height is reached.
The purpose of this research is to manufacture high aspect ratio precision micro-molds by thedirect writing method. Various studies related to three dimensional microfabrication on polymerlayers using direct writing and scanning methods have investigated the equipment and processingsteps in more detail24-27,36,37). The effects of using various shaped beams on the lateral dimensionsand verticality of the sidewalls when using the scanning and writing methods however, have notbeen clarified in detail.
Here we examine the shape of the solidified polymer produced by direct laser writing usingvarious shaped beams and intensity distributions along commonly used contours. The examinationis done both theoretically and experimentally. The shapes obtained by theoretical calculations arecompared with those obtained experimentally. The intensity distribution of irradiated beams andthe kind of shaped beam which is effective in making combinations of various contours are veri-fied in detail. Using the theoretical and experimental results, various high aspect ratio micro-moldsand polymer structures with reasonably high accuracy are made.
2.2 Manufacturing method
In this study, the manufacture of polymer structures or models is done by direct writing on thesurface of the polymer which is then developed with a highly selective developer. Fig. 2-1 (a) showsa schematic diagram of the manufacturing method to produce micromechanical parts such as agear by direct laser writing on the surface of a liquid polymer along the gear contour. During thisprocess, a gear is obtained as shown in (b) by writing on the inner side of the contour. When writ-ing on the outer side, a mold is obtained as shown in (c). Further mold filling processes produceproducts from metals, plastics, and ceramics. The most common of these processes is electroform-ing, in which nickel or copper material is deposited into a polymer mold.
The dimensional accuracy of the product is determined by the precision of the lateral dimen-sions and the verticality of the sidewalls along the thickness. The width of the solidified polymeralong the thickness is affected by the shape and intensity distribution of the irradiated beam aswell as diffraction and absorption of light within the polymer28). This paper examines the shape ofthe solidified polymer when writing with different beam shapes and intensity distributions alongcommonly used contours. The verticality of the sidewalls is examined considering the theories ofdiffraction and absorption of light.

50 Katsumi Yamaguchi and Takeshi Nakamoto
2.3 Analysis of the shape of the solidified polymer
2.3.1 Simulation
The verticality of the sidewalls is examined considering the theories of diffraction and ab-sorption of light. Beams of uniform intensity having a square and a circular cross section (calledsquare and circular beams, respectively, hereinafter) and a gaussian beam are used. Consider asquare or circular beam, the light intensity after diffraction through a aperture and absorption in aphotopolymer I at (x,y,z), can be expressed as equation (1-12). For a beam with a gaussian inten-sity distribution, the light intensity of the beam after absorption in a polymer is expressed as fol-lows.
Here ro is a gaussian radius and Io is the mean intensity within radius ro.When writing along a straight line (x-axis) at a constant speed, v, the irradiated energy per
unit area, E, at (x,y,z) can be expressed as follows.
When the irradiated energy E(x,y,z) attains the threshold value Eo, the polymer is assumedto solidify. Therefore, the line (y,z) satisfying equation (2-3) becomes the outline of the solidifiedpolymer.
The outline of the solidified polymer is obtained by substituting equations (1-12) or (2-1) into (2-3).
Fig. 2-2, 2-3 and 2-4 give simulations of the shape of the solidified polymer when using a
I (r , z) = 2 Io ⋅ exp –2 r 2
ro2
⋅ exp (– α ⋅ z) (2-1)
(a) Direct laser writing (b) Polymer structure (c) Mold
Fig. 2-1 Schematic diagram of the manufacturing method
E (x , y , z) = I (x-v t , y , z) dt– ∞
+ ∞
(2-2)
I (x-v t , y , z) dt– ∞
+ ∞
= Eo (2-3)

51Micro Fabrication by UV Laser Photopolymerization
square, circular, and gaussian beam, respectively. When the laser beam is statically irradiated for10 seconds, the shape of the solidified polymer becomes that shown in Fig.2-2 (a), 2-3 (a) and 2-4(a). The beam is irradiated from the bottom side, so the solidified polymer is shown upside down.
When writing along a straight line, the shape of the solidified polymer become that shown inFig.2-2 (b), 2-3 (b), and 2-4 (b). Cross sectional views of the solidified polymer are shown in Fig.2-2 (c), 2-3 (c) and 2-4 (c). The writing speeds 25, 50 and 100 µm/sec are used for the cross sections
(a) Stationary irradiation [t = 10 sec]
(b) Writing along a straight line [v = 50 µm/sec]
(c) Cross sectional view
Fig. 2-3 Simulation of the shape of the solidifiedpolymer when using a circular beam[Io = 1 mW/mm2, rc = 250 µm, h = 10 µm]
(a) Stationary irradiation [t = 10 sec]
(b) Writing along a straight line [v = 50 µm/sec]
(c) Cross sectional view
Fig. 2-2 Simulation of the shape of the solidifiedpolymer when using a square beam[Io = 1 mW/mm2, a = 500 µm, h = 10 µm]

52 Katsumi Yamaguchi and Takeshi Nakamoto
shown. Here the irradiation is from the top side. When the writing speed is changed, the width ofthe solidified polymer irradiated by a square and circular beam does not change significantly whilethat irradiated by a gaussian beam does. When the writing speed varies from 25 to 100 µm/sec, thedifference in the width measured at the surface is 3 µm and 7 µm for square and circular beam,respectively. The difference becomes 130 µm when a gaussian beam is used. When making highaspect ratio products, a constant width of the solidified polymer along the depth is desirable. Whenwriting at a speed of 25 µm/sec, the difference in the width of the solidified polymer measured atthe surface and at a depth of 200 µm is 4 µm and 6 µm for a square and circular beam, respectively.
(a) Stationary irradiation [t = 10 sec]
(b) Writing along a straight line [v = 50 µm/sec]
(c) Cross sectional view
Fig. 2-4 Simulation of the shape of the solidified polymer whenusing a gaussian beam [Io = 1 mW/mm2, ro = 250 µm]

53Micro Fabrication by UV Laser Photopolymerization
The difference, however, becomes 130 µm when a gaussian beam is used. The above analysis indi-cates that the solidified width with better tolerance can be obtained using a square or circular beam.
2.3.2 Comparison with experimental data
This section describes the experimental parameters and data obtained by examining the crosssections of the solidified polymer, and a comparison is made between the simulated values andexperimental data.
The light source used in this experiment is a He-Cd laser (wavelength 325 nm). The laserbeam is directed towards the polymer and passes through a beam expander as shown in Fig. 2-5.This produces a broad beam which facilitates the use of the central flat portion of the gaussianintensity distribution. This beam then passes through a square or circular aperture and is irradiatedonto the surface of the polymer set horizontally on an X-Y table. Direct writing is then done bymoving the X-Y table controlled by a computer.
Comparison of the theoretical and experimental data can be done at various intervals betweenthe mask and polymer surface. The smaller the interval h, the smaller the difference in width of thesolidified polymer. For h = 10 µm, the theoretical calculation shows a difference of several mi-crometers. As a tolerance of several micrometers is difficult to measure, a larger, more easily mea-surable difference facilitates comparison of the theoretical and experimental values. The intervalbetween the mask and polymer surface is thus kept at several thousand micrometers.
Fig. 2-6 shows plots of optical measurements taken from cross sections of solidified polymercompared with the calculated outlines. The sidewalls of the theoretically calculated outlines matchclosely those of the experimental plots. The theoretically calculated outline for a square beam showsa sharp edge at the corner on the bottom of the solidified polymer. The experimental plot, however,does not have a sharp edge. This is attributed to the developer, which dissolves the bottom edgeeasily.
2.4 Profile simulation and experimental results
The shapes of the solidified polymer produced using beams with gaussian and uniform inten-sity distributions are examined along rectangular and circular profiles.
2.4.1 Rectangular profiles
In order to obtain a solidified polymer of a rectangular profile, the X-Y table moves along astraight line, stops for a time, ts, and then moves perpendicularly in a straight line. This sectionexamines the shape of the solidified polymer that can be obtained in this manner.
Fig. 2-5 Schematic layout of the experimental setup

54 Katsumi Yamaguchi and Takeshi Nakamoto
The shapes of the solidified polymer at the straight line and corner portions are not the same,due to a longer irradiation time in the inner portion of the corner even when the stationary timeapproaches zero. This stationary time is unavoidable in using any apparatus, thus making it neces-sary to consider the stationary time in determining the shape of the solidified polymer. The cornershape of the solidified polymer becomes the profile (x,y,z) satisfying equation (2-4).
Where I is the intensity of the light at depth z as described in equation (1-12) or (2-1).Fig. 2-7 (a), (b) and (c) show the theoretically calculated profiles of the solidified polymer
when the stationary time, ts, is 0, 2.17 and 30 seconds, respectively. The stationary time of theapparatus used in this experiment is 2.17 seconds.
Fig. 2-8, 2-9 and 2-10 indicate the shape of the solidified polymer made using a square, circu-lar and gaussian beams, respectively. (a) and (b) show the simulation plot and scanning electronmicro graph of the experimentally obtained solidified polymer, respectively. The shapes are ob-tained when the stationary time is 2.17 seconds. The shapes of the simulated profiles closely re-semble those obtained experimentally. There is a difference in depth between the inner and outersides of the solidified polymer due to a longer irradiation time on the inner side. When writingwith a square or circular beam, the width of the solidified polymer in the corner increases slightlywhile the increment when using a gaussian beam is significant. Fig. 2-11 shows the shape of thesolidified polymer when writing at a high speed and long stationary time. In this case, the differ-ence in the width of the solidified polymer between the straight line portion and the corner portionbecomes large. When writing with a square or a circular beam, the difference is about 10%. Whenwriting with a gaussian beam, however, the width in the corner is twice that of the straight lineportion.
The above analysis of the simulation and experimental profiles reveal that a determined so-lidified polymer with a closer tolerance can be obtained using a beam of uniform intensity.
2.4.2 Circular profiles
When the radius of the arc is R and the writing speed is v, the shape of the solidified polymerbecomes the (x,y,z) profile satisfying equation (2-5).
Fig. 2-12, 2-13 and 2-14 show the shapes of the calculated profiles obtained from equation (2-5) and the corresponding scanning electron micro graphs of the solidified polymer. When using asquare beam, the width of the solidified polymer varies along the arc as shown in Fig. 2-12. Thedifference in the width of the maximum and minimum is 200 µm. The width however, becomesconstant when using a circular beam as shown in Fig. 2-13. The above analysis demonstrates that acircular beam is effective in producing patterns with circular profiles.
2.5 Products in shaped beam writing
In order to obtain high aspect ratio products, the stacking method described in Sec.1.7 isadopted. Fig. 2-15 shows the scanning micro graph of high aspect ratio structures produced by thestacking method. (a) shows the scanning micrograph of a high aspect ratio letter pattern and struc-ture. (b) was done in order to obtain various thickness and thus produce multidimensional struc-
[I (x-v t , y , z) + I (x , y -v t , z)] dt + I (x , y , z) ts = Eo0
+ ∞
(2-4)
Rv I (x – R ⋅ cos u , y – R ⋅ sin u , z) du = Eo
– π
+ π
(2-5)

55Micro Fabrication by UV Laser Photopolymerization
(a) ts = 0 sec
(b) ts = 2.17 sec
(c) ts = 30 sec
Fig. 2-7 Simulations of the shape of the solidifiedpolymer when writing using a squarebeam along a rectangular profile [Io = 0.53mW/mm2, a = 500 µm, h = 2000 µm, v =80 µm/sec]
(a) A square beam [Io = 0.53 mW/mm2, a = 500µm, h = 4000 µm, v = 40 µm/sec]
Fig. 2-6 Measurements from cross sections of thesolidified polymer and their simulatedoutlines
(b) A circular beam [Io = 0.45 mW/mm2, rc = 250µm, h = 2000 µm, v = 10 µm/sec]
(c) A gaussian beam [Io = 16.0 mW/mm2, ro = 260µm, v = 480 µm/sec]

56 Katsumi Yamaguchi and Takeshi Nakamoto
(a) Simulated profile (b) Experimental profile
Fig. 2-8 The shape of the solidified polymer when writing using a square beam along arectangular profile [Io = 0.53 mW/mm2, a = 500 µm, h = 2000 µm, v = 80 µm/sec,ts = 2.17 sec]
(a) Simulated profile (b) Experimental profile
Fig. 2-9 The shape of the solidified polymer when writing using a circular beam along arectangular profile [Io = 0.53 mW/mm2, rc = 250 µm, h = 2000 µm, v = 80 µm/sec,ts = 2.17 sec]
(a) Simulated profile (b) Experimental profile
Fig. 2-10 The shape of the solidified polymer when writing using a gaussian beam along arectangular profile [I o = 15.1 mW/mm2, r o = 260 µm, v = 5000 µm/sec,ts = 2.17 sec]

57Micro Fabrication by UV Laser Photopolymerization
(a) A square beam [a = 500 µm, h = 2000 µm]
(b) A circular beam [rc = 250 µm , h = 2000 µm]
(c) A gaussian beam [ro = 250 µm]
Fig. 2-11 Simulation of the solidified polymer when using a high writing speed andlong stationary time [Io = 1 mW/mm2, v = 250 µm/sec, ts = 30 sec]
tures.Fig. 2-16 (a) shows direct writing on the surface of the polymer along the contour of a gear.
(b) shows when writing on the inner side which is filled with liquid polymer. In this case, a gearstructure is produced. (c) shows when writing on the outer side in which a mold is obtained.

58 Katsumi Yamaguchi and Takeshi Nakamoto
(a) Simulated profile (b) Experimental profile
Fig. 2-12 The shape of the solidified polymer when writing using a square beam along a circular profile[Io = 0.53 mW/mm2, a = 500 µm, h = 2000 µm, R = 1000 µm, v = 80 µm/sec]
(a) Simulated profile (b) Experimental profile
Fig. 2-13 The shape of the solidified polymer when writing using a circular beam along a circular profile[Io = 0.53 mW/mm2, rc = 250 µm, h = 2000 µm, R = 1000 µm, v = 80 µm/sec]
(a) Simulated profile (b) Experimental profile
Fig. 2-14 The shape of the solidified polymer when writing using a gaussian beam along a circular profile[Io = 0.15 mW/mm2, ro = 260 µm, R = 1000 µm, v = 80 µm/sec]

59Micro Fabrication by UV Laser Photopolymerization
(a) High aspect ratio structures
(b) High aspect ratio structures of various thickness
Fig. 2-15 Scanning micrograph of polymer structures produced by direct circular beam writing
2.6 Conclusions
The effect of writing with various shaped beams, intensity distributions, speeds and contourson the shape of the solidified polymer along the thickness when using direct writing method areexamined. Based on the theoretical analysis and experimental results, the following conclusionsare drawn.(1) A solidified polymer with a close tolerance can be obtained using a beam with a uniform in-
tensity.(2) A circular beam is suitable in producing a pattern with combinations of various profiles.(3) Direct laser writing can be used to produce thick, high aspect ratio microstructures by the
stacking of thin polymer layers produced by overwriting.
3. Direct Focused Beam Writing Method for Producing High Aspect Ratio Micro Part
3.1 Introduction
This section examines the optimum conditions to produce high aspect ratio micro polymerstructures using a direct focused UV laser beam writing on the surface of a liquid photopolymer.Various studies related to three dimensional microfabrication on polymer layers using directwriting and scanning methods have investigated the equipment and processing steps in more

60 Katsumi Yamaguchi and Takeshi Nakamoto
(a) Direct beam writing
(b) Polymer structure
(c) Mold
Fig. 2-16 Gear structure and mold
detail24-27,30,31,35-37). Here the effect of physical parameters such as wavelength of laser beam, focallength of lens, absorption coefficient and writing speed on the shapes of the solidified polymer areexamined theoretically. Then the results are verified experimentally. Using the theoretical and ex-perimental results, various micropolymer structures are made with reasonably high accuracy.
3.2 Manufacturing method
The manufacture of polymer structures or molds is done by direct writing using focused UVlaser beam on the surface of a liquid polymer which then becomes solid. Fig. 3-1 (a) shows a

61Micro Fabrication by UV Laser Photopolymerization
schematic diagram of the manufacturing method used to produce micro parts with high aspect ra-tio. Direct laser writing along the contour produces a micro gear as shown in (b). When writing onthe outer side of the contour, a mold is obtained as shown in (c). Further mold filling processesyield products of metals, plastics, and ceramics. The most common process is electroforming, inwhich nickel or copper material is deposited into a polymer mold.
The dimensional accuracy of the product is determined by the precision of the lateral andvertical dimensions along the thickness. The width of the solidified polymer along the thickness isaffected by the shape and intensity distribution of the irradiated beam, diffraction and absorptionof light within the polymer24,28-31). In order to produce micro polymer structures with high aspectratio, a constant width of the solidified polymer along the depth is essential. When a beam is irra-diated onto the polymer, however, the solidified width changes along the depth. Therefore it isnecessary to study the solidified shape and to examine the optimum conditions to obtain a shapewith a high aspect ratio.
3.3 Basic equations to shape the solidified polymer
Fig. 3-2 shows the theoretical model used to simulate the shape of the solidified polymer.Here the focal point is set at the surface of the polymer and the depth is along z. When a broadGaussian beam with total power P, wavelength λ and radius R is irradiated passing through a lenswith a focal length f, the beam intensity, Ig at (x,y,z), can be expressed as follows.
Here, the beam radius ro (so-called 1/e2 Gaussian half-width) varies as follows.
(a) Direct focused beam writing (b) Polymer structure (c) Mold
Fig. 3-1 Schematic diagram of the manufacturing method
Ig(x , y , z) = 2Pπ ro
2⋅ exp –
2(x 2 + y 2)
ro2 (3-1)
ro(z) = romin1 + λz
π romin2
2
(3-2)
romin= f λ
πR(3-3)

62 Katsumi Yamaguchi and Takeshi Nakamoto
The intensity of the focused beam decreases exponentially with the beam’s absorption intothe polymer. Let the absorption coefficient be α. The light intensity at depth z, denoted by I, isexpressed as follows.
Next, the cross-sectional outline of the solidified polymer is calculated when the beam ismoved along a straight line. The cross-sectional outline of the solidified polymer does not varyfrom point to point except for the initial point of the straight line if the writing speed is kept con-stant. Therefore, the cross-sectional outline of the solidified polymer is calculated when the beamis moved along the x-axis from x = – ∞ to x = + ∞ at a constant speed v as shown in Fig. 3-2. Thetotal irradiated energy from the beam per unit area, E, at (x,y,z) can be expressed as follows.
Here, t is the writing time. When the irradiated energy E (x,y,z) attains the threshold value Eo, thepolymer is assumed to solidify. By letting E (x,y,z) = Eo and calculating equation (3-5), the cross-sectional outline (y,z) of the solidified polymer is expressed as equation (3-6).
The α and Eo values of the polymer are determined experimentally. The values of the photopoly-mer used in this study are α = 6.94 × 10⁻³ (1/µm) and Eo = 0.34 mJ/mm2 as described in Sec. 1.3.
Fig. 3-2 Theoretical model
I (x , y , z) = Ig (x , y , z) ⋅ exp (– α z) (3-4)
E (x , y , z) = I (x-v t , y , z) dt– ∞
+ ∞
(3-5)
y =ro
2loge
2π
PEo ⋅ ro ⋅ v
– α z (3-6)

63Micro Fabrication by UV Laser Photopolymerization
3.4 Optimum conditions to obtain high aspect ratio structures
This section examines the optimum conditions to obtain high aspect ratio micro polymer struc-tures.
3.4.1 Physical parameters
The purpose of the theoretical analysis in this section is to examine the optimum conditionsfor producing high aspect ratio micro parts from equation (3-6). The outline (y,z) can be examinedby considering the variables P, λ, R, f, v, Eo and α. Here, equations (3-2), (3-3) and (3-6) can beexpressed as follows.
The outline (y/R,z/R) of the solidified polymer is determined by λ/R, f/R, αR and P/(Eo R v) cor-responding to wavelength, lens, absorption and irradiation, respectively. Therefore the effects of λ,f/R and α when changing v, are examined.
3.4.2 Effect of beam wavelength λ
Fig. 3-3 (a), (b) and (c) show cross-sectional outlines of the solidified polymer when the wavelength λ of the beam is 0.175 µm, 0.325 µm and 1.06 µm for the Ar-Cl laser, He-Cd laser (presentexperimental apparatus) and YAG laser, respectively. In these figures, the solid lines indicate thecross-sectional outlines and the broken lines the beam radius. When the writing speed is increased,the solidified depth and lateral width become smaller. When the wavelength is smaller, the solidi-fied lateral width becomes smaller.
Next, the conditions for obtaining a high aspect ratio solidified shape are examined. In thissection, only the wavelength λ is variable and other parameters such as f/R and α are constant. Fig.3-4 shows the cross-sectional outlines of the solidified polymer when the ratio 2y(min)/2y(max) ismaximum. Here, 2y(min) is the minimum solidified lateral width and 2y(max) is the maximumwidth for a depth of L = 50 µm. When the wavelength is 0.175 µm, the 2y(max) is 2.3 µm and theratio 2y(min)/2y(max) is 0.826 as shown in Fig. 3-4 (a). When the wavelength is 1.06 µm, the ratio2y(min)/2y(max) becomes 0.988; however, 2y(max) is 17.6 µm as shown in Fig. 3-4 (c). The so-lidified depth is more than 300 µm. Therefore the conditions shown in Fig. 3-4 (c) are not theoptimum values to obtain high aspect ratio for a depth of 50 µm.
Fig. 3-5 (a) shows the relationship between 2y(max) and the wavelength. As can be seen fromthe figure, as the wavelength increases, 2y(max) increases. Fig. 3-5 (b) shows the relationship be-tween the ratio 2y(min)/2y(max) and the wavelength. As the wavelength increases, the differencebetween 2y(min) and 2y(max) becomes minimum (2y(min)/2y(max) → 1).
Here the aspect ratio of the solidified polymer is defined by the Ratio as follows.
For a smaller and constant solidified width, the Ratio for constant depth, L, becomes larger. TheRatio is used to find the optimum conditions. Fig. 3-6 shows the relationship between the Ratio
yR
=ro/R
2loge
2π
PEo ⋅ R ⋅ v
⋅ 1r o /R
– αR zR
(3-7)
ro(z)
R= 1
π 2⋅
f
R
2
⋅ λR
2
+z /Rf /R
2
(3-8)
Ratio = L2y (max )
⋅ 2y (min)2y (max )
(3-9)

64 Katsumi Yamaguchi and Takeshi Nakamoto
(a) λ = 0.175 µm
Fig. 3-3 Cross-sectional outlines of the solidifiedpolymer for different wavelengths [P =0.1 µW, f/R = 20, α = 6.94 × 10⁻³ (1/µm),Eo = 0.34 mJ/mm2]
(b) λ = 0.325 µm
(c) λ = 1.06 µm
[v = 47 µm/s, 2y(max) = 2.3 µm, 2y(min)/2y(max)= 0.826]
(a) λ = 0.175 µm
Fig. 3-4 Cross-sectional outlines of the solidifiedpolymer when 2y(min)/2y(max) is maxi-mum [P = 0.1 µW, f/R = 20, α = 6.94 ×10⁻³ (1/µm), Eo = 0.34 mJ/mm2, L = 50µm]
[v = 30 µm/s, 2y(max) = 3.5 µm, 2y(min)/2y(max)= 0.965]
(b) λ = 0.325 µm
[v = 1 µm/s, 2y(max) = 17.6 µm, 2y(min)/2y(max)= 0.988]
(c) λ = 1.06 µm

65Micro Fabrication by UV Laser Photopolymerization
and the wavelength. As can be seen in this figure, the Ratio has the maximum value when thewavelength is 0.15 µm. Fig. 3-5 and 3-6 are examples of the optimum conditions obtained fromthe calculation when L is 50 µm. For other value of the L, the optimum conditions can be calcu-lated in the same way.
3.4.3 Effect of aperture R and focal length f of lens
Fig. 3-7 shows the cross-sectional outlines of the solidified polymer when f/R is changed andother parameters are constant. When f/R is small, the minimum radius romin
is small and the beamdivergence becomes greater.
The conditions to obtain a high aspect ratio solidified shape are examined in the same way as
Fig. 3-6 Relationship between the Ratio and the wavelength [P = 0.1 µW,f/R = 20, α = 6.94 × 10⁻³ (1/µm), Eo = 0.34 mJ/mm2, L = 50 µm]
(a) 2y(max) (b) 2y(min)/2y(max)
Fig. 3-5 Relationship between 2y(max), 2y(min)/2y(max) and the wavelength [P = 0.1 µW, f/R = 20, α = 6.94× 10⁻³ (1/µm), Eo = 0.34 mJ/mm2, L = 50 µm]

66 Katsumi Yamaguchi and Takeshi Nakamoto
in the previous section. Fig. 3-8 (a) shows the relationship between 2y(max) and f/R when the ratio2y(min)/2y(max) is maximum at a depth of L = 50 µm. When f/R is 16, the minimum value of2y(max) is 3.2 µm. Fig. 3-8 (b) shows the relationship between 2y(min)/2y(max) and f/R. As theratio of f/R increases, the difference between 2y(min) and 2y(max) becomes minimum (2y(min)/2y(max) → 1). Fig. 3-9 shows the relationship between the Ratio defined in equation (3-9) and f/R.As can be seen in this figure, the Ratio has a maximum value when f/R is 18.
(a) f/R = 10 (b) f/R = 40
Fig. 3-7 Cross-sectional outlines of the solidified polymer for different ratios of f/R [P = 0.1 µW, λ = 0.325µm, α = 6.94 × 10⁻³ (1/µm), Eo = 0.34 mJ/mm2]
(a) 2y(max) (b) 2y(min)/2y(max)
Fig. 3-8 Relationship between 2y(max), 2y(min)/2y(max) and the ratio of f/R [P = 0.1 µW, λ = 0.325 µm, α =6.94 × 10⁻³ (1/µm), Eo = 0.34 mJ/mm2, L = 50 µm]

67Micro Fabrication by UV Laser Photopolymerization
3.4.4 Effect of absorption coefficient αFig. 3-10 shows the cross-sectional outlines of the solidified polymer when the value of α is
changed and other parameters are constant. The conditions to obtain a high aspect ratio solidifiedshape are examined in the same way as in the previous section. Fig. 3-11 (a) shows the relationshipbetween 2y(max) and α when using a condition in which the ratio 2y(min)/2y(max) becomes maxi-mum for a depth of L = 50 µm. As the value of α increases, the 2y(max) increases. Fig. 3-11 (b)shows the relationship between the ratio 2y(min)/2y(max) and α. The ratio 2y(min)/2y(max) is al-most constant. Fig. 3-12 shows the relationship between the Ratio defined in equation (3-9) and α.As can be seen in this figure, the Ratio becomes maximum when α is zero.
Fig. 3-9 Relationship between the Ratio and the ratio of f/R [P = 0.1 µW,λ = 0.325 µm, α = 6.94 × 10⁻³ (1/µm), Eo = 0.34 mJ/mm2, L = 50 µm]
(a) α = 6.94 × 10⁻³ (1/µm) (b) α = 27.76 × 10⁻³ (1/µm)
Fig. 3-10 Cross-sectional outlines of the solidified polymer for different values of α [P = 0.1 µW, λ = 0.325µm, f/R = 20, Eo = 0.34 mJ/mm2]

68 Katsumi Yamaguchi and Takeshi Nakamoto
3.4.5 Effect of defocusing
The above analysis is done when the focal point is set at the surface of the polymer. Next,optimum conditions are examined when the focal point is not set at the surface of the polymer. Inthis analysis, the wavelength of a beam λ and the absorption coefficient α are given, and the ratioof f/R is determined at first.
The beam radius ro changes according to equations (3-2), (3-3). When z is far greater thanλf 2/R2, ro varies as follows.
Fig. 3-12 Relationship between the Ratio and the value of α [P = 0.1 µW, λ= 0.325 µm, f/R = 20, Eo = 0.34 mJ/mm2, L = 50 µm]
(a) 2y(max) (b) 2y(min)/2y(max)
Fig. 3-11 Relationship between 2y(max), 2y(min)/2y(max) and the value of α [P = 0.1 µW, λ = 0.325 µm, f/R= 20, Eo = 0.34 mJ/mm2, L = 50 µm]
ro(z) = Rf z (3-10)

69Micro Fabrication by UV Laser Photopolymerization
When the focal point is not set at the surface of the polymer, the beam radius ro is expressedas follows.
Here, rs is the beam radius at the surface of the polymer. When the sign in equation (3-11) is plus,the beam radius increases along the depth direction and when the sign is minus, the beam radiusdecreases. Here, the plus and minus signs are related to the position of the focal point when it isabove and below the surface of the polymer, respectively. In this section, the calculation to obtainoptimum conditions for a high aspect ratio solidified shape is approximated by equation (3-11).
The following conditions are considered to obtain the perpendicular cross-sectional outline ofthe solidified polymer at the surface of the polymer. These conditions can be realized only whenthe focal point is not set at the surface of the polymer.
Substituting equation (3-11) into equation (3-6) and differentiating as in equation (3-12) givesthe following.
From equation (3-13), the beam radius has a minimum value when the focal point is belowthe surface of the polymer. From equation (3-3), (3-11) and (3-13), the relationship between theratio of f/R, the minimum beam radius romin
and the beam radius at the surface rs is expressed asfollows.
When the focal point is set below the surface of the polymer, the beam radius ro is expressedexactly as follows.
Here, zo is the depth of the focal point from the polymer surface. Setting ro = rs when z = 0, zo isobtained from equation (3-16) as follows.
ro(z) = rs ± Rf z (3-11)
[y ]z = 0 > 0,dy
dz z = 0
= 0,d 2y
dz 2z = 0
= 0 (3-12)
ro (z) = rs – 32
α ⋅ rs ⋅ z (3-13)
rs = 2R3α ⋅ f
= 2λ3π ⋅ α ⋅ romin
(3-15)
ro(z) = romin 1 +λ (z – zo)
π romin2
2
(3-16)
zo =π ⋅ romin
λ rs2 – romin
2 (3-17)
loge2π
PEo ⋅ rs ⋅ v
= 16
(3-14)

70 Katsumi Yamaguchi and Takeshi Nakamoto
When the solidified shape is obtained according to this condition, at first the f/R is determinedand the minimum beam radius romin
is calculated using equation (3-3). Next, rs and zo are calcu-lated using equations (3-15) and (3-17). At last the value P/v is calculated using equation (3-14).One value of either P or v can be chosen arbitrarily. Fig. 3-13 (a) shows an example of the cross-sectional outline of the solidified polymer under these conditions. Fig. 3-13 (b) shows the cross-sectional outline of the solidified polymer when the focal point is set at the surface of the polymer.The outline obtained in (a) shows a smaller solidified width and a higher aspect ratio compared tothat shown in (b).
3.5 Comparison with experimental data
This section describes the experimental parameters and data obtained by examining the crosssections of the solidified polymer, and a comparison is made between the simulated values andexperimental data.
The light source used in this experiment is a He-Cd laser (wavelength λ = 0.325 µm). Thelaser beam passes through a beam expander as shown in Fig. 3-14. The radius of the beam before
Fig. 3-14 Experimental setup
(a) When defocusing [zo = 87 µm, v = 41 µm/sec] (b) When the focal point is set at the polymer sur-face [zo = 0 µm, v = 30 µm/sec]
Fig. 3-13 Cross-sectional outlines of the solidified polymer [P = 0.1 µW, λ = 0.325 µm, f/R = 20, α = 6.94 ×10⁻³ (1/µm), Eo = 0.34 mJ/mm2]

71Micro Fabrication by UV Laser Photopolymerization
entering the lens, R, is about 3.6 mm. This broad beam is then focused by a lens and is irradiatedonto the surface of the polymer set horizontally on an X-Y table. In this experiment, the focalpoint is set at the surface of the polymer and direct writing is done by moving the X-Y table con-trolled by a computer. The photopolymer used in this experiment is a product of Asahi ChemicalCo., Ltd.
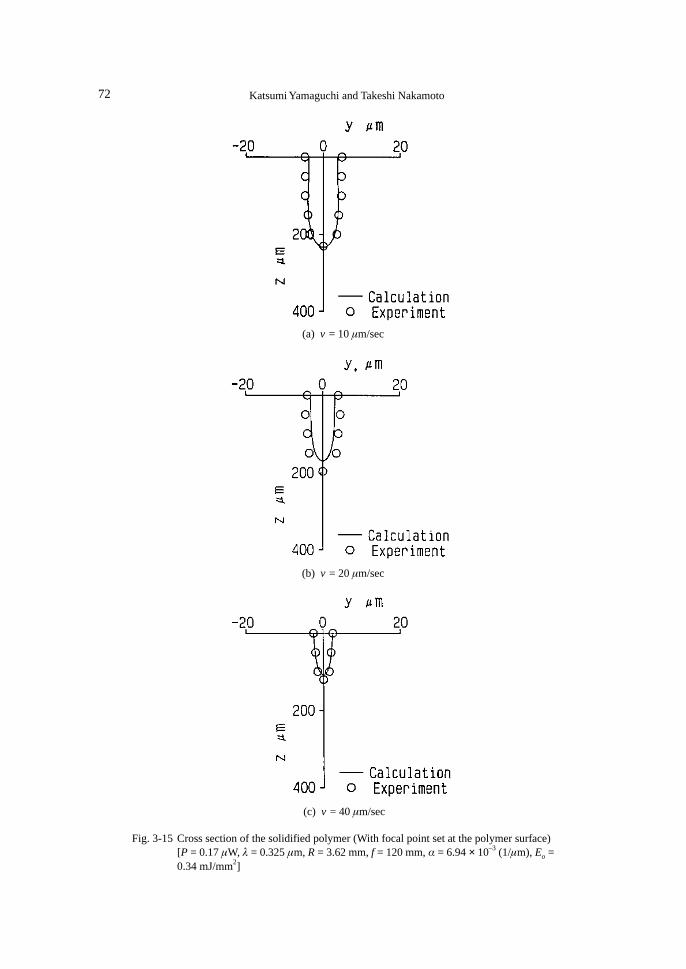
Fig. 3-15 (a), (b) and (c) show plots of measurements of cross sections of the solidified poly-mer compared with the calculated outlines. The theoretically calculated outlines match closely thoseof the experimental plots. In figure (a), the solidified width is 10 µm. The accuracy of the solidi-fied width measured at the surface and at a depth of 100 µm is 0.5µm. The accuracy of the solidi-fied width measured at the surface and at a depth of 200 µm is 2 µm. The aspect ratios whenobtaining an accuracy of 0.5 µm and 2 µm are 10 and 20, respectively.
3.6 Examples of high aspect ratio products
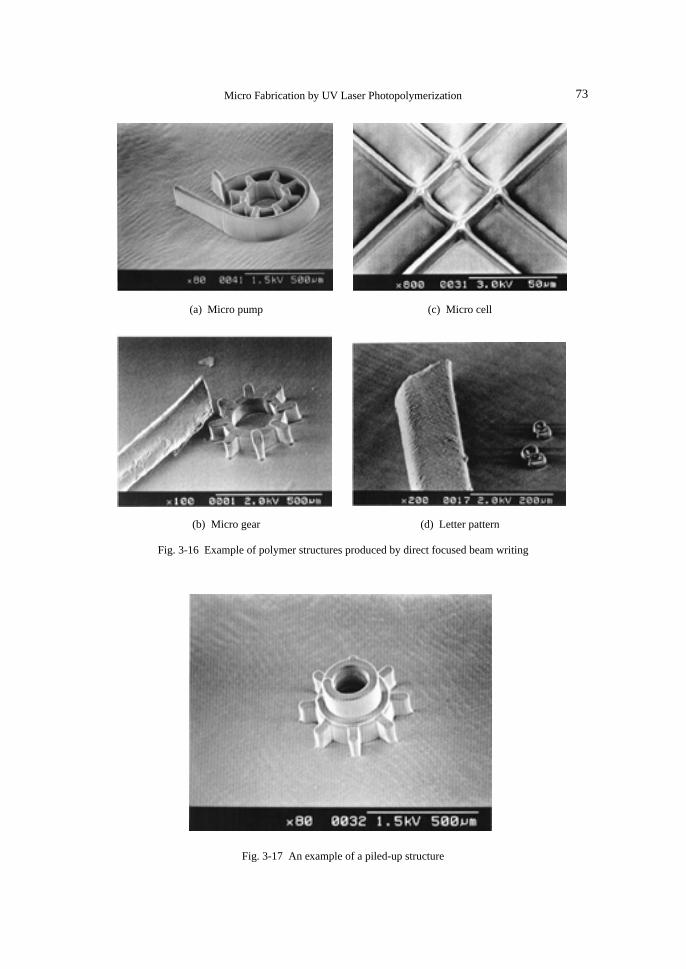
Using the above results, the high aspect ratio solidified shapes can be produced as shown inFig. 3-16. (a) shows a polymer structure of a micro pump. (b) shows a micro gear and a humanhair is set alongside by way of comparison. (c) shows a cell vessel used for use in biotechnologyand (d) a letter pattern. Fig. 3-17 gives an example of a piled-up structures.
3.7 Conclusions
(1) The effects of wavelength of beam, focal length of lens, absorption coefficient of the polymerand writing speed are examined when using direct focused beam writing. The optimum condi-tions to obtain a high aspect ratio polymer shapes are examined.
(2) Using the above conditions, high aspect ratio micro mechanical structures are produced.
4. Manufacturing of Three-Dimensional Structures
4.1 Introduction
This section deals with the manufacturing of three-dimensional micro polymer structures. Atfirst, the optimum conditions to produce the stacked three-dimensional structures are verified. Next,by using these conditions, stacked three-dimensional structures are produced.
4.2 Manufacturing method
Fig. 4-1 shows a schematic diagram of the manufacturing method to produce three-dimen-sional micro-polymer structures by stacking the polymer layers on top of one another.
4.3 Conditions for producing three-dimensional microstructures
When stacked three-dimensional microstructures are produced, a large value of the solidifieddepth becomes the error in the vertical direction. And the solidified depth is chosen near the valueof the solidified width for the direct writing method. On this condition, a small depth of the solidi-fied polymer is essential, and the solidified depth is smaller than the depth of focus of the beam.Therefore the beam can be approximated using the parallel beam with the radius romin
. From equa-tion (3-6), the maximum solidified depth, Lmax, and the solidified width, w, at the surface of thephotopolymer are expressed as follows.
Lmax = 1α loge
2π ⋅ pn (4-1)
72 Katsumi Yamaguchi and Takeshi Nakamoto
(a) v = 10 µm/sec
(b) v = 20 µm/sec
(c) v = 40 µm/sec
Fig. 3-15 Cross section of the solidified polymer (With focal point set at the polymer surface)[P = 0.17 µW, λ = 0.325 µm, R = 3.62 mm, f = 120 mm, α = 6.94 × 10⁻³ (1/µm), Eo =0.34 mJ/mm2]
73Micro Fabrication by UV Laser Photopolymerization
Fig. 3-17 An example of a piled-up structure
(a) Micro pump
(b) Micro gear
(c) Micro cell
(d) Letter pattern
Fig. 3-16 Example of polymer structures produced by direct focused beam writing

74 Katsumi Yamaguchi and Takeshi Nakamoto
Fig. 4-1 Schematic diagram of the manufacturing methodfor a three-dimensional microstructure
Here, pn is a non-dimensional value corresponding to the irradiation of the beam and is expressedas follows.
From equation (4-1), the maximum solidified depth is determined by the value of irradiationpn and the absorption coefficient α. Fig. 4-2 (a) shows the cross-sectional outlines for differentvales of α. When the value of α is small, the maximum solidified depth attains over 100 µm andthe depth is not suitable to produce micro parts. By increasing the value of α, the solidified depthcan be decreased. For example, when α is 4.9 × 10⁻² (1/µm), the solidified depth is almost thesame as the solidified depth. Fig. 4-2 (b) shows the cross-sectional outlines for different values ofpn. By changing the value of pn, the solidified depth can be changed. However, the solidified widthis also changed. From Fig. 4-2 (a) and (b), the solidified depth can be changed by varying thevalue of α or pn. Therefore there are numerous combinations between the α and pn in order toobtain the desired solidified depth.
Next, the optimum combinations between the α and pn are verified. When writing along acontour with corners or stationary points, the value of the irradiation is varied. Therefore, it isnecessary to consider the conditions to obtain the constant solidified depth in this case. From equa-tion (4-1), when the value of pn is changed by ∆pn, the fluctuation of Lmax is expressed as follows.
Fig. 4-3 shows cross-sectional outlines of the solidified polymer for different values of the absorp-tion coefficient α, when ∆pn/pn is ±10%. From Fig. 4-3 and equation (4-4), the larger absorption
∆ Lmax = 1α ⋅
∆ pn
pn(4-4)
pn = PEo ⋅ romin
⋅ v(4-3)
w = 2 rominloge
2π ⋅ pn (4-2)

75Micro Fabrication by UV Laser Photopolymerization
coefficient becomes, the smaller is the fluctuation ∆Lmax. However, the solidified width at the sur-face w becomes large when the absorption coefficient is too large.
The optimum condition can be calculated from equations (4-1)-(4-4) in order to obtain thedesired maximum solidified depth and solidified width with reasonable fluctuation. The procedureis as follows. At first, the maximum solidified depth Lmax and solidified width w are given. Theabsorption coefficient α can be calculated from equation (4-4) by the degree of fluctuation. Nextromin
and pn are calculated from equation (4-1) and (4-2). For example, α = 5 × 10⁻² (1/µm), romin =
20 µm and pn = 9.3 are obtained when the Lmax = 40 µm, w = 40 µm and ∆Lmax = 2 µm (∆pn/pn =±10%).
4.4 Rectangular profile
The effect of the above analysis is shown by the rectangular profile. When writing along arectangular profile, the solidified shape is expressed as follows.
(a) Different values of α [pn = 10] (b) Different values of pn [α = 4.9 × 10⁻² (1/µm)]
Fig. 4-2 Cross-sectional outlines of the solidified polymer [λ = 0.325 µm, f/R = 192, v = 10 µm/sec, Eo = 0.34mJ/mm2]
z = 1α loge
2Pπ ⋅ romin
⋅ Eo ⋅ v
× exp – q2 dq + π20
2xromin ⋅ exp –
2y 2
r omin2
+ exp – q2 dq + π20
2yromin ⋅ exp – 2x 2
r omin2

76 Katsumi Yamaguchi and Takeshi Nakamoto
In equation (4-5), ts is the stationary time at the corner. Fig. 4-4 shows the theoretically calcu-lated profile. When the absorption coefficient is small, the difference in the solidified depth be-tween the straight portion and the corner portion is large. The difference becomes small, and itbecomes easy to obtain the constant value of the solidified depth by choosing the absorption coef-ficient according to the analysis provided in the previous section.
4.5 Comparison with experimental data
The absorption coefficient of the photopolymer used in this experiment is 6.94 × 10⁻³ (1/µm),a value too small to obtain a constant solidified depth. Therefore, by the addition of Rhodamine B(C28H31ClN2O3), the value of the absorption coefficient is increased and the value chosen is4.9 × 10–2 (1/µm) from the analysis of the previous section.
Fig. 4-5 shows the plots of optical measurements of the cross sections of the solidified poly-mer compared with the calculated outlines. The theoretically calculated outlines match those ofthe experimental plots. The difference in the width or depth between the calculation and experi-ment is ±5 µm.
4.6 Stacked structure
Three-dimensional solidified polymer structures are attained by stacking two-dimensionalpolymer structures, and the stacked profile is examined. For example, Fig. 4-6 shows the sche-matic diagram of the cross section of a wall structure with an angle of 60 degrees. The waviness ofthe left side WL and the right side WR are expressed as follows.
In equations (4-6) and (4-7), h is the interval of each stacked polymer layer.Fig. 4-6 (b) is a scanning micrograph of the stacked structure. The micrograph has a profile
similar to that of the calculated profile. When h becomes 10 µm, the wall has the surface wavinessof 1 µm and 7 µm on each side.
From the above results, the accuracy of 5 µm in the width or depth and the waviness of 1 µmin the side wall can be attained. Fig. 4-7 provides examples of three-dimensional micro polymerstructures. (a) shows the micro pipe illustrated as Fig. 4-1; (b) is a micro ball and (c) is a microcup. The crossed ring (d) can be also produced.
WL = h2 ⋅ cos2θ2α ⋅ romin
2 ⋅ sin 3θ(4-6)
+2P ⋅ t s
π ⋅ romin2 ⋅ Eo
⋅ exp –2 (x 2 + y 2)
romin2 (4-5)
WR =ro min
⋅ sin θ2
loge2π
PEo ⋅ ro min
⋅ v
– loge2π
PEo ⋅ ro min
⋅ v– α ⋅ h + h ⋅ cos θ (4-7)

77Micro Fabrication by UV Laser Photopolymerization
(a) α = 6.94 × 10⁻³ (1/µm) [P = 0.114 µW]
Fig. 4-3 Fluctuation of the solidified depth with the fluctuation of irradiation [∆pn/ pn = ±10%,λ = 0.325 µm, f/R = 192, v = 10 µm/sec, Eo = 0.34 mJ/mm2]
(b) α = 4.9 × 10⁻² (1/µm) [P = 0.676 µW]
(c) α = 0.5 (1/µm) [P = 135 W]

78 Katsumi Yamaguchi and Takeshi Nakamoto
4.7 Conclusions
(1) The effects of beam wavelength, focal length of lens, absorption coefficient of the polymerand writing speed on the shape of the solidified polymer are examined when using direct fo-cused beam writing on the surface of a photopolymer.
(2) The optimum conditions to obtain high aspect ratio polymer structures and stacked three-di-mensional structures are verified.
(3) Using the above conditions, microstructures are produced.
Acknowledgement
The present work was supported by a Grant-in-Aid for Scientific Research (B) No. 10555038from the Ministry of Education, Science, Sports and Culture, Japan.
References
1) Mehregany, M., Gabriel, K. J. and Trimmer, W. S. N., Integrated Fabrication of Polysilicon Mecha-nisms, IEEE Trans. Electron Devices, Vol.35, No.6 (1988), pp. 719–723.
2) Fan, L. S., Tai, Y. C. and Muller, R. S., Integrated Movable Micromechanical Structures for Sensors andActuators, IEEE Trans. Electron Devices, Vol.35, No.6 (1988), pp. 724–730.
3) Fan, L. S., Tai, Y. C. and Muller, R. S., IC-Processed Electrostatic Micromotors, Proc. of the 1988 IEEEElectron Devices Meeting, San Francisco, CA, Dec. 11-14 (1988), pp.666–669.
4) Roylence, L. M. and Angell, J. B., A Batch-Fabricated Silicon Accelerometer, IEEE Trans. on ElectronDevices, Vol. ED-26, No. 12 (1979), pp. 1911–1917.
5) Petersen, K. E., Shartel, A. and Raley, N. F., Micromechanical Accelerometer Integrated with MOS De-tection Circuitry, IEEE Trans. on Electron Devices, Vol. ED-29, No. 1 (1982), pp. 23–27.
(a) α = 5 × 10⁻² (1/µm) [P = 0.676 µW] (b) α = 6.94 × 10⁻³ (1/µm) [P = 0.114 µW]
Fig. 4-4 Solidified shape when writing along a rectangular profile [λ = 0.325 µm, f/R = 192, v = 10 µm/sec,ts = 2.17 sec, Eo = 0.34 mJ/mm2]

79Micro Fabrication by UV Laser Photopolymerization
(a) P = 0.74 µW
(b) P = 2.0 µW
(c) P = 3.2 µW
Fig. 4-5 Experimental plots of the cross section of the solidified polymer (With focal point setat polymer surface) [λ = 0.325 µm, f/R = 192, v = 10 µm/sec, α = 4.9 × 10⁻² (1/µm),Eo = 0.34 mJ/mm2]

80 Katsumi Yamaguchi and Takeshi Nakamoto
(a) Calculated profile (b) Micrograph
Fig. 4-6 Stacked profile [P = 2.0 µW, λ = 0.325 µm, f/R = 192, v = 10 µm/sec, α = 4.9 ×10⁻² (1/µm), Eo = 0.34 mJ/mm2, θ = 60 deg., h = 30 µm]
(a) Micro pipe
(b) Micro ball
(c) Micro cup
(d) Micro ring
Fig. 4-7 Example of three-dimensional polymer structures produced by direct focused beam writing

81Micro Fabrication by UV Laser Photopolymerization
6) Ehrfeld, W., The LIGA Processes for Microsystems, Micro System Technologies 90, Proceedings of 1stInternational Conference on Micro Electro, Opto, Mechanic Systems and Components, Berlin, (1990),pp. 521–528.
7) Mohr, J., Burbaum, C., Bley, P., Menz, W. and Wallrabe, U., Movable Microstructures Manufactured bythe LIGA Process as Basic Elements for Microsystems, MicroSystem Technologies 90, Proc of 1st Int.Conf. on Micro Electro, Opto, Mechanic Systems and Components, Berlin (1990), pp. 529–537.
8) Menz, W., Bacher, W., Harmening, M. and Michel, A., The LIGA Technique — a Novel Concept forMicrostructures and the Combination with Si-Technologies by Injection Molding, Proceedings of IEEEMicro Mechanical Systems, Japan, Nara (1991), pp. 69–73.
9) Menz, W., Microactuators in LIGA Technique, Int. Journal of Applied Electromagnetics in Materials,Vol. 2, No. 4 (1992), pp. 281–284.
10) Mohr, J., Anderer, B. and Ehrfeld, W., Fabrication of a Planar Grating Spectrograph by Deep-etch Li-thography with Synchrotron Radiation, Sensors and Actuators, A: Physical, Vol. 27, No. 1–3 (1991), pp.571–575.
11) Maner, A. and Ehrfeld, W., Electroforming Technique in the LIGA Process for the Production ofMicrodevices, Materials and Manufacturing Process, Vol. 4, No. 4 (1989), pp. 527–537.
12) Becker, E. W., Development of the Separation Nozzle Process for Enrichment of Uranium, GermanChemical Engineering, Vol. 9, No. 4 (1986), pp. 204–208.
13) Becker, E. W., Ehrfeld, W., Hagmann, P., Maner, A. and Muenchmeyer, D., Fabrication of Microstruc-tures with High Aspect Ratio and Great Structural Height by Synchrotron Radiation Lithography, Micro-electronic Engineering, Vol. 4, No. 1 (1986), pp. 35–56.
14) Rogner, A., Ehrfeld, W., Muenchmeyer, D., Bley, P., Burbaum, C. and Mohr, J., LIGA Based FlexibleMicrostructures for Fiber-chip Coupling, Journal of Micromechanics and Microengineering, Vol. 1, No.3 (1991), pp. 167–170.
15) Guckel, H., Skrobis, K. J., Christenson, T. R., Klien, J., Han, S., Choi, B., Lovell, E. G. and Chapman, T.W., Fabrication and Testing of the Planar Magnetic Micromotor, Journal of Micromechanics andMicroeng., Vol. 1, No. 3 (1991), pp. 135–138.
16) Burbaum, C., Mohr, J., Bley, P. and Ehrfeld, W., Fabrication of Capacitive Acceleration Sensors by LIGATechnique, Sensors and Actuators, A: Physical, Vol. 27, No. 1-3 (1991), pp. 559–563.
17) Guckel, H., Christenson, T., Skrobis, K., Metal Micromechanisms via Deep X-ray Lithography, Electro-plating and Assembly, Journal of Micromech. Microeng., Vol. 2 (1992), pp. 225–228.
18) Mohr, J., Bley, P., Strohrmann, M., Wallrabe, U., Microactuators Fabricated by the LIGA Process, Jour-nal of Micromech. Microeng., Vol. 2 (1992), pp. 234–241.
19) Lehr, H., Ehrfeld, W., Schmidt, M., Kallenbach, E., Tuan., H., Application of the LIGA Technique forthe Development of Microstructures Based on Electromagnetic Principles, Journal of Micromech.Microeng., Vol. 2 (1992), pp. 229–233.
20) Guckel, H., Christenson, T., Skorbis, K., Denton, D., Choi, B., Lovel, E., Lee, J., Bajikar, S., Chapman,T., Deep X-Ray and UV Lithographies for Micromechanics, Proceedings of the IEEE Solid-State Sensorand Actuator workshop Hilton Head SC (1990), pp. 118–122.
21) Frazier, B., Babb, J. W., Allen, M. G. and Taylor, D. G., Design and Fabrication of ElectroplatedMicromotors Structures, Proc of ASME Winter Annual Meeting, Atlanta, Vol. DSC-32 (1991), pp. 135–146.
22) Frazier, B. A., Allen, M. G., High Aspect Ratio Electroplated Microstructures Using A PhotosensitivePolyimide Process, Proceedings of the IEEE Micro Electro Mechanical Systems, Travemunde, Germany(1992), pp. 87–92.
23) Engelmann, G., Ehrmann, O., Simon, J., Reichl, H., Fabrication of High Depth-to-Width Aspect RatioMicrostructures, Proceedings of the IEEE Micro Electro Mechanical Systems, Travemunde, Germany(1992), pp. 93–98.
24) Jacobs, P. F., Rapid Prototyping & Manufacturing: Fundamentals of Stereolithography, Society of Manu-facturing Engineers in cooperation with the Computer and Automated Systems Association of SME(1992).
25) Miyagi, M., Yamazaki, H., Fujimori, S., Iwasawa, A. and Funakoshi, N., Multispiral Pregrooved DiskFabricated by a Beam Scanning Method, Japanese Journal of Applied Physics, Vol. 29, No. 5 (1990), pp.L794–797.

82 Katsumi Yamaguchi and Takeshi Nakamoto
26) Chitayat, A., Nanometer X-Y Positioning Stages for Scanning and Stepping, Journal of Vacuum Scienceand Technology B, Vol. 7, No. 6 (1989), pp. 1412–1417.
27) Ehrlich, D. J. and Tsao, J. Y., Laser Microfabrication - Thin Film Processes and Lithography, AcademicPress Inc., (1989).
28) Yamaguchi, K., Nakamoto, T., Abraha, P., Mibu, S., 1994, The Accuracy of Micro-molds Produced by aUV Induced Polymerization, Transactions of the ASME Journal of Engineering for Industry, Vol. 116,August (1994), pp. 370–376.
29) Abraha, P., Nakamoto, T., Yamaguchi, K. and Karyawan, The Effect of Physical Parameters on the Fabri-cation of Microstructures by Photo Polymerization, Advancement of Intelligent Production, (1994),pp.564–569.
30) Yamaguchi, K., Nakamoto, T., Abraha, P., Manufacruring of High Aspect Ratio Micro Structures UsingUV Sensitive Photopolymer, JSME International Series C, Vol. 39, No. 2 (1996), pp.387–396.
31) Nakamoto, T., Yamaguchi, K., Abraha, P. and Mishima, K., Manufacturing of Three-dimensional Micro-part by UV Laser Induced Polymerization, Journal of Micromechanics and Microeng., Vol. 6, No. 2(1996), pp. 240–253.
32) Linfoot, E. H., Recent Advances in Optics, Oxford at the Clarendon Press, (1955).33) Sommerfelt, A., Optics, Academic Press Inc., New York (1954).34) Yamada, T., Takato, N. and Kurokawa, T., A New Optical Circuit with a Steric Waveguide Pattern, Japa-
nese Journal of Applied Physics, Vol. 22, No. 10 (1983), pp. L636–638.35) Rubloff, G. W., Maskless Selected Area Processing, Journal of Vacuum Science and Technology B, Vol.
7, No.6 (1989), pp.1454–1461.36) Kobayashi, K., Akiyama, K., Yoshizawa, I., Asakura, T., Laser-beam Scanning System Using an Acous-
tic-optic Deflector: Its Application to Fundus Imaging, Measurement Science and Technology, Vol. 1(1990), pp. 151–157.
37) Hattori, K., Ikenaga, O., Wada, H., Tamamushi, S., Nishimura, E., Ikeda, N., Katoh, Y., Kusakabe, H.,Yoshikawa, R., Takigawa, T., Triangular Shaped Beam Technique in EB Exposure System EX-7 for ULSIPattern Formation, Japanese Journal of Applied Physics, Vol. 28, No. 10 (1989), pp. 2065–2069.