micro-buoys for the characterization of the air-sea … report.pdf · micro-buoys for the...
TRANSCRIPT

Micro-buoys
For the Characterization Of the Air-Sea Interface
SBIR Solicitation topic number N01-033 TITLE: Innovative Sensor Technologies for In-Situ Air and Ocean Sampling
under Extreme Conditions
Principal investigators: Ken Holappa and Bill Venezia
Ocean Sensor Systems, Inc., 3561 NW 97th Terrace
Coral Springs, FL 33065-2811
CONTRACT NUMBER N00014-01-M-0183
Final Report: October 31, 2001 Security Classification: UNCLASSIFIED
Issuing Government Activity: Office of Naval Research
Prepared by Ken Holappa (v) 772 545 7236
(Fax) 954 344-3682 [email protected]

2
Figure 1. Proposed buoy with eddy covariance system for measurements in the oceanic boundary layer. Figure 2. Proposed buoy with eddy covariance system for measurements in the atmospheric boundary layer.
IR Pyranometer
Flag/vane and Comms Antenna
Approximate Water Line Location _________________
CTD
Lift Eye
Sonic Anemometer
Water Level Sensors (4)
Short and Long Wave Pyranometers
GPS Antenna
Hydrophone
Krypton Hygrometer
Approximate Water Line Location _________________
Water Level Sensor (4)
Lift Eye
Flag/vane and Comms Antenna
CTD
Fast Response Conductivity Cell
Void Fraction Meter
GPS Antenna
Thermister Array
Hydrophone
ADV
Ly-Cor Pyranometer

3
Abstract The measurement of the physical properties near the air-sea interface is important for the understanding of the processes controlling our weather and providing a now cast of the surface conditions. The estimation of the heat, salt and momentum flux will be possible with the proposed buoy during periods when the molecular diffusion term dominates during calm conditions and when the turbulent transport term dominates during moderate and extreme conditions. The buoy also contains a motion package for the estimation of the waves, a void fraction meter for the estimation of the bubble density and a hydrophone for ambient acoustic characterization in the OBL. As a platform for these sensors, a small, easy to deploy, inexpensive toroid buoy has been designed with the aid of a nonlinear time domain dynamic simulation. A prototype buoy that weighs less than 30kg was built and tested in the ocean with results closely matching the results of the simulation. A single person manually deployed the buoy. Commercial application for this buoy and sensor package will be primarily in the scientific community. Additionally, the buoy fulfills many of the Navy’s needs for Rapid Environmental Assessment (REA). The simulation, photos and information can be found at http://www.fromairtowater.com.

4
TABLE OF CONTENTS:
Abstract 2
Introduction: 5
The Scientific Basis: 5
Recent Research: 8
Fulfilling the SBIR Objectives: 9
The Sensor Systems: 10
The ABL Sensor System: 10
The OBL Sensor System: 11
The Self-Motion Package: 13
Data Logging and Data Management Systems: 13
Energy budget analysis: 14
Design of the Hull Structure: 15
Dynamic Simulation: 17
Calibration and Impulse Response of Prototype: 22
At Sea Tests in the Surf Zone: 25
Proposed Deployment Methods: 29
References: 31

5
Introduction: A better understanding of the planets basic physical processes has acquired a recent urgency with the growing awareness of the influence that mankind’s activities are imposing on the climate. The rate of exchange of energy between the sea and atmosphere is a fundamental part of the physical process driving the dynamics of the atmosphere and the oceans and improved understanding of this process will only come with improved instrumentation for the scientists to use. Measurements at the air-sea interface during periods of extreme forcing presents very difficult challenges to the engineer. Foremost is the challenge of maintaining the integrity of the data. Questionable data is a waste of scarce resources and may mislead the scientist in her efforts. Second is the difficulty of deployment. A ship with human lives can not be put at risk for deployment in dangerous conditions. Third is the very real possibility of the loss of the measurement system because. With this in mind, a measurement system is described below with the objective of measuring the surface fluxes at the air-sea interface. Measurements within a distance less than the significant wave height are difficult due to imperfect coupling to the sea surface of the measurement platform. A very small, flat buoy will be closely coupled to the sea surface and move with it. The difficulties associated with such a system are the limited volume for sensors, power and electronics. Current technology allows considerable savings in power consumption and will allow a very small solar/battery system to power the buoy sensor and telemetry systems. The Micro-Buoy will allow accurate, high-resolution measurement of temperature and velocity microstructure to within centimeters of the water surface. The buoy technology can be used to produce a series of sensor systems based on the platform. Sensor packages will be tailored for specific scientific objectives. Additionally, custom sensor packages will also be possible in addition to a standard set of sensor packages at a lower cost due to implementation of a modular design concept to allow for rapid integration of new sensor suites. The mechanical, communications, software and electrical systems will all incorporate a highly modular interface structure with industrial/commercial standard interfaces implemented where possible. The first sensor suites to be investigated will directly address the SBIR initiative. The Scientific Basis: The need for a small cost-effective system for the direct measurement of surface fluxes is well documented [1]. In the WORKSHOP 1 of the SEAFLUX Ocean Surface Turbulent Flux Project, the specific needs by the scientific community were discussed in detail.
“The need for high resolution, accurate surface turbulent fluxes (heat, water vapor, momentum) over the global ocean has been articulated by numerous groups within the global climate community, including the WCRP JSC/SCOR Joint Working Group on Air/Sea Fluxes, the GEWEX Radiation Panel, and the CLIVAR SSG. Specific applications of such a dataset, together with a comparable surface radiation flux and precipitation datasets, would include: constraining the budget and mean transports of heat and fresh water in the global ocean diagnosing regional and time variations of the coupled atmosphere-ocean system, evaluating the surface fluxes in coupled atmosphere-ocean models and weather forecasting models providing surface forcing for ocean models” [1].

6
Specific issues with modeling fluxes brought up at the workshop that the Micro-Buoy can help to address included:
• Wind-Wave Equilibrium • Rising and Falling Seas (Departures from Equilibrium) • Wave-Wave Interaction • Directional Considerations • Effects of Currents
The primary goal of the buoy system outlined in this report is to provide the measurements required for the estimation of salt, heat and momentum flux. Waves play an important role in the flux processes and characterization of the wave field enters into the understanding of the flux process. Heat and momentum flux at the air-sea interface have been estimated from measurements on both sides of the interface, i.e. the OBL and the ABL. Possible techniques for the measurement of the heat and momentum flux include profile methods, dissipation methods and eddy correlation. Eddy correlation techniques are preferred for turbulent fluxes due to the direct connection between the measurements and the flux but are however very sensitive to flow distortion and sensor alignment. This difficulty must be addressed in the engineering design of any system. Additionally, when using the eddy-correlation method there exists a paradox. The turbulent velocity must be measured as close as possible to the same point as the temperature but the physical presence of the temperature instrument can corrupt the velocity measurement. Another difficulty due to the Reynolds decomposition, eddy correlation requires that an appropriate time scale be used for separating the average values and the turbulent values. This time scale may be found by looking at the co-spectrum for the horizontal and vertical velocity [2]. Within the OBL, there are two terms contributing to the sensible heat flux, the turbulent transfer term and the molecular diffusion term. The molecular diffusion term will dominate when conditions are stable and the turbulence levels are essentially zero. Flux estimation in such conditions within the OBL only requires the measurement of the temperature gradient. The turbulent diffusion term dominates when conditions are unstable and the turbulence levels are something greater than zero. Flux estimation under these conditions, using the eddy correlation or direct method, requires the measurement of the 3 dimensional velocity microstructure and the temperature microstructure at a sufficiently high sample rate. Additionally, estimates of fluxes, using the eddy correlation method, have been found to be sensitive to platform motions and flow distortion. In addition to sensible heat transfer, the ABL also has a latent heat transfer term. Here again the eddy covariance method of estimation of the flux of the moisture may be used. Just as in the OBL, measurements are contaminated by platform motions and flow distortion. In both the OBL and ABL, heat is transferred through radiation in both the long and short wave length bands. To help in understanding the process of heat and momentum flux and to put the estimates into the appropriate context, the buoy should, in addition to the flux measurements, be able to characterize the wave field. The discus buoy type has been used as a pitch and roll buoy in many studies to derive the directional wave spectra [3]. This technique can be directly applied to the data from the buoy proposed here by using the information from motion sensing package. The buoy will accurately follow the wave surface for wavelengths greater than twice its own diameter. One difficulty in making such measurements is that the buoy will move horizontally with the wave orbital of the larger waves. For flux measurements, these larger waves will not contaminate the resulting signal given that the RAO of the buoy for these frequencies is very nearly 1.

7
The need for minimized motions for the measurement of fluxes using the eddy correlation technique and the use of buoy motions for the determination of the directional wave spectra can both be fulfilled if the buoy follows the sea surface exactly. To enable the buoy to follow the surface elevation, a relatively large water-plane area/mass ratio is required. To enable the buoy to follow the surface slope, it must have a large restoring moment created by placing the water-plane area away from the center of gravity as in a toroid buoy. Closely following the slope of the sea surface will maintain the vertical axis of the buoy normal to the sea surface. For measurements on the OBL, this will keep the sensors within and aligned with an isopycnal. In the ABL, the induced velocity at the sensor created by the pitch/roll motion and the moment arm to the sensor head will introduce an error. On ships and other large platforms this moment arm is at least several meters or larger. On the buoy proposed here, the moment arm is less than one meter resulting in a reduced velocity error. If in addition, the buoy is dynamically critically or over damped, the motions will remain small. There is a very significant downside to the use of a small flat buoy; it cannot be made self-righting. Though the initial stability is very high, eventually a breaking wave will be encountered large enough to turn the buoy upside down. One solution to this problem is to have redundant sensors on the opposite side and another solution is to have the sensor package self right. Either solution will solve this problem. Before this issue is addressed fully, it must first be determined at what sea state the buoy can remain upright with a high level of confidence. Remaining buoy motions will introduce error into the estimates of fluxes. These errors can be minimized through post-processing techniques. The first of these techniques is to apply a Weiner filter to the data using a measurement of the error signal [4][5]. This technique has successfully been applied to velocity data measured using shear probes and electromagnetic current meters. As an example, if the goal is to remove the error due to pitch motions from the velocities measured by the ADV, the measured pitch of the buoy can be used to create a time domain filter to remove any coherent signal between the pitch sensor and the ADV signal. A second approach also uses the measured motions to remove errors by using rigid body dynamics to remove rotational error induced by the oscillatory motions through a coordinate transformation and the measured motions of the platform [6][7]. There is a potential for buoy motions not representative of the wave excitation. Recent studies have shown that the non-linear dynamics of a discus buoy may have a chaotic response in large amplitude waves that may corrupt the derived directional wave spectra based on the angular response [8]. Sub-harmonic response to sinusoidal waves and resulting nonrepresentational directional side lobes bias the calculated directional wave. The study further shows that nonlinear coupling terms between pitch and roll, and pitch and yaw, may create a false angular spread. The nonlinear coupling terms become significant at high levels of excitation and so may corrupt the directional wave spectra in high sea states. These results suggest that a small buoy with a high natural frequency in pitch can survive where larger buoys pitch-pole. The reason is simply that at the resonant frequency the phase lag is pi, causing the buoy to pitch into the oncoming wave. If the natural frequency is high enough, the wave spectrum at that frequency will have very little energy with the result that the buoy will simply follow the slope of the wave field for very nearly the entire wave spectrum. The design must therefore optimize to a small buoy with a high natural frequency and a critically damped dynamic behavior. In addition to measuring the directional wave spectra, quantifying the presence of breaking waves is also an important parameter in the understanding of surface fluxes. Acoustic sensing for the occurrence of wave breaking can determine the proximity and the frequency of wave breaking. Laboratory studies show a strong correlation between the low frequency mean square acoustic pressure (20Hz to 10kHz) and the fractional dissipation [9]. Additionally, the amount of energy dissipated by breaking and the volume of air entrained are closely related. Up to 50% of the

8
Figure 3. Wave Follower at the University of Miami..
energy dissipated by breaking is expended entraining air against the buoyancy force. In the study by [10], they propose that the resonant frequency of the lowest mode is insensitive to the shape of the plume and may be used to estimate the total volume of air entrained. At sea measurements of the ambient acoustic field in the presence of breaking waves have shown the mean square acoustic pressure p2 is proportional to Dn where D is the energy dissipation with n in the range 0.6 – 0.8. An orthogonal least squares fit suggests an ambient sound level dependence of
p2~U102.4
where U10 is the mean wind velocity at 10m height. Bubbles are also an indication of breaking wave events. An alternative to the direct measurement of wind speed is the measurement of ambient noise in the ocean to estimate the magnitude of the wind stress. Directional information is not available by this technique, and it has had only limited use and testing. However [11] found that, away from coastal areas, the Weather Observations Through Ambient Noise (WOTAN) technique provided wind speed to an accuracy of 0.5 m/s in comparison with moored instrumented and surface buoys. The scientific issues discussed above will drive the design of the flux micro-buoy. As a general summary, the following conclusions can be made: • It is desirable to measure the heat flux at times when the molecular diffusion term dominates
(very calm conditions) and when the turbulent transfer dominates (moderate to extreme conditions).
• The buoy should be small to increase the natural frequency to a frequency band with low energy in the wave spectra.
• The buoy motions must be minimized to improve the effectiveness of the eddy correlation technique.
• The wave field must to be characterized in terms of the directional spectra and the occurrence of wave breaking events possibly with acoustic sensors.
Recent Research:
Flux measurements have traditionally been made at 5 or 10 meters above the sea surface using either direct (eddy-correlation) or indirect (bulk aerodynamic, dissipation) methods. These methods do not resolve the intermittency found close to the sea surface in the fluctuating transitional and turbulent layers influenced by the surface wave oscillations. Existing measurement platforms for the turbulent fluxes include research ships, moored buoys, aircraft, drifting buoys and Satellite remote sensing. Each of these platforms has advantages but none provide the close waterside and airside measurements, at the air-sea interface, required for observing the time dependant transitional boundary layer influenced by the gravity surface wave field.
Current advanced efforts for estimating the surface fluxes include the surface following instrumentation developed at the University of Miami [12] and the thermister profiler developed at the Institute of Ocean Sciences, Sidney, British Columbia [13]. The recent work at the

9
University of Miami has implemented a dynamically positioned array shown in the picture to the left for such measurements with success. This system requires a fixed base mounting such as to a large buoy, ship or pier; all of which will influence the measurements for the estimation of heat and momentum exchange.
The Air-Sea Interaction Spar (ASIS) buoy has also been recently deployed by the University of Miami for the purpose of measuring the surface fluxes and wave parameters [14]. This buoy is made of an array of spar buoys in a pentagon arrangement designed to provide a stable platform with minimal flow distortion. Additionally, accelerometers, rate gyros and a 3-axis magnetometer are used to quantify buoy motions and correct estimates made using the eddy-correlation method. This buoy has achieved very minimal motions while providing measurements using the eddy-correlation and profile methods for
the estimation of fluxes. A sensor system previously developed for close surface following and air-sea flux measurements is the LADAS catamaran. This buoy is small in size to allow for close surface following capabilities and has been used successfully in several studies to measure pCO2. The mobile wave-following research catamaran LADAS was deployed during both the Coastal Ocean Processes/Marine Boundary Layer experiment 1995 (CoOP 95/MBL II) and the Coastal Ocean Processes experiment 1997 (CoOP 97). In situ detection and mapping of subsurface shear and turbulent dissipation was performed. During CoOP 95/MBL II, both an Acoustic Doppler Velocimeter (ADV) and a hot-film anemometer
were deployed simultaneously at a mean depth of 30 cm. During CoOP 97, an array of six ADVs
was deployed from 25cm to 150cm below the mean water surface. These observations provide some new insights into the coupling between near subsurface velocity structures, atmospheric forcing, short wind-waves, and surface films [15]. Fulfilling the SBIR Objectives: The objective for this SBIR phase 1 program as stated in the original announcement [16]: “Improve cost survivability, and accuracy of in-situ meteorological and oceanographic sensors to enable accurate, cost-effective, measurements of environmental parameters under extreme (very high and very low) wind conditions. Of particular importance is the development of sensors that can directly measure the momentum, heat, and moisture fluxes under these conditions.”
Figure 5. LADAS catamaran buoy.
Figure 4. ASIS buoy at the Univ. of Miami. http://amphd1.rsmas.miami.edu/ampweb/people/wdrennan.html#Pubs

10
In meeting this objective, Ocean Sensor Systems Inc. proposed to design a small flux measurement buoy platform with the necessary sensors to accomplish the fore-mentioned objective. The technical implementation required the following work to be done: 1. Selection of the hardware components and sensors 2. Systems analysis to determine the power and mechanical requirements 3. Dynamic analysis to determine the response amplitude operators (RAOs) for the buoy system 4. Experimental validation of the dynamic analysis Each of the four tasks has been successfully completed within the contract period and is discussed in detail below. The cost estimate for the buoy is given in Appendix V. The total cost is expected to be less than $80,000 including the OBL sensor system.
The Sensor Systems:
By focusing on measurements within 1 meter on either side of the boundary layer, this little understood region may be studied. No single set of sensors will satisfy the needs of all researchers. The system must therefor be made modular and flexible to allow for different sensor suites. The focus of the sensors selected here has goal of characterization of the air-sea interface, specifically the momentum and heat fluxes, wave breaking events, and phenomena associated with the wave boundary layer. The sensors are divided into those in the Atmospheric Boundary Layer (ABL) or the Ocean Boundary Layer (OBL). This allows the scientist to select the package that will provide the data she needs by choosing a mix of those sensors from either the ABL or OBL side. In addition, the buoy instrumentation selection is flexible due to the modular design of the mechanical and electrical interface to the sensor systems. Additional systems include the self-motion package, GPS and telemetry options. The ABL Sensor System: The ABL sensor suite employs the following sensors (see Appendix I for specifications): • Gill Solent R3a sonic anemometer; 3D atmospheric velocity field • Campbell Scientific KH20 Hygrometer; Fast response vapor content • Eppley Longwave Pyranometer; Incoming long wave radiation • Eppley Shortwave Pyranometer; Incoming short wave radiation • Vaisala Barometric Pressure PTBE100A; Fast response barometric pressure • Vaisala RH HMP45A; Relative humidity • Everest Interscience Pyranometer 4000.4ZL; Sea surface skin temperature • Ly-Cor Pyranometer; incoming total radiation With this instrument suite, the turbulent heat, momentum and moisture flux may be estimated in winds from near calm to a maximum limited by the anemometer of 30m/s. The fluxes can be found by implementing the direct covariance method. The hygrometer is subject to salt encrustation due to spray and spume. The use of a ‘spray flinger’ allows the aspiration of the device while removing water droplets from the air stream [17]. This device spins a nylon screen at the entrance to a cylindrical chamber. A pair of fans creates the necessary airflow through the system. The nylon screen catches any spray and centrifugal force casts the accumulations away. It is planned to use temperature derived from the sound speed measurement from the anemometer and relative humidity. An Everest Interscience IR sensor will measure the skin temperature of the sea surface and be capable of resolving the surface temperature change associated with the wake of a wave breaking event [18].

11
A common problem with the upward facing radiation sensors is salt encrustation from spray. This leads to bias in the measured parameters affecting the long wave sensor more than the short wave sensor. The data logging software can actually monitor this condition and when levels are suspect, a cleaning routine can be initiated. The cleaning system proposed is a very small pump and sprayer similar to a windshield washer system on cars. By operating only as needed, energy will be conserved and the data integrity preserved. The lens on the pyranometers measures only about 3cm across and so the system must be vary small. The wiper is made from muscle wire and very small robust pumps are readily available from KNF Neuberger for the washer. It is important to note that the buoy follows the sea surface and remains normal to it resulting in a coordinate system fixed to the sea surface; a material surface. Buoy motions induce errors into the estimation of the fluxes in the ABL by creating induced velocities at the sensing elements and by tilting the probes from true vertical though they remain normal to the sea surface. The motion error will remain relatively small due to the very short moment arm from the CG of the buoy to the location of the sensors (<1.0m). In fact, the estimated induced velocity error based on the surf zone experiment described below has a RMS value of 0.10m/s with a moment arm of 0.5m. The 6DOF buoy motions will be monitored by a self-motion system and then be used to reduce these errors [5][6][7]. The close surface following allows phase averaging (with respect to the wave spectrum) of the measurements. This technique will reveal the time/wave dependant nature of the estimated fluxes. The buoy tilt will also affect the pyranometers but this will be easy to correct given that the instantaneous tilt is known and typically remains less than 10 degrees. Alternatively the pyranometers may be gimbaled with a damped system. Flow distortion due to the instrument platform is to be avoided. Previous schemes for reducing the distortion are the use of long arms and sparse structure [14] [19]. The buoy proposed here has a profile of only ~7cm above/below the water greatly reducing any flow distortion. The OBL Sensor System: The OBL sensor suite employs the following sensors (see Appendix II for specifications): • Nortek ADV; 3D velocity field • PME Fast Conductivity & Temperature; heat and salt flux estimation • ITC 6030 Hydrophone; ambient noise • Mohr and Associates Void Fraction Meter; for characterizing wave breaking events • Thermister array; dT/dz • Seabird SeaCat CTD Measurements in the OBL during calm winds and low turbulence may be accomplished in the with a thermister array to measure the temperature gradient in the upper 1.0m of the water column and provide a means for the direct calculation of the molecular transfer of heat. The array is a rigid string of 8 Thermometrics FP07 thermisters at 0.10m intervals with a custom bridge/amplifier. The response of the Thermometrics FP07 thermisters have been well documented and will provide sufficient temporal (~0.007s) as well as thermal resolution (~0.001C) [20]. Thermisters are prone to drift and therefore a CTD sensor is included in the instrumentation to provide a baseline for corrections to the thermister data. In more turbulent conditions, the eddy covariance technique will provide an estimate of the turbulent momentum, heat and salt fluxes using the ADV and the fast response thermister/conductivity probe located adjacent to the ADV. With the OBL system there is no

12
maximum sea state limitation on the measurements due to the instrumentation. The Thermometrics FP07 thermister provides the required response characteristics for estimation of the turbulent heat flux. This can be purchased with a fast response conductivity cell from PME (see specifications in Appendix II). This sensor will allow the measurement of temperature and conductivity in close proximity to each other as well as close to the ADV. The sensible heat and salt fluxes can both be estimated using this device due to the very fast time response of about 0.007 ms for the thermister and better for the conductivity cell. Here again the CTD will provide an estimate of the bias or drift in the thermister as well as establishing the mean background conditions. The Acoustic Doppler Velocimeter (ADV) must have the time and space resolution to fully estimate the turbulent fluxes. In addition, it must have the long-term stability to accurately resolve the very low mean velocities. There are at least two companies making ADVs for use in the ocean environment. The ADV made by Nortek has a very fast sample rate of 64Hz though better quality data is obtained at a lower rate as evidenced by the manufacturers specifications quoted at 25Hz. Additionally, the Nortek ADV offers a single small pressure vessel and draws relatively little power (~1 watt). Wave breaking events and heavy rainfall will be detected with an ITC 6030 hydrophone. During periods of extreme forcing, acoustic characterization of the OBL will allow correlation of the breaking events with the turbulence levels as measured with the ADV and with temperature structure as measured with the thermister array. Studies have also been able to show correlation between the low frequency (<10kHz) acoustic energy and the rainfall rate [21].
The TSI model 6030 hydrophone offers an appropriate size and frequency response and has an omni-directional pattern. The desired bandwidth shall be similar to that of previous studies with a flat response from 10Hz to 25kHz [9][10][11]. The quantitative measurement of the bubble field is of particular interest due to their influence on chemical exchange, sound levels and sound propagation. Sensor systems used to date include optical and acoustic methods. Precise characterization of the bubble spectral density has been achieved using bubble resonators and other techniques [22][23]. Void fraction has also been used to
characterize the bubble density [24][25][26]. A successful Nuclear Regulatory Commission SBIR program (CR-5059 Void Fraction Measurement of Liquid Level Detection, Concept assessment and Development.) resulted in a high-resolution void fraction meter [27]. Personal communications with Chuck Mohr, president of Mohr and Associates, manufacturer of the device, has indicated that an accuracy of 0.1% at 100Hz is possible with the system. This compares favorably to systems developed by research in the Oceanographic Community [Terrill and Melville]. The system has an electronics module capable of being integrated into the data logging system and a small (2.5” x 4”) sensor head and has been used in a variety of industrial process applications for over 10 years. Specifications can be found in Appendix II. The thermister array is a vertical staff with 8 thermisters at 0.1m spacing. There will be one thermister amplifier for each of the thermisters in the vertical thermister string. The amplifiers will contain the bridge, the precision reference and a differential amplifier. By keeping the amplifier close to the thermister, noise in the signal is reduced. Each thermister/amplifier unit will have a modular packaging to allow for simple replacement when a fragile thermister is broken without the need to disassemble the buoy system. This system will be designed and manufactured at Ocean Sensor Systems.

13
The Self-Motion Package: The self-motion sensor package implements a Systron-Donner MotionPakII (see specifications In Appendix III). This highly integrated/low cost motion package is a full 6DOF system and will be mounted within the electronics pressure vessel. An OEM compass made by Precision Navigation and an OEM GPS made by Motorola are also part of the self-motion system. The self-motion measurements are needed to assess and reduce the errors due to platform motions. Given that the buoy must follow the dynamic free surface, a measurement of both the absolute vertical motions and the relative motions is preferred. The relative motion may be accomplished by measurement of the instantaneous water line with four, very sensitive wave staff sensors place around the perimeter of the buoy. The average of the four sensors will yield the heave relative to the surface and the opposing sensors will yield the pitch and roll relative to the water. The sensor are corrosion resistant with a fast response (~50ms). Given a range of 0.2m and 14bit resolution, the depth resolution is better than 0.1mm. Ocean Sensor Systems currently markets the capacitive wave staff and has these items in stock. The self-motion system will also provide absolute coordinates that may be sent via the RF link for monitoring the location of the buoy. It is important to note that the buoy mechanical and electrical architecture facilitates the addition and removal of additional sensors. Given that the majority of potential users of this buoy system are research scientists, it is important that the system is capable of supporting new sensors, as they become available.
Data Logging and Data Management Systems: Support electronics are located in a separate waterproof housing and include a data logging system, batteries and RF telemetry (see specifications in Appendix IV). The data logging system is a PC104 stack with a CPU board with integrated onboard Ethernet and A/D capabilities, a custom signal conditioning board, a power supply board, a serial expansion board and a solid state hard drive. The RF system may be either a short-range high bandwidth point to point system, a medium bandwidth CDMD cell phone modem or a low bandwidth satellite link depending on the specific application. Coastal applications may take advantage of the low cost cell phone modems that can achieve 19.2k baud to transfer the data in real time to shore for analysis. If the deployment is within a fixed distance to the support ship or shore support, a point to point system will provide the lowest cost per byte. For offshore locations with unattended operation, a satellite-based system is required.
Figure 6. RF telemetry system including FreeWave DGR-115H RF modem and DAPA YAGI high gain antenna with housing.

14
For the first version, the point to point RF modem concept will be implemented. The FreeWave DGR-115H provides 20 miles line of sight range at 900MHz with 1 watt of output power. Two are needed, one on the buoy and one on the base station. The buoy will have an omni-directional whip antenna while the base station can have a directional high-gain antenna. The RF modem system will allow real-time data transfer as well as reconfiguration of the buoy data systems including sleep-mode, event driven sampling, triggered sampling and intermittent sampling techniques. The buoy will also be able to transmit its location continuously to facilitate recovery. The software for the data collection system has the following requirements: • Provide an interface for the scientific user of the system • Record the various sensor output at the correct data rate • Monitor the health of the sensors and the watertight integrity of the buoy • Allow for configuration of the various parameters • Provide a means for downloading the data • Allow monitoring in real time of the data through an RF interface • Modular and flexible enough to allow for implementation of future improvements • Calculate the expected mission duration based on energy usage The software has two parts. The first is the embedded software within the buoy data logging system. The second is the GUI software that resides on the users PC. It is important that the user interface must be simple and friendly so that the user of the system can focus on the science and not the technology. The software will be written in C for the buoy resident portion and C++ for the GUI. A version of the DOS operating system will be used on the buoy and the GUI will be Windows compatible. The software is fault-tolerant to allow for sensor failure without a system crash. Multiple data formats will be available to directly load into common analysis programs such as Matlab. Three custom circuits will be built as part of the data logging system. They are the acoustic system signal processing board, the analog signal conditioning board and the thermister string amplifier boards. The acoustic system signal processing board will be a subset of a design currently in production at Ocean Sensor Systems, Inc. used in the wave capacitance sensor. The board features a 12bit A/D, an 8bit PIC micro-controller and signal conditioning circuitry. The communications and data output are through RS232. The design is very low power and very small in size. The board allows serial communication to recover the data as well as configuration of sampling parameters. The thermister amplifiers are described in the OBL sensor section. The analog signal conditioning board provides power distribution to the various analog sensors and has 16 anti-aliasing filters with a selectable corner frequency of 5 or 10Hz. The filter board implements 8 pole butterworth low pass switched capacitor monolithic filters. In addition, this board will provide power to the sensors and use a single connector for each sensor. The board has been designed and built as part of Phase I and was used in the ocean experiment described below.
Energy budget analysis: Whenever there is an emphasis in size minimization of the platform, the energy budget must be considered since stored energy is a function of volume, decreasing as the third power of any dimension. The buoy system here cannot be all things to all people with the result that operational limitations must be designed in to the system. Experiments can typically be divided into two types. First, the intense instrumentation by a large team of scientists of some specific region for a specific amount of time for the purpose of examining a specific phenomena or event. Second, establishing some fundamental measurements over a region by a few scientists over some

15
considerable length of time in order to establish a base line. In the first type of experiment, the length is of the order of one to two weeks. For this a power supply system can be made to have the required energy in storage, i.e. batteries or fuel cell. In the second type of experiment, the length is of the order of several months to several years. For this type of deployment, the system must be able to generate energy or have energy brought to it. For all cases the energy budget must be precisely known. With all of the components selected, the energy budget was determined. Techniques for lowering the energy requirements include intermittent sampling with the system put into sleep mode between sample periods. In the intermittent sampling mode, a set time, an event or a command triggers a sample period. Each of these has certain advantages and the option will be left to the scientist to chose for the given application in the configuration menu on the GUI. A spreadsheet is shown in Appendix V giving the electrical consumption of each of the components. The on-board batteries can supply the required 17 watts of power for 24hours. Putting a solar panel o the buoy itself will create a large surface that will increase the wind forcing on the buoy and reduce the surface following capabilities. If the deployment is to be for longer than 24 hours, then power must come from a second buoy containing batteries and/or solar panels or from an umbilical to the ship/shore. See the section on moorings below.
Design of the Hull Structure: The hull must accomplish several tasks including: • Provide a stable platform for the sensors • Provide a water-tight chamber for the electronics • Provide a means for launch and recovery • Survive the open ocean environment • Protect the sensors during launch and recovery • Have minimum impact on the measured parameters Issues to be resolved in designing a stable platform include adequate buoyancy and righting moment for the buoy to follow the sea surface within some tolerance. The accurate measurement of the vertical velocities, either in the ABL or OBL, is critical for the estimation of vertical fluxes. In addition, the vertical velocities are very small in magnitude with respect to the horizontal velocities. To accomplish this, the buoy has been designed as an over-damped system with a natural frequency in pitch and heave above 1.5Hz. Given that the buoy will only respond to wavelengths equal or greater than the ~1.5 meter diameter of the buoy (~1Hz); this results in a buoy with a natural frequency above the forcing bandwidth and allows the buoy to follow the sea surface closely. A very stable but small buoy will move horizontally with the surface currents induced by the wave orbital velocities of the larger waves provided the superstructure is small to prevent strong wind forcing. This type of buoy can be used to measure the ripples riding on the surface of the larger swells without the phase distortion created by the orbital velocity of the swell [28]. Correlation studies between the swell frequency and ripple energy found negative phases in front of long wave crests, positive phases on windward sides. On any marine platform operating at the air-sea interface, stability in heave is achieved through buoyancy and stability in pitch/roll is achieved through either form stability or cg-cb separation. In order to accurately remain at the air-sea interface, either the stability must be very high or the

16
platform very large. Examples of very large stable platforms used for air sea studies are offshore platforms [28] and the FLIP [29]. Pitch/roll stability achieved through cb-cg separation requires relatively large angles of motion to generate a restoring force when compared to form stability. In addition, cb-cg separation is referenced to gravity while form stability is referenced to the slope of the sea surface. For these reasons the platform with high form stability will more closely follow the sea surface than the platform with high stability achieved through cb-cg separation. In order to reduce the cost per measurement, the platform must be made small and therefore achieve high form stability or stiffness. A large water plane area relative to the displacement will increase heave stability and similarly, a large restoring moment will increase the pitch/roll stability. However, if the conditions become so extreme that the platform capsizes the platform with high form stability will remain upside down while the platform with high cb-cg separation can be made to be self-righting. A solution to capsizing is to have redundant sensors on both sides of the platform. This results in a platform that follows the sea surface more exactly while providing a solution of the capsizing problem. It remains a task for Phase II to determine the conditions that will precipitate a capsize as this cannot be adequately modeled with a linear representation of the sea surface. If the buoy is designed to perfectly follow the sea surface in both elevation and slope, can the platform be considered truly Lagrangian? Given the large Renolds numbers of the ambient flows typical for the ocean, the smallest scales are of the order of a few millimeters in length. Any realizable buoy must be several orders of magnitude larger than this so clearly a perfect Lagrangian follower cannot be made. The finite size of the buoy results in the buoy having a response function where at low frequencies, i.e. long wavelengths, the buoy will move closely with the forcing and at high frequencies the buoy will not respond at all. Thus, the buoy is Eularian at some scales and Lagrangian at others. Additionally, the response function is different for the vertical and the horizontal motions due to asymmetry in both shape and in the restoring forces. The dynamics of the buoy have been designed so that the buoy will move closely with the surface wave orbital velocities (diameter < wave length) but will be stationary with respect to the turbulent microstructure (diameter > eddy size) in the horizontal plane [28]. A discus shape is often used for surface following applications. An undesirable characteristic of the pure discus shape is the low damping in roll. This has lead to the common use of a hybrid type of buoy with a discus shape at the water line and a spar buoy shape below reducing the roll motions but retaining the surface following capability. Recent studies have shown that the non-linear dynamics of a discus buoy may have a chaotic response in large amplitude waves that may corrupt the derived directional wave spectra based on the angular response [8]. Sub-harmonic response to sinusoidal waves and resulting nonrepresentational directional side lobes bias the calculated directional wave. The toroid buoy can offer increased stability and therefor maintain a linear response over a wider range of forcing. An issue with any measurement system is the systems influence on the parameters measured. For air-sea flux measurements from ships, the ship may significantly disturb the wind and the gravity wave field. A novel approach has been implemented here through anti-symmetry at the waterline. The flag/vane structure above the water will force the buoy to align with the wind. In addition, if the buoy is free floating, the buoy will drift with the protective arm sufficiently downwind of the ABL sensors minimizing distortion. If the buoy is moored, the vane will be placed on the opposite side so that the nonlinear wave induced drift velocity and wind induced surface currents advect the turbulence undisturbed by the buoy systems. The design process began with an estimated minimum size to house the necessary sensors and electronics (10kg payload) and a maximum size to allow simplified launch and recovery methods
17
from a small boat with two persons (~30kg). The original concept of a central waterproof chamber with a toroid shaped foam floatation around the perimeter was returned to after an investigation into a discus shape. In addition, with the possibility of loss at sea, it was decided to use materials that will decompose with minimal environmental impact. An entirely aluminum vessel will eventually sink and corrode away with minimal environmental impact and yet offer reasonable construction costs and, if maintained, many years of service. The aluminum hull is a thin wall aluminum tube weldment structure. The toroid is made of 0.128m tubing bent into a 1.33m outside diameter toroid. Two cross tubes contain the batteries and act as an instrumentation-mounting frame. The data logger is inside a small pressure vessel that mounts on the battery tubes as well. Four legs support the toroid out of the water and protect the wave staffs. All parts of the buoy are made of 6061 T6 aluminum and zincs are attached to minimize galvanic corrosion. The final product will be hard coated though the prototype as tested was not.
Dynamic Simulation: In order to optimize the buoy hull design a parametric study was done using buoy motion software based on the ROLLRAO and HERAO programs developed at WHOI in the 1970’s [30]. This software implements the linearized non-coupled equations of motion to find the RAOs and the statistical response of floating bodies to linear wave excitation. The wave excitation may be represented as a Peirson-Moskowitz, Bretschneider or ISSC wave amplitude spectra. The linearized solution is not valid for large amplitude motions; motions likely in waves and winds above 40knots. The results of the frequency domain analysis of the discus design are summarized in the figures below. The results are based on the Peirson-Moskowitz amplitude spectra as input with 5 and 10m/s input wind speeds. The heave and pitch RAO for a discus buoy is shown in Figure 4 and the heave RAO for the toroid buoy in Figure 5. For the discus buoy, the natural frequency in heave and especially pitch is low enough to allow for excitation by the ambient wave field and resonant conditions to occur. For a buoy with large form stability and large amplitude motions expected in the extreme conditions of operations, pitch and heave are strongly coupled and not adequately modeled in the frequency domain analysis. In addition to the frequency domain motion analysis program, a non-linear coupled 3DOF time domain simulation of the buoy motions has been written and used to model the buoy in regular as well as random waves. The simulation models the coupled heave, pitch and surge motions of the vertical plane. The excitation is modeled as a multi-component pseudo random wave spectrum with options of regular, PM spectrum, Bretschneider spectrum or ISSC spectrum as input. The simulation is by itself a salable product produced as part of this SBIR and plans are underway to improve the user interface and bring the simulation software up to commercial standards. The time-domain simulation has 5 modules for carrying out the analysis: • BDYN: calculates the dynamics of the buoy and steps through time. • LINWAVE: calculates the 2D pressure field, velocity field, surface elevation and surface
slope for regular waves or for a given spectrum. The spectrum is modeled as a 50 component pseudo random wave using linear wave theory. Each component is given a random phase angle but allows the same set of random phase angles to be repeated for series tests.
• ANAL: takes the output from BDYN and plots the time histories and frequency domain buoy motions and wave parameters.
• MOVMOT: takes the output from BDYN and creates a 3D movie of the buoy in waves. The dynamic equations in BDYN use a set of coupled 3DOF equations that are time stepped. Details of the algorithm implemented can be found in Appendix VI.

18
Figure 7. Response Amplitude Operators from frequency domain analysis of the discus buoy
dynamics using linear theory. Note the large resonant peaks.
19
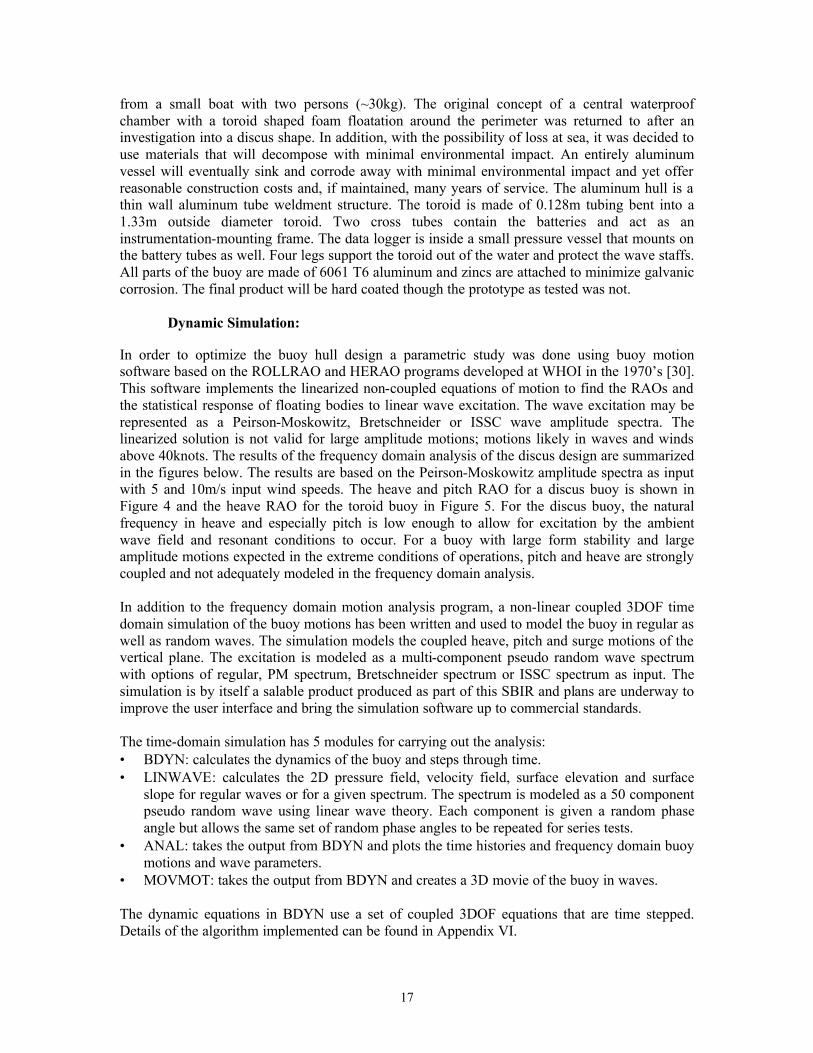
Figure 8. Heave Response Amplitude Operator (RAO) from frequency domain analysis of the toroid buoy dynamics using linear theory. Note that the response is nearly 1 for periods about 2 seconds and drops at periods less than 2 seconds. The peak at 0.5seconds is physically unrealizable because the buoy is 3 times larger than the wavelength at this wave period. Analysis of the proposed small discus buoy using the time domain software resulted in unacceptably large motions. Pitch is the most problematic of the motions for surface following buoys and methods to overcome this have included multi-hulled buoy systems such as found on the RASMAS buoy or the LADAS buoy. Another consideration in the design is the desire to keep the buoy axi-symmetric and minimize any yaw motion due to wave forcing. A toroid has the qualities of increasing the righting moment and maintaining axi-symmetry. Construction of a true toroid of the size desired can be difficult. Certainly, in materials such as plastics, any shape is possible but it was decided early on to make the buoy out of a corrodible material such as aluminum so that if lost, the buoy will eventually disappear. A search on the Internet yielded several companies capable of bending a 5” SCH 10-aluminum tube to the desired radius. The time domain code was modified to accept a toroid shape and the results are shown in the figures below. The analysis was done on a 5” diameter tube bent into a 48” centerline diameter toroid shape. An impulse input yielded the damped natural frequencies for the heave and pitch motions at about 10 and 2.8Hz respectively as shown in Figure 6. With a simulation of 100sec and a wind speed of 5m/s, the standard deviation of the sea surface and slope is 0.1203m and 0.069rad. The Standard deviation of the heave and pitch deviations is 0.0013m and 0. 0049. Heave is the most critical component as it is used in the eddy correlation calculation for vertical fluxes. The standard deviation of the heave velocity is 0.2591m/s while the standard deviation of the heave velocity error from the sea surface velocity is only 0.0048m/s. the buoy was not moored in the simulation and therefore there is no restoring force in surge. The response function for surge is shown in Figure 8.

20
Figure 9. Response of heave (top) and pitch (bottom) accelerations to an impulse input using the time domain simulation for a toroid buoy. The damped natural frequency for heave is about 10Hz and for pitch about 2.8Hz.
Figure 10. Pierson-Moskowitz spectrum with a 10m/s input. Note that there is very little energy at or above the 2.8Hz pitch natural frequency of the toroid buoy.

21
Figure 11. Coherence estimates taken from time domain simulation with wave frequency input from 0.39Hz to 1.31Hz or wavelengths from 0.9 to 10 meters. Top frame is the coherence between surge accelerations and the sea surface elevation; middle frame is the coherence between heave accelerations and the sea surface elevation; bottom frame is the coherence between the pitch accelerations and the sea surface slope.

22
Figure 12. Time domain simulated surge response spectrum to a PM 5m/s input spectrum: a) ADV measured u velocity (green) and wave orbital u velocity (blue), b) transfer function from the wave orbitals to the surge response, and c) coherence function between the wave orbital u velocity and measured ADV u velocity. Note in the Figure 9 (top) the ADV measures a lower velocity than the wave orbital velocity for low frequencies due to the movement with the wave orbital. At ~0.7 hertz, the buoy stops responding to the forcing because the waves are smaller than the buoy so the measured velocity and orbital velocity are nearly equal. At frequencies above 1Hz the orbital velocities are attenuated at the depth of the ADV.
Calibration and Impulse Response of Prototype: A complete set of engineering drawings was made and the prototype buoy manufactured for the purpose of verifying the dynamic model. To accomplish this, the prototype was built to full size and equipped with a heave-oriented accelerometer, four capacitive wave gauges, pitch and roll rate sensors and a compass. The prototype is shown in Figure 13 with the wave staffs visible as yellow lines radiating from the central electronics housing. The two support beams also house the alkaline batteries. The proposed data logging system was implemented for gathering data. A
Figure 13. Prototype buoy.
23
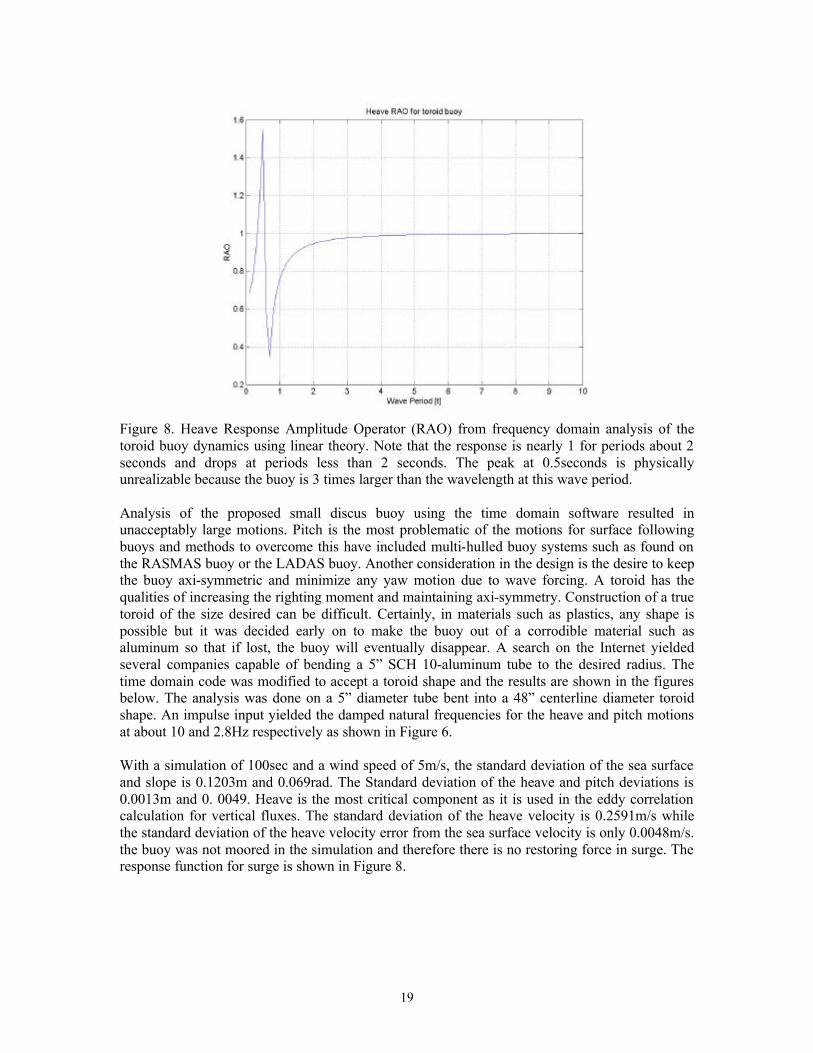
series of experiments were conducted to verify that the buoy does indeed follow the sea surface. This is accomplished with four very sensitive wave gauges place around the perimeter of the buoy. The average of the four sensors yields the heave relative to the surface and the opposing sensors yields the pitch and roll relative to the water. The accelerometer, rate sensors and compass gives the pitch, roll and heave relative to earth fixed coordinates. A set of three experiments was conducted to verify the buoy dynamics of the toroid buoy. The first test was in a shallow artificial pool of fresh water for the calibration of the wave staffs as installed on the buoys. The buoy was progressively weighted down and the water level depth from the keel was measured while the output from the four wave staffs was recorded. The results are given in Figure 14.
Figure 14. Plot of calibration curves for the wave staffs mounted on the Micro-Buoy below with the data points plotted as ‘x’ and a linear curve fit shown. The polynomial curve fit coefficients are given for each of the wave staffs. Note the linear response over the entire range of depth. The second test took place in a canal to obtain the heave impulse response and the pitch impulse. Pushing the buoy down into the water until the top of the toroid was at the water surface and then released generated the heave impulse response. The results for the heave impulse response are shown in Figure 15. The wave staff signals are averaged to yield the vertical position of the buoy relative to the water surface. The time domain and frequency domain signals obtained from the wave staffs show an over-damped response with no resonant peak in the frequency domain. The accelerometer signal shows an under damped sinusoidal response. The difference in these two signals can be explained by the fact that the buoy slowly raised up to the static position relative to the water but the water surface oscillated due to the forcing from the buoy.

24
Pushing one side of the buoy down so that the top of the toroid was at the water surface and lifting the opposite side up so that the bottom of the toroid was at the water surface generated the pitch impulse response. The output of the wave staffs from one side were averaged and subtracted from the average of the wave staffs from the other side to yield the pitch relative to the water surface. The response of wave staff derived pitch in the time domain (top Figure 16) has a small oscillation at 1.6 Hz. The estimated damped natural frequency of the time domain simulation is 2.8 Hz. Reflections were observed within the buoy ring which may have created the small oscillations in the wave staff signals.
. Figure 15. Heave impulse response with heave acceleration in blue and heave deviation as measured by the wave staffs in green. The time domain is shown in the top and the frequency domain is shown in the bottom.

25
Figure 16. Pitch impulse response with pitch-rate in blue and pitch deviation as measured by the wave staffs in green. The time domain is shown in the top and the frequency domain is shown in the bottom. At Sea Tests in the Surf Zone: The third test took place at the beach in Hobe Sound in the surf zone of the Atlantic Ocean. The buoy was carried and launched by a single person into the surf, demonstrating the one-man portable capability. The buoy was free-drifting in the long shore trough in about 2 to 4 meters of water. There were 1 to 2 meter, breaking waves with an estimated period of 5 to 7 seconds. The tests clearly show the capability of the buoy design to survive breaking seas, identify a breaking wave, and closely follow a seaway. The standard deviation of heave, pitch and roll, as measured by the wave staffs, are 0.0074m, 0.0147rad and 0.0157rad respectively, in a seaway with a standard deviation of 0.3849m. The actual error for surface following is even less because the wave staffs are measuring ripples too small for the buoy to respond to. The plots of the time domain data are shown in Figure 19. These very encouraging results indicate that the buoy will be
Figure 17. Launch of Buoy in the surf zone experiment at Hobe Sound Florida.

26
able to function as designed in very extreme conditions. The determination of the buoy’s full capabilities will have to wait until a comprehensive experiment can be conducted. There was a noticeable long-shore current of about 0.5m/s to the south on an east facing shoreline. The shear along the shore created by the current may be responsible for the clockwise rotation of the buoy as shown in the top of Figure 20. The spectrum of the buoy acceleration may be considered the spectrum of the sea surface given the very small deviation of the buoy from the surface (bottom Figure 20). Note that the flat response at frequencies below 0.08Hz is likely due to the low frequency drift in the accelerometer. At t = 601observers recorded a wave-breaking event. Measurements made by the buoy are shown in Figure 20. During this event the wave gauges were covered with breaking water from above as indicated by the wave staff signals. The breaker was more spilling than plunging with about 0.3 meters of froth observed on the face of the wave. The photograph in Figure 18 was taken at t=600 seconds and the lower peak before the breaking wave (t=599) can be seen in the foreground of the photograph as well as in the wave profile in the top of Figure 21. The pitch and roll of the buoy, as shown in the middle to plots of Figure 21, are quite large (~0.3rad. peak-peak) but the pitch and roll with respect to the sea surface remains very small.
Figure 18. Buoy at t = 600 on the face of a breaking wave.

27
Figure 19. A short segment of the surf zone experiment showing the buoy response in a seaway. (top) The heave deviation is shown in green with the double integrated heave acceleration giving the sea surface. (middle) The pitch deviation is shown in green with the pitch angle derived from the pitch-rate sensor shown in blue. (bottom) The roll deviation is shown in green with the roll angle derived from the roll-rate sensor shown in blue.

28
Figure 20. Buoy heading while in the surf zone (top) and frequency domain plot of the heave accelerations (bottom).

29
Figure 21. Buoy response in a breaking wave event. (top) The wave staffs clearly show the water covering the buoy with a reading of over 0.23m on all four staffs. The pitch (second from top) and roll (third from top) are shown in green and are derived from the rate sensors and are shown with the pitch and roll deviation (blue) calculated from the wave sensors. (bottom) The heave (green) is derived from the heave acceleration (blue) and yields the sea surface profile of a 1 meter wave.
Proposed Deployment Methods The micro-buoy may be deployed in a number of ways. First, it may be deployed as a lagrangian drifter with either on-board data logging of the information or using RF to telemeter the data to a ship or shore based receiver. Secondly, the buoy may be ship deployed with a very long neutrally buoyant tether to the ship to allow the Micro-Buoy to maintain a large enough distance away from the ship to be out of the ship’s influence. Thirdly, the Micro-Buoy may be tethered similarly to a mother buoy. The mother buoy can be a large moored and instrumented buoy sending power to the Micro-Buoy with the Micro-Buoy transmitting the measured parameters to the mother buoy.

30
The important aspect of deployment is to maintain a minimal influence on the measured environmental parameters and the surface following capability of the buoy. If the buoy is tethered, the tether should be made of floating line so that any force it generates on the buoy is not destabilizing. In addition the tether should be made very long to put the buoy out of the down wind wake of the ship or mother buoy. This distance may be quite long for a large ship. Alternatively a multi-point mooring may be used to put the Micro-Buoy out of any distortion of the wind and currents. The tether may also go to a drogue when free drifting. This will keep the buoy aligned to the forcing and reduce drift. Here again the tether should be long enough and floating to reduce the influence. The floating tether may then go to a small surface float tethered to the drogue. The addition of a drogue will be beneficial for extreme forcing conditions by supplying a restoring force should the wave become very steep such as in a breaking condition. The force supplied by the drogue will be in the direction of the mean surface elevation and normal to the wave front.