michigan cardiac rehabilitation outcomes · pdf filemichigan society for cardiovascular and...
TRANSCRIPT

MICHIGAN SOCIETY FOR CARDIOVASCULAR AND PULMONARY REHABILITATION
March 2011
Michigan Cardiac Rehabilitation Outcomes Report
Program Results 2008-2009

ACKNOWLEDGEMENTS
MSCVPR Outcomes Committee Members Contributors
Co-chairs: Julie Martz, RN Bronson Methodist Hospital
Velma Theisen, RN, MSN Manager, Heart Disease & Stroke Prevention Unit Michigan Department of Community Health
Carolyn Palka, MS The University of Michigan Hospital
Christi Demitz, MSW Michigan Department of Community Health
Members: Kristen Bernacik, BS Beaumont Hospitals
Henry Miller, MPH Michigan Department of Community Health
Joseph Bryant, BS The University of Michigan Hospital
Montana Outcomes Project Coordinators
Elizabeth Dole, BS FAACVPR Munson Medical Center
Mike McNamara, MS FAACVPR Project Coordinator Montana Cardiovascular Health Program
Amy Fowler, BS Beaumont Hospitals
Carrie Oser, MPH Epidemiologist/Evaluator Montana Cardiovascular Health Program
Sue Haapaniemi, MS Beaumont Hospitals MSCVPR Executive Board Steve Walsh, BS The University of Michigan Hospital
This project was supported in part by the Michigan Department of Community Health using funds from grant number U50/DP000718 from the Centers for Disease Control and Prevention Heart Disease and Stroke Prevention Program.
For information about participation in the Michigan Outcomes Project, tools utilized, and further details, please contact the MSCVPR President via www.mscvpr.org/contacts .

MICHIGAN CARDIAC REHABILITATION
OUTCOMES REPORT 2008-2009
Table of Contents
Introduction ................................................................................................................ 1
Demographics .............................................................................................................. 5
Dartmouth Coop ........................................................................................................ 11
SF-36....................................................................................................................... 13
Blood Pressure at Goal ................................................................................................. 16
Body Mass Index......................................................................................................... 19
LDL at Goal & Use of Prescription Lipid Lowering Medications............................................... 21
Duke Activity Status Index (DASI) ................................................................................... 24
Hemoglobin A1C (HbA1c) Test Completed ....................................................................... 26
Patient Smoking Status ................................................................................................. 29
Dietary Fat Screener .................................................................................................... 31
Patient Satisfaction ...................................................................................................... 33
Completion Rate ........................................................................................................ 35
Conclusion................................................................................................................ 37
Appendices ............................................................................................................... 38
References.……………………………………………………….…………………………… 63

1
INTRODUCTION Since 1918, cardiovascular disease (CVD) has remained the single largest killer for men and women, affecting over 16 million U.S. adults today (American Heart Association, 2009). Cardiac rehabilitation (CR) has been in existence for over 30 years, and is recognized as integral to the long-term comprehensive care for patients with heart disease (Thomas et al., 2007). Cardiac rehabilitation services are recommended as useful and effective (Class I) by the American Heart Association (AHA), and the American College of Cardiology (ACC) in the treatment of coronary heart disease (CHD). The results of CR services can be summarized as: 1) improvement in exercise tolerance, 2) improvement in symptoms, 3) improvement in blood lipids, 4) reduction in cigarette smoking, 5) improvement in psychosocial well-being and reduction of stress, and 6) reduction in mortality (Wenger et al., 1995). The Agency for Health Care Policy and Research (AHCPR) and the National Heart, Lung, and Blood Institute (NHLBI) convened a panel from the American Association of Cardiopulmonary Rehabilitation (AACVPR) to author a handbook entitled, “Clinical Practice Guidelines” for Cardiac Rehabilitation. These guidelines included recommendations based on results from extensive scientific literature reviews and expert clinical judgment. This handbook has served health care professionals as well as consumers to optimize the quality, safety, effectiveness, and access to cardiac rehabilitation services. Cardiac rehabilitation services can be defined as supervised exercise training and cardiac risk factor modification delivered by multidisciplinary staff members (i.e., nurses, exercise physiologists, dietitians, and stress management specialists). Cardiac rehabilitation can be divided into three phases: Phase I (inpatient), Phase II (outpatient), and Phase III (maintenance program). As an increasing number of patients survive myocardial infarction (MI), and as inpatient length of stay decreases, outpatient Phase II CR participation assumes an increasingly important role in secondary prevention of heart disease. Witt (2004)
Results of CR Services
1. Improvement in exercise
tolerance 2. Improvement in symptoms 3. Improvement in blood
lipids 4. Reduction in cigarette
smoking 5. Improvement in
psychosocial well-being and reduction of stress
6. Reduction in mortality Source: Clinical Practice Guidelines, U.S. Department of Health &
Human Services
As cited by Witt (2004), 95 percent of patients who had completed CR were still alive three years post-event, as compared with only 64 percent of patients who did not attend CR. Furthermore, CR participants had a 28 percent reduction in recurrent cardiac events. Recent meta-analysis of 48 randomized trials demonstrated up to a 25 percent reduction in mortality for those participating in CR as compared to those in usual care (Taylor 2004). Furthermore, Hammill, et al. (2010) concluded that among Medicare beneficiaries, a strong dose-response relationship existed between the number of CR sessions attended and the long-term risk of death and MI. Attending all 36 sessions reimbursed by Medicare was associated with lower risks of death and MI at 4 years compared with attending fewer sessions. As cited by Suaya (2009), mortality rates were 21% to 34% lower in CR users than nonusers in a socioeconomically and clinically diverse, older population after extensive analyses to control for potential confounding. These results are of similar magnitude to those observed in published randomized controlled trials and meta-analyses in younger, more selected populations. Additionally, Shah et al. (2009) revealed enrollment in CR was associated with improved medication adherence post-MI.
Because of the well-established benefits of CR, Medicare benefits for CR services now extend beyond the traditional diagnoses of CABG, MI, and stable angina, to include patients who have undergone PCI, valve replacement/repair, and heart/heart-lung transplant. Despite the known benefits of CR, the widespread endorsement of its use and the

2
Mic
higa
n Ca
rdia
c R
ehab
ilita
tion
Out
com
es |
20
10
repo
rt
millions of Americans that could benefit from its services, CR is vastly underutilized, with less than 30 percent of eligible patients participating in a CR program after a CHD event (Suaya et al., 2009). For a decade now, national organizations such as the American Association of Cardiovascular & Pulmonary Rehabilitation (AACVPR), ACC, and AHA, have made significant efforts to address CR referral, participation, and adherence. Some state organizations have partnered with their state departments of health in an effort to address outcomes for CR. This document was created to provide a review of the delivery of CR services within the state of Michigan as compared with other states over a one-year period. This multi-state project, titled the Montana Outcomes Project, started in 2005 as a collaborative effort between the Montana Association of Cardiac and Pulmonary Rehabilitation (MACVPR) and the Cardiovascular Health Program (CVH) within the Montana Department of Public Health and Human Services. The goal of the project was to provide a complete out-of-the-box CR outcomes program, as well as to provide data management and support to participating programs. Data support included the development of aggregate regional means for each indicator, to be used for benchmarking purposes. The benchmarking of data allowed programs to identify areas to focus quality improvement (QI) activities, with the ultimate goal of improving patient care. Data was collected on a quarterly basis (October – December, January – March, April – June, and July – September). Much like the Montana affiliate of the AACVPR, the Michigan Society of Cardiovascular & Pulmonary Rehabilitation (MSCVPR) partnered with the Michigan Department of Community Health (MDCH) to facilitate the state work plan and oversee the project. The MSCVPR acknowledges and is grateful for the invaluable support with financing, editing, and the project overall from the MDCH.
In 2007, selected outcome measures were developed and formalized into broad-based recommendations and performance measures for CR from the AHA/ACC/AACVPR (Thomas et al., 2007). Measuring outcomes has become the focus of quality care delivery, and the outcomes highlight what programs are doing well while revealing areas of improvement. QI activities based on outcomes data ultimately lead to improved patient care. In 2008, Michigan joined nine other states participating in the Montana Outcomes Project to promote standardized outcome measurements, benchmark for comparisons, assist one another in quality care improvement for patients, and share best practices. Fifteen CR programs across Michigan began collecting and reporting outcome measures. To date, Michigan represents the largest number of patients in the project (approximately 40 percent) with over 30 programs reporting data. Each program participating in the project receives individual CR program results in four domain areas: health, clinical, behavioral, and service-related. The results are compared nationally among the ten states involved in the project, and a basis and impetus has been formed for planning QI projects. Education has been provided by MDCH to assist Michigan CR programs with such QI projects; these QI initiatives are highlighted at the end of this document.
The data collected from this project has been broken down by region consistent with MSCVPR Board representation (North, Southeast, and Southwest), which has enabled the committee to determine benchmarks; share best practices, and identify regional disparities. Therefore, the purpose of this document is to provide state CR programs and insurance providers with knowledge of how programs fair in their effectiveness and delivery of comprehensive CR across the regions, and to share resulting QI projects with other programs.
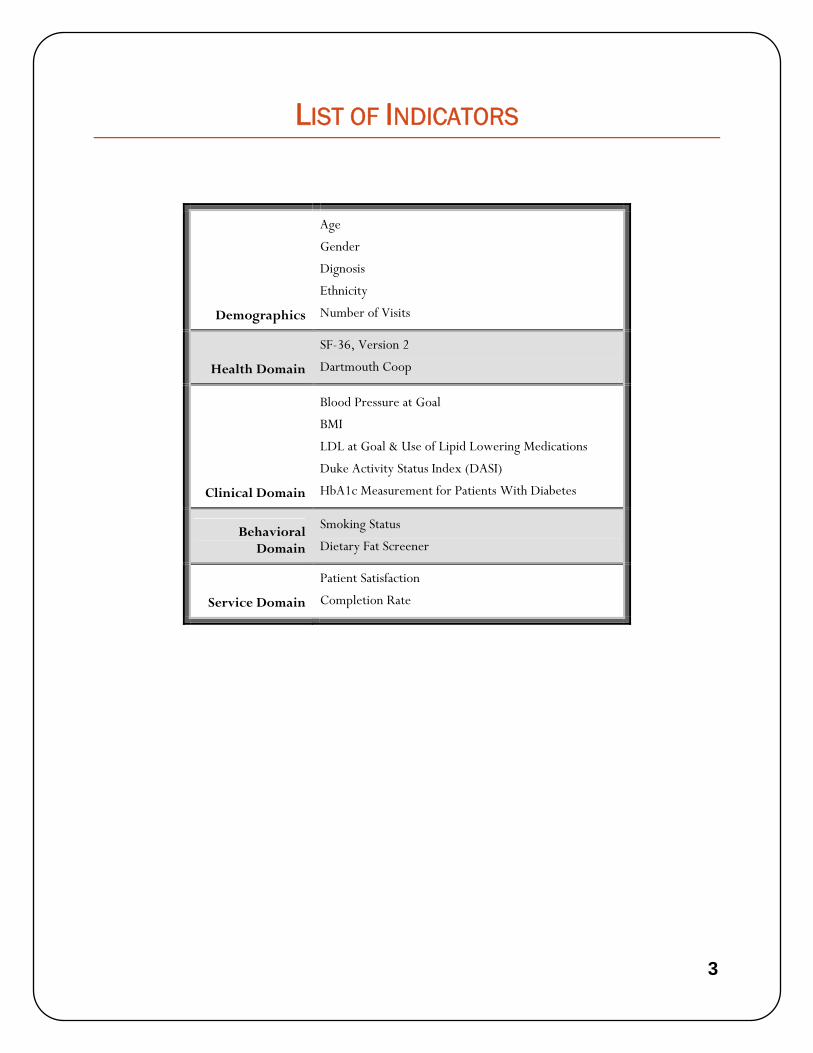
The following table provides a brief overview of the indicators collected for data analysis. In the following pages, each indicator is reviewed, including a discussion of tool validity, limitations, results, and recommendations.
3
LIST OF INDICATORS
Age
Gender
Dignosis
Ethnicity
Demographics Number of Visits
Health Domain
SF-36, Version 2
Dartmouth Coop
Clinical Domain
Blood Pressure at Goal
BMI
LDL at Goal & Use of Lipid Lowering Medications
Duke Activity Status Index (DASI)
HbA1c Measurement for Patients With Diabetes
Behavioral Domain
Smoking Status
Dietary Fat Screener
Service Domain
Patient Satisfaction
Completion Rate

4
Mic
higa
n Ca
rdia
c R
ehab
ilita
tion
Out
com
es |
20
10
repo
rt
2008 – 2009 PROJECT PARTICIPANTS
1. Michigan
• Battle Creek Health System • Bronson Methodist Hospital • Cheboygan Memorial Hospital • Holland Hospital • Kalkaska Memorial Health Center • Mercy Hospital • Munson Medical Center • Northern Michigan Regional Hospital • St. Joseph Mercy Hospital • Spectrum Health Hospital • Three Rivers Health • University of Michigan Health System • Beaumont Hospital, West Bloomfield • Beaumont Hospital, Royal Oak • Beaumont Hospital, Troy
2. Arizona
3. Pacific Northwest (CA, OR, WA)
4. Upper Plains (ND, SD, MN)
5. Montana & Wyoming

5
DEMOGRAPHICS Objective
To define the demographic information of patients attending CR programs within Michigan.
Standard of Measurement
Demographic information was collected for each patient, including age, sex, ethnicity, and diagnosis.
Supporting Statement
Cardiac rehabilitation participation is underutilized by patients with heart disease, with significant geographical variation in referral rates and lower use in women, non-whites, older patients, CHF patients, and those receiving Medicaid (Suaya et al., 2007; Thomas et al., 2007). Despite favorable reductions in mortality and morbidity resulting from CR services, there is a greater prevalence of CVD risk factors related to mortality and morbidity in ethnic and racial minorities (Anderson, et al. 2008). In 2007, the Centers for Disease Control and Prevention (CDC) identified six priority areas of focus for state heart disease and stroke programs, one of which was to eliminate CVD disparities in terms of race, ethnicity, sex, geography, and socioeconomic status (Anderson et al., 2008).
Within Michigan, African American males and females have had an increase in cardiovascular hospitalization rates since 2000. Rates of African American males hospitalized due to CVD increased by 12.7 percent over the 7-year period at a time when Caucasian male admissions showed a marked decline. In 2006, African American males had the highest age-adjusted CVD hospitalization rate (356.1 per 10,000), while Caucasian females had the lowest (149.3 per 10,000) (Impact of Heart Disease and Stroke, 2008; US Department of Health and Human Services, 2000).
Gender differences in the use of CR services exist as well. One study showed women were less likely to be instructed on secondary prevention strategies and CR or referred to CR as compared to men, despite being matched for age and undergoing the same procedure. The data demonstrate a difference between males and females in hospital teaching and referral information for CR after revascularization (Caulin-Glaser et al. 2001).
Age of patients is another factor affecting participation in CR. Data from AHA’s “Get With The Guidelines” program analyzed 72,817 patients discharged alive after a MI, PCI, or CABG surgery between January 2000 and September 2007 from 156 hospitals. Factors associated with CR referral at discharge were identified and multivariable logistic regression was performed, adjusted for clustering, to identify which factors were independently associated with CR referral. Older age, non-ST-segment elevation MI, and the presence of most co-morbidities were associated with decreased odds of CR (Brown et al., 2009).
Despite lower CR participation in older patients, significant data exists to support its benefit for this population. Suaya (2009) published mortality rates 21 – 34 percent lower in CR users than non-users in a socio-economically and clinically-diverse older population after extensive analysis to control for potential confounding. These results are of similar magnitude to those randomized controlled trials and meta-analyses in younger, selected populations.

6
Mic
higa
n Ca
rdia
c R
ehab
ilita
tion
Out
com
es |
20
10
repo
rt
Results
Data collection from this project confirms that both sex and racial disparities remain prevalent factors. The average program consisted of 70 percent men and 30 percent women. At least 90 percent of all CR participants in all 3 Michigan regions and in all 10 states were Caucasian. African Americans represented 3 percent, and Asians and American Indians represented a 1 percent overall participation in CR in Michigan.
Demographics of diagnosis reveal the majority of patients attend following either an event or a procedure, and only 6 percent attended with the diagnosis of angina.
CR Usage by Sex – Michigan (n = 3,026)
Region Male % (n) Female % (n)
North 70 (457) 30 (297)
Southwest 70 (783) 30 (336)
Southeast 72 (904) 28 (349)
Michigan Total 71 (2,144) 29 (882)
Source: Montana/Michigan 2008-2009 Outcomes Report
CR Usage by Race/Ethnicity – Michigan (n = 3,026)
Region Caucasian %
(n) American
Indian % (n)
African American % (n) Asian % (n) Other % (n)
North 98 (639) 2 (11) 0 (1) 0 (1) 0 (2)
South West 95 (1065) 0 (3) 2 (27) 1 (16) 2 (18)
South East 90 (1,127) 0 (2) 5 (63) 2 (22) 3 (39)
Michigan Total 94 (2,831) 1 (16) 3 (91) 1 (29) 2 (59)
Source: Montana/Michigan 2008-2009 Outcomes Report
CR Usage by Age (n = 7,567)
Michigan (n = 3,026)
National (n = 7,567)
Age in years Mean (min-max) 64.4 (19.9 - 95)
Mean (min-max) 66 (18.9 - 95.4)
Source: Montana/Michigan 2008-2009 Outcomes Report

7
CR Sessions Completed – Michigan (n = 3,026)
Region
Mean/Median
% (n)
North 20/20.5 (654)
Southwest 19.7/18 (1,119)
Southeast 19.6/18 (1,254)
Michigan Total 19.7/18 (3,026)
Source: Montana/Michigan 2008-2009 Outcomes Report
CR Usage by Diagnosis (n = 7,567)
Diagnosis
Michigan
% (n)
National
% (n)
MI only 5 (141) 7 (502)
CABG only 6 (193) 6 (441)
PCI 20 (610) 19 (1,443)
Stable Angina 3 (104) 5 (397)
MI/CABG 29 (863) 30 (2,255)
MI/PCI 29 (862) 28 (2,130)
Other 14 (420) 16 (1,234)
Source: Montana/Michigan 2008-2009 Outcomes Report
Discussion
The barriers to utilization of CR fall into three categories: referral, participation, and adherence. The underutilization of CR services may be multi-factorial. Some consistent factors found to be associated with participation in CR programs include lack of referral by physicians, associated illness, specific cardiac diagnoses, reimbursement, self-efficacy, perceived benefits of CR, distance and transportation, self-concept, self-motivation, family composition, social support, self-esteem, and occupation. Factors associated with non-adherence include being older, female, having fewer years of formal education, perceived benefits of CR, having angina, and being less physically active during leisure time (Daly et al., 2002).
It has been reported Caucasians were more likely than minorities to report instruction to attend CR, and minorities were more likely to report financial barriers when compared with Caucasians. Ethnic variations should be reflective of the region; however, the data shows little variation among regions. Given the population in Michigan is 12 percent

8
Mic
higa
n Ca
rdia
c R
ehab
ilita
tion
Out
com
es |
20
10
repo
rt
African American, the rates of attendance to CR should be similar. However, Michigan’s data reflects only 5 percent CR utilization by African Americans in the most ethnically-diverse region in the state. These disparities need to be addressed, as minority women have a worse prognosis following hospitalization for CHD, and CR has been shown to improve survival rates (Mochari, Lee, Kligfield, & Mosca, 2006).
The diagnosis of patients entering CR reveals more of the traditional medical model of treatment based on an event or procedure and less of the prevention model. Stable angina patients, on the other hand, reflect a prevention model. Diagnosis demographics indicate the fewest patients seen are those with the diagnosis of stable angina, as compared with patients who have had an event or procedure. Unfortunately, challenges exist in meeting documented angina criteria to meet insurance coverage requirements, which may impact the number of patients enrolled with angina diagnosis.
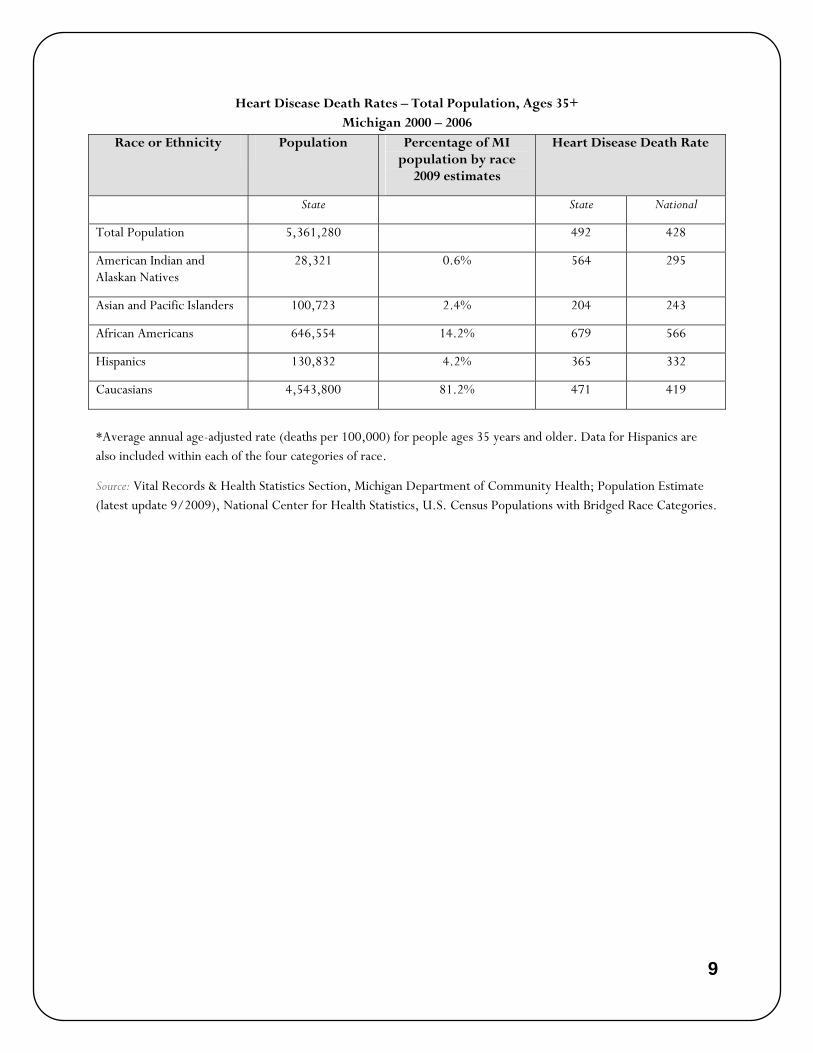
For reference purposes, the tables below indicate the Michigan statistics of the prevalence, demographics and distribution of heart disease within the state.
Age-Adjusted Heart Disease Death Rates by Race and Sex – Michigan (per 100,000)
257.4269.8
380.5
262
170.6181.5
0
50
100
150
200
250
300
350
400
450
All Races Caucasian African American
Male
Female
Source: Vital Records & Health Statistics Section, Michigan Department of Community Health; Population Estimate (latest update 9/2009), National Center for Health Statistics, U.S. Census Populations with Bridged Race Categories.
9
Heart Disease Death Rates – Total Population, Ages 35+ Michigan 2000 – 2006
Race or Ethnicity Population Percentage of MI population by race
2009 estimates
Heart Disease Death Rate
State State National
Total Population 5,361,280 492 428
American Indian and Alaskan Natives
28,321 0.6% 564 295
Asian and Pacific Islanders 100,723 2.4% 204 243
African Americans 646,554 14.2% 679 566
Hispanics 130,832 4.2% 365 332
Caucasians 4,543,800 81.2% 471 419
*Average annual age-adjusted rate (deaths per 100,000) for people ages 35 years and older. Data for Hispanics are also included within each of the four categories of race.
Source: Vital Records & Health Statistics Section, Michigan Department of Community Health; Population Estimate (latest update 9/2009), National Center for Health Statistics, U.S. Census Populations with Bridged Race Categories.

10
Mic
higa
n Ca
rdia
c R
ehab
ilita
tion
Out
com
es |
20
10
repo
rt
Recommendations
Data may be utilized by individual programs to identify hospital demographic trends of admissions/discharge diagnoses that should be eligible for referral to CR similar to national trends; CR is clearly underutilized, with significant geographical variations in referral rates and lower use in women, nonwhites, and older patients.
An opportunity exists for working with local community health departments, county health departments, and ethnic specific groups or clubs to promote the benefits of CR and tailor programs to meet the needs of diverse populations. The traditional delivery of CR should be revisited to determine if changes may help promote staff or program variation for improved service within disparate groups. Networking at the community and high school level (e.g., health fairs, college representatives, job fairs, allied health courses), as well as a re-structuring of traditional programs, may attract minorities for staffing CR programs, thus leading to a potential for improved referral to, participation in, and adherence to CR. Health literacy programs for minorities may strengthen racial and ethnic participation in CR as well.
There are creative opportunities to explore increased “women’s only” CR programs or sessions. Studies are being done to explore if programs exclusively for women provide better outcomes. One such study is the “Cardiac Rehabilitation for Heart Event Recovery (HER)” (CR4HER) from the University Health Network in Toronto, Canada. Another recent study showed depressive symptoms improved among women with coronary heart disease who participated in a motivationally-enhanced CR program exclusively for women, according to research presented abstract 1480 at the American Heart Association’s Scientific Sessions 2009 (American Heart Association, November 2009; http://www.newsroom.heart.org/index.php?s=43&item=863)
Performance measures are currently being applied to CR to measure the referral and enrollment rates of patients with appropriate diagnoses to CR programs. These measures should help address the physician’s role in following nationally recognized Class I guidelines for referring patients to CR.

11
DARTMOUTH COOP Objective
To measure the percent change in quality of life (perceived mental and physical functioning) from entry into Phase II CR (pre) to exit (post).
Standard of Measurement
The Dartmouth Coop (COOP) survey was given to each patient to complete prior to the first session of Phase II CR and prior to discharge. Patients were given written instructions for the survey without staff interpretation or opinion. The COOP is one of two quality of life measurement tools used in the Montana Outcomes Project, along with the SF-36. See Survey Thresholds in Appendix for proper scoring and recommended interventions for abnormal results.
Supporting Statement
Explicit goals of CR are to promote secondary prevention and improve health-related quality of life (HRQL) (McGee, et al. 1999). HRQL represents “the functional effect or impact of an illness and the consequent effect of therapy or intervention as perceived by the patient” (Hoefer, et al. 2004). It includes the physical, psychological and social domains of health. Functional status, which is a component of HRQL, “is considered to be an individual’s effective performance or ability to perform valued roles, tasks, or activities, such as going to work, playing sports, and maintaining the house” (Oldridge, 1997). As described by Brown (2003), “HRQL measures the effects of treatment on the outcome of greatest importance to patients.”
Measuring HRQL variables helps evaluate a patient’s progress toward health and away from disability and may provide information regarding physical or emotional problems that may limit a patient’s progress in CR, such as stress, depression, and arthritis, that may warrant treatment or special resources concurrently or prior to entry. They also display program effectiveness and can help drive quality assurance measures. These variables complement traditional biological and physiological measures of health status and have become an important and standard outcomes measurement in CR. Studies have shown that participation in a comprehensive CR program improves quality of life outcomes (Lavorato, et al.2003; McNamara, et al. 2009).
The Montana Outcomes Project criteria allow programs to choose one of two well studied, generic tools for measuring HRQL: the COOP and the SF-36. CR professionals should assess a patient’s quality of life via reliable tools such as COOP and work with the patient and available resources to improve quality of life (American College of Cardiovascular and Pulmonary Rehabilitation, 2004).
The COOP meets all of the requirements for an optimal generic tool to measure functional status and outcome of interventions (Bentsen, et al. 1999). The tool, which includes 9 questions, is simple, quick and easy to administer and perform. Each question takes about 30-45 seconds to answer. The pictures that accompany the questions are engaging and help with comprehension for those with limited vocabulary. The COOP can be quickly scored by office staff, rendering immediate results for patient feedback and comparison to previous scores or reference values (Bentsen et al., 1999). The COOP has been shown to have acceptable reliability and validity in a number of disease settings (Coons, et al. 2000; Nelson, et al. 1990; Eaton, et al. 2005; Van Weel, 1993; Beaufait, et al. 1992).

12
Mic
higa
n Ca
rdia
c R
ehab
ilita
tion
Out
com
es |
20
10
repo
rt
Results
Area
COOP
mean % change
National 23
Michigan 23
North 26
Southeast 19
Southwest 25
Source: Montana/Michigan 2008-2009 Outcomes Report
Overall Michigan had a mean percent change of 23%, which was equal to the national benchmark. The North and Southwest regions were above the national average, while the Southeast had similar but lower mean percent change.
Discussion
COOP results are reported as a percent improvement in perceived functional status from baseline. The National and Michigan reported improvement of 23 percent is regarded by the committee as a favorable and realistic improvement in functional status during the course of an 18-24 visit stay in CR. This is consistent with what literature has shown; CR does improve HRQL (Lovorato et al., 2003; McNamara et al., 2009).
Limitations
Even though the COOP is attractive for its brevity and practicality in quickly and ably measuring patient function, it does not possess the degree of sensitivity of a longer tool, such as the SF-36 (Dartmouth CO-OP Project, 2010).
Researchers of the project have recommended reporting actual “raw scores” pre and post CR in addition to percent change. Identifying the prevalence of normal entry values may account for lower percent mean changes, as well as statistical significance. Reviewing the number of abnormal scores at exit helps identify and quantify the areas in need of QI. COOP scores >25 have been agreed upon by the outcomes project workgroup to require practitioner follow-up (see Thresholds Document in appendix).
Recommendations
The COOP is an acceptable tool to use in the CR setting to measure functional status and HRQL. Abnormal scores can be used to trigger referral to a behavioral specialist or initiate a more comprehensive evaluation of physical, mental or health-related limitations where applicable.

13
SF-36 Objective
To measure the percent change in quality of life (perceived mental and physical functioning) from entry into Phase II CR (pre) to exit (post).
Standard of Measurement
The SF-36 (Version 2) was given to patients to complete prior to the first session of Phase II CR and prior to discharge. Patients were given written instructions for the survey without staff interpretation or opinion. The SF-36 is one of two health-related quality of life (HRQL) measurement tools used in the Montana Outcomes Project, along with the COOP. See Survey Thresholds document in Appendix for proper scoring and recommended interventions for abnormal results.
Supporting Statement
Explicit goals of CR are to promote secondary prevention and improve HRQL (McGee et al., 1999). HRQL represents “the functional effect or impact of an illness and the consequent effect of therapy or intervention as perceived by the patient” (Hoefer et al. 2004). It includes the physical, psychological and social domains of health. Functional status, which is a component of HRQL, “is considered to be an individual’s effective performance or ability to perform valued roles, tasks, or activities, such as going to work, playing sports, and maintaining the house” (Oldridge, 1997). As described by Brown (2003) “HRQL measures the effects of treatment on the outcome of greatest importance to patients.”
Measuring HRQL variables helps evaluate a patient’s progress toward health and away from disability. It can provide information regarding physical or emotional problems that may limit a patient’s progress in CR, such as stress, depression, and arthritis that may warrant treatment or special resources concurrently or prior to entry. It can also be used to track program effectiveness and help drive quality assurance measures. These variables complement traditional biological and physiological measures of health status and have become an important and standard outcomes measurement in CR. Studies have shown that participation in a comprehensive CR program improves quality of life outcomes (Lavorato, et al. 2003; McNamara, et al. 2009).
The Montana Outcomes Project criteria allow programs to choose one of two well studied, generic tools for measuring HRQL: the COOP and the SF-36. CR professionals should assess a patient’s quality of life via reliable tools such as SF-36, and work with the patient and available resources to improve quality of life (American College of Cardiovascular and Pulmonary Rehabilitation (AACVPR), 2004).
The SF-36 is one of the most widely used and studied generic patient health assessment tools available (Lavorato, et al., 2003; Ware, 2000). It is deemed valid and reliable in estimating the burden of CVD and other diseases, and is sensitive in evaluating the benefits of various treatments such as CR (Failde & Ramos, 2000; Ware, 2000; Brown, 2003; Cruz, et al. 2009; Coons, et al. 2000). It measures eight health concepts and one item on perceived change in health. Instead of one overall score, the scores are summarized to present a two-factor model of health: physical health and mental health.
14
Mic
higa
n Ca
rdia
c R
ehab
ilita
tion
Out
com
es |
20
10
repo
rt
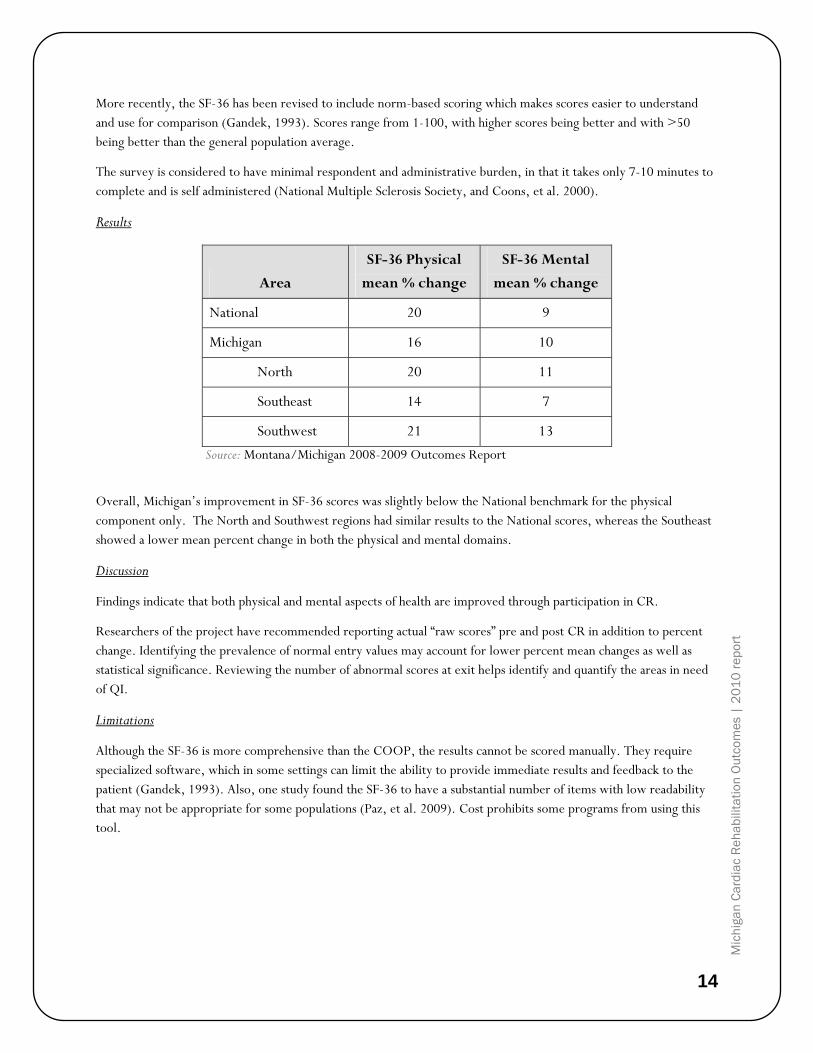
More recently, the SF-36 has been revised to include norm-based scoring which makes scores easier to understand and use for comparison (Gandek, 1993). Scores range from 1-100, with higher scores being better and with >50 being better than the general population average.
The survey is considered to have minimal respondent and administrative burden, in that it takes only 7-10 minutes to complete and is self administered (National Multiple Sclerosis Society, and Coons, et al. 2000).
Results
Area
SF-36 Physical
mean % change
SF-36 Mental
mean % change
National 20 9
Michigan 16 10
North 20 11
Southeast 14 7
Southwest 21 13
Source: Montana/Michigan 2008-2009 Outcomes Report
Overall, Michigan’s improvement in SF-36 scores was slightly below the National benchmark for the physical component only. The North and Southwest regions had similar results to the National scores, whereas the Southeast showed a lower mean percent change in both the physical and mental domains.
Discussion
Findings indicate that both physical and mental aspects of health are improved through participation in CR.
Researchers of the project have recommended reporting actual “raw scores” pre and post CR in addition to percent change. Identifying the prevalence of normal entry values may account for lower percent mean changes as well as statistical significance. Reviewing the number of abnormal scores at exit helps identify and quantify the areas in need of QI.
Limitations
Although the SF-36 is more comprehensive than the COOP, the results cannot be scored manually. They require specialized software, which in some settings can limit the ability to provide immediate results and feedback to the patient (Gandek, 1993). Also, one study found the SF-36 to have a substantial number of items with low readability that may not be appropriate for some populations (Paz, et al. 2009). Cost prohibits some programs from using this tool.
15
Recommendations
The SF-36 is an acceptable tool to use in the CR setting. Along with measuring pre and post improvements in functional status and quality of life, abnormal scores can be used to trigger referral to a behavioral specialist or initiate further evaluation of physical limitations where applicable.
General health, social functioning, and vitality have noteworthy correlations with both the physical and mental health components and should be evaluated individually as well. It is recommended that CR professionals assess patient’s HRQL and assist where necessary to provide resources to improve social, physical, mental, or role function (AACVPR, 2004).

16
Mic
higa
n Ca
rdia
c R
ehab
ilita
tion
Out
com
es |
20
10
repo
rt
BLOOD PRESSURE AT GOAL Objective
To document the percentage of CR patients who have reached the goal criteria for resting blood pressure (BP). Goal BP for patients with diabetes and/or chronic kidney disease is <130/80 mmHg. For all other patients, goal BP is <140/90 mmHg.
Standard of Measurement
The average of the last three resting pre-exercise BP is used to determine if the patient meets control criteria.
During BP measurement, patients should be in a seated position without legs crossed. BP should be taken in the arm that historically elicits the highest reading. BP measurement should be taken after a five-minute period of sitting quietly. Appropriate cuff size for patient’s arm and calibrated equipment should be used.
Supporting Statement
BP levels represent a strong, consistent, continuous, independent, and etiologically relevant risk factor for cardiovascular and renal disease. Optimal control of BP has a beneficial impact on lowering cardiovascular risk (Smith, et al. 2006; American Diabetes Association (ADA), 2003). Increasing the awareness, treatment, and control of hypertension can reduce morbidity and mortality, and is a goal of national public health programs and initiatives, such as the National High Blood Pressure Education Program (National Heart Lung and Blood Institute (NHLBI), 2002). PUBLICATION
High BP is a significant risk factor for CVD. Studies have shown that antihypertensive therapies have been associated with a 35 – 40 percent reduction in stroke incidence, a 20 – 25 percent reduction in heart attack and more than 50 percent reduction in heart failure (Anderson, et al. 2008; U.S. Department of Health and Human Services (DHHS), 2000).
CR programs have adopted one of the MDCH goals to increase the percentage of adults who have their BP under control to effectively reduce cardiovascular and renal morbidity and mortality. Since most persons with hypertension, especially those >50 years of age, will reach the diastolic BP (DBP) goal once the systolic BP (SBP) goal is achieved, the primary focus should be on attaining the SBP goal. It is estimated that in patients with stage 1 hypertension (SBP 140–159 mmHg and/or DBP 90–99 mmHg) and additional cardiovascular risk factors, achieving a sustained 12 mmHg reduction in SBP over 10 years will prevent 1 death for every 11 patients treated. In the added presence of CVD or target organ damage, only 9 patients would require such BP reduction to prevent 1 death (Ogden, et al. 2000).
Therapeutic lifestyle changes (TLC) are an integral teaching approach used in CR to reduce cardiovascular risk (NHLBI, 2004). CR strategies also include the JNC7 promotion of adopting a healthy lifestyle. For more than three decades, the National Heart, Lung, and Blood Institute (NHLBI) has coordinated the National High Blood Pressure Education Program (NHBPEP), a coalition of 39 major professional, public, and voluntary organizations and seven Federal Agencies. They are referred to as the Joint National Committee and an important role they provide is to issue guidelines and advisories designed to increase awareness, prevention, treatment, and control of hypertension (high

17
blood pressure (BP). These initiatives are critical for the prevention and management of high BP and are an indispensable part of the management of those with hypertension (Whelton, et al. 2002). Michigan was ranked the 17th worst state for prevalence of high BP in 2007. Lifetime prevalence of high BP increased between 2001 and 2007 in the United States and Michigan (Anderson, et al. 2008).
Results
Area
% CR Participants
at Goal
National 86
Michigan 85
North 85
Southeast 86
Southwest 83
Source: Montana/Michigan 2008-2009 Outcomes Report
Discussion
Although data is similar in all regions, it is below the expected goal of achieving adequate BP control for all patients based on JNC 7 goals. CR programs should adopt consistent messaging and training resources, such as the materials offered at the High Blood Pressure University (www.michigan.gov/hbpu) through MDCH.
On a state level, the MSCVPR Outcomes Committee has chosen to promote BP as a QI initiative (see Stories from the Field—Bronson Methodist Hospital in Appendix N).
Limitations
The accuracy of BP readings can be influenced by a number of factors, including accurate cuff size, manual or automated cuff use, arm height, seated posture, true resting state, and avoidance of talking, caffeine, or tobacco use. Given these variables, it is challenging to ensure all programs are following the identical protocol. An attempt to reduce this discrepancy was made by offering all participating programs identical educational materials regarding BP protocols. MDCH made the High Blood Pressure University materials available to all, and highlighted these during a teleconference with participants.

18
Mic
higa
n Ca
rdia
c R
ehab
ilita
tion
Out
com
es |
20
10
repo
rt
Recommendations
Clear communication with referring physicians should be made to prompt changes in medical management when appropriate. A standard process, such as a letter to physicians identifying poorly controlled BP, would be helpful, and will be implemented in the future. Patients should be educated on their role in lowering BP through diet, exercise, medication compliance, and limiting caffeine and alcohol. Ongoing assessment and modifications of the intervention until normalization of BP are recommended. The JNC-7 states lifestyle modifications, such as weight reduction, physical activity, and modification of dietary sodium, should be recommended by practitioners as definitive or adjunctive therapy for hypertension (Whelton, et al. 2002).

19
BODY MASS INDEX
Objective
To measure the percent mean change of body mass index (BMI) from entry (pre) to exit (post) CR.
Standard of Measurement
BMI is the most widely accepted method of determining overall body fatness. It is calculated as weight in kilograms divided by height in meters squared: weight (kg) height (m2). Overweight is specifically defined as a BMI of 25.0-29.9. A BMI of ≥ 30.0 is considered obese.
For measurement of BMI, the height (inches) and weight (lbs) in stocking feet are obtained at the first CR session, and weight is re-measured at the last CR session using the same scale.
Participants with a BMI of < 25 were not included for analysis to ensure that only those participants needing to lose weight are included (i.e., those with normal BMI are excluded from analysis).
Supporting Statement
Obesity is an independent risk factor for CVD and adversely affects CVD risk factors such as hypertension, dyslipidemia, diabetes, stroke, and other chronic diseases (Lichtenstein et al., 2006).
Results
Area
% Mean
Change in BMI
National 1%
Michigan 1%
Northern 1%
Southeast 1%
Southwest 1%
Source: Montana/Michigan 2008-2009 Outcomes Report
The mean ± SD BMI for Michigan was 30.13 ± 5.91, with 82 percent of participants being overweight and/or obese (BMI ≥ 25).
Discussion
Education as a sole intervention is unlikely to achieve and maintain weight loss. Multifactor CR involving dietary education, counseling, and behavioral interventions designed to reduce body weight can help participants lose weight (Haskell et al., 1994). By adhering to diet and lifestyle recommendations, participants may substantially reduce their risk of CVD (Lichtenstein et al., 2006). Percent change reflects a positive improvement in mean BMI of 1 percent.
20
Mic
higa
n Ca
rdia
c R
ehab
ilita
tion
Out
com
es |
20
10
repo
rt
Limitations
The length of current CR program (approximately 18 sessions) is a significant limitation, as this timeframe is not a long enough window to see weight loss. Furthermore, BMI does not reflect changes in body composition which may be occurring when initiating an exercise program. Consideration of an additional measurement for assessing improvements in body composition, such as waist circumference or changes in fat-free mass or fat mass may highlight positive changes despite lack of change in BMI.
Recommendations
Short-term recommendations for weight management include providing referral to specialized, medically supervised weight loss programs if weight goals are not achieved, as well as continued assessment and modification of interventions until progressive weight loss is achieved. Long-term recommendations include adherence to diet and physical activity/exercise programs aimed toward attainment of established weight goal (Thomas, et al. 2007).
Extension of CR sessions from 18 to 36 sessions could aid in larger weight losses. (Savage, et al. 2003).
Furthermore, Follow-up programs at 1-, 6-, and 12-month intervals have shown greater improvements in weight loss. See Stories from the Field-University of Michigan, Ann Arbor in Appendix N.

21
LDL AT GOAL & USE OF PRESCRIPTION LIPID LOWERING MEDICATIONS
Objective
To measure the percentage of CR patients who meet the low-density lipid (LDL) goal criteria of < 100ml/dL.
To measure the percentage of patients who are taking lipid lowering medications (LLM) to optimize control of blood lipid levels.
Standard of Measurement
Only LDL measurements post-hospitalization are being reported. Medication utilization, as well as any contraindications to LLM, are collected at the initial visit and updated prior to program completion.
Supporting Statement LDL at Goal
According to the National Cholesterol Education Program Adult Treatment Panel III Guidelines (ATP III), LDL cholesterol (LDL-C) is a major risk factor for CVD and is identified as the “primary target” for directing lipid-lowering therapy (NHLBI, 2002). Subsequent to ATP III, there have been five major clinical statin trials, four of which further support the fact that lowering LDL-C significantly reduces the risk of CHD and cardiac events (Heart Protection Study Collaborative Group, 2002; Shepherd et al., 2002; ALLHAT Officers and Coordinators, 2002; Sever et al., 2003; Cannon et al. as citied in Grundy et al., 2004). Hence, the original ATP III guidelines have been updated to reflect these newest findings.
Guidelines for indicating and dosing LDL-C therapies are based on risk category for future events. Patients with known CAD or CAD-equivalents such as diabetes are considered high risk and therefore encompass the majority of CR patients (with the exception of valve repair and replacement and idiopathic CHF). With this in mind, the updated ATP III guidelines for high risk patients have been used as the basis for the Montana/Michigan Outcomes goal value of 100 mg/dL for LDL-C.
ATP III updated guidelines acknowledge that in some cases, especially very high risk patients, an LDL-C goal of 70mg/dL has been shown to further lower risk and should be considered a therapeutic option. Very high risk patients include those with 1) multiple major risk factors (especially diabetes); 2) severe and poorly controlled risk factors (especially continued cigarette smoking); 3) multiple risk factors of metabolic syndrome (especially high triglycerides >200 mg/dL); and 4) acute coronary syndromes. However, several clinical trials that are currently in progress need to be finalized before this treatment option can become a recommendation (Waters et al. as cited in Grundy et al., 2004). Therefore, at this time, the Michigan/Montana Outcomes LDL-C goal remains at 100 mg/dL, in accordance with the most recent ATP III treatment algorithm for lipid lowering therapy.
Supporting Statement, Use of Prescription Lipid Lowering Medications
It is well established that statin medications are key to lowering LDL-C, which in turn dramatically lowers CAD risk. Studies have shown that standard doses of statins can lower LDL-C by 30-40 percent, and the goal value of 100mg/dL can be reached with standard dosing in more than half of the population. However, for the remaining population to reach an LDL-C of 100 mg/dL, standard doses must be increased, or a second lipid-lowering agent must be prescribed (National Cholesterol Education Program, 2002; Grundy et al., 2004; O’Keefe, et al. 2006).
22
Mic
higa
n Ca
rdia
c R
ehab
ilita
tion
Out
com
es |
20
10
repo
rt
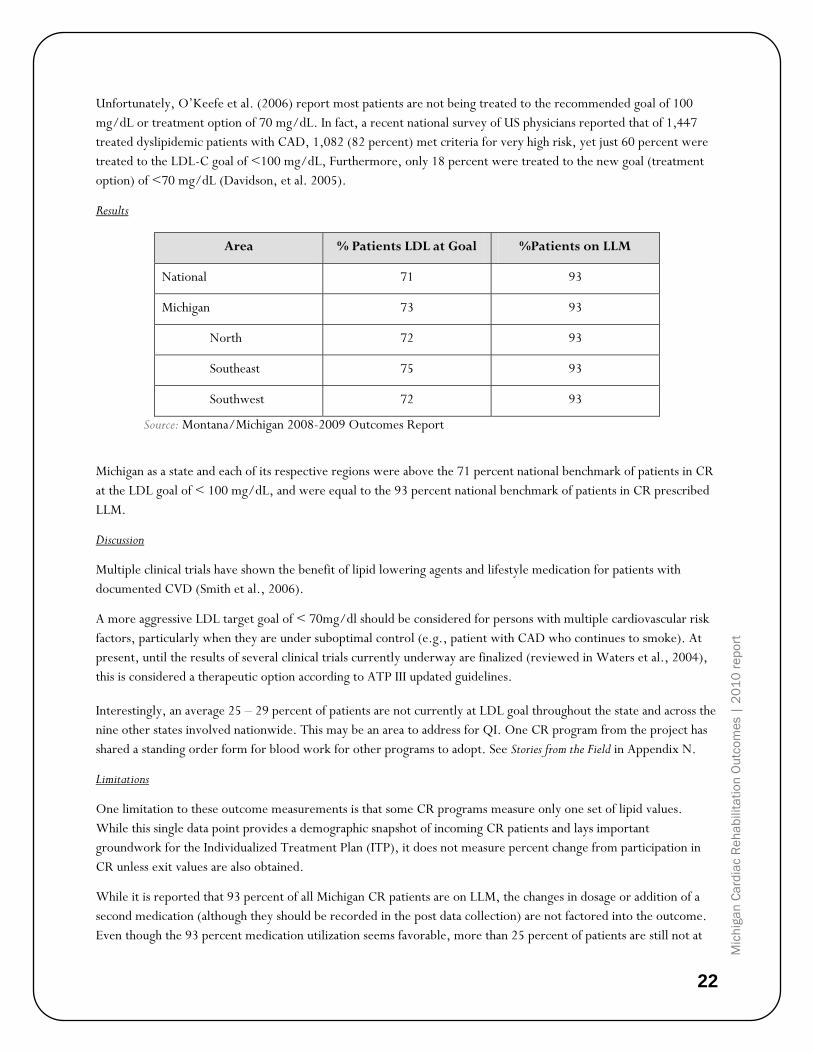
Unfortunately, O’Keefe et al. (2006) report most patients are not being treated to the recommended goal of 100 mg/dL or treatment option of 70 mg/dL. In fact, a recent national survey of US physicians reported that of 1,447 treated dyslipidemic patients with CAD, 1,082 (82 percent) met criteria for very high risk, yet just 60 percent were treated to the LDL-C goal of <100 mg/dL, Furthermore, only 18 percent were treated to the new goal (treatment option) of <70 mg/dL (Davidson, et al. 2005).
Results
Area % Patients LDL at Goal %Patients on LLM
National 71 93
Michigan 73 93
North 72 93
Southeast 75 93
Southwest 72 93
Source: Montana/Michigan 2008-2009 Outcomes Report
Michigan as a state and each of its respective regions were above the 71 percent national benchmark of patients in CR at the LDL goal of < 100 mg/dL, and were equal to the 93 percent national benchmark of patients in CR prescribed LLM.
Discussion
Multiple clinical trials have shown the benefit of lipid lowering agents and lifestyle medication for patients with documented CVD (Smith et al., 2006).
A more aggressive LDL target goal of < 70mg/dl should be considered for persons with multiple cardiovascular risk factors, particularly when they are under suboptimal control (e.g., patient with CAD who continues to smoke). At present, until the results of several clinical trials currently underway are finalized (reviewed in Waters et al., 2004), this is considered a therapeutic option according to ATP III updated guidelines.
Interestingly, an average 25 – 29 percent of patients are not currently at LDL goal throughout the state and across the nine other states involved nationwide. This may be an area to address for QI. One CR program from the project has shared a standing order form for blood work for other programs to adopt. See Stories from the Field in Appendix N.
Limitations
One limitation to these outcome measurements is that some CR programs measure only one set of lipid values. While this single data point provides a demographic snapshot of incoming CR patients and lays important groundwork for the Individualized Treatment Plan (ITP), it does not measure percent change from participation in CR unless exit values are also obtained.
While it is reported that 93 percent of all Michigan CR patients are on LLM, the changes in dosage or addition of a second medication (although they should be recorded in the post data collection) are not factored into the outcome. Even though the 93 percent medication utilization seems favorable, more than 25 percent of patients are still not at

23
the conservative goal of 100 mg/dL, suggesting that patient compliance and/or proper medication usage could be improved or studied.
Recommendations
The goals of lipid management in CR are to 1) identify patients entering CR who are not at the LDL-C goal value of
< 100 mg/dL; 2) identify patients who qualify for but are not on LLM; 3) communicate to the referring physicians those patients outside the LDL-C goal who could benefit from more aggressive dosing of statin drugs or additional medications as warranted and track the follow-up; 4) educate patients about therapeutic lifestyle changes (TLC) and 5) assess and reinforce compliance with medication regimen.
The short-term recommendation for lipid management is continued assessment and modification of intervention until LDL <100 mg/dL is achieved (further reduction to a goal <70 mg/dL is considered reasonable).
The long-term recommendation for lipid management is to maintain LDL <100 mg/dL (further reduction to a goal <70 mg/dL is considered reasonable).
MDCH has committed to working with the MSCVPR and the Outcomes Committee in 2011 to develop and distribute educational materials on lipid-lowering management in CR.
24
Mic
higa
n Ca
rdia
c R
ehab
ilita
tion
Out
com
es |
20
10
repo
rt
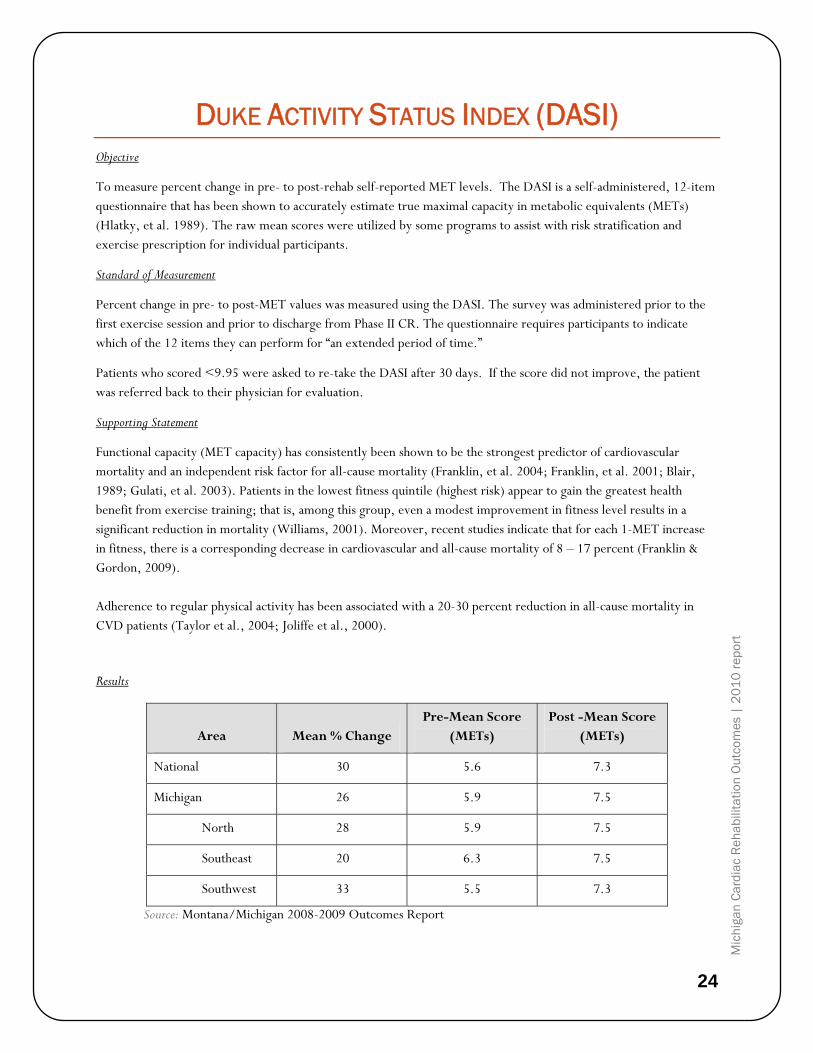
DUKE ACTIVITY STATUS INDEX (DASI) Objective
To measure percent change in pre- to post-rehab self-reported MET levels. The DASI is a self-administered, 12-item questionnaire that has been shown to accurately estimate true maximal capacity in metabolic equivalents (METs) (Hlatky, et al. 1989). The raw mean scores were utilized by some programs to assist with risk stratification and exercise prescription for individual participants.
Standard of Measurement
Percent change in pre- to post-MET values was measured using the DASI. The survey was administered prior to the first exercise session and prior to discharge from Phase II CR. The questionnaire requires participants to indicate which of the 12 items they can perform for “an extended period of time.”
Patients who scored <9.95 were asked to re-take the DASI after 30 days. If the score did not improve, the patient was referred back to their physician for evaluation.
Supporting Statement
Functional capacity (MET capacity) has consistently been shown to be the strongest predictor of cardiovascular mortality and an independent risk factor for all-cause mortality (Franklin, et al. 2004; Franklin, et al. 2001; Blair, 1989; Gulati, et al. 2003). Patients in the lowest fitness quintile (highest risk) appear to gain the greatest health benefit from exercise training; that is, among this group, even a modest improvement in fitness level results in a significant reduction in mortality (Williams, 2001). Moreover, recent studies indicate that for each 1-MET increase in fitness, there is a corresponding decrease in cardiovascular and all-cause mortality of 8 – 17 percent (Franklin & Gordon, 2009). Adherence to regular physical activity has been associated with a 20-30 percent reduction in all-cause mortality in CVD patients (Taylor et al., 2004; Joliffe et al., 2000). Results
Area Mean % Change Pre-Mean Score
(METs) Post -Mean Score
(METs)
National 30 5.6 7.3
Michigan 26 5.9 7.5
North 28 5.9 7.5
Southeast 20 6.3 7.5
Southwest 33 5.5 7.3
Source: Montana/Michigan 2008-2009 Outcomes Report

25
Throughout Michigan’s regions (from entry to exit), the percent mean change in the self-reported DASI score ranged from 20 – 33 percent. The average mean improvement in the raw DASI score was 1.6. This is indicative of an estimated average functional capacity improvement of 1.6 METs overall for Michigan programs, which was similar to the National average improvement of 1.7 METs. The Southeast region participants had the highest pre-mean score and showed the lowest percent mean change of all the regions. Conversely, the Southwest region participants had the lowest pre-mean score and demonstrated the highest percent change in estimated functional capacity. These findings are consistent with known dose-response relationships where low-fit individuals demonstrate higher relative functional gains when adopting new exercise programs.
Discussion
Michigan’s DASI outcome is similar to the National outcome value; that is, Phase II CR participants are consistently achieving a 1-2 MET improvement in functional capacity during an average duration of 20 sessions. This data demonstrates that CR programs are effective in moving patients from the moderate risk (5-6.9 METs) to lowest risk (> 7.0 METs) stratification and more importantly, may move their least fit participants from the highest risk (< 5.0 METs) to moderate risk (5-6.9 METs) category to effectively reduce mortality.
Limitations
Because the DASI is a self-reported survey, caution must be employed when utilizing results for clinical purposes (i.e. risk stratification, exercise prescription). DASI values should be guidelines for these uses, not absolute indicators for risk status classification or exercise intensity.
Recommendations
As the data is currently obtained and reported, it serves as a general, but subjective gauge of one of the cornerstone goals of any CR program: improvement in functional capacity. By utilizing percent change DASI values, programs can gain an understanding of average MET improvement of their participants. This facilitates process improvement/QI programs to continue to ensure quality outcomes for each patient. Raw mean DASI scores offer program staff an additional and useful tool for estimating risk stratification and appropriate exercise intensity. Moving forward, a more
objective measurement of functional capacity (i.e., VO2 measurement) would be even more useful in classifying risk, prescribing exercise, and would more accurately measure patient outcomes.
Prior to completion of the CR program, change in exercise capacity is re-assessed and communicated to the patient as well as to the primary care provider and/or cardiologist. (Thomas et al 2007)
26
Mic
higa
n Ca
rdia
c R
ehab
ilita
tion
Out
com
es |
20
10
repo
rt
HEMOGLOBIN A1C (HBA1C) TEST COMPLETED Objective
To measure the percentage of CR patients who have diabetes and have had an HbA1c test measured within 6 months of entry into Phase II Cardiac rehabilitation.
Standard of Measurement
Hemoglobin A1c represents long-term blood glucose control over the preceding 2-3 months and is used to evaluate treatment efficacy. According to the American Diabetes Association (ADA) classification system, the HbA1c goal for patients in general is <7% (ADA, Standards of medical care in diabetes, 2007). The ADA guidelines for HbA1c recommend performing the test 2 times per year in patients who are meeting treatment goals, and quarterly in patients whose therapy has changed or who are not meeting glycemic goals.
Supporting Statement
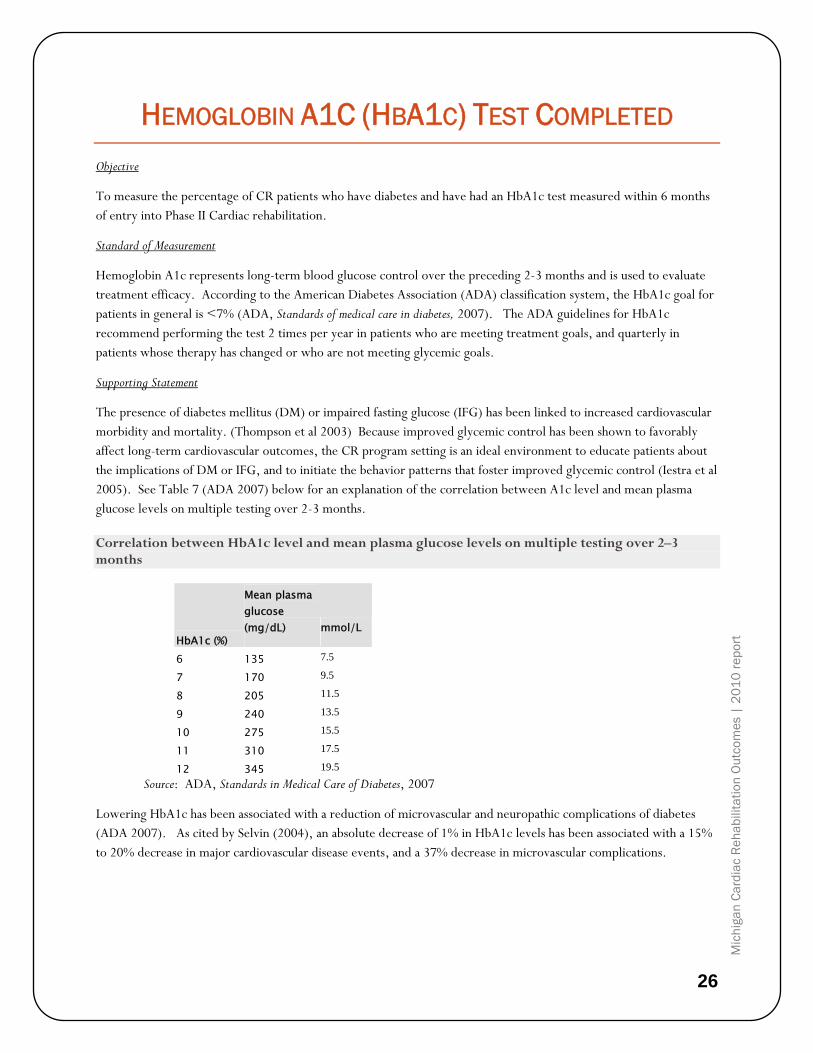
The presence of diabetes mellitus (DM) or impaired fasting glucose (IFG) has been linked to increased cardiovascular morbidity and mortality. (Thompson et al 2003) Because improved glycemic control has been shown to favorably affect long-term cardiovascular outcomes, the CR program setting is an ideal environment to educate patients about the implications of DM or IFG, and to initiate the behavior patterns that foster improved glycemic control (Iestra et al 2005). See Table 7 (ADA 2007) below for an explanation of the correlation between A1c level and mean plasma glucose levels on multiple testing over 2-3 months.
Correlation between HbA1c level and mean plasma glucose levels on multiple testing over 2–3 months
HbA1c (%)
Mean plasma glucose (mg/dL) mmol/L
6 135 7.5
7 170 9.5
8 205 11.5
9 240 13.5
10 275 15.5
11 310 17.5
12 345 19.5
Source: ADA, Standards in Medical Care of Diabetes, 2007
Lowering HbA1c has been associated with a reduction of microvascular and neuropathic complications of diabetes (ADA 2007). As cited by Selvin (2004), an absolute decrease of 1% in HbA1c levels has been associated with a 15% to 20% decrease in major cardiovascular disease events, and a 37% decrease in microvascular complications.
27
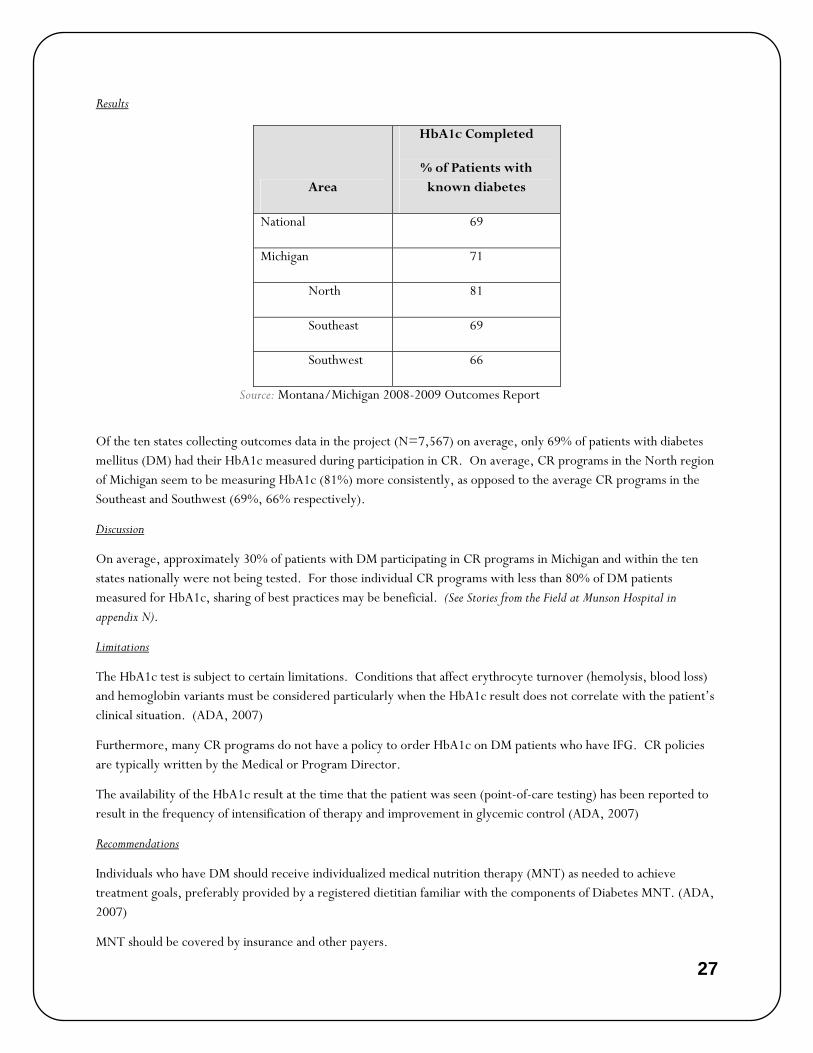
Results
Area
HbA1c Completed
% of Patients with known diabetes
National 69
Michigan 71
North 81
Southeast 69
Southwest 66
Source: Montana/Michigan 2008-2009 Outcomes Report
Of the ten states collecting outcomes data in the project (N=7,567) on average, only 69% of patients with diabetes mellitus (DM) had their HbA1c measured during participation in CR. On average, CR programs in the North region of Michigan seem to be measuring HbA1c (81%) more consistently, as opposed to the average CR programs in the Southeast and Southwest (69%, 66% respectively).
Discussion
On average, approximately 30% of patients with DM participating in CR programs in Michigan and within the ten states nationally were not being tested. For those individual CR programs with less than 80% of DM patients measured for HbA1c, sharing of best practices may be beneficial. (See Stories from the Field at Munson Hospital in appendix N).
Limitations
The HbA1c test is subject to certain limitations. Conditions that affect erythrocyte turnover (hemolysis, blood loss) and hemoglobin variants must be considered particularly when the HbA1c result does not correlate with the patient’s clinical situation. (ADA, 2007)
Furthermore, many CR programs do not have a policy to order HbA1c on DM patients who have IFG. CR policies are typically written by the Medical or Program Director.
The availability of the HbA1c result at the time that the patient was seen (point-of-care testing) has been reported to result in the frequency of intensification of therapy and improvement in glycemic control (ADA, 2007)
Recommendations
Individuals who have DM should receive individualized medical nutrition therapy (MNT) as needed to achieve treatment goals, preferably provided by a registered dietitian familiar with the components of Diabetes MNT. (ADA, 2007)
MNT should be covered by insurance and other payers.

28
Mic
higa
n Ca
rdia
c R
ehab
ilita
tion
Out
com
es |
20
10
repo
rt
In overweight and obese insulin-resistant individuals, modest weight loss has been shown to reduce insulin-resistance. Thus weight loss is recommended for all overweight or obese individuals who have or are at risk for diabetes. (ADA, 2007)
Among patients with type 2 DM, a combination of aerobic and resistance training compared with a non-exercise control group improved HbA1c levels; this was not achieved by aerobic or resistance training alone. (Church. et al, 2010)
Patients and staff need to be alert for signs and symptoms of hypoglycemia or hyperglycemia, and provide appropriate assessment and interventions. Teach and practice self-monitoring skills for use during unsupervised exercise. CR staffs are recommended to coordinate care with patient’s primary care physician or endocrinologist. (AHA/AACVPR Scientific Statement: Core components of Cardiac Rehab/Secondary Prevention Programs: 2007 Update)

29
PATIENT SMOKING STATUS Objective
To measure percent change in entry to exit smoking status for CR patients.
Standard of Measurement
Pre-smoking status is defined as the patient’s smoking status one month prior to their cardiac event. Post-smoking status is defined as the patient’s smoking status during the last half of their total CR duration. Smoking status was evaluated at the first interview and prior to patient discharge from CR.
Supporting Statement
There have been several studies showing that smoking is one of the most important modifiable risk factors for reducing risk of future cardiac events. Persons with CVD who stop smoking reduce their cardiovascular risk by approximately 35 percent (Iestra, et al., 2005; Balady, et al., 2007). According to Goldenberg et al. (2003), among 370 CAD patients who were current smokers, 8.1 percent experienced sudden cardiac death. Conversely, those patients who had stopped smoking experienced a significant reduction in sudden cardiac death risk. In another study done by Gerber et al. (2009), 1,500 patients with varying tobacco use were followed after experiencing their first MI. Those patients who quit tobacco prior to their MI had a 50 percent reduction of a future event, and of those who quit after their MI had a 37 percent reduction in risk. Furthermore, even reducing the number of cigarettes smoked per day was effective for improving prognosis (reducing 5 cigarettes smoked per day resulted in an 18 percent reduction in risk) (Gerber, et al. 2009). The effects of serum lipid profile as a result of smoking are also well established, specifically the negative effects on HDL and LDL. Smoking can also cause coronary spasms, adversely affect Beta-antagonist drug effects, and increase mortality rate in post-MI patients (Erhman, et al. 2003).
Results
Area
% Smokers
at Entry
% Smokers
at Exit
National 12 4
Michigan 13 4
North 13 5
Southeast 12 4
Southwest 13 3
Source: Montana/Michigan 2008-2009 Outcomes Report
Discussion
Nationally, reductions in smoking rates during CR are similar. However, although any reduction in smoking percentage is significant, the ultimate goal is to achieve complete cessation of all current smokers in CR.

30
Mic
higa
n Ca
rdia
c R
ehab
ilita
tion
Out
com
es |
20
10
repo
rt
Limitation
Simply knowing the percentage of smokers in a given program at a given time does not have direct impact on cessation rate. However, it does show the effectiveness of programs and/or regions to help patients quit, as well as improvement within a given program and/or region. Also, exposure to second-hand smoke is not recorded.
Recommendations
The following is recommended by the AHA/AACVPR Statement on Tobacco Use:
Short-term: Patient will demonstrate readiness to change by initially expressing decision to quit and selecting a quit date. Subsequently, patients will quit smoking and all tobacco use, adhere to pharmacological therapy (if prescribed), and practice relapse prevention strategies. Patient will resume cessation plan as quickly as possible when temporary relapse occurs.
Long-term: Complete abstinence from smoking and use of all tobacco products for at least 12 months (maintenance) from quit date
Continued behavioral management is important because of the high rate of relapse of smokers who quit (up to 50 percent within 1 year) (Erhman, et al. 2003). Incorporating a follow-up program for these patients to help with continued support is a logical recommendation, as is typical with most smoking cessation programs run within hospitals. CR programs should provide educational materials and send referrals to smoking cessation programs. Communication with referring physicians is also important so smoking cessation medications can be prescribed as deemed necessary.

31
DIETARY FAT SCREENER Objective
To measure the percent change in patients’ self-reported dietary habits; specifically, total fat intake.
Standard of Measurement
The measurement consisted of percent change in pre- to post-Block Dietary Fat Screener scores. The survey was administered prior to the first exercise session and prior to discharge from Phase II CR. The pre-test asked participants to focus on their diet history over the past year; the post-test asked participants to focus on their diet history over the past month.
Patients who scored >15 on the initial survey were referred to nutrition counseling and/or encouraged to attend CR nutrition patient education classes, if available.
Supporting Statement
The current national guidelines recommend 20 – 35 percent of daily dietary intake come from fat, and less than 7 percent from saturated fat (NHLBI, 2002). Healthy diets, high in fruit, vegetables, and fiber, and conversely low in saturated and trans-fat, have been shown to be associated with better overall health outcomes, including a lower incidence of heart disease (Ammerman, et al. 2002). A balanced caloric intake, physical activity, and choosing a diet that is rich in fish, vegetables, fruits, whole grain, high fiber foods, and foods with reduced amounts of saturated fat, cholesterol and salt have been suggested by the AHA 2006 Diet and Lifestyle Recommendations for CVD Risk Reduction (Lichtenstein, et al. 2006).
Results
Area Mean % change
National 26
Michigan 24
North 27
Southeast 20
Southwest 33
Source: Montana/Michigan 2008-2009 Outcomes Report
These results indicate a range of pre- to post-mean change improvement of 20 – 33 percent in Michigan’s regions. The overall percentage improvement for the state (24) compares well to the National mean change of 26 percent.

32
Mic
higa
n Ca
rdia
c R
ehab
ilita
tion
Out
com
es |
20
10
repo
rt
Discussion
For CR staff, Block Dietary Fat Screener results have implications in the type and intensity of dietary counseling offered to individual participants. An intervention plan is typically set up with a dietician to address target goals, dietary patterns, behavior change, and physical activity requirements.
Limitations
Because the survey is self-reported and recall-based, dietary fat intake may have been underestimated. The usefulness and applicability of the survey depended on the extent of follow-up with each patient; without thorough discussion with the participant, raw scores would have no impact on outcomes. The strength of the percentage mean change is limited unless the actual raw scores are known to determine statistical significance. Percent mean change does not take into account if a patient had a pre-score that was normal and remained normal.
This particular screening tool does not account for nuts, which contain healthy fats recommended to support cardiovascular health.
Only “total” fat, and not percent calories from “saturated” fats, are calculated in this algorithm used by the project. A breakdown of percentage calories from saturated fats is available but was not chosen to be used due to time constraints.
Recommendations
Each program should follow a standardized algorithm that, depending on the patient’s dietary intake status and BMI, results in an appointment with a registered dietitian, participation in a weight loss program, regular dietary lectures, or a short follow-up consultation with exercise or nursing staff. Unfortunately, Michigan’s current financial environment has caused many programs to consider (or make) reductions in non-essential, ancillary staff such as dietitians and social workers. Without these valuable resources, CR staff members need to embrace a larger role in basic dietary counseling and/or, if possible, refer patients to a dietitian within or outside the CR department.
A recently implemented National Coverage Determination for CR in 2010 has provided new means for addressing the financial concerns of billing for the use of multidisciplinary providers such as dieticians for those patients who have Medicare and Medicaid. As long as exercise is provided, the clinician may bill for education that occurs, allowing for up to two sessions per day, including nutritional counseling.

33
PATIENT SATISFACTION Objective
The measurement of how satisfied the patients are about the care they received during CR. Use of patient surveys can teach programs how to improve the quality of care, identify areas that need improvement, and monitor success.
Standard of Measurement
The satisfaction survey is a ten-question survey. Each question is scored on a 1 (disagree) to 5 (agree). The patient chooses the number that they feel most accurately describes the service they received during their time in CR. The maximal possible score on the survey is 50. The survey is administered prior to the patient being discharged from CR.
Supporting Statement
Service domain measures can be used by program staff to evaluate the effectiveness of program structure and methods for delivering services. Patient satisfaction is a service-related measurement that is becoming recognized as a strategic measure in healthcare organizations. Other measures in the service domain should include: referral and completion rates, costs of providing care, and satisfaction with the various interventions provided (Sanderson, et al. 2004).
Results
Area Mean Score % Satisfied
National 48.7 97.4
Michigan 48.8 97.6
North 48.9 97.8
Southeast 48.7 97.4
Southwest 48.8 97.6
Source: Montana/Michigan 2008-2009 Outcomes Report
All regions within the state of Michigan scored very high (97th percentile) in patient satisfaction scores, which are equivalent to the national mean score.
Discussion
Use of this data will allow CR programs to compare their program against their region, state, and nation. Programs with low satisfaction scores can look for QI projects to improve their patient satisfaction scores.
Limitations
The satisfaction tool was developed specifically for the outcomes project and was not validated.
The questionnaire is very general. More specific questioning may be necessary for programs to initiate QI processes.

34
Mic
higa
n Ca
rdia
c R
ehab
ilita
tion
Out
com
es |
20
10
repo
rt
Some CR programs felt program biases could confound results if patients were asked to complete the survey in front of them.
Some hospitals did not participate in this particular survey because their respective hospital uses a survey unique to their organization.
Recommendations
A quality patient satisfaction survey is recommended to evaluate program & staff effectiveness, identify strengths and weaknesses, improve decision making, and support the optimal allocation of health care resources for all patients. Questions may be added to the patient satisfaction questionnaire to meet the program’s QI.

35
COMPLETION RATE Objective
To measure the percentage of patients who complete Phase II CR.
Standard of Measurement
Completion of CR is defined as the completion of 12 or more exercise sessions.
Supporting Statement
CR is an essential treatment for patients’ well-being and saves lives in a cost-effective manner. Forty-eight randomized trials of CR showed a reduction in all-cause and cardiac mortality of 20 and 26 percent, respectively, over 3 years (Taylor et al., 2004).
A recent study published in Circulation evaluated overall mortality and risk of cardiac events between patients that attended 1 CR session versus 12, 24, and 36 sessions. The study found that patients that completed 36 sessions faired better than their counterparts participating in fewer sessions. Patients that attended 36 sessions had a 14 percent lower risk of death and a 12 percent lower risk of MI than those who attended 24 sessions; a 22 percent lower risk of death and a 23 percent lower risk of MI than those who attended 12 sessions; and a 47 percent lower risk of death and a 31 percent lower risk of MI than those who attended only 1 session (Hammill et al., 2010).
Despite its survival benefits, CR services are vastly underutilized with < 30% of eligible diagnoses referred to CR (Fischer, 2008).
Results
Area % Completion
National 78
Michigan 78
North 74
Southeast 84
Southwest 74
Source: Montana/Michigan 2008-2009 Outcomes Report

36
Mic
higa
n Ca
rdia
c R
ehab
ilita
tion
Out
com
es |
20
10
repo
rt
Discussion
Use of these data allows programs to compare themselves with regional, state, and national data. Programs with low completion rates can implement QI projects to improve this indicator. Questionnaires and surveys can be useful tools to determine patient satisfaction (which may be related to completion rates). The Montana Outcomes Project recently added the marker, “reason for not completing CR” as an option to the database.
Limitations
There are no limitations collecting the data. However, there are patient limitations and barriers that may prevent continuation and/or completion of CR, such as distance, expense (co-pay and deductible), lack of transportation, and returning to work.
Recommendations
Given the results of the recent study published in Circulation (Hammill et al., 2010) demonstrating reduced cardiac and all-cause mortality for patients attending more CR sessions, the current definition of cr completion (12 visits) may need to be re-evaluated. Questionnaires and surveys administered to patients may be useful tools for determining patient barriers and initiating process improvement projects.

37
CONCLUSION The collaborative efforts of CR programs represented in this document are evidence of the ongoing diligence toward reducing cardiovascular risk for patients served in the state of Michigan. Data suggests the majority of Michigan CR programs have been successful in the following domains: 1) (prescribing) providing LLM; 2) getting BP to goal; 3) program satisfaction; 4) program completion; 5) smoking cessation; and 6) improvements in HRQL. Potential areas for improvement include additional reduction of LDL-C, consistent screening for blood glucose control through HbA1c testing, and weight loss initiatives to improve BMI (Ades, et al. 2009). Programs participating in this project are collaborating with MDCH, which has infused expertise, access to resources, and education, better equipping participants for success in risk factor reduction.
Limitations encountered in this project include variation in CR program size, experience with outcomes collection and QI processes, and available manpower and resources to manage the added burden of project management in an economically challenged healthcare environment. To address these challenges, quarterly teleconferencing of all participating programs has allowed sharing of best practice guidelines and free access to both professional and patient education materials, giving both large and small programs the opportunity to maximize positive outcomes. MDCH assisted the entire Montana Outcomes Project by presenting a one-hour teleconference on the Plan Do Study Act (PDSA) method of QI to further assist all programs in using the data they are collecting. The PDSA method encourages a systematic approach to quality and process improvement objectives. To date, many programs have initiated QI processes aimed at reaching performance measure goals for CR and program certification through AACVPR.
Future goals to enhance the success of the Montana Outcomes Project implementation within the state of Michigan include further defining current indicators such as BMI and LDL-C. Qualifiers such as waist circumference and body fat analysis may assist practitioners in evaluating weight loss efforts within their respective programs. Furthermore, as the body of research on optimal LDL-C levels continues to grow, programs should remain diligent in meeting and/or exceeding ATP-III recommendations at each physician’s discretion.
In the next year, in addition to current state initiatives aimed at BP management, new 2010-2011 goals are focused on obtaining best practice objectives for creatively motivating patients toward weight loss, and jumpstarting the cholesterol and diabetes management processes. Programs will continue to be encouraged to utilize their ITP to enhance risk factor management, including QI projects, patient education, and physician directed care. Continued collection of demographic information on referrals to CR may identify areas of disparity in utilization of CR services and assist in the development of potential solutions. Finally, more programs will be recruited to the outcomes project to impact cardiovascular health, including the underserved, in the state of Michigan.
The state of Michigan contributed close to 40 percent of the total patients evaluated in the Montana Outcomes Project from October 2008 – September 2009 (Michigan, n=3,026, National, n=7,567), which demonstrates sizable input and effort on the part of CR programs involved in this project. By working together as a state, all programs have the potential to implement effective delivery of care to persons with CVD. Larger populations of pooled data allow greater potential to affect lifestyle change and modify risk factors for CVD, which can lead to reduced re-hospitalization, economic burden, healthcare costs, and deaths. Since the AHA’s 2010 Strategic Impact Goal Through 2010 and Beyond is to improve the cardiovascular health of all Americans by 20% nationally, the MSCVPR Outcomes Program, as part of the Montana Outcomes project, is well on its way toward assisting in reaching this goal.

38
Mic
higa
n Ca
rdia
c R
ehab
ilita
tion
Out
com
es |
20
10
repo
rt
APPENDICES Appendix A Demographic and diagnostic characteristics among cardiac rehab patients in the Michigan
Region and Nationally, October 2008 – September 2009
Appendix B Cardiac rehab indicators from the clinical domain for facilities participating in the Regional
Outcomes Project, Michigan and Nationally, October 2008 – September 2009
Appendix C Cardiac rehab indicators from the health, behavioral and service domains for facilities participating
in the Regional Outcomes Project, Michigan and Nationally,
October 2008 – September 2009
Appendix D Demographic and diagnostic characteristics among cardiac rehab patients in the Michigan’s North
Region and statewide, October 2008 – September 2009
Appendix E Cardiac rehab indicators from the clinical domain for facilities participating in the Regional Outcomes Project, Michigan’s North Region and statewide, October 2008 – September 2009
Appendix F Cardiac rehab indicators from the health, behavioral and service domains for facilities in the Regional Outcomes Project, Michigan’s North Region and statewide, October 2008 – September 2009
Appendix G Demographic and diagnostic characteristics among cardiac rehab patients in the Michigan’s SE Region and statewide, October 2008 – September 2009
Appendix H Cardiac rehab indicators from the clinical domain for facilities participating in the Regional Outcomes Project, Michigan’s SE Region and statewide, October 2008 – September 2009
Appendix I Cardiac rehab indicators from the health, behavioral and service domains for facilities participating in the Regional Outcomes Project, Michigan’s SE Region and statewide, October 2008 – September 2009
Appendix J Demographic and diagnostic characteristics among cardiac rehab patients in the Michigan’s SW Region and statewide, October 2008 – September 2009
Appendix K Cardiac rehab indicators from the clinical domain for facilities participating in the Regional Outcomes Project, Michigan’s SW Region and statewide, October 2008 – September 2009
Appendix L Cardiac rehab indicators from the health, behavioral and service domains for facilities participating in the Regional Outcomes Project, Michigan’s SW Region and statewide, October 2008 – September 2009
Appendix M Cardiac rehab QI project participants 2009
Appendix N Stories from the field
Appendix O Montana outcomes project overview
Appendix P Indicator definitions

39
Appendix A:

40
Mic
higa
n Ca
rdia
c R
ehab
ilita
tion
Out
com
es |
20
10
repo
rt
Appendix B:

41
Appendix C:

42
Mic
higa
n Ca
rdia
c R
ehab
ilita
tion
Out
com
es |
20
10
repo
rt
Appendix D:

43
Appendix E:

44
Mic
higa
n Ca
rdia
c R
ehab
ilita
tion
Out
com
es |
20
10
repo
rt
Appendix F:

45
Appendix G:

46
Mic
higa
n Ca
rdia
c R
ehab
ilita
tion
Out
com
es |
20
10
repo
rt
Appendix H:

47
Appendix I:

48
Mic
higa
n Ca
rdia
c R
ehab
ilita
tion
Out
com
es |
20
10
repo
rt
Appendix J:

49
Appendix K:

50
Mic
higa
n Ca
rdia
c R
ehab
ilita
tion
Out
com
es |
20
10
repo
rt
Appendix L:

51
Appendix M:
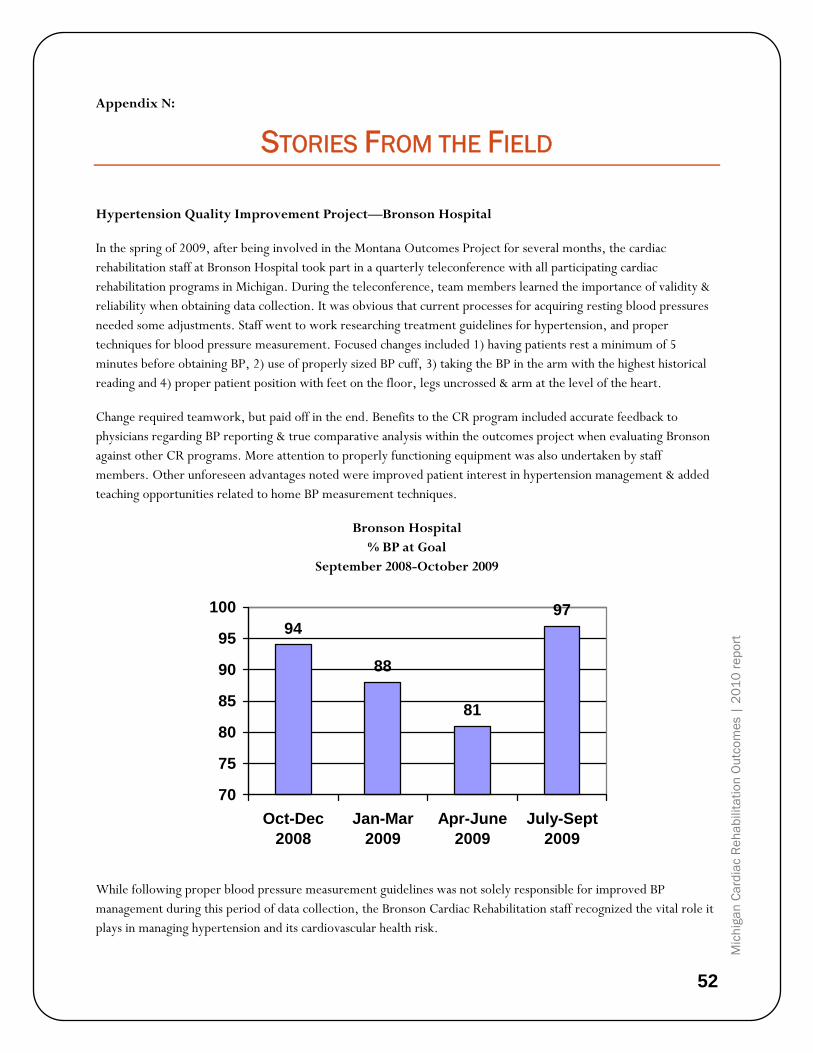
52
Mic
higa
n Ca
rdia
c R
ehab
ilita
tion
Out
com
es |
20
10
repo
rt
Appendix N:
STORIES FROM THE FIELD
Hypertension Quality Improvement Project—Bronson Hospital
In the spring of 2009, after being involved in the Montana Outcomes Project for several months, the cardiac rehabilitation staff at Bronson Hospital took part in a quarterly teleconference with all participating cardiac rehabilitation programs in Michigan. During the teleconference, team members learned the importance of validity & reliability when obtaining data collection. It was obvious that current processes for acquiring resting blood pressures needed some adjustments. Staff went to work researching treatment guidelines for hypertension, and proper techniques for blood pressure measurement. Focused changes included 1) having patients rest a minimum of 5 minutes before obtaining BP, 2) use of properly sized BP cuff, 3) taking the BP in the arm with the highest historical reading and 4) proper patient position with feet on the floor, legs uncrossed & arm at the level of the heart.
Change required teamwork, but paid off in the end. Benefits to the CR program included accurate feedback to physicians regarding BP reporting & true comparative analysis within the outcomes project when evaluating Bronson against other CR programs. More attention to properly functioning equipment was also undertaken by staff members. Other unforeseen advantages noted were improved patient interest in hypertension management & added teaching opportunities related to home BP measurement techniques.
Bronson Hospital % BP at Goal
September 2008-October 2009
94
88
81
97
70
75
80
85
90
95
100
Oct-Dec2008
Jan-Mar2009
Apr-June2009
July-Sept2009
While following proper blood pressure measurement guidelines was not solely responsible for improved BP management during this period of data collection, the Bronson Cardiac Rehabilitation staff recognized the vital role it plays in managing hypertension and its cardiovascular health risk.
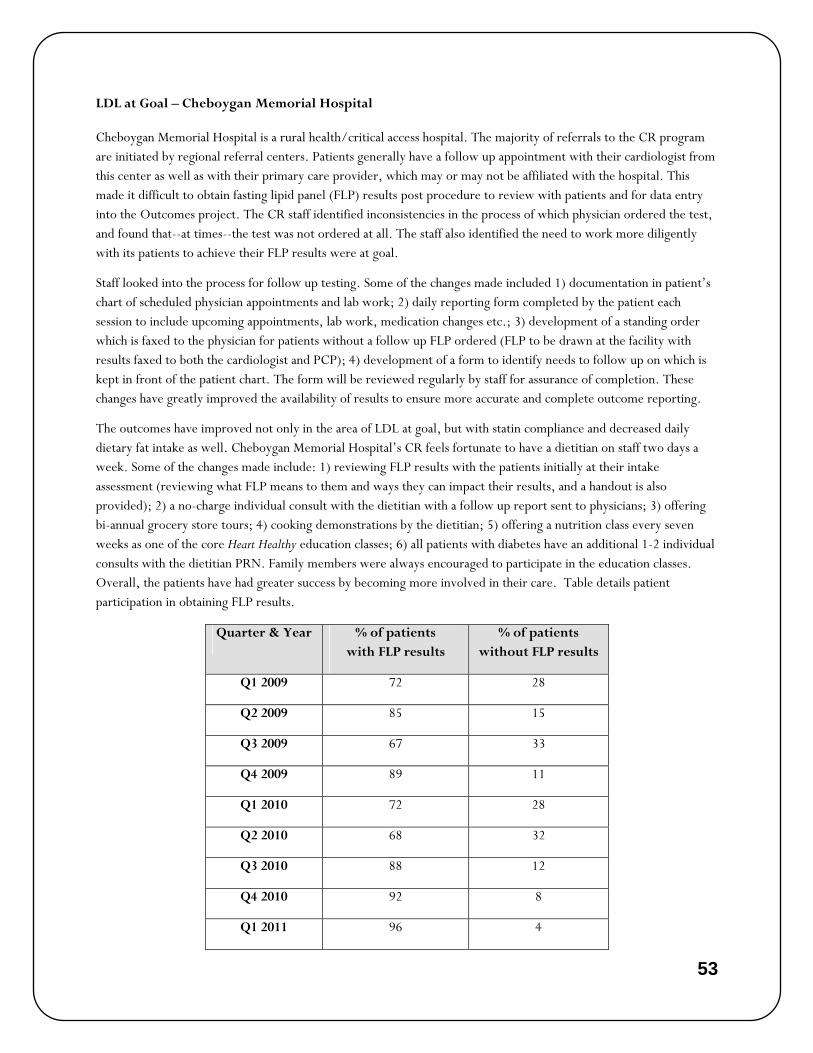
53
LDL at Goal – Cheboygan Memorial Hospital
Cheboygan Memorial Hospital is a rural health/critical access hospital. The majority of referrals to the CR program are initiated by regional referral centers. Patients generally have a follow up appointment with their cardiologist from this center as well as with their primary care provider, which may or may not be affiliated with the hospital. This made it difficult to obtain fasting lipid panel (FLP) results post procedure to review with patients and for data entry into the Outcomes project. The CR staff identified inconsistencies in the process of which physician ordered the test, and found that--at times--the test was not ordered at all. The staff also identified the need to work more diligently with its patients to achieve their FLP results were at goal.
Staff looked into the process for follow up testing. Some of the changes made included 1) documentation in patient’s chart of scheduled physician appointments and lab work; 2) daily reporting form completed by the patient each session to include upcoming appointments, lab work, medication changes etc.; 3) development of a standing order which is faxed to the physician for patients without a follow up FLP ordered (FLP to be drawn at the facility with results faxed to both the cardiologist and PCP); 4) development of a form to identify needs to follow up on which is kept in front of the patient chart. The form will be reviewed regularly by staff for assurance of completion. These changes have greatly improved the availability of results to ensure more accurate and complete outcome reporting.
The outcomes have improved not only in the area of LDL at goal, but with statin compliance and decreased daily dietary fat intake as well. Cheboygan Memorial Hospital’s CR feels fortunate to have a dietitian on staff two days a week. Some of the changes made include: 1) reviewing FLP results with the patients initially at their intake assessment (reviewing what FLP means to them and ways they can impact their results, and a handout is also provided); 2) a no-charge individual consult with the dietitian with a follow up report sent to physicians; 3) offering bi-annual grocery store tours; 4) cooking demonstrations by the dietitian; 5) offering a nutrition class every seven weeks as one of the core Heart Healthy education classes; 6) all patients with diabetes have an additional 1-2 individual consults with the dietitian PRN. Family members were always encouraged to participate in the education classes. Overall, the patients have had greater success by becoming more involved in their care. Table details patient participation in obtaining FLP results.
Quarter & Year % of patients with FLP results
% of patients without FLP results
Q1 2009 72 28
Q2 2009 85 15
Q3 2009 67 33
Q4 2009 89 11
Q1 2010 72 28
Q2 2010 68 32
Q3 2010 88 12
Q4 2010 92 8
Q1 2011 96 4

54
Mic
higa
n Ca
rdia
c R
ehab
ilita
tion
Out
com
es |
20
10
repo
rt
Northern Michigan Diabetes Initiative – Munson Medical Center
The Northern Michigan Diabetes Initiative (NMDI) was established in 2006 with the vision to reduce the incidence of diabetes and pre-diabetes, and improve the care of people with diabetes in the 11-county northern Michigan region. Starting with a 2005 baseline, the following outcomes have been achieved:
The percent of people with diabetes with A1c<7 has improved (Chart A).
The number of people with diabetes getting an A1c, an LDL, and a microalbuminura has increased (Chart B).

55
The total number of people getting an A1c has increased (Chart C).
The total number of people with diabetes with LDL less than 100 has improved (Chart D).
These outcomes were achieved as a result of the Initiative’s objectives, and the work of the collaborating partners and sponsors.
There are many ways in which the Cardiac Rehabilitation programs of the Northern Michigan region benefit from programs such as the Northern Michigan Regional Diabetes Initiative. When patients from this region have recent A1c’s drawn programs can effectively counsel patients regarding risk factors for CAD. Knowing current A1c values allow the clinician to counsel the patient about the level of control of diabetes and how diabetes control relates to heart disease. If the A1c is unknown the patient may not be counseled on the need for aggressive control of blood sugars, or shown how diet, exercise and medication effectively improves the A1c.With this program local physicians are encouraged to follow the American Diabetes Association guidelines and work toward better management of their patients with diabetes. The benefits are seen when we compare the higher reporting of A1c as we have when we compare Northern Michigan region to the other regions of the state.

56
Mic
higa
n Ca
rdia
c R
ehab
ilita
tion
Out
com
es |
20
10
repo
rt
Body Mass Index – The University of Michigan Health System
The states involved in the Montana Outcomes Project reported a 1% mean improvement in BMI. This modest improvement has been echoed throughout many CR programs. The University of Michigan Health System has been addressing this lack of weight loss for some time, and chose to offer their QI story
For over a decade, The University of Michigan CR team has used a continuous QI approach including these 6 areas: 1) adding a registered dietitian in CR once a week; 2) educational “mini-teaches” conveniently taught after each class (instead of hour lectures at the end of the day); 3) expanding the frequency and duration of aerobic exercise from thirty to 45-60 minutes and intensifying the importance of the home exercise program; 4) combining additional weight loss programs such as Hunger Within (Emotional Eating), Weight Watchers, University of Michigan Healthy Weight Loss programs, and onsite individualized one-on-one counseling with a registered dietitian; 5) an ITP used as a written care plan tool to document re-assessment of all the outcomes at 30-day intervals during the program; and 6) an on-site follow-up program for graduates of CR at 1, 6, and 12+ month intervals to assess progress, challenges, and to re-evaluate goals for weight and fitness (secondary risk-factor reduction). The following is an account of ways The University of Michigan Health System has learned to improve the fraction of participants who lose weight over time.
Utilizing these 6 methods over a 5 year time period, the results showed a positive trend in the number of participants achieving a 3% weight loss over approximately 18 sessions. It is anticipated with the expansion of CR services from 18 to 36 sessions, a greater percentage of participants losing a greater percentage of weight. High calorie- expenditure exercise has been shown to promote greater weight loss and more favorable cardio-metabolic risk profiles than standard CR for overweight coronary patients. (Ades, et al. 2009)

57
Appendix O:
MONTANA OUTCOMES PROJECT OVERVIEW
The Montana Outcomes Project started in 2005 as a collaborative effort between the MACVPR and the CVH Program within the Montana Department of Public Health and Human Services. The goal of the project was to provide a complete out-of-the-box outcomes program and to provide data management and support to participating programs. The data support includes developing aggregate regional means for each indicator to be used for benchmarking purposes. The benchmarking of data allows programs to identify areas to focus QI activities with the ultimate goal of improving patient care. Data is collected on a quarterly basis. The quarter schedule breakdown is as follows:
Quarter 1: January-March, data due in July Quarter 2: April-June, data due in October Quarter 3: July-September, data due in January Quarter 4: October-December, data due in April
Indicators The indicators being tracked are as follows: Demographics: Age Gender Diagnosis
Ethnicity Number of Visits Health Domain: SF-36 version 2 Dartmouth Coop Clinical Domain: BP at goal BMI LDL at goal*
Usage of lipid lowering medications Duke Activity Status Index (DASI) HbA1c test for patients with diabetes Patient Health Questionnaire 9 (PHQ-9)*
Behavioral Domain: Smoking status Dietary Fat Screener*
Service Domain: Patient satisfaction
Completion rate*
*Indicates a new indicator or change in definition of the indicator.

58
Mic
higa
n Ca
rdia
c R
ehab
ilita
tion
Out
com
es |
20
10
repo
rt
Appendix P:
INDICATOR DEFINITIONS
Health
Health surveys/QOL tools
• SF-36 version 2 and the Dartmouth COOP - programs can use either tool (not both).
• Evaluation: percent change in pre to post scores.
• Survey should be administered prior to the first exercise session (pre) and prior to discharge (post) from Phase II cardiac rehab.
Cl in ica l
Blood pressure at goal
• Evaluation: percentage of patients who meet goal criteria for blood pressure control.
o Patients with diabetes and/or chronic kidney disease, the goal is <130/80; for all other patients, the goal is <140/90.
• The average of the last 3 resting or pre-exercise blood pressures is used to determine if the patient meets control criteria.
• Patient should be in a seated position w/out legs crossed. BP should be taken in the arm that elicits the highest historical reading. BP measurement should be taken after a five-minute period in which the patient is sitting quietly.
Body mass index (BMI)
• Evaluation: percent change in pre to post BMI.
o Patients with a BMI of <25 will not be included in the analysis.
• Height (inches) and weight (pounds) in stocking feet need to be obtained at the first and weight only at the last exercise session.
Low density lipoprotein (LDL) at goal
• Evaluation: percentage of patients who meet goal criteria for LDL control.
o Goal is <100mg/dL.
• Only LDL values measured post hospitalization are to be reported.

59
Lipid lowering medication (LLM) utilization
• Evaluation: percentage of patients who are taking prescription medications to reduce their blood lipid level.
• Medication usage as well as any contraindications to LLM are collected at the initial visit and updated prior to program completion.
Duke activity status index (DASI)
• Evaluation: percent change in pre to post MET values.
• Survey should be administered prior to the first exercise session and prior to discharge from Phase II cardiac rehab.
Glycosolated hemoglobin (A1c)
• Evaluation: percentage of patients who have diabetes and have had an A1C measured within six months of entry into cardiac rehab.
o Enter value into spreadsheet.
Patient Health Questionnaire – Depression Screen (PHQ-9)
• Evaluation: percent change in pre to post scores.
• Survey should be administered prior to the first exercise session and prior to discharge from Phase II cardiac rehab.
Behavioral
Smoking status
• Evaluation: percentage change in pre to post smoking rates.
• Smoking status should be evaluated at the initial interview and prior to the patient being discharged from cardiac rehab.
o Pre smoking status is defined as – smoking status one month prior to their cardiac event.
o Post smoking status is defined as – smoking status during the last half of their cardiac rehab.
Dietary Fat Screener
• Evaluation: percent change in pre to post scores.
• Survey should be administered prior to the first exercise session and prior to discharge from Phase II cardiac rehab.
o Post test should focus on the patient’s diet history over the past month, not the past year as indicated on the survey.
60
Mic
higa
n Ca
rdia
c R
ehab
ilita
tion
Out
com
es |
20
10
repo
rt
Service
Patient satisfaction
• Evaluation: patient satisfaction score.
• Survey should be administered prior to the patient being discharged from cardiac rehab.
Program completion rate
• Evaluation: percentage of patients who complete cardiac rehab.
• Completion rate is determined by:
o The patient completing 12 or more sessions.
o The patient completing all approved visits allowed by their insurance carrier.

61
SURVEY THRESHOLDS
The Montana Outcomes Workgroup has developed a set of thresholds for the surveys that are supported by this project. The intent of setting the thresholds is to provide a more “patient centered” approach within the outcomes project. In addition to developing the thresholds, we have also included recommendations in the event that a patient score crosses a particular threshold. The thresholds and recommendations are as follows:
Survey Threshold Recommended Intervention
Block Dietary Fat Screener Pre-program score of >15 Patients who score > 15 on the initial survey should be referred to nutrition counseling and/or encouraged to attend the cardiac rehab nutrition patient education class.
Duke Activity Status Index (DASI)
Pre-program raw scores of <9.95 (4 METs)
Patients scoring <9.95 should re-take the DASI after 30 days. If the score has not improved, the patient should be referred back to their MD for evaluation.
SF-36
Pre-program Physical composite score (PCS) and mental composite score (MCS) of <42
Patients scoring <42 on the PCS should be evaluated by staff. The DASI score should be taken into consideration during the evaluation. Staff to use clinical judgment regarding the need to follow-up with the patient’s MD. Scores <42 on the MCS should be evaluated by staff. The PHQ-9 should be taken into consideration during the evaluation. Staff to use clinical judgment regarding the need to follow-up with the patient’s MD. Survey should be re-administered after 30 days to monitor progress.
Dartmouth COOP Pre-program score of >3 on any question and/or a total score of >25
Patients scoring >3 on any individual question or a total score >25 should be evaluated by staff. Scores from the DASI and PHQ-9 should be used to determine if the patient should be referred back to their MD for evaluation. Survey should be re-administered after 30 days to monitor progress.
PHQ-9 Depression Screen Pre-program score of >9 and/or a score of >1 on question 1i
Patients scoring >9 or a score of >1 on question 1i* be referred back to their MD for evaluation. The survey should be re-administered after 30 days to monitor progress. *If patient is suicidal, an immediate evaluation by qualified personnel is recommended.

62
Mic
higa
n Ca
rdia
c R
ehab
ilita
tion
Out
com
es |
20
10
repo
rt
REFERENCES Ades P, Savage P,Toth M, et al High-Calorie-Expenditure Exercise A New approach to Cardiac Rehabilitation for
Overweight Coronary Patients. Circulation. 2009;119:2671-2678.
ALLHAT Officers and Coordinators for the ALLHAT Collaborative Research Group. (2002). Major outcomes in moderately hypercholesterolemic, hypertensive patients randomized to pravastatin vs. usual care: The antihypertensive and lipid-lowering treatment to prevent heart attack trial (ALLHAT-LLT). Journal of the American Medical Association, 288, 2998-3007
American Association of Cardiovascular and Pulmonary Rehabilitation. (2004). Guidelines for cardiac rehabilitation and secondary prevention programs (4th ed.). Champaign, IL: Human Kinetics.
American Diabetes Association. (2003). Treatment of hypertension in adults with diabetes. Diabetes Care, 26, S80-2.
American Diabetes Association. (2006). Standards of medical care in diabetes. Diabetes Care, 29, S1-42.
American Heart Association. (2009). Heart disease and stroke statistics 2009 update: a report from the american heart association statistics committee and stroke statistics subcommittee. Circulation, 119, e21-e181. Retrieved November 16, 2010, from http://circ.ahajournals.org/cgi/content/full/119/3/e21.
American Heart Association. (2009, November). Motivational “women-only” cardiac rehab improves symptoms of depression. Abstract presented at the meeting of the American Heart Association, Orlando, FL.
Ammerman, A., Pignone, M., Fernandez, L., Lohr, K., Jacobs, A.D., Nester, C., et al. (2002). Counseling to promote a healthy diet (No. 18). Rockville: Agency for Healthcare Research and Quality.
Anderson, B.E., Lyon-Callo, S.K., Heiler, P.L., Miller, H.L., & Theisen, V.J. (2008) Impact of heart disease and stroke in Michigan: 2008 report on surveillance. Lansing, MI: Michigan Department of Community Health.
Balady, G.J., Williams, M.A., Ades, P.A., Bittner, V., Comoss, P., Foody, J.M., et al. (2007). Core components of cardiac rehabilitation/secondary prevention programs: 2007 update. Circulation, 115, 2675-82.
Bartecchi, C., Alsever, R., Bartelson, B., Estacio, R., Krantz, M., Nevin-Woods, C., et al. (2006). Reduction in the incidence of acute myocardial infarction associated with a citywide smoking ordinance. Circulation, 114, 1490-6.
Beaufait, D.W., Nelson, E.C., Landgraf, J.M., Hays, RD, Kirk, JW, Wasson, JH, et al. (1992). Coop measures of functional status. In M. Stewart, F. Tudiver, M.J. Bass, E.V. Dunn & P.G. Norton (Eds.), Tools for primary care research (pp. 151-167): Vol 2. Newbury Park: Sage Publications.
Bentsen, B.G., Natvig, B., & Winnem, M. (1999). Questions you didn’t ask? Coop/wonca charts in clinical work and research. Family Practice 1999, 16(2), 190-95.
Blair, S.N., Kohl, H.W.3rd, Paffenbarger, R.S.Jr, Clark, D.G., Cooper, K.H., Gibbons, L.W. (1989). Journal of American Medical Association, 262(17), 2395-2401.

63
Brezinka V., & Kittel F. (1996). Psychosocial factors of coronary heart disease in women: a review. Social Science & Medicine, 429(10), 1351-65
Brown, K. (2003). A review to examine the use of sf-36 in cardiac rehabilitation. British Journal of Nursing, 12(15), 904-09.
Brown, T.M., Hernandez, A.F., Bittner, V., Cannon, C.P., Ellrodt, G., Liang, L., et al. on behalf of the American Heart Association Get With The Guidelines Investigators. (2009). Predictors of cardiac rehabilitation referral in coronary artery disease patients: findings from the american heart association’s get with the guidelines program. Journal of the American College of Cardiology, 54, 515-21.
Caulin-Glaser, T., Blum, M., Schmeizl, R., Prigerson, H.G., Zaret, B., Mazure, C.M. (2001). Gender differences in referral to cardiac rehabilitation programs after revascularization. Journal of Cardiopulmonary Rehabilitation, 21(1), 24-30.
Church T, Blair S, Cocreham S et al. Effects of Aerobic and Resistance Training on Hemoglobin A1C Levels in Patients with Type 2 Diabetes. JAMA 2010 Vol. 304 no.20 2252-2262.
Coons, S.J., Rao, S., Keininger, D.L., Hays, R.D. (2000). A comparative review of generic quality-of-life-instruments. Pharmacoeconomics, 17(1), 13-35.
Cruz, L.N., Camey, S.A., Fleck, M.P., & Polanczyk, C.A. (2009). World health organization quality of life instrument-brief and short form-36 in patients with coronary artery disease: do they measure similar quality of life concepts? Psychology, Health & Medicine, 14(5), 619-28.
Daly, J., Sindone, A.P., Thompson, D.R., Hancock, K., Chang, E., Davidson, P. (2002). Barriers to participation in and adherence to cardiac rehabilitation programs: a critical literature review. Progress in Cardiovascular Nursing, 17(1), 8-17.
Davidson, M., Fonarow, M., Maki, K., Pearson, T., & Dicklin, M. (2005). Implications of the new recommendations from the national cholesterol education writing group: results from a national survey of lipid management. Journal of the American College of Cardiology, 45, 128.
Dartmouth CO-OP Project. (2010). The Dartmouth Primary Care Cooperative (“CO-OP”) Information Project. Retrieved November 6, 2010, from http://www.dartmouthcoopproject.org/coopcharts_overview.html
Eaton, T., Young, P., Fergusson, W., Garrett, J.E., & Kolbe, J. (2005). The dartmouth coop charts: a simple, reliable, valid and response quality of life tool for chronic obstructive pulmonary disease. Quality of Life Research, 14(3), 575-85.
Engoren, M., Habib, R.H., Zacharias, A., Schwann, T.A., Riordan, C.J., Durham, S.J., et al. (2008). The prevalence of elevated hemoglobin A1c in patients undergoing coronary artery bypass surgery. Journal of Cardiothoracic Surgery, 3, 63.
Erhman, J., Gordon, P., Keteyian, S., & Visich, P. (Eds.). (2003). Clinical Exercise Physiology (1 ed., p. 208). Champaign, IL: Human Kinetics.
st

64
Mic
higa
n Ca
rdia
c R
ehab
ilita
tion
Out
com
es |
20
10
repo
rt
Failde, I. & Ramos, I. (2000). Validity and reliability of the sf-36 health survey questionnaire in patients with coronary artery disease. Journal of Clinical Epidemiology, 53(A), 359-65.
Fischer, J.P. (2008). Automatic referral to cardiac rehabilitation. Journal of Cardiovascular Nursing, 23, 474-9.
Franklin, B., Bonzheim, K., Warren, J., Haapaniemi, S., Byl, N., Ware, L., et al. (2001). Effects of phase 2 cardiac rehabilitation participation on patients with abnormal baseline risk factors: Implications for evaluating program effectiveness. Journal of Cardiopulmonary Rehabilitation, 21(5), 307.
Franklin, B.A., Kahn, J.K., Gordon, N.F., Bonow, R.O. (2004). A cardioprotective “polypill”? Independent and additive benefits of lifestyle modification. American Journal of Cardiology, 94, 162-166.
Franklin, B.A. & Gordon, NF. (2009). Contemporary Diagnosis and Management in Cardiovascular Exercise. Newton, PA; Handbooks in Health Care Company; 2009;74-88.
Gandek, B. (1993). Interpreting the SF-36 health survey. Health Assessment Lab, Boston MA. New England Medical Center. The Health Institute.
Gerber, Y., Rosen, L. Goldbourt, U., Benyamini, Y., & Drorry, Y., (2009). Smoking status and long-term survival after first acute myocardial infarction: A population-based cohort study. Journal of the American College of Cardiology, 54, 2382-7.
Goldenberg, I., Jonas, M., Tenenbaum, A., Boyko, V., Matetzeky, S., Shoton, A., et al. (2003). Current smoking, smoking cessation, and the risk of sudden cardiac death in patients with coronary artery disease. Archives of Internal Medicine, 163(19), 2301-5.
Grundy, S., Cleeman, J., Mertz, C., Brewer, H., Clark, L., Hunninghake, D., et al., (2004). Implications of recent clinical trials for the national cholesterol education program adult treatment panel III guidelines. Journal of the American College of Cardiology, 44, 720-32.
Gulati, M., Pandey, D.K., Arnsdorf, M.F., Lauderdale, D.S., Thisted, R.A., Wicklund, R.H. (2003). Exercise capacity and the risk of death in women: the st. james women take heart project. Circulation, 108(13), 1554-9.
Hammill, B.G., Curtis, L.H., Schulman, K.A., Whellan, D.J. (2010). Relationship between cardiac rehabilitation and long-term risks of death and myocardial infarction among elderly medicare beneficiaries. Circulation, 121, 63-70.
Haskell, W.L., Alderman, E.L., Fair, J.M., Maron, D.J., Mackey, S.F., Superko, H.R., et al. (1994). Effects of intensive multiple risk factor reduction on coronary atherosclerosis and clinical cardiac events in men and women with coronary artery disease: The stanford coronary risk intervention project (SCRIP). Circulation, 89, 975-90.
Heart Protection Study Collaborative Group. (2002). Mrc/bhf heart protection study of cholesterol lowering with simvastatin in 20,536 high-risk individuals: A randomised placebo-controlled trial. Lancet, 360, 7-22.
Hlatky, M.A., Boineau, R.E., Higginbotham, M.B., Lee, K.L., Mark, D.B., Califf, R.M., et al. (1989). A brief self-administered questionnaire to determine functional capacity (the duke activity status index). American Journal of Cardiology, 64, 651–4.

65
Hoefer, S., Lim, L., Guyatt, G., & Oldridge, N. (2004). The macnew heart disease health-related quality of life instrument: a summary. Health and Quality of Life Outcomes, 2(3), np.
Iestra, J.A., Kromhout, D., van der Schouw, Y.T., Grobbee, D.E., Boshuizen, H.C., & van Staveren, W.A. (2005). Effect size estimates of lifestyle and dietary changes on all-cause mortality in coronary artery disease patients: a systematic review. Circulation, 112, 924 –34.
Joliffe, J.A., Rees, K., Taylor, R.S., Thompson, D., Oldridge, N., Ebrahim, S. (2001). Exercise-based rehabilitation for coronary heart disease. Cochrane Database of Systematic Reviews, 1, CD001800.
Khaw, K.T., Wareham, N., & Luben, R. (2001). Glycated haemoglobin, diabetes, and mortality in men in norfolk cohort of european prospective investigation of cancer and nutrition. British Medical Journal, 322, 15.
Lavorato, L., Grypma, S., Spenceley, S., Hagen, G., & Nowatzki, N. (2003). Positive outcomes in cardiac rehabilitation: The little program that could. Canadian Journal of Cardiovascular Nursing, 13(3), 13-19.
Lichtenstein, A.H., Appel, L.J., Brands, M., Carnethon, M., Daniels, S., Franch, H.A., et al. (2006). Diet and lifestyle recommendations revision 2006: a scientific statement from the american heart association nutrition committee. Circulation, 114, 82-96.
McGee, H.M., Hevey, D., & Horgan, J.H. (1999). Psychosocial outcomes assessments for use in cardiac rehabilitation service evaluation: a 10 year systematic review. Social Science & Medicine 48, 1373-93.
McNamara, M.J., Oser, C.S., Gohdes, D., Fogle, C.C., & Harwell, T.S. (2009) The montana cardiac rehabilitation regional outcomes project. Journal of Cardiopulmonary Rehabilitation Prevention, 29(6), 370-5.
Mochari, H., Lee, J.R., Kligfield, P., & Mosca, L. (2006). Ethnic differences in barriers and referral to cardiac rehabilitation among women hospitalized with coronary heart disease. Preventive Cardiology, 9(1), 8-13.
National Heart, Lung, and Blood Institute. (2002). Third report of the national cholesterol education program (ncep) expert panel on detection, evaluation, and treatment of high blood cholesterol in adults (adult treatment panel III) final report. Circulation, 106, 3143-421.
National Heart, Lung, and Blood Institute. (2002, November). Primary prevention of hypertension: clinical and public health advisory from the national high blood pressure education program (NIH Publication No. 02-5076). US Department of Health and Human Services: Author.
National Heart, Lung, and Blood Institute. (2004, August). The seventh report of the joint national committee on prevention, detection, evaluation, and treatment of high blood pressure (NIH Publication No. 04-5230). US Department of Health and Human Services: Author.
National Multiple Sclerosis Society. (nd). Health status questionnaire (sf-36) description. Retrieved November 6, 2010, from www.nationalmssociety.org.
National Kidney Foundation Guideline. (2002) K/DOQI clinical practice guidelines for chronic kidney disease: Evaluation, classification, and stratification. American Journal of Kidney Diseases, 39, S1-246.

66
Mic
higa
n Ca
rdia
c R
ehab
ilita
tion
Out
com
es |
20
10
repo
rt
National Cholesterol Education Program (NCEP) Expert Panel on Detection, Evaluation and Treatment of High Blood Cholesterol in Adults (Adult Treatment Panel III). (2002). Third report of the national cholesterol education program (NCEP) expert panel on detection, evaluation, and treatment of high blood cholesterol in adults (adult treatment panel III) final report. Circulation, 106, 3143-421.
Neal, B., MacMahon, S., & Chapman, N. (2000). Effects of ace inhibitors, calcium antagonists, and other blood-pressure-lowering drugs: Results of prospectively designed overviews of randomized trials. Blood pressure lowering treatment trialists' collaboration. Lancet, 356, 1955-64.
Nelson, E.C., Landgraf, J.M., Hays, R.D., Wasson, J.H., & Kirk, J.W. (1990). The functional status of patients. How can it be measured in physicians’ offices? Medical Care, 28(12), 1111-26.
Ogden, L.G., He, J., Lydick, E., & Whelton, P.K. (2000). Longterm absolute benefit of lowering blood pressure in hypertensive patients according to the JNC VI risk stratification. Hypertension, 35, 539-43.
O’Keefe, J.H.Jr., Cordian, L., Jones, P.G., & Abuissa, H. (2006). Coronary artery disease prognosis and c-reactive protein levels Improve in proportion to percent lowering of low-density lipoprotein. American Journal of Cardiology, 98, 135-9
Oldridge, N. (1997). Outcome assessment in cardiac rehabilitation: Health-related quality of life and economic evaluation. Journal of Cardiac Rehabilitation. 17(3), 179-194.
Paz, S.H., Liu, H., Fongwa, M.N., Morales, L.S., & Hays, R.D. (2009). Readability estimates for commonly used health-related quality of life surveys. Quality of Life Research, 18, 889-900.
Sanderson, B.K., Southard, D., & Oldridge, N. (2004). Outcomes evaluation in cardiac rehabilitation/secondary prevention programs: Improving patient care and program effectiveness. Journal of Cardiopulmonary Rehabilitation, 24, 68-79.
Savage, P.D., Brochu, M., Poehlman, E.T., & Ades, P.A. (2003). Reduction in obesity and coronary risk factors after high caloric exercise training in overweight coronary patients. American Heart Journal, 146, 317-23.
Selvin, E., Steffes, M.W., Zhu, H., Matsushita, K., Wagenknecht, L. Pankow, J., et al. (2010). Glycated hemoglobin, diabetes, and cardiovascular risk in nondiabetic adults. The New England Journal of Medicine, 362, 800-11.
Selvin E, Marinopoulis S, Berkenblit G, et al. Meta-analysis: glycosylated hemoglobin and cardiovascular disease in diabetes mellitus. Ann Intern Med. 2004; 141(6):421-431.
Sever, P.S., Dahlof, B., Poulter, N.R., Wedel, H., Beevers, G., Caulfield, M., et al. (2003). Prevention of coronary and stroke events with atorvastatin in hypertensive patients who have average or lower-than-average cholesterol concentrations, in the anglo-scandinavian cardiac outcomes trial-lipid lowering arm (ASCOT-LLA): A multicentre randomized controlled trial. Lancet, 2003, 361, 1149-58.
Shah, N.D., Dunlay, S.M., Ting, H.H., Montori, V.M., Thomas, R.J., Wagie, A.E., et al. (2009). Long-term medication adherence after myocardial infarction: experience of a community. American Journal of Medicine, 961, 7-13.

67
Shepherd, J., Blauw, G.J., Murphy, M.B., Bollen, E.L., Buckley, B.M., Cobbe, S.M., et al. (2002). Pravastatin in elderly individuals at risk of vascular disease (prosper): a randomised controlled trial. Lancet, 360, 1623-30.
Smith, S.C. Jr., Allen, J., Blair, S.N., Bonow, R.O., Brass, L.M., Fonarow, G.C., et al. (2006). Aha/acc guidelines for secondary prevention for patients with coronary and other atherosclerotic vascular disease: 2006 update. Journal of the American College of Cardiology, 47, 2130 –9.
Standards of medical care in diabetes – 2006. (2006, January). Diabetes Care, 29, s4-s42.
Standards of medical care in diabetes – 2007. (2007, September). Diabetes Care, 20, s1-s41.
Suaya, J.A., Shepard, D.S., Normand, S.L., Ades, P.A., Prottas, J., Stason, W.B. (2007). Use of cardiac rehabilitation by medicare beneficiaries after myocardial infarction or coronary bypass surgery. Circulation, 116, 1-10.
Suaya, J.A., Stason, W.B., Ades, P.A., Normand, S.T., Shepard, D.S. (2009). Cardiac rehabilitation and survival in older coronary patients. Journal of the American College of Cardiology, 54(1), 25-33.
Taylor, R.S., Brown, A., Ebrahim, S., Jolliffe, J., Noorani, H., Rees, K., et al. (2004). Exercise-based rehabilitation for patients with coronary heart disease: Systematic review and meta-analysis of randomized controlled trials. American Journal of Medicine, 116, 682-92.
Thomas, R.J., King, M., Lui, K., Oldridge, N., Pina, I.L., & Spertus, J., et al. (2007). AACVPR/ACC/AHA 2007 performance measures on cardiac rehabilitation for referral to & delivery of cardiac rehabilitation and secondary prevention services. Journal of the American College of Cardiology, 50(14), 1400-33.
Thompson, P.D., Buchner, D., Piña, I.L., Balady, G.D., Williams, M.A., Marcus, B.H., et al. (2003). Aha scientific statement. Exercise and physical activity in the prevention and treatment of atherosclerotic cardiovascular disease. A statement from the council on clinical cardiology (subcommittee on exercise, rehabilitation, and prevention) and the council on nutrition, physical activity, and metabolism (subcommittee on physical activity). Circulation, 107, 3109.
U.S. Department of Health and Human Services. (2000). Healthy people 2010 (2nd ed.). Washington, DC: U.S. Government Printing Office.
VanWeel, C. (1993). Functional status in primary care: Coop/wonca charts. Disability and Disease, 15(2), 96-101.
Ware, J.E. (2000). Sf-36 health survey update. Spine, 25, 3130-319.
Waters, D.D., Guyton, J.R., Herrington, D.M., McGowan, M.P., Wenger, N.K., Shear, C. (2004). Treating to new targets (tnt) study: does lowering low-density lipoprotein cholesterol levels below currently recommended guidelines yield incremental clinical benefit? American Journal of Cardiology, 93, 154-8.
Wenger, N.K., Froelicher, E.S., Smith, L.K., Ades, P.A., Berra, K., Blumenthal, J.A., et al. (1995). Cardiac rehabilitation. Clinical practice guidelines no. 17. (AHCPR Publication No. 96-0672). US Department of Health and Human Services and the National Heart, Lung and Blood Institute.
68
Mic
higa
n Ca
rdia
c R
ehab
ilita
tion
Out
com
es |
20
10
repo
rt
Whelton, P.K., He, J., Appel, L.J., Cutler, J.A., Havas, S., Kotchen, T.A., et al. (2002). Primary prevention of hypertension:Clinical and public health advisory from the national high blood pressure education program. Journal of the American Medical Association, 288, 1882-8.
Williams, P.T. (2001). Physical fitness and activity as separate heart disease risk factors: a meta-analysis. Medicine & Science in Sports & Exercise, 33(5), 754-61.
Witt, B.J., Jacobsen, S.J., Weston, S.A., Killiam, J.M., Meverden, R.A., Allison, T.G., et al. (2004). Cardiac rehabilitation after myocardial infarction in the community. Journal of the American College of Cardiology, 44(5), 988-96.