michael w. lamach chairman and ceo 2014 j.p. morgan ... · ingersoll rand michael w. lamach...
TRANSCRIPT

Ingersoll Rand
Michael W. Lamach
Chairman and CEO
2014 J.P. Morgan Aviation, Transportation & Industrials Conference
March 11, 2014

2
Safe Harbor
This presentation includes “forward-looking statements,” which are statements that are not
historical facts, including statements that relate to the mix of and demand for our products,
performance of the markets in which we operate, our share repurchase program including
the amount of shares to be repurchased and timing of such repurchases, our projected
2014 first quarter and full-year financial performance and assumptions regarding our
effective tax rate. These forward-looking statements are based on our current expectations
and are subject to risks and uncertainties, which may cause actual results to differ
materially from our current expectations. Such factors include, but are not limited to, our
ability to fully realize the expected benefits of the completed spinoff and restructuring; global
economic conditions; demand for our products and services; and tax law changes.
Additional factors that could cause such differences can be found in our Form 10-K for the
year ended December 31, 2013 and in our other SEC filings. We assume no obligation to
update these forward-looking statements.
This presentation also includes adjusted non-GAAP financial information which should be
considered supplemental to, not a substitute for, or superior to, the financial measure
calculated in accordance with GAAP. Further information about the adjusted non-GAAP
financial information, including why management believes the information is useful, the
purposes for which management uses the information and reconciliation to the nearest
GAAP measure, is included in financial tables attached to the earnings news release that
can be found at www.ingersollrand.com.
All data for beyond the fourth quarter of 2013 are estimates.

3
Positioning Ingersoll Rand to Deliver
Shareholder Value
Operational
Excellence
Balanced
Capital Allocation
Accelerating
Revenue Growth
Strong, recognized brandsWell positioned in both
geographic and end markets
Sustainable, Profitable Growth and Shareholder Value
Leading market shares

4
• Building capabilities and integrating
business models
• Enhanced innovation capabilities to
deliver growth
• Sustainable operating margin improvement
– operational and functional excellence
• Divested underperforming operations
• Spinout of security businesses to
realize full value
• Significant cash flow generation
• Capital allocation focused on creating
shareholder value – dividend increase and
ongoing share repurchase program
Well positioned to drive future growth and margin expansion
Significant Progress 2009 to 2013

5
Adjusted Operating and EBITDA Margins
2011 2012 2013
Climate 8.8% 9.3% 10.4%
Industrial 14.9% 15.8% 16.0%
Operations 10.2% 10.9% 11.7%
Total 8.7% 9.2% 9.6%
2011 2012 2013
Operating Income EBITDA
8.7% 9.2%
12.0%11.6%
12.3%
9.6%
Steady improvements in operating performance
Adjusted Operating Margins

6
• Leading global brands and market positions
• Strong long-term growth drivers
– Macro drivers are energy efficiency and
sustainability
– Large installed base drives replacement
business and parts and service growth
– Global footprint and exposure to attractive
growing markets
– Organic growth enhanced by innovation
– Market recoveries
• Product/service offering underpinned by shared
technologies, materials, manufacturing,
processes and supply chain
• Continued margin and cash flow improvement
opportunity from operational/functional
excellence
“New” Ingersoll Rand: Foundational Strengths
A world leader in creating comfortable, sustainable and
efficient environments

7
29%
18%15%
19%
14%
5%
Golf
Non-Res
Building,
N. America
Non-Res
Building,
OverseasResidential
Building, Americas
Industrial/
Process
Transport
Refrigeration
End Markets
Climate
76%
Industrial
24%
By Segment
2013 Revenue Profile for New Ingersoll Rand
By Geography
North America
63%
Eur/ME15%
Asia16%
LatinAmerica
2013 Revenue: ~$12.4B
68% New equipment
32% Aftermarket
37% of revenues outside of North America
6%

8
Capitalizing on Market Drivers and Trends
Urbanization
Efficiency and
SustainabilityFood and water
scarcity
Existing Building
Solutions
Food Cost
and Safety
Integrated
Building
Solutions
Regulation
Refrigerant
Market drivers for continued long term growth
Global
Industrialization

9
Core Technical Capabilities Shared Across Businesses
CompressionMaterials and
Chemistry
Thermal
Management
Smart, Wireless
Devices
Remote Services
and Analytics
Vibration/Acoustics
Engineering
Precision
Machining
Modeling and
Simulation

10
Growing Aftermarket Systems & Services
Leveraging large installed base to grow aftermarket
Total Revenues
Commercial HVAC
Industrial
New
Equipment
32%
2005 2013
7% CAGR
2005 2013
5% CAGR
Aftermarket: 32% of
2013 revenues;
$3.9 billion in 2013
~40% aftermarket
revenues
~40% aftermarket
revenues in air
compressors
Tools to improve
technical
mobility and
productivity

11
Delivering Growth Through Innovation
Thermo King™ Precedent
Temperature
Control System
C800 Oil-Free Centrifugal
CompressorSeries™ S CenTraVac
Variable Speed 20 SEER
Residential HVAC system
Intellectual Property
2011 2012 2013
InventionDisclosures
PatentApplications
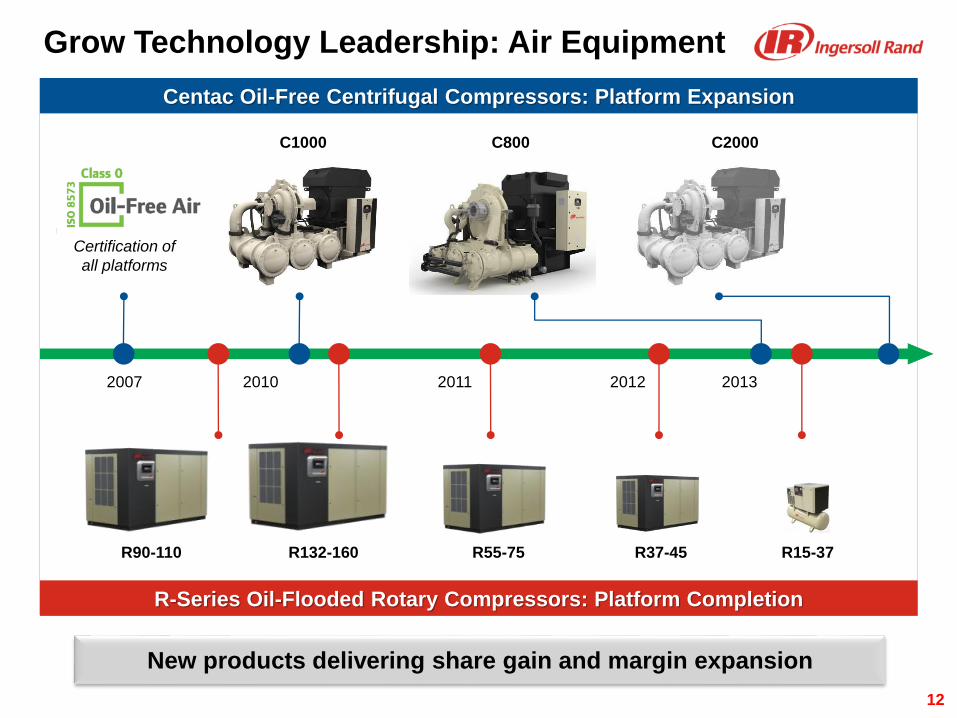
Grow Technology Leadership: Air Equipment
New products delivering share gain and margin expansion
R-Series Oil-Flooded Rotary Compressors: Platform Completion
R90-110 R132-160 R55-75 R37-45 R15-37
Centac Oil-Free Centrifugal Compressors: Platform Expansion
12
C800
2007 2010
C1000 C2000
Certification of
all platforms
2011 2012 2013

13
Manufacturing Facilities94
6749
2009 2013 2013 PostSpin
Operational Excellence
• Restructuring of manufacturing
footprint largely completed in 2013
• Improved pricing processes: price
exceeded material inflation for 11
consecutive quarters
• Material productivity
– Global procurement
– Centralize spend
• Lean transformation – Operations
– Strong improvement in key
metrics
– Covers 40% of conversion costs
in 2013, 60% by 2014
• Lean transformation – Functional
– Program to reduce back office
costs
Past Due
DaysCycle
Time
Employee
Engagement
Cost
Leverage
Building capabilities: increasing margins and working capital efficiency
Value Streams

14
Lean Transformation Improvements
Lynn HavenHastings
Metrics % Reduction
# of Stations 85%
Assembly Space 64%
Capital 35%
Labor Hrs Per Unit 25%
Metrics % Reduction
# of Stations 43%
Total Sq. Footage 36%
Capital 23%
Labor Hrs Per Unit 26%
Metrics % Improved
Cost / Margin 23%
Past Due Days 43%
Metrics % Change
Cycle Time Reduction 48%
Past Due Deliveries 69%
On-time Deliveries 36%
AreciboClarksville / Monterrey

15
Value Stream Expansion
“OPEX”Growth Excellence
Market
AnalyticsProduct
Management
Technology &
Innovation
Sales Force
CapabilityPricing
• Rigorous analytics, market segmentation, customer insights
• Generating, developing and launching offerings
• Reduce cycle times and increase speed to market
• Monetize reliability and energy efficiency through customized solutions
LaunchIdea
Significant opportunity to grow and expand margins
using value stream discipline
CustomerCustomer
Value
Quote
to Cash

16
Capital Allocation
Shareholder
Value
Balance Sheet
• BBB Rating
• No maturities until 2015
M & A
• Focused on core businesses
• Value accretive on a risk
adjusted basis
Share Repurchase
• Complete current $2B
authorization in 1Q 14
• New $1.5B authorization
in 2014
Organic Investment
• Innovation and Growth
• Opex
Dividend
• Peer group metrics
Balancing capital allocation alternatives to create shareholder value
17
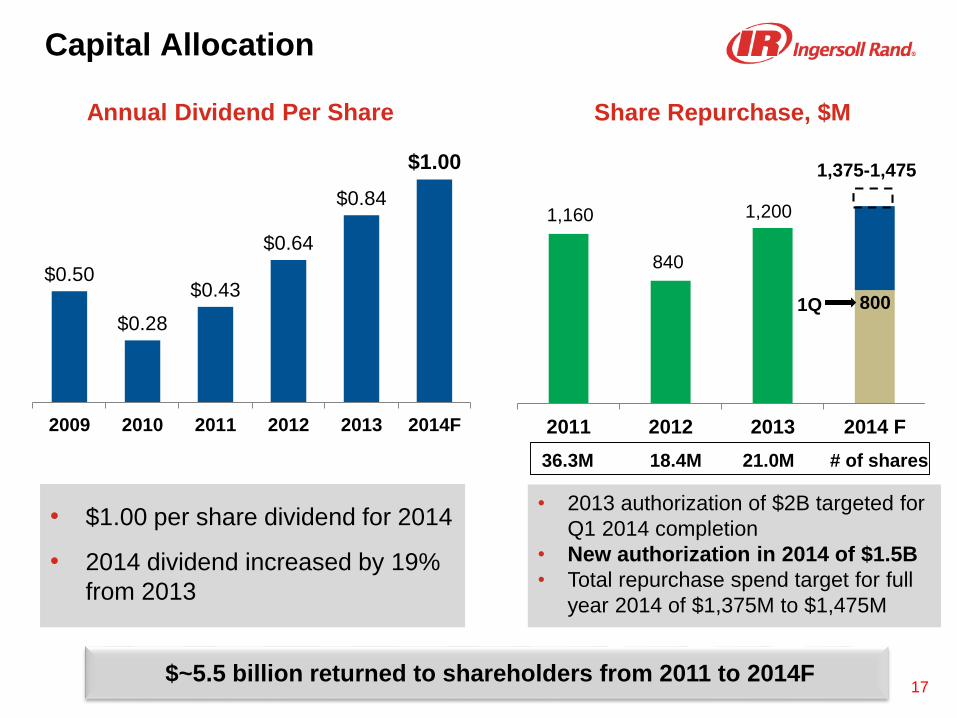
Capital Allocation
Annual Dividend Per Share Share Repurchase, $M
2011 2012 2013 2014 F
840
1,160
800
1,200
1,375-1,475
$~5.5 billion returned to shareholders from 2011 to 2014F
• $1.00 per share dividend for 2014
• 2014 dividend increased by 19%
from 2013
36.3M 18.4M 21.0M # of shares
• 2013 authorization of $2B targeted for
Q1 2014 completion
• New authorization in 2014 of $1.5B
• Total repurchase spend target for full
year 2014 of $1,375M to $1,475M
$0.50
$0.28
$0.43
$0.64
$0.84
$1.00
2009 2010 2011 2012 2013 2014F
1Q

18
2014 Outlook for End Markets
End Market YOY Change
Nonresidential Building North America + Low/Mid single digits
Nonresidential Building Overseas + Low/Mid single digits
Industrial/Process Worldwide Flat/+Low-single digits
Transport Refrigeration North America & Europe + Low/Mid single digits
Residential Buildings --- U.S. Housing Starts + Mid-teens
Golf + Mid-single digits
Slow growth expected for most end markets in 2014;
Revenue range +3% to +4%
19
Summary
• Well positioned for the future – with strong
momentum and further upside
‒ Attractive end markets
‒ Leading brands and growth from innovation
‒ Strong penetration and positioning in developing
markets with significant potential
• Integration of businesses delivering sustainable
results
• OPEX will generate improved efficiencies, margins
and speed to market
• Increased focus on delivering organic growth
– Extending OPEX principles to generating ideas
and developing and launching products
• Strong cash generation and disciplined capital
allocation to deliver returns to shareholders
Much progress…Much more opportunity ahead

20