michael d. antonovich - department of public healthpublichealth.lacounty.gov/ · michael d....
TRANSCRIPT


July 18, 2008 Dear Colleague: I am pleased to release the 2007 Sexually Transmitted Disease Morbidity Report for Los AngelesThe report is produced to summarize sexually transmitted disease morbidity, identify trends and and provide comprehensive updates on reportable sexually transmitted disease in Los Angeles C The report is continually published in two separate volumes. The first volume presents an overalAngeles County Summary and is designed to provide a broader picture of sexually transmitted diswhereas the second volume is focused on morbidity and trends within each of the eight Los AngeService Planning Areas. Both volumes are organized in a similar manner with summary sectionsby sections on chlamydia, gonorrhea, syphilis and pelvic inflammatory disease. Please note that all tables and figures in this edition supersede those in earlier publications, and scomparisons can not be made with state and national data, as they are not officially released yet aof this report. I hope that this report serves as a resource for healthcare providers, public health officials, and otmakers to help direct disease prevention efforts. Sincerely,
Peter R. Kerndt, M.D., M.P.H. Director, Sexually Transmitted Disease Program Los Angeles County Department of Public Health PRK:zz
JONATHAN E. FIELDING, M.D., M.P.H. Director and Health Officer JONATHAN E. FREEDMAN Chief Deputy Director PETER R. KERNDT, M.D., M.P.H. Director, Sexually Transmitted Disease Program 2615 South Grand Avenue, Room 500 Los Angeles, California 90007 TEL (213) 744-3070 • FAX (213) 749-9606 www.publichealth.lacounty.gov
County. patterns, ounty.
l Los ease trends, les County followed
ome t the time
her policy-
BOARD OF SUPERVISORS
Gloria Molina First District Yvonne B. Burke Second District Zev Yaroslavsky Third District Don Knabe Fourth District Michael D. Antonovich Fifth District

The Sexually Transmitted Disease Morbidity Report is published on a yearly basis by the Sexually Transmitted Disease Program of the Los Angeles County Department of Public Health. This report is also available in PDF format, at http://publichealth.lacounty.gov/std/. If you would like to receive surveillance reports and other information from the STD Program, register for STDInfo online at http://ladhs.org/listserv.
SUGGESTED CITATION Sexually Transmitted Disease Program, Los Angeles County Department of Public Health. 2007 Sexually Transmitted Disease Morbidity Report. Volume 1: County Summary.
Department of Public Health
Jonathan E. Fielding, M.D., M.P.H. Director and Health Officer, Public Health
Jonathan E. Freedman, M.S.P.H.
Chief Deputy Director
Robert Kim-Farley, M.D., M.P.H. Director, Communicable Disease Control and
Prevention
Sexually Transmitted Disease Program
Peter R. Kerndt, M.D., M.P.H. Director, Sexually Transmitted Disease Program
Sarah Guerry, M.D.
Clinical Services Division Alison Stirland, Susan Walker, Christine Wigen
Melina Boudov, M.A
Clinical Services Division - Infertility Prevention Project Sara Alvarez, Kimberly Coffee, David De la Riva,
Kimberly Givan, Zakiya Hill, Marisol Mejia, Judith Melendez. Kirsten Wilson
Monica Munoz, R.N., B.S.N., M.P.H.
Clinical Services Division: Nursing Unit Jeanette Wilson-Brown, Raquel Fernandez, Fayga
Greiner, Lenita Johnson, Aineeh Montano Lee, Alicia Magbanua, Ramon Mendoza, Terry Miller, Audrey
Miyahira, Franklin Villacres, Jennifer Vonghack
Jorge A. Montoya, Ph.D. Outreach, Research, Communication, and
Assessment Aaron Plant, Harlan Rotblatt
Getahun Aynalem, M.D., M.P.H.
Epidemiology Unit Michael Chien, Binh Goldstein, Megan Lazzar, Ellen
Rudy
Frank Ramirez Field Operations
Felipe Arevalo, Maria Arevalo, John Cabeso, Guillero Campos, Sandra Chacon, Yee (Sally) Chan, Johnny Cross, Yvonne Curtis, Patricia Dominguez, Kartrin Eskandary, Natalie Kelly, Janae Kingcade, Vince
Lewis, Margarita Melgoza, Thelma McClinton, Gentamu (Jenny) McKinney, Gabriel Montano,
Roberto Rocha, Fumni (Flo) Thomas, Eleanor Tupas, Jessica Utley, Elizabeth Valencia, Jolene Yoneoka,
Leslie Zuniga
Jane Steinberg, Ph.D., M.P.H. Programs, Policy and Legislative Affairs (PPLA) Unit
Ana Hernandez, Phoebe Macon, Philip Phan, Peter Prampetch, Araceli (Sally) Villanueva
Kai-Jen Cheng, M.S.
Information Systems Division Rosa Babalian, Adolph (Mark) Banks, Yetimwork Campbell, Debra Campos, Cynthia Carr, Susanna
Chalikyan, Tefuldo Cruz, Jean Patryck de Ynchausti, Yolanda Galvan, Mildred Gonzales, Alice Gonzalez,
Nawal Habashi, Ping (Peter) He, Lan Lam, Julius Lim, Yun-Baw (Albert) Lin, Debra Liscano, Alexander Mok,
Jacqueline Moore, Shakeh Novagian, Issa Ortuno, Janet Paul, Ramon Reyes, Harry Rollins, Valerie Rosiles, Terrie Ross, Joselene Samson, Michael
Saucedo, Lillian Tom, Tran, Xiaomei Tong, Adeline Umboh, Chi-Ngai (David) Yu,
Zhiwei (Waley) Zeng
Mary Hayes Quality Assurance, Custody, and Mobile Testing Unit
Patricia Barnett, Annisa Brown, Mario Campana, Sandra Chacon, Cynthia Davison, Oscar Dimas,
James Fountain, Michael Granado, Lori Laubacher, Vince Lewis, Carol Magee, Kenneth Myers, Leanne
Olea, Irene Robles, Willie Sledge, Tracy Smith, Consuelo Vieyra
Sexually Transmitted Disease Morbidity Report – 2007 (Volume 1)
CONTENTS _____________________________________________________________________________
I. Summary
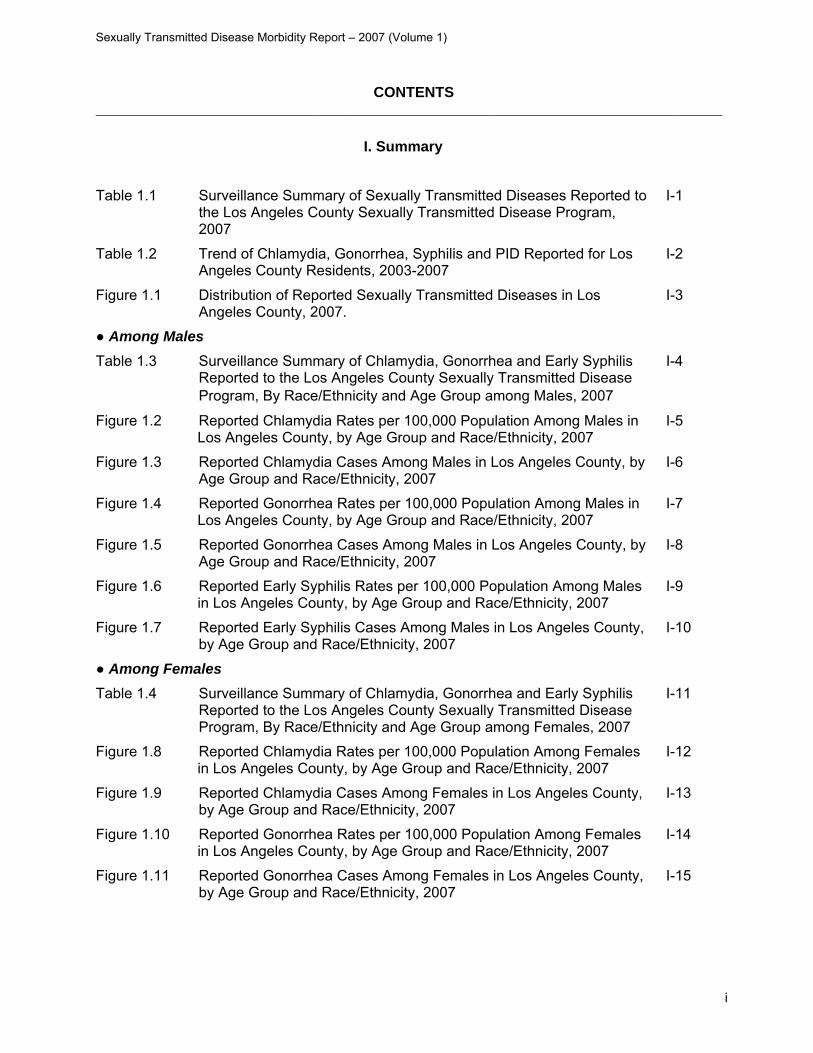
Table 1.1
Surveillance Summary of Sexually Transmitted Diseases Reported to the Los Angeles County Sexually Transmitted Disease Program, 2007
I-1
Table 1.2 Trend of Chlamydia, Gonorrhea, Syphilis and PID Reported for Los Angeles County Residents, 2003-2007
I-2
Figure 1.1 Distribution of Reported Sexually Transmitted Diseases in Los Angeles County, 2007.
I-3
● Among Males
Table 1.3
Surveillance Summary of Chlamydia, Gonorrhea and Early Syphilis Reported to the Los Angeles County Sexually Transmitted Disease Program, By Race/Ethnicity and Age Group among Males, 2007
I-4
Figure 1.2 Reported Chlamydia Rates per 100,000 Population Among Males in Los Angeles County, by Age Group and Race/Ethnicity, 2007
I-5
Figure 1.3 Reported Chlamydia Cases Among Males in Los Angeles County, by Age Group and Race/Ethnicity, 2007
I-6
Figure 1.4 Reported Gonorrhea Rates per 100,000 Population Among Males in Los Angeles County, by Age Group and Race/Ethnicity, 2007
I-7
Figure 1.5 Reported Gonorrhea Cases Among Males in Los Angeles County, by Age Group and Race/Ethnicity, 2007
I-8
Figure 1.6 Reported Early Syphilis Rates per 100,000 Population Among Males in Los Angeles County, by Age Group and Race/Ethnicity, 2007
I-9
Figure 1.7 Reported Early Syphilis Cases Among Males in Los Angeles County, by Age Group and Race/Ethnicity, 2007
I-10
● Among Females Table 1.4
Surveillance Summary of Chlamydia, Gonorrhea and Early Syphilis Reported to the Los Angeles County Sexually Transmitted Disease Program, By Race/Ethnicity and Age Group among Females, 2007
I-11
Figure 1.8 Reported Chlamydia Rates per 100,000 Population Among Females in Los Angeles County, by Age Group and Race/Ethnicity, 2007
I-12
Figure 1.9 Reported Chlamydia Cases Among Females in Los Angeles County, by Age Group and Race/Ethnicity, 2007
I-13
Figure 1.10 Reported Gonorrhea Rates per 100,000 Population Among Females in Los Angeles County, by Age Group and Race/Ethnicity, 2007
I-14
Figure 1.11 Reported Gonorrhea Cases Among Females in Los Angeles County, by Age Group and Race/Ethnicity, 2007
I-15
i
Sexually Transmitted Disease Morbidity Report – 2007 (Volume 1)
Figure 1.12 Reported Early Syphilis Rates per 100,000 Population Among Females in Los Angeles County, by Age Group and Race/Ethnicity, 2007
I-16
Figure 1.13 Reported Early Syphilis Cases Among Females in Los Angeles County, by Age Group and Race/Ethnicity, 2007
I-17
II. Chlamydia
● National, State and County Comparisons
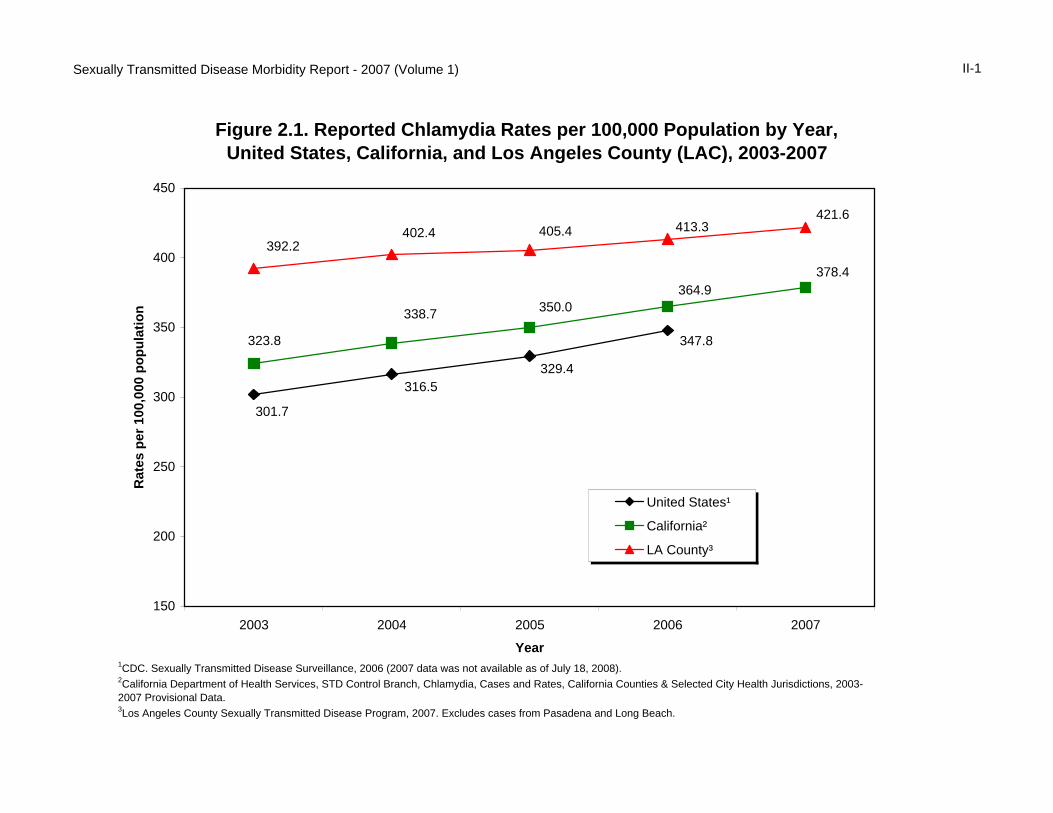
Figure 2.1 Reported Chlamydia Rates per 100,000 Population by Year, United States, California, and Los Angeles County (LAC), 2003-2007
II-1
● By Age Table 2.1 Reported Chlamydia Cases and Rates per 100,000 Population by
Age Group, Los Angeles County, 2003-2007 II-2
Figure 2.2 Reported Chlamydia Rates per 100,000 in Los Angeles County, by Age Group, 2007
II-3
● By Gender Table 2.2 Reported Chlamydia Cases and Rates per 100,000 Population by
Gender and Age Group, Los Angeles County, 2003-2007II-4
Figure 2.3 Reported Chlamydia Rates per 100,000 Population in Los Angeles County, by Gender and Year
II-5
Figure 2.4 Reported Chlamydia Rates per 100,000 Population in Los Angeles County, by Gender and Age Group, 2007
II-6
● By Race/Ethnicity Table 2.3 Reported Chlamydia Cases and Rates per 100,000 Population by
Gender and Race/Ethnicity, Los Angeles County, 2003-2007 II-7
Figure 2.5 Reported Chlamydia Rates per 100,000 Population in Los Angeles County, by Gender and Race/Ethnicity, 2007
II-8
● By Service Planning Area and Health District Table 2.4 Reported Chlamydia Cases and Rates per 100,000 Population by
Service Planning Area (SPA) and Health District (HD), Los Angeles County, 2003-2007
II-9
Figure 2.6 Reported Chlamydia Rates per 100,000 Population in Los Angeles County, by Service Planning Area, 2007
II-10
III. Gonorrhea
● National, State and County Comparisons
Figure 3.1 Reported Gonorrhea Rates per 100,000 Population by Year, United States, California, and Los Angeles County (LAC), 2003-2007
III-1
ii

Sexually Transmitted Disease Morbidity Report – 2007 (Volume 1)
● By Age
Table 3.1 Reported Gonorrhea Cases and Rates per 100,000 Population by Age Group, Los Angeles County, 2003-2007
III-2
Figure 3.2 Reported Gonorrhea Rates per 100,000 in Los Angeles County, by Age Group, 2007
III-3
● By Gender Table 3.2 Reported Gonorrhea Cases and Rates per 100,000 Population by
Gender and Age Group, Los Angeles County, 2003-2007III-4
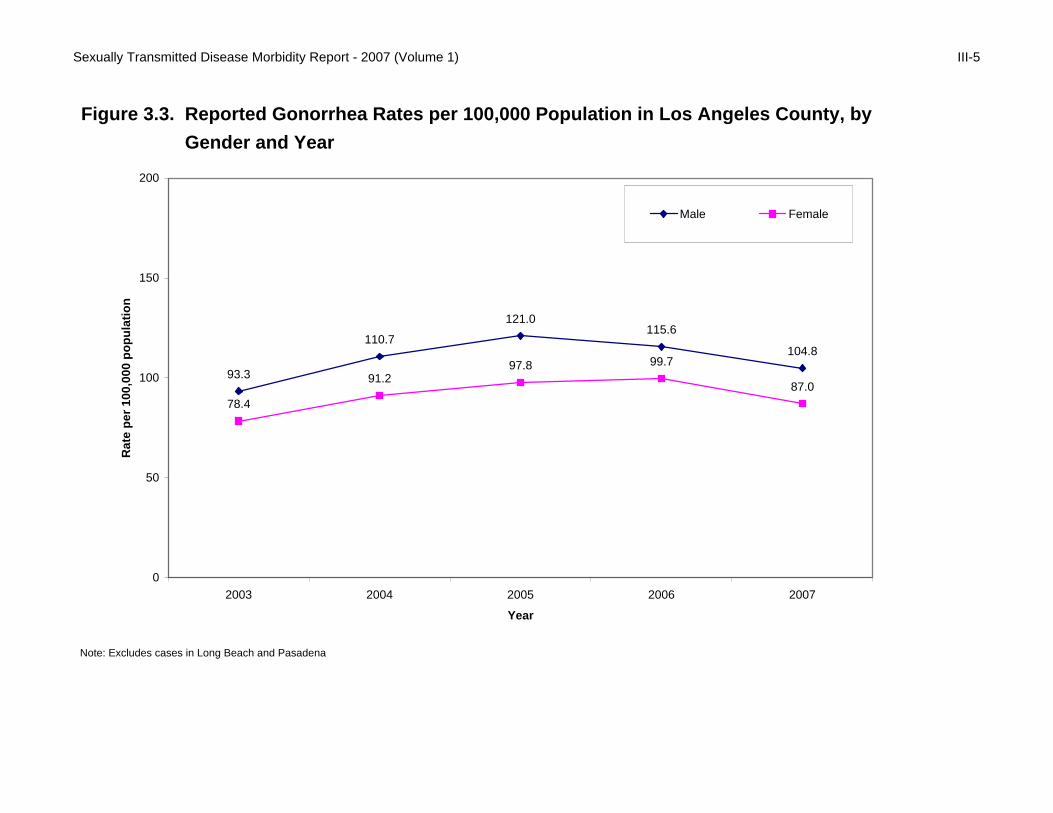
Figure 3.3 Reported Gonorrhea Rates per 100,000 Population in Los Angeles County, by Gender and Year
III-5
Figure 3.4 Reported Gonorrhea Rates per 100,000 Population in Los Angeles County, by Gender and Age Group, 2007
III-6
● By Race/Ethnicity
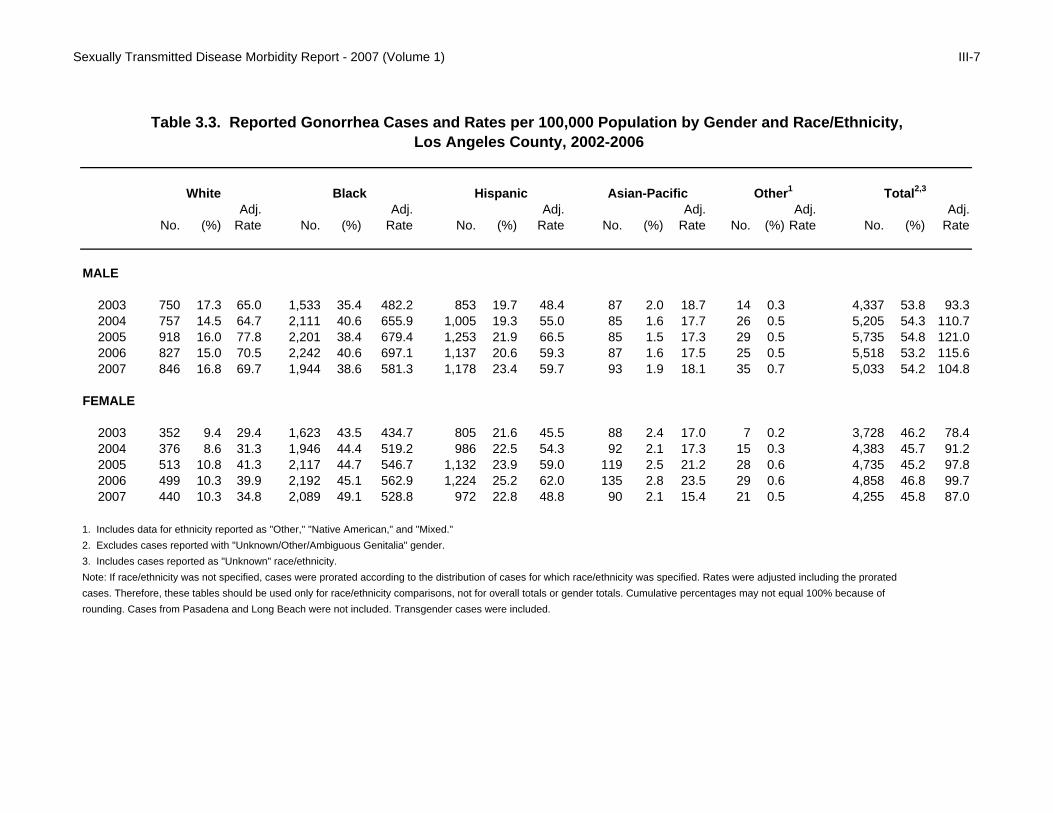
Table 3.3 Reported Gonorrhea Cases and Rates per 100,000 Population by Gender and Race/Ethnicity, Los Angeles County, 2003-2007
III-7
Figure 3.5 Reported Gonorrhea Rates per 100,000 Population in Los Angeles County, by Gender and Race/Ethnicity, 2007
III-8
● By Service Planning Area and Health District Table 3.4 Reported Gonorrhea Cases and Rates per 100,000 Population by
Service Planning Area (SPA) and Health District (HD), Los Angeles County, 2003-2007
III-9
Figure 3.6 Reported Gonorrhea Rates per 100,000 Population in Los Angeles County, by Service Planning Area, 2007
III-10
IV. Primary and Secondary Syphilis
● National, State and County Comparisons
Figure 4.1 Reported Primary and Secondary Syphilis Rates per 100,000 Population by Year, United States, California, and Los Angeles County (LAC), 2003-2007
IV-1
● By Age
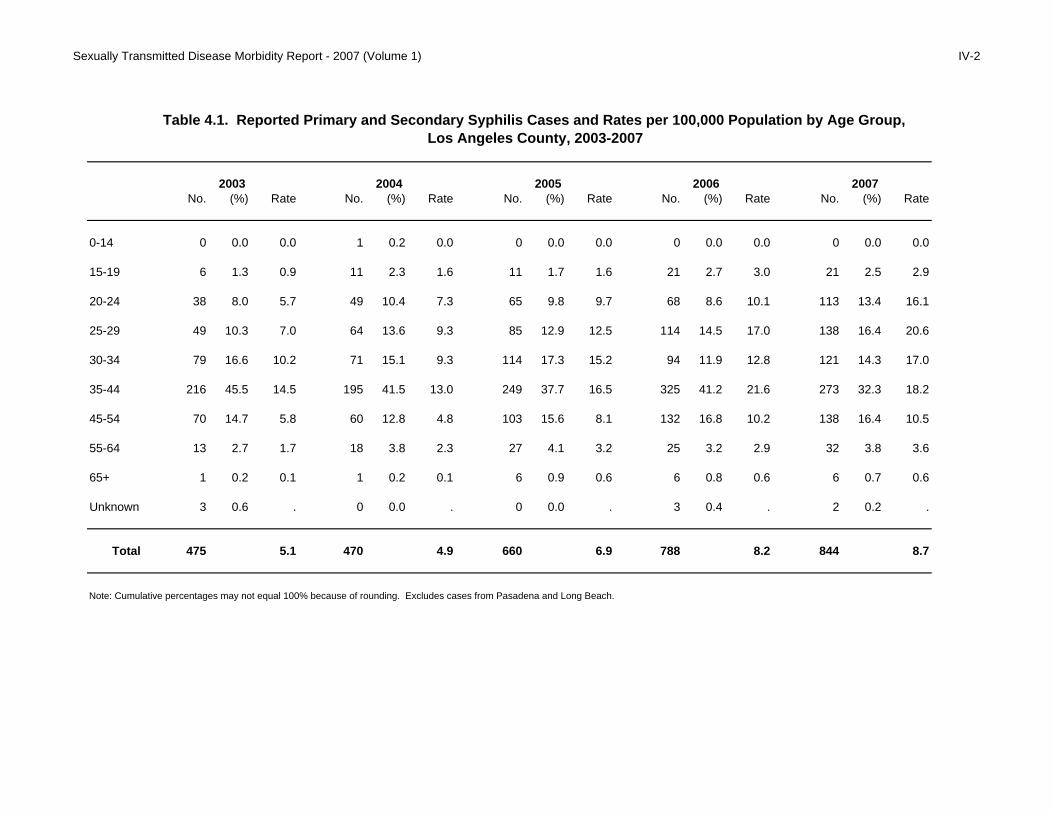
Table 4.1 Reported Primary and Secondary Syphilis Cases and Rates per 100,000 Population by Age Group, Los Angeles County, 2003-2007
IV-2
Figure 4.2 Reported Primary and Secondary Syphilis Rates per 100,000 in Los Angeles County, by Age Group, 2007
IV-3
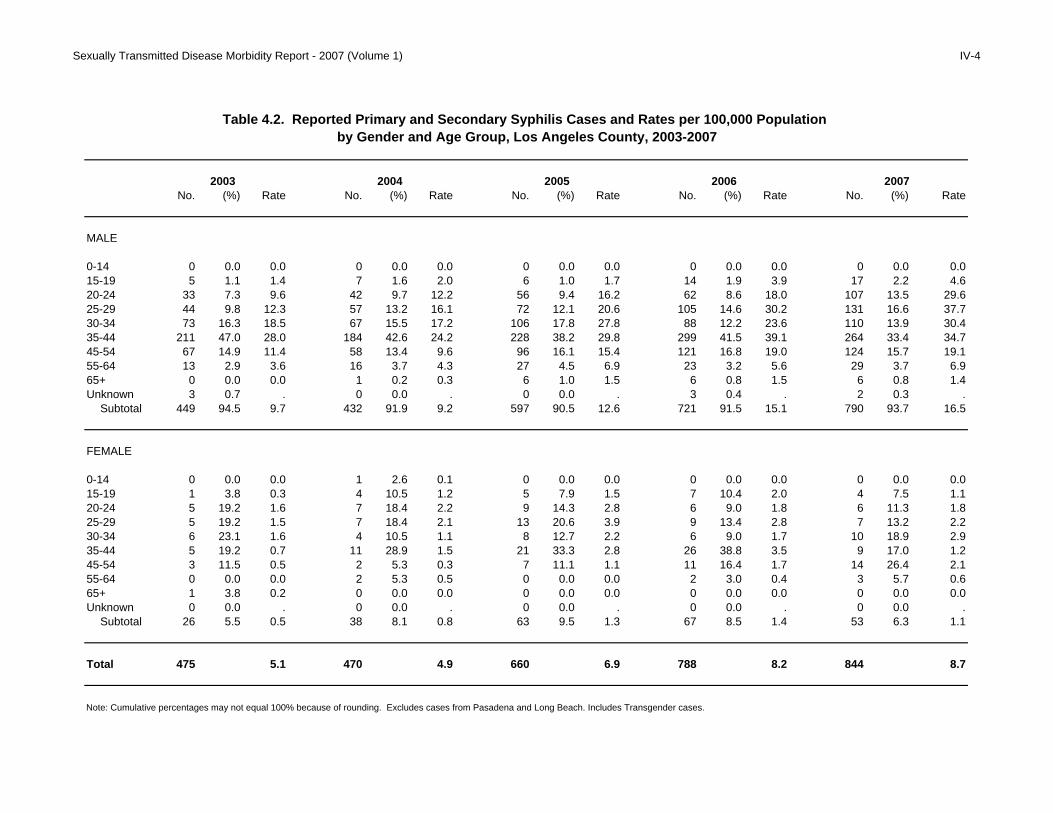
● By Gender Table 4.2 Reported Primary and Secondary Syphilis Cases and Rates per
100,000 Population by Gender and Age Group, Los Angeles County, 2003-2007
IV-4
iii

Sexually Transmitted Disease Morbidity Report – 2007 (Volume 1)
Figure 4.3 Reported Primary and Secondary Syphilis Rates per 100,000 Population in Los Angeles County, by Gender and Year
IV-5
Figure 4.4 Reported Primary and Secondary Syphilis Rates per 100,000 Population in Los Angeles County, by Gender and Age Group, 2007
IV-6
● By Race/Ethnicity
Table 4.3 Reported Primary and Secondary Syphilis Cases and Rates per 100,000 Population by Gender and Race/Ethnicity, Los Angeles County, 2003-2007
IV-7
Figure 4.5 Reported Primary and Secondary Syphilis Rates per 100,000 Population in Los Angeles County, by Gender and Race/Ethnicity, 2007
IV-8
● By Service Planning Area and Health District Table 4.4 Reported Primary and Secondary Syphilis Cases and Rates per
100,000 Population by Service Planning Area (SPA) and Health District (HD), Los Angeles County, 2003-2007
IV-9
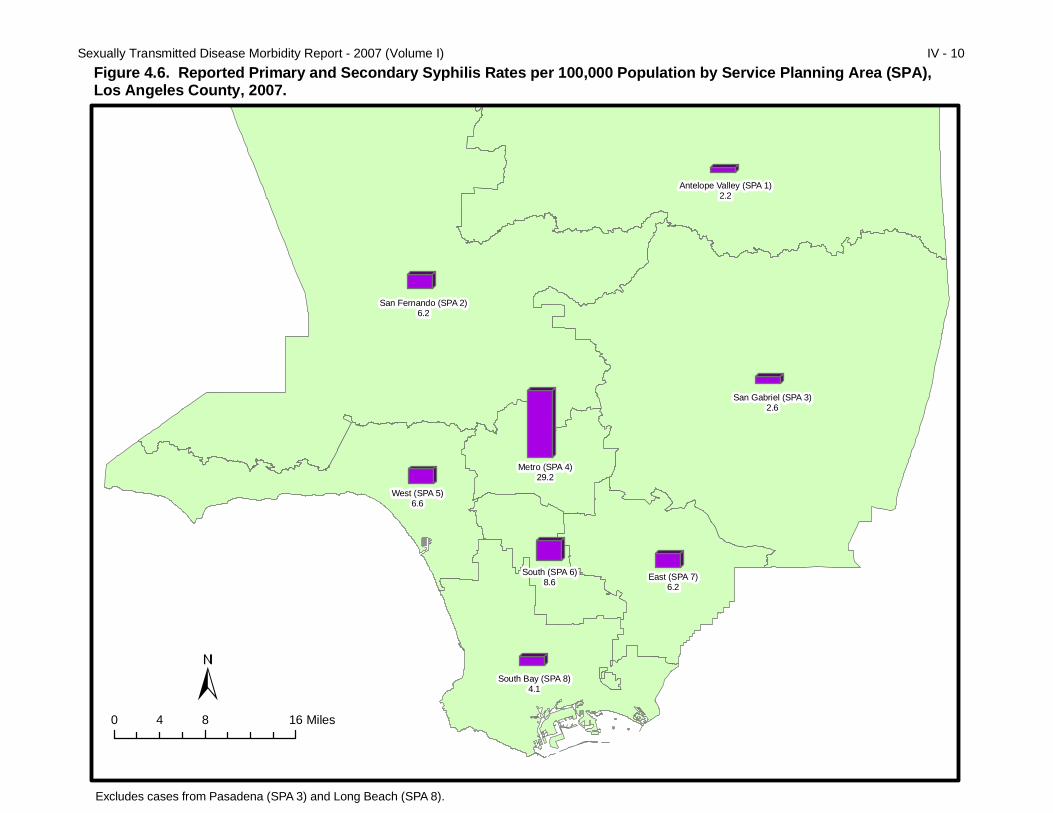
Figure 4.6 Reported Primary and Secondary Syphilis Rates per 100,000 Population in Los Angeles County, by Service Planning Area, 2007
IV-10
V. Early Latent Syphilis
● National, State and County Comparisons
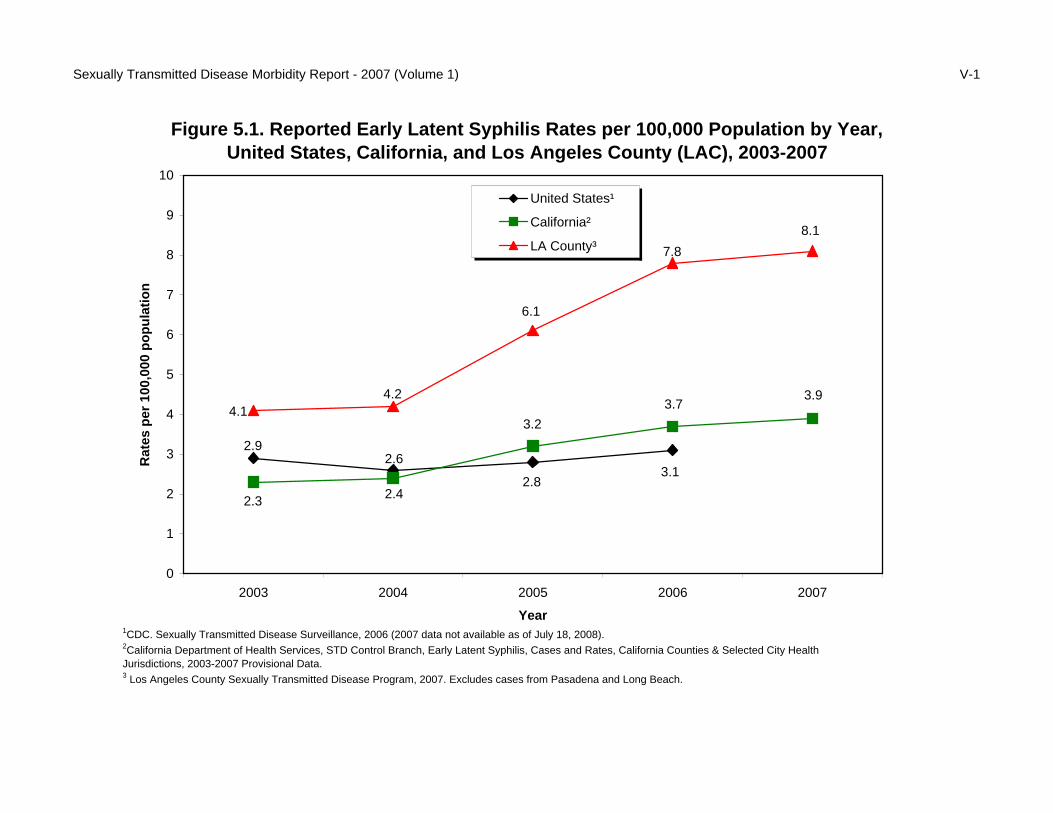
Figure 5.1 Reported Early Latent Syphilis Rates per 100,000 Population by Year, United States, California, and Los Angeles County (LAC), 2003-2007
V-1
● By Age
Table 5.1 Reported Early Latent Syphilis Cases and Rates per 100,000 Population by Age Group, Los Angeles County, 2003-2007
V-2
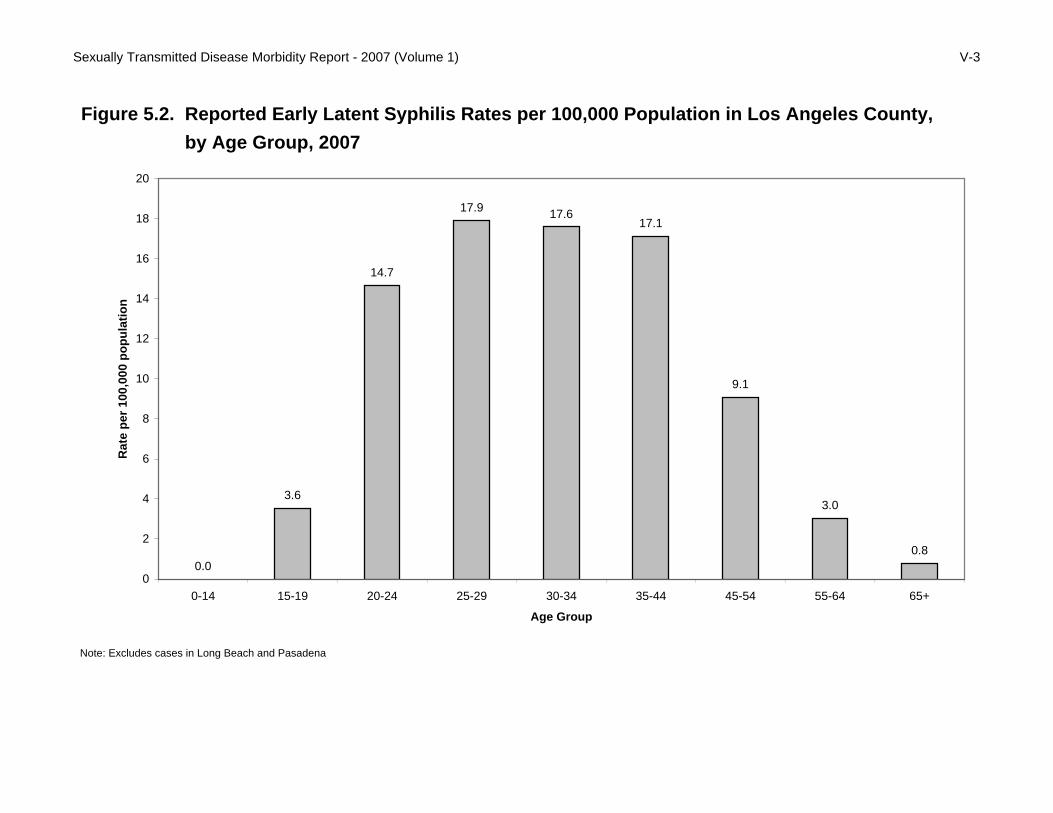
Figure 5.2 Reported Early Latent Syphilis Rates per 100,000 in Los Angeles County, by Age Group, 2007
V-3
● By Gender Table 5.2 Reported Early Latent Syphilis Cases and Rates per 100,000
Population by Gender and Age Group, Los Angeles County, 2003-2007
V-4
Figure 5.3 Reported Early Latent Syphilis Rates per 100,000 Population in Los Angeles County, by Gender and Year
V-5
Figure 5.4 Reported Early Latent Syphilis Rates per 100,000 Population in Los Angeles County, by Gender and Age Group, 2007
V-6
● By Race/Ethnicity
Table 5.3 Reported Early Latent Syphilis Cases and Rates per 100,000 Population by Gender and Race/Ethnicity, Los Angeles County, 2003-2007
V-7
iv
Sexually Transmitted Disease Morbidity Report – 2007 (Volume 1)
Figure 5.5 Reported Early Latent Syphilis Rates per 100,000 Population in Los Angeles County, by Gender and Race/Ethnicity, 2007
V-8
● By Service Planning Area and Health District Table 5.4 Reported Early Latent Syphilis Cases and Rates per 100,000
Population by Service Planning Area (SPA) and Health District (HD), Los Angeles County, 2003-2007
V-9
Figure 5.6 Reported Early Latent Syphilis Rates per 100,000 Population in Los Angeles County, by Service Planning Area, 2007
V-10
VI. Late and Late Latent Syphilis
● National, State and County Comparisons
Figure 6.1 Reported Late and Late Latent Syphilis Rates by Year, United States, California, and Los Angeles County (LAC), 2003-2007
VI-1
● By Age
Table 6.1 Reported Late and Late Latent Syphilis Cases and Rates per 100,000 Population by Age Group, Los Angeles County, 2003-2007
VI-2
● By Gender Table 6.2 Reported Late and Late Latent Syphilis Cases and Rates per 100,000
Population by Gender and Age Group, Los Angeles County, 2003-2007
VI-3
Table 6.3 Reported Late and Late Latent Syphilis Cases and Rates per 100,000 Population by Gender and Race/Ethnicity, Los Angeles County, 2003-2007
VI-4
● By Service Planning Area and Health District Table 6.4 Reported Late and Late Latent Syphilis Cases and Rates per 100,000
Population by Service Planning Area (SPA) and Health District (HD), Los Angeles County, 2003-2007
VI-5
Figure 6.2 Reported Late and Late Latent Syphilis Cases and Rates per 100,000 Population by Service Planning Area (SPA), Los Angeles County, 2003-2007
VI-6
VII. Congenital Syphilis
● National, State and County Comparisons
Figure 7.1 Reported Presumptive Congenital Syphilis Rates by Year, United States, California, and Los Angeles County (LAC), 2003-2007
VII-1
v

Sexually Transmitted Disease Morbidity Report – 2007 (Volume 1)
● By Race/Ethnicity
Table 7.1 Reported Presumptive Congenital Syphilis Cases and Rates per 100,000 Live Births by Race/Ethnicity, Los Angeles County, 2003-2007
VII-2
● By Service Planning Area and Health District Table 7.2 Reported Presumptive Congenital Syphilis Cases and Rates per
100,000 Live Births by Service Planning Area (SPA) and Health District (HD), Los Angeles County, 2003-2007
VII-3
VIII. All Pelvic Inflammatory Disease (PID)
● By Age
Table 8.1 Reported All Pelvic Inflammatory Disease (PID) Cases and Rates per 100,000 Female Population by Age Group, Los Angeles County, 2003-2007
VIII-1
Figure 8.1
Reported All Pelvic Inflammatory Disease (PID) Rates per 100,000 Female Population in Los Angeles County, by Age Group, 2007
VIII-2
● By Race/Ethnicity
Table 8.2 Reported All Pelvic Inflammatory Disease (PID) Cases and Rates per 100,000 Female Population by Race/Ethnicity, Los Angeles County, 2003-2007
VIII-3
Figure 8.2
Reported All Pelvic Inflammatory Disease (PID) Rates per 100,000 Female Population in Los Angeles County, by Race/Ethnicity, 2007
VIII-4
● By Service Planning Area and Health District Table 8.3 Reported All Pelvic Inflammatory Disease (PID) Cases and Rates per
100,000 Female Population by Service Planning Area (SPA) and Health District (HD), Los Angeles County, 2003-2007
VIII-5
Figure 8.3
Reported All Pelvic Inflammatory Disease (PID) Rates per 100,000 Population in Los Angeles County, by Service Planning Area, 2007
VIII-6
IX. Technical Notes and Appendices
Technical Notes IX-1
Appendix A: Where to Report Communicable Diseases in Los Angeles County IX-5
Appendix B: Title 17, California Code of Regulations (CCR) §2500, §2593, §2641-2643, and §2800-2812 Reportable Disease and Conditions
IX-6
Appendix C: Journal Publications and Conference Abstracts IX-7
vi

Sexually Transmitted Disease Morbidity Report, 2007
Section I: Summary
Sexually Transmitted Disease Morbidity Report - 2007 (Volume I) I-1
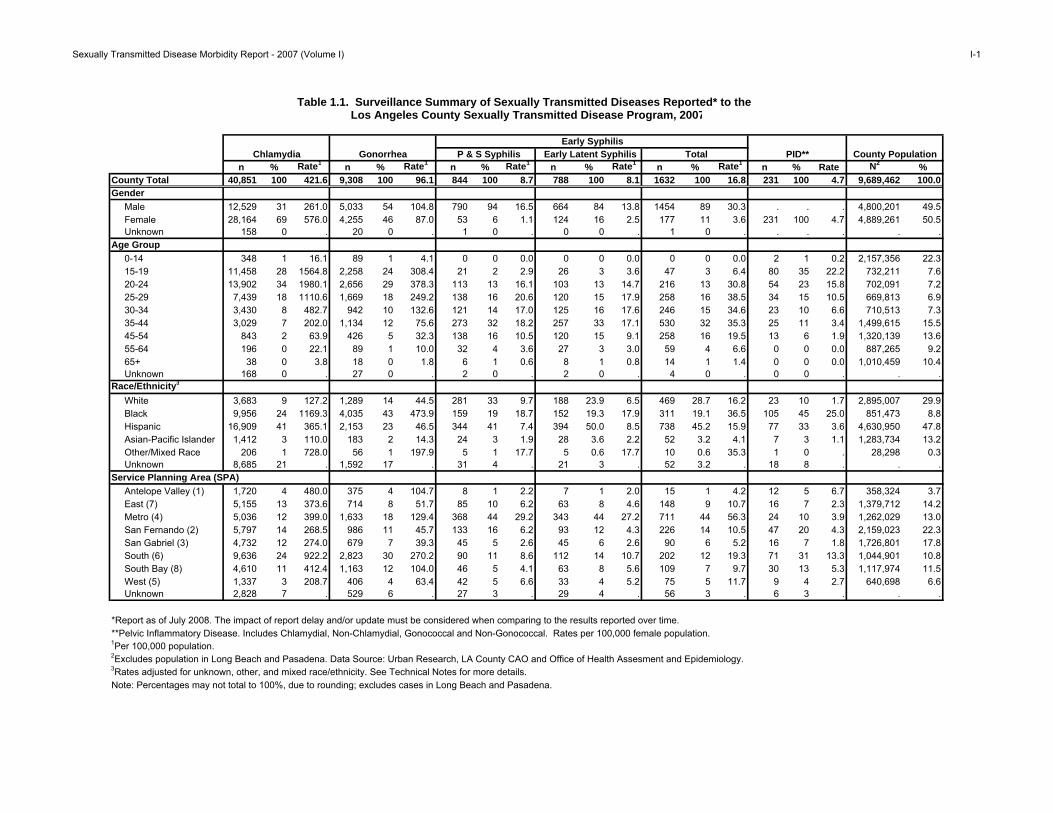
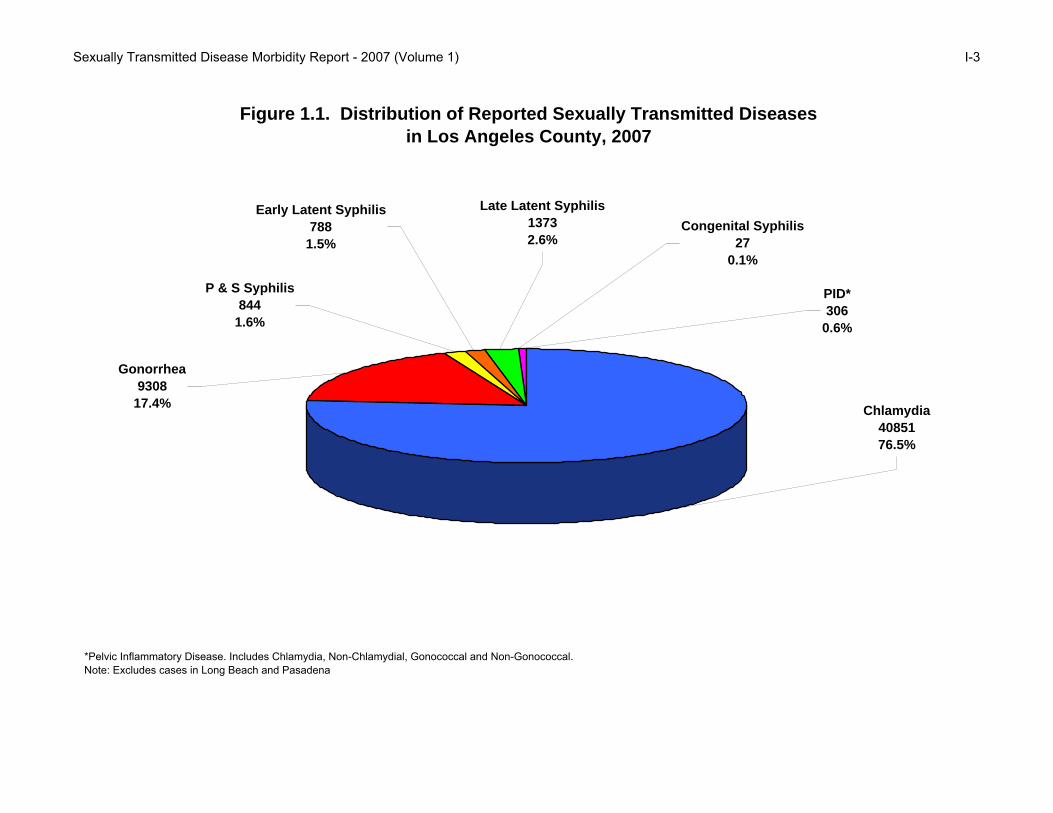
n % Rate1 n % Rate1 n % Rate1 n % Rate1 n % Rate1 n % Rate N2 %County Total 40,851 100 421.6 9,308 100 96.1 844 100 8.7 788 100 8.1 1632 100 16.8 231 100 4.7 9,689,462 100.0Gender Male 12,529 31 261.0 5,033 54 104.8 790 94 16.5 664 84 13.8 1454 89 30.3 . . . 4,800,201 49.5 Female 28,164 69 576.0 4,255 46 87.0 53 6 1.1 124 16 2.5 177 11 3.6 231 100 4.7 4,889,261 50.5 Unknown 158 0 . 20 0 . 1 0 . 0 0 . 1 0 . . . . . .Age Group 0-14 348 1 16.1 89 1 4.1 0 0 0.0 0 0 0.0 0 0 0.0 2 1 0.2 2,157,356 22.3 15-19 11,458 28 1564.8 2,258 24 308.4 21 2 2.9 26 3 3.6 47 3 6.4 80 35 22.2 732,211 7.6 20-24 13,902 34 1980.1 2,656 29 378.3 113 13 16.1 103 13 14.7 216 13 30.8 54 23 15.8 702,091 7.2 25-29 7,439 18 1110.6 1,669 18 249.2 138 16 20.6 120 15 17.9 258 16 38.5 34 15 10.5 669,813 6.9 30-34 3,430 8 482.7 942 10 132.6 121 14 17.0 125 16 17.6 246 15 34.6 23 10 6.6 710,513 7.3 35-44 3,029 7 202.0 1,134 12 75.6 273 32 18.2 257 33 17.1 530 32 35.3 25 11 3.4 1,499,615 15.5 45-54 843 2 63.9 426 5 32.3 138 16 10.5 120 15 9.1 258 16 19.5 13 6 1.9 1,320,139 13.6 55-64 196 0 22.1 89 1 10.0 32 4 3.6 27 3 3.0 59 4 6.6 0 0 0.0 887,265 9.2 65+ 38 0 3.8 18 0 1.8 6 1 0.6 8 1 0.8 14 1 1.4 0 0 0.0 1,010,459 10.4 Unknown 168 0 . 27 0 . 2 0 . 2 0 . 4 0 . 0 0 . . .Race/Ethnicity3
White 3,683 9 127.2 1,289 14 44.5 281 33 9.7 188 23.9 6.5 469 28.7 16.2 23 10 1.7 2,895,007 29.9 Black 9,956 24 1169.3 4,035 43 473.9 159 19 18.7 152 19.3 17.9 311 19.1 36.5 105 45 25.0 851,473 8.8 Hispanic 16,909 41 365.1 2,153 23 46.5 344 41 7.4 394 50.0 8.5 738 45.2 15.9 77 33 3.6 4,630,950 47.8 Asian-Pacific Islander 1,412 3 110.0 183 2 14.3 24 3 1.9 28 3.6 2.2 52 3.2 4.1 7 3 1.1 1,283,734 13.2 Other/Mixed Race 206 1 728.0 56 1 197.9 5 1 17.7 5 0.6 17.7 10 0.6 35.3 1 0 . 28,298 0.3 Unknown 8,685 21 . 1,592 17 . 31 4 . 21 3 . 52 3.2 . 18 8 . . .Service Planning Area (SPA) Antelope Valley (1) 1,720 4 480.0 375 4 104.7 8 1 2.2 7 1 2.0 15 1 4.2 12 5 6.7 358,324 3.7 East (7) 5,155 13 373.6 714 8 51.7 85 10 6.2 63 8 4.6 148 9 10.7 16 7 2.3 1,379,712 14.2 Metro (4) 5,036 12 399.0 1,633 18 129.4 368 44 29.2 343 44 27.2 711 44 56.3 24 10 3.9 1,262,029 13.0 San Fernando (2) 5,797 14 268.5 986 11 45.7 133 16 6.2 93 12 4.3 226 14 10.5 47 20 4.3 2,159,023 22.3 San Gabriel (3) 4,732 12 274.0 679 7 39.3 45 5 2.6 45 6 2.6 90 6 5.2 16 7 1.8 1,726,801 17.8 South (6) 9,636 24 922.2 2,823 30 270.2 90 11 8.6 112 14 10.7 202 12 19.3 71 31 13.3 1,044,901 10.8 South Bay (8) 4,610 11 412.4 1,163 12 104.0 46 5 4.1 63 8 5.6 109 7 9.7 30 13 5.3 1,117,974 11.5 West (5) 1,337 3 208.7 406 4 63.4 42 5 6.6 33 4 5.2 75 5 11.7 9 4 2.7 640,698 6.6 Unknown 2,828 7 . 529 6 . 27 3 . 29 4 . 56 3 . 6 3 . . .
*Report as of July 2008. The impact of report delay and/or update must be considered when comparing to the results reported over time. **Pelvic Inflammatory Disease. Includes Chlamydial, Non-Chlamydial, Gonococcal and Non-Gonococcal. Rates per 100,000 female population.1Per 100,000 population. 2Excludes population in Long Beach and Pasadena. Data Source: Urban Research, LA County CAO and Office of Health Assesment and Epidemiology.3Rates adjusted for unknown, other, and mixed race/ethnicity. See Technical Notes for more details.Note: Percentages may not total to 100%, due to rounding; excludes cases in Long Beach and Pasadena.
Table 1.1. Surveillance Summary of Sexually Transmitted Diseases Reported* to the Los Angeles County Sexually Transmitted Disease Program, 2007
GonorrheaChlamydia County Population P & S Syphilis Early Latent Syphilis PID** TotalEarly Syphilis

Sexually Transmitted Disease Morbidity Report - 2007 (Volume 1) I-2
Table 1.2. Trend of Chlamydia, Gonorrhea, Syphilis and PID* Reported for Los Angeles County Residents, 2003-2007
2003 2004 2005 2006 2007No. (%) Rate No. (%) Rate No. (%) Rate No. (%) Rate No. (%) Rate
Chlamydia1 36,873 78.3 392.2 38,256 76.0 402.4 38,838 74.1 405.4 39,862 74.1 413.3 40,851 76.4 421.6
Gonorrhea1 8,078 17.1 85.9 9,604 19.1 101.0 10,492 20.0 109.5 10,416 19.4 108.0 9,308 17.4 96.1
Syphilis
Primary and Secondary1 475 1.0 5.1 470 0.9 4.9 660 1.3 6.9 788 1.5 8.2 844 1.6 8.7
Early Latent1 387 0.8 4.1 397 0.8 4.2 584 1.1 6.1 750 1.4 7.8 788 1.5 8.1
Late & Late Latent1 988 2.1 10.5 1,270 2.5 13.4 1,494 2.9 15.6 1,637 3.0 17.0 1,373 2.6 14.2
Congenital2 31 0.1 22.7 24 0.0 17.6 31 0.1 21.6 30 0.1 21.2 27 0.1 20.9
PID* 276 0.6 5.8 291 0.6 6.1 322 0.6 6.7 306 0.6 6.3 231 0.4 4.7
Total Incidents** 47,108 50,312 52,421 53,789 53,422
1. Rates per 100,000 population.2. Rates per 100,000 live births.*Pelvic Inflammatory Disease. Includes Chlamydial, Non-Chlamydial, Gonococcal and Non-Gonococcal. Rates per 100,000 female population.**A case of Chlamydial or Gonococcal PID was counted as two infection incidents, one for Chlamydia or Gonorrhea and the other for PID.
Note: Cumulative percentages may not equal 100% because of rounding. Excludes cases from Pasadena and Long Beach.
Sexually Transmitted Disease Morbidity Report - 2007 (Volume 1) I-3
Gonorrhea9308
17.4%
Early Latent Syphilis788
1.5%
P & S Syphilis844
1.6%
PID*306
0.6%
Congenital Syphilis27
0.1%
Late Latent Syphilis13732.6%
Chlamydia4085176.5%
Figure 1.1. Distribution of Reported Sexually Transmitted Diseases in Los Angeles County, 2007
*Pelvic Inflammatory Disease. Includes Chlamydia, Non-Chlamydial, Gonococcal and Non-Gonococcal.Note: Excludes cases in Long Beach and Pasadena

Sexually Transmitted Disease Morbidity Report - 2007 (Volume 1) I-4
n % Rate1 n % Rate1 n % Rate1 n % Rate1 n % Rate1
Male Total2 12,529 100 261.0 5,033 100 104.8 790 100 16.5 664 100 13.8 1,454 100 30.3 White3
Total 1,289 100 111.2 846 100 69.7 274 100 19.7 175 100 12.4 449 100 32.1 Ages 0-14 0 0 0.0 0 0 0.0 0 0 0.0 0 0 0.0 0 0 0.0 15-19 111 9 127.7 32 4 36.8 3 1 3.5 0 0 0.0 3 1 3.5 20-24 324 25 370.5 152 18 173.8 15 5 17.2 7 4 8.0 22 5 25.2 25-29 287 22 377.9 164 19 215.9 34 12 44.8 12 7 15.8 46 10 60.6 30-34 169 13 191.5 121 14 137.1 31 11 35.1 20 11 22.7 51 11 57.8 35-44 262 20 112.0 259 31 110.7 114 42 48.7 79 45 33.8 193 43 82.5 45-54 100 8 39.6 94 11 37.3 60 22 23.8 45 26 17.8 105 23 41.6 55-64 24 2 12.9 21 2 11.3 12 4 6.4 9 5 4.8 21 5 11.3 65+ 6 0 2.8 2 0 0.9 4 1 1.9 3 2 1.4 7 2 3.3 Unknown 6 0 . 1 0 . 1 0 . 0 0 . 1 0 . Black3
Total 3,327 100 1041.5 1,944 100 581.3 138 100 36.0 112 100 28.9 250 100 64.9 Ages 0-14 38 1 41.0 11 1 11.9 0 0 0.0 0 0 0.0 0 0 0.0 15-19 1,000 30 2677.1 426 22 1140.4 6 4 16.1 6 5 16.1 12 5 32.1 20-24 1,108 33 3734.8 614 32 2069.6 30 22 101.1 14 13 47.2 44 18 148.3 25-29 508 15 2166.1 337 17 1437.0 27 20 115.1 12 11 51.2 39 16 166.3 30-34 250 8 1048.5 175 9 733.9 12 9 50.3 19 17 79.7 31 12 130.0 35-44 277 8 462.8 248 13 414.3 32 23 53.5 36 32 60.1 68 27 113.6 45-54 109 3 192.9 111 6 196.4 19 14 33.6 18 16 31.9 37 15 65.5 55-64 26 1 72.5 17 1 47.4 10 7 27.9 5 4 13.9 15 6 41.8 65+ 3 0 8.0 1 0 2.7 2 1 5.3 2 2 5.3 4 2 10.7 Unknown 8 0 . 4 0 . 0 0 . 0 0 . 0 0 . Hispanic3
Total 4,416 100 234.5 1,178 100 59.7 321 100 14.2 331 100 14.5 652 100 28.7 Ages 0-14 17 0 2.5 7 1 1.0 0 0 0.0 0 0 0.0 0 0 0.0 15-19 909 21 443.3 156 13 76.1 8 2 3.9 12 4 5.9 20 3 9.8 20-24 1,520 34 770.6 323 27 163.7 58 18 29.4 51 15 25.9 109 17 55.3 25-29 949 21 461.0 275 23 133.6 64 20 31.1 63 19 30.6 127 19 61.7 30-34 476 11 236.1 172 15 85.3 55 17 27.3 58 18 28.8 113 17 56.0 35-44 415 9 112.9 173 15 47.1 97 30 26.4 99 30 26.9 196 30 53.3 45-54 92 2 37.9 54 5 22.2 33 10 13.6 35 11 14.4 68 10 28.0 55-64 18 0 14.0 10 1 7.8 5 2 3.9 9 3 7.0 14 2 10.9 65+ 4 0 3.9 5 0 4.8 0 0 0.0 3 1 2.9 3 0 2.9 Unknown 16 0 . 3 0 . 1 0 . 1 0 . 2 0 .Other Total 467 100 90.4 128 100 24.8 29 100 5.6 31 100 6.0 60 100 11.6 Ages 0-14 0 0 0.0 0 0 0.0 0 0 0.0 0 0 0.0 0 0 0.0 15-19 52 11 120.1 12 9 27.7 0 0 0.0 1 3 2.3 1 2 2.3 20-24 132 28 282.8 27 21 57.8 0 0 0.0 8 26 17.1 8 13 17.1 25-29 111 24 264.5 31 24 73.9 6 21 14.3 7 23 16.7 13 22 31.0 30-34 57 12 119.1 27 21 56.4 7 24 14.6 3 10 6.3 10 17 20.9 35-44 86 18 86.2 20 16 20.0 11 38 11.0 10 32 10.0 21 35 21.0 45-54 17 4 17.3 8 6 8.1 4 14 4.1 2 6 2.0 6 10 6.1 55-64 10 2 14.6 1 1 1.5 1 3 1.5 0 0 0.0 1 2 1.5 65+ 1 0 1.4 1 1 1.4 0 0 0.0 0 0 0.0 0 0 0.0 Unknown 1 0 . 1 1 . 0 0 . 0 0 . 0 0 .
reported over time.1Per 100,000 population. 2Includes cases of unknown race/ethnicity. Excludes cases reported as "Unknown/Other/Ambiguous Genitalia" gender.3Rates adjusted for unknown, other, and mixed race/ethnicity. Note: Percentages may not total to 100%, due to rounding; excludes cases in Long Beach and Pasadena.
*Report as of July 2008. The impact of report delay and/or update must be considered when comparing to results
Table 1.3. Surveillance Summary of Chlamydia, Gonorrhea and Early Syphilis Reported* to
By Race/Ethnicity and Age Group among Males, 2007
Chlamydia Gonorrhea P & S Syphilis Total Early Latent SyphilisEarly Syphilis
the Los Angeles County Sexually Transmitted Disease Program,
Sexually Transmitted Disease Morbidity Report - 2007 (Volume 1) I-5
0-14 15-19 20-24 25-29 30-34 35-44 45-54 55-64 65+
OtherWhite
BlackHispanic0
500
1000
1500
2000
2500
3000
3500
4000R
ate
per 1
00,0
00 p
opul
atio
n
Age Group
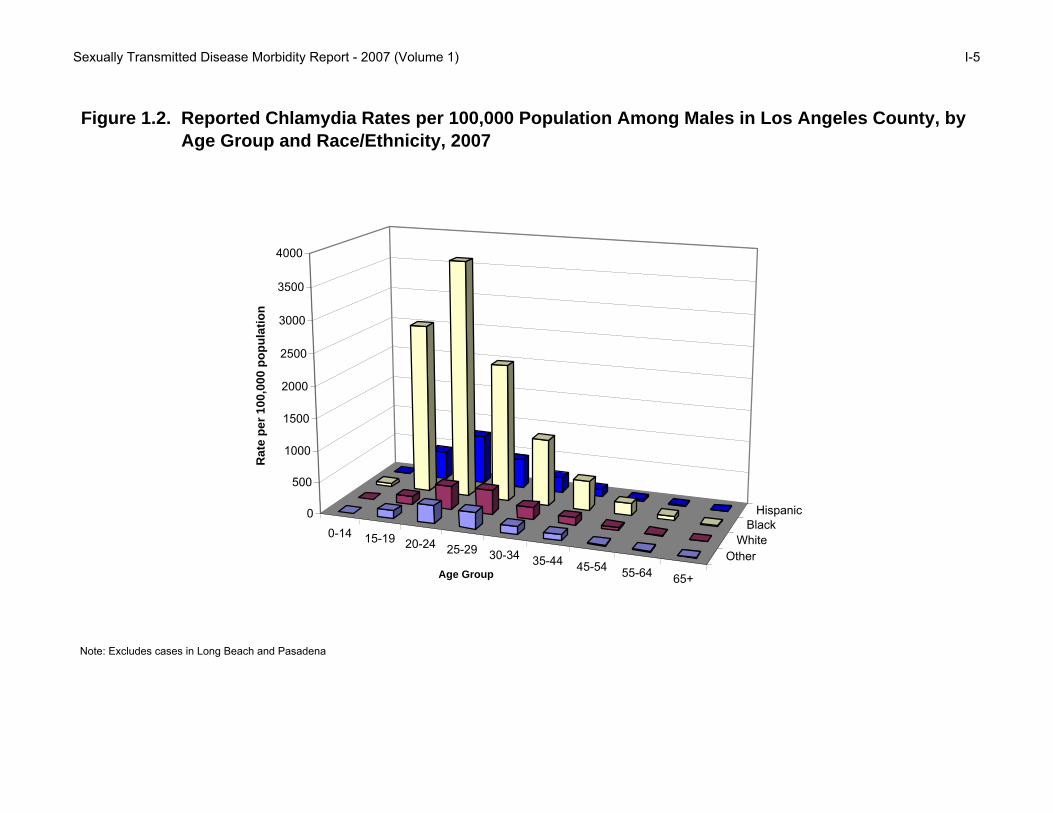
Figure 1.2. Reported Chlamydia Rates per 100,000 Population Among Males in Los Angeles County, by Age Group and Race/Ethnicity, 2007
Note: Excludes cases in Long Beach and Pasadena

Sexually Transmitted Disease Morbidity Report - 2007 (Volume 1) I-6
0-14 15-19 20-24 25-29 30-34 35-44 45-54 55-64 65+
OtherWhite
BlackHispanic0
200
400
600
800
1000
1200
1400
1600N
umbe
r of C
ases
Age Group
Figure 1.3. Reported Chlamydia Cases Among Males in Los Angeles County, by Age Group and Race/Ethnicity, 2007
Note: Excludes cases in Long Beach and Pasadena
Sexually Transmitted Disease Morbidity Report - 2007 (Volume 1) I-7
0-14 15-19 20-24 25-29 30-34 35-44 45-54 55-64 65+
OtherWhite
BlackHispanic0
500
1000
1500
2000
2500R
ate
per 1
00,0
00 p
opul
atio
n
Age Group
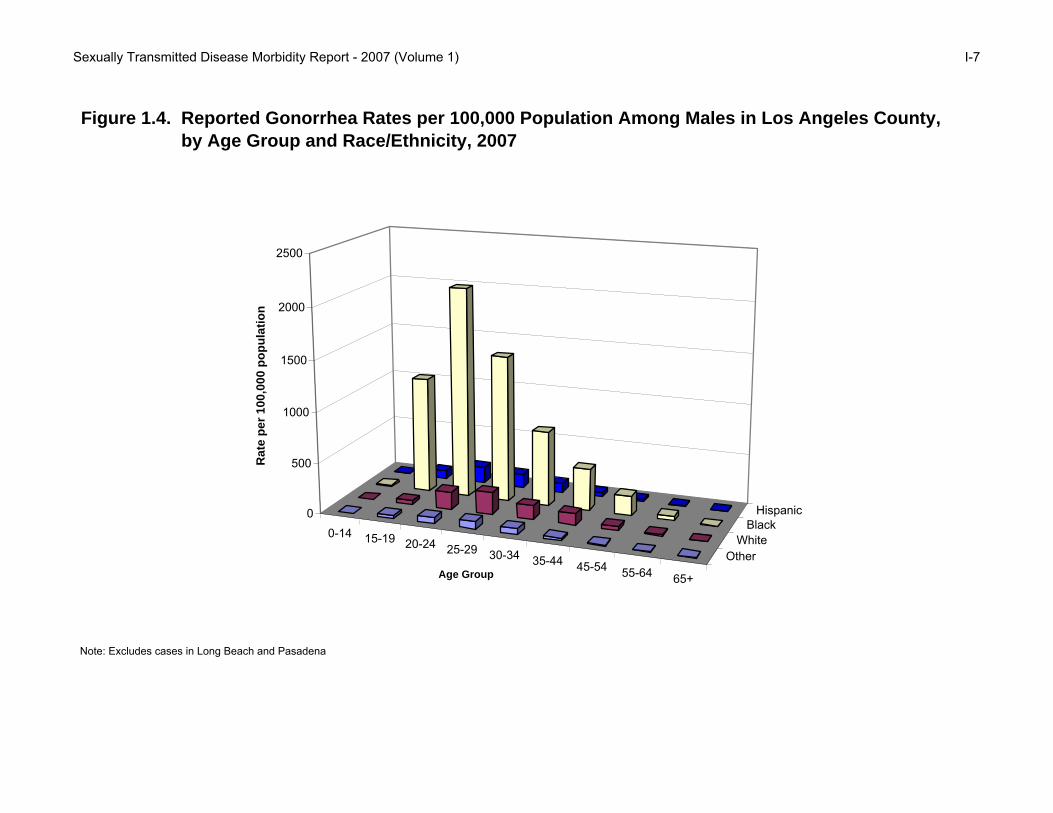
Figure 1.4. Reported Gonorrhea Rates per 100,000 Population Among Males in Los Angeles County, by Age Group and Race/Ethnicity, 2007
Note: Excludes cases in Long Beach and Pasadena
Sexually Transmitted Disease Morbidity Report - 2007 (Volume 1) I-8
0-14 15-19 20-24 25-29 30-34 35-44 45-54 55-64 65+
OtherWhite
BlackHispanic0
100
200
300
400
500
600
700N
umbe
r of C
ases
Age Group
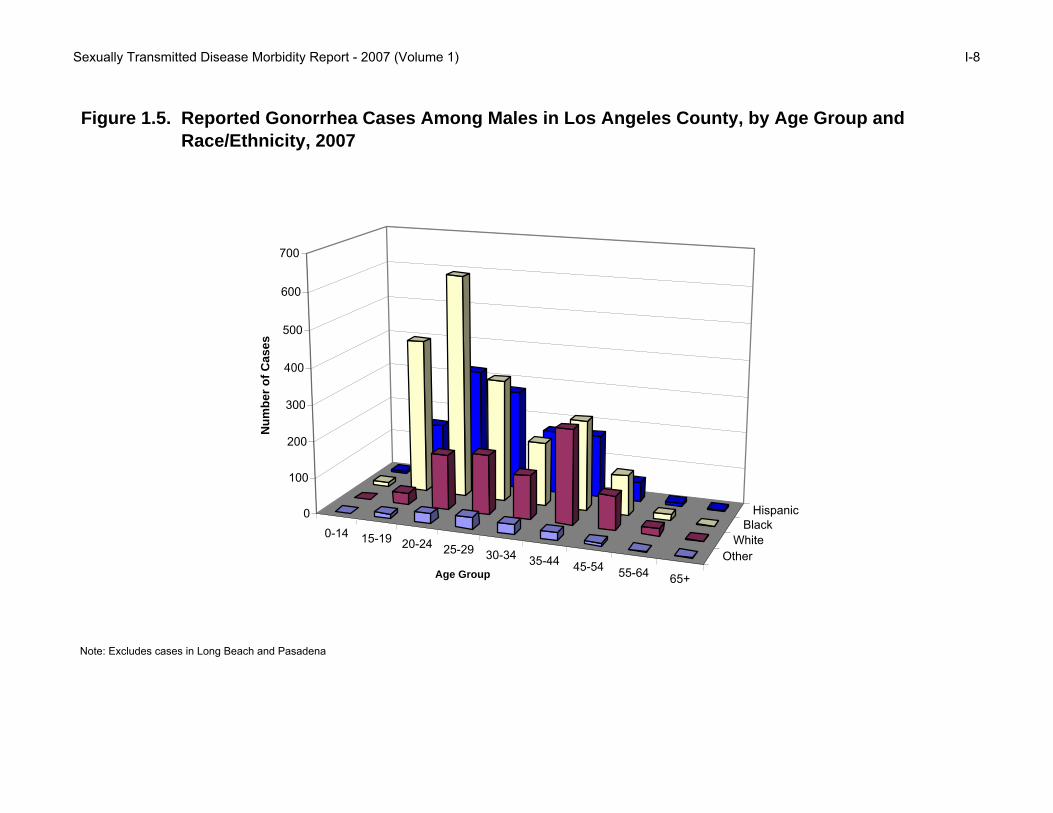
Figure 1.5. Reported Gonorrhea Cases Among Males in Los Angeles County, by Age Group and Race/Ethnicity, 2007
Note: Excludes cases in Long Beach and Pasadena
Sexually Transmitted Disease Morbidity Report - 2007 (Volume 1) I-9
0-14 15-19 20-24 25-29 30-34 35-44 45-54 55-64 65+
OtherWhite
BlackHispanic0
20
40
60
80
100
120
140
160
180R
ate
per 1
00,0
00 p
opul
atio
n
Age Group
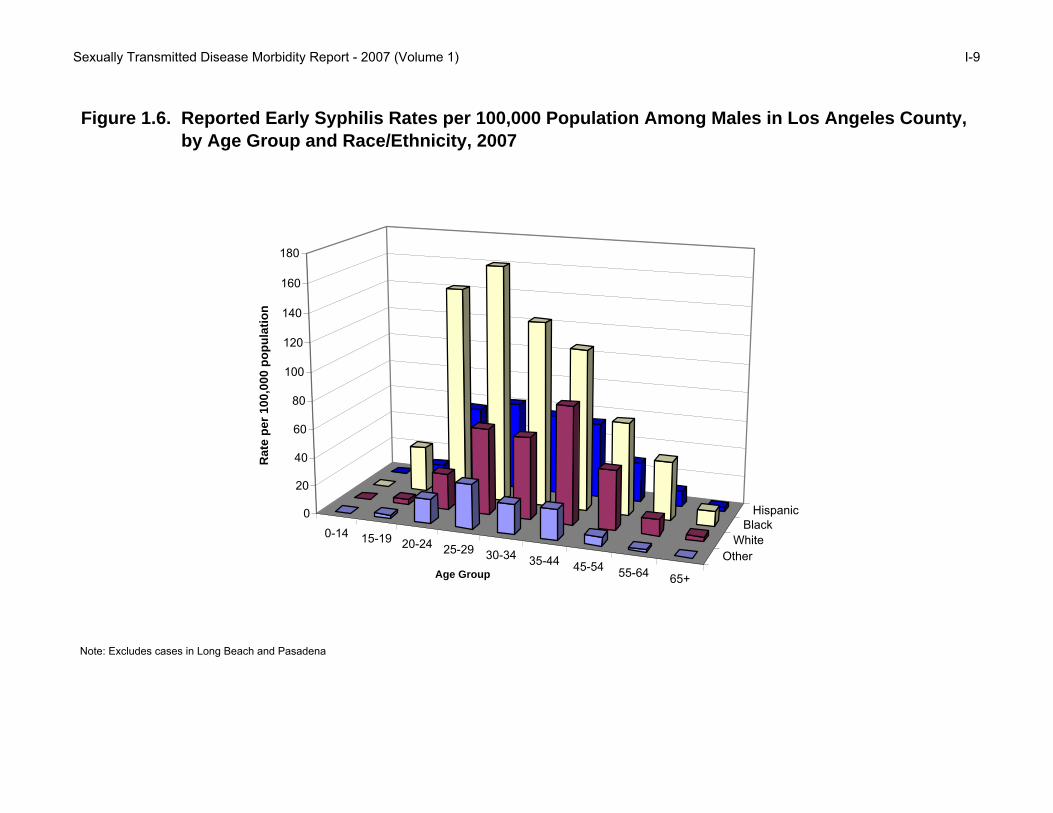
Figure 1.6. Reported Early Syphilis Rates per 100,000 Population Among Males in Los Angeles County, by Age Group and Race/Ethnicity, 2007
Note: Excludes cases in Long Beach and Pasadena

Sexually Transmitted Disease Morbidity Report - 2007 (Volume 1) I-10
0-14 15-19 20-24 25-29 30-34 35-44 45-54 55-64 65+
OtherWhite
BlackHispanic0
20
40
60
80
100
120
140
160
180
200N
umbe
r of C
ases
Age Group
Figure 1.7. Reported Early Syphilis Cases Among Males in Los Angeles County, by Age Group and Race/Ethnicity, 2007
Note: Excludes cases in Long Beach and Pasadena
Sexually Transmitted Disease Morbidity Report - 2007 (Volume 1) I-11
n % Rate1 n % Rate1 n % Rate1 n % Rate1 n % Rate1
Female Total2 28,164 100 576.0 4,255 100 87.0 53 100 1.1 124 100 2.5 177 100 3.6 White3
Total 2,381 100 196.0 440 100 34.8 7 100 0.5 13 100 0.9 20 100 1.5 Ages 0-14 16 1 7.9 1 0 0.5 0 0 0.0 0 0 0.0 0 0 0.0 15-19 654 27 778.2 91 21 108.3 0 0 0.0 0 0 0.0 0 0 0.0 20-24 923 39 1107.2 138 31 165.5 1 14 1.2 2 15 2.4 3 15 3.6 25-29 446 19 606.6 85 19 115.6 1 14 1.4 4 31 5.4 5 25 6.8 30-34 169 7 200.9 63 14 74.9 1 14 1.2 3 23 3.6 4 20 4.8 35-44 127 5 58.4 51 12 23.5 2 29 0.9 2 15 0.9 4 20 1.8 45-54 32 1 13.6 8 2 3.4 1 14 0.4 2 15 0.8 3 15 1.3 55-64 8 0 4.2 1 0 0.5 1 14 0.5 0 0 0.0 1 5 0.5 65+ 0 0 0.0 0 0 0.0 0 0 0.0 0 0 0.0 0 0 0.0 Unknown 6 0 . 2 0 . 0 0 . 0 0 . 0 0 . Black3
Total 6,608 100 1740.5 2,089 100 528.8 21 100 4.9 40 100 9.2 61 100 14.1 Ages 0-14 120 2 133.3 42 2 46.6 0 0 0.0 0 0 0.0 0 0 0.0 15-19 2,890 44 7874.2 917 44 2498.5 0 0 0.0 1 3 2.7 1 2 2.7 20-24 2,276 34 7112.5 686 33 2143.8 3 14 9.4 3 8 9.4 6 10 18.8 25-29 772 12 2875.3 253 12 942.3 0 0 0.0 10 25 37.2 10 16 37.2 30-34 274 4 967.8 99 5 349.7 4 19 14.1 6 15 21.2 10 16 35.3 35-44 184 3 261.1 68 3 96.5 3 14 4.3 10 25 14.2 13 21 18.4 45-54 57 1 86.0 21 1 31.7 9 43 13.6 7 18 10.6 16 26 24.1 55-64 15 0 31.9 2 0 4.2 2 10 4.2 3 8 6.4 5 8 10.6 65+ 0 0 0.0 0 0 0.0 0 0 0.0 0 0 0.0 0 0 0.0 Unknown 20 0 . 1 0 . 0 0 . 0 0 . 0 0 . Hispanic3
Total 12,456 100 651.0 972 100 48.8 22 100 1.0 63 100 2.9 85 100 3.9 Ages 0-14 105 1 15.9 20 2 3.0 0 0 0.0 0 0 0.0 0 0 0.0 15-19 3,763 30 1894.2 309 32 155.5 3 14 1.5 5 8 2.5 8 9 4.0 20-24 4,653 37 2577.0 308 32 170.6 2 9 1.1 17 27 9.4 19 22 10.5 25-29 2,181 18 1231.1 186 19 105.0 6 27 3.4 9 14 5.1 15 18 8.5 30-34 957 8 519.5 67 7 36.4 5 23 2.7 10 16 5.4 15 18 8.1 35-44 618 5 183.2 62 6 18.4 3 14 0.9 15 24 4.4 18 21 5.3 45-54 132 1 52.2 15 2 5.9 3 14 1.2 5 8 2.0 8 9 3.2 55-64 23 0 15.4 3 0 2.0 0 0 0.0 1 2 0.7 1 1 0.7 65+ 5 0 3.3 0 0 0.0 0 0 0.0 0 0 0.0 0 0 0.0 Unknown 19 0 . 2 0 . 0 0 . 1 2 . 1 1 .Other Total 1,147 100 166.9 111 100 16.2 0 100 0.0 2 100 0.3 2 100 0.3 Ages 0-14 6 1 5.9 1 1 1.0 0 0 0.0 0 0 0.0 0 0 0.0 15-19 214 19 532.9 30 27 74.7 0 0 0.0 0 0 0.0 0 0 0.0 20-24 412 36 913.0 34 31 75.3 0 0 0.0 0 0 0.0 0 0 0.0 25-29 216 19 479.3 17 15 37.7 0 0 0.0 1 50 2.2 1 50 2.2 30-34 118 10 225.8 20 18 38.3 0 0 0.0 1 50 1.9 1 50 1.9 35-44 136 12 119.9 3 3 2.6 0 0 0.0 0 0 0.0 0 0 0.0 45-54 31 3 26.9 4 4 3.5 0 0 0.0 0 0 0.0 0 0 0.0 55-64 7 1 8.7 2 2 2.5 0 0 0.0 0 0 0.0 0 0 0.0 65+ 2 0 2.1 0 0 0.0 0 0 0.0 0 0 0.0 0 0 0.0 Unknown 5 0 . 0 0 . 0 0 . 0 0 . 0 0 .
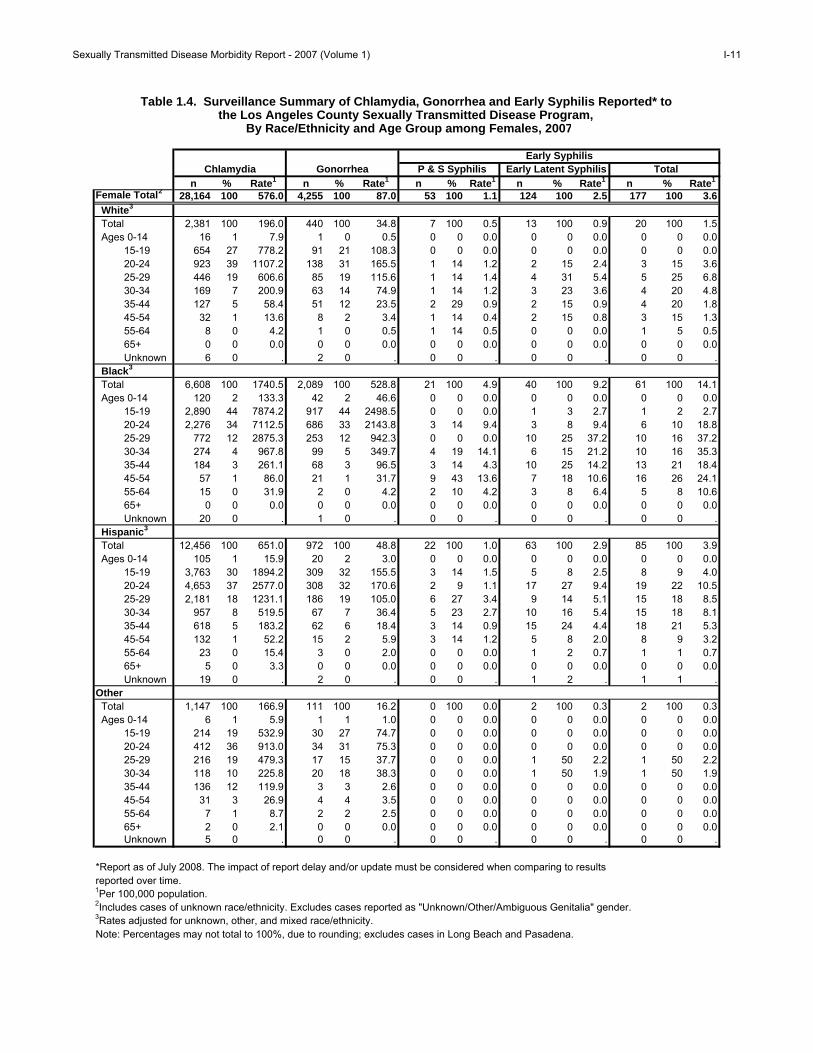
*Report as of July 2008. The impact of report delay and/or update must be considered when comparing to results reported over time.1Per 100,000 population. 2Includes cases of unknown race/ethnicity. Excludes cases reported as "Unknown/Other/Ambiguous Genitalia" gender.3Rates adjusted for unknown, other, and mixed race/ethnicity.Note: Percentages may not total to 100%, due to rounding; excludes cases in Long Beach and Pasadena.
Table 1.4. Surveillance Summary of Chlamydia, Gonorrhea and Early Syphilis Reported* to
By Race/Ethnicity and Age Group among Females, 2007
Chlamydia Gonorrhea P & S Syphilis Total Early Latent SyphilisEarly Syphilis
the Los Angeles County Sexually Transmitted Disease Program,
Sexually Transmitted Disease Morbidity Report - 2007 (Volume 1) I-12
0-14 15-19 20-24 25-29 30-34 35-44 45-54 55-64 65+
OtherWhite
BlackHispanic0
1000
2000
3000
4000
5000
6000
7000
8000R
ate
per 1
00,0
00 p
opul
atio
n
Age Group
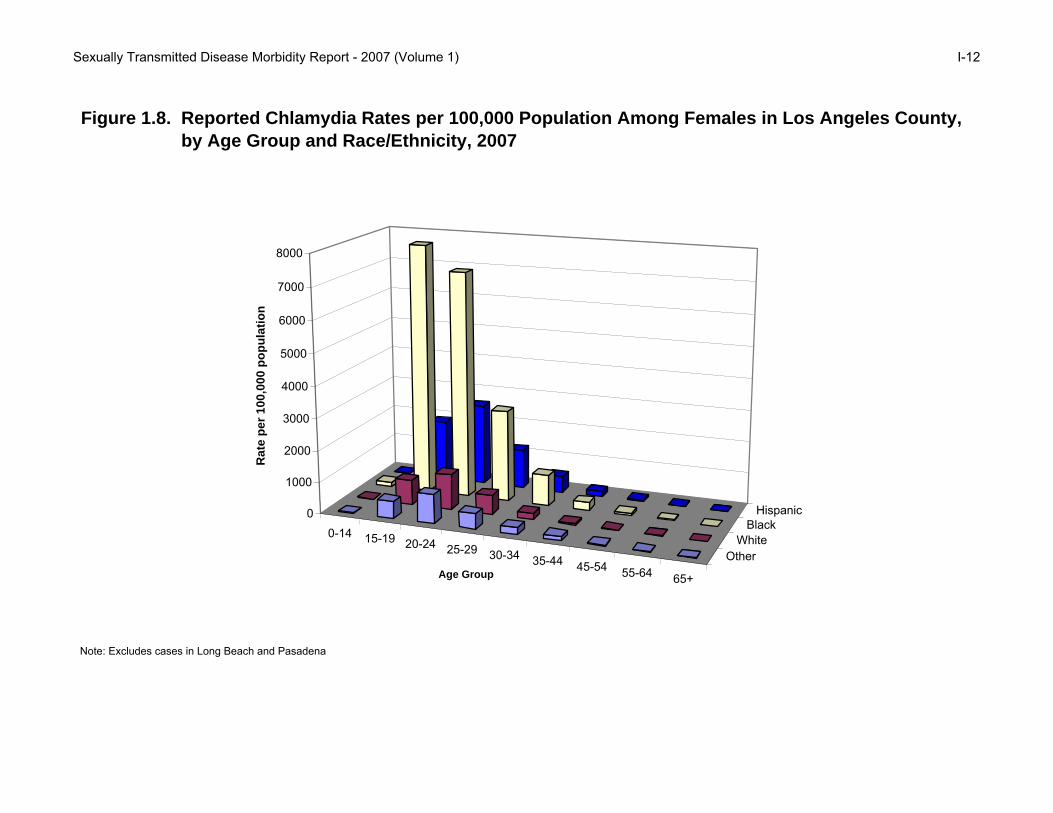
Figure 1.8. Reported Chlamydia Rates per 100,000 Population Among Females in Los Angeles County, by Age Group and Race/Ethnicity, 2007
Note: Excludes cases in Long Beach and Pasadena

Sexually Transmitted Disease Morbidity Report - 2007 (Volume 1) I-13
0-14 15-19 20-24 25-29 30-34 35-44 45-54 55-64 65+
OtherWhite
BlackHispanic0
500
1000
1500
2000
2500
3000
3500
4000
4500
5000N
umbe
r of C
ases
Age Group
Figure 1.9. Reported Chlamydia Cases Among Females in Los Angeles County, by Age Group and Race/Ethnicity, 2007
Note: Excludes cases in Long Beach and Pasadena

Sexually Transmitted Disease Morbidity Report - 2007 (Volume 1) I-14
0-14 15-19 20-24 25-29 30-34 35-44 45-54 55-64 65+
OtherWhite
BlackHispanic0
500
1000
1500
2000
2500R
ate
per 1
00,0
00 p
opul
atio
n
Age Group
Figure 1.10. Reported Gonorrhea Rates per 100,000 Population Among Females in Los Angeles County, by Age Group and Race/Ethnicity, 2007
Note: Excludes cases in Long Beach and Pasadena

Sexually Transmitted Disease Morbidity Report - 2007 (Volume 1) I-15
0-14 15-19 20-24 25-29 30-34 35-44 45-54 55-64 65+
OtherWhite
BlackHispanic0
100
200
300
400
500
600
700
800
900
1000N
umbe
r of C
ases
Age Group
Figure 1.11. Reported Gonorrhea Cases Among Females in Los Angeles County, by Age Group and Race/Ethnicity, 2007
Note: Excludes cases in Long Beach and Pasadena

Sexually Transmitted Disease Morbidity Report - 2007 (Volume 1) I-16
0-14 15-19 20-24 25-29 30-34 35-44 45-54 55-64 65+
OtherWhite
BlackHispanic0
5
10
15
20
25
30
35
40R
ate
per 1
00,0
00 p
opul
atio
n
Age Group
Figure 1.12. Reported Early Syphilis Rates per 100,000 Population Among Females in Los Angeles County, by Age Group and Race/Ethnicity, 2007
Note: Excludes cases in Long Beach and Pasadena

Sexually Transmitted Disease Morbidity Report - 2007 (Volume 1) I-17
0-14 15-19 20-24 25-29 30-34 35-44 45-54 55-64 65+
OtherWhite
BlackHispanic0
2
4
6
8
10
12
14
16
18
20N
umbe
r of C
ases
Age Group
Figure 1.13. Reported Early Syphilis Cases Among Females in Los Angeles County, by Age Group and Race/Ethnicity, 2007
Note: Excludes cases in Long Beach and Pasadena
Sexually Transmitted Disease Morbidity Report, 2007
Section II: Chlamydia
Sexually Transmitted Disease Morbidity Report - 2007 (Volume 1) II-1
Figure 2.1. Reported Chlamydia Rates per 100,000 Population by Year, United States, California, and Los Angeles County (LAC), 2003-2007
347.8
329.4316.5
301.7
323.8
338.7 350.0364.9
378.4
392.2402.4 405.4 413.3
421.6
150
200
250
300
350
400
450
2003 2004 2005 2006 2007
Year
Rat
es p
er 1
00,0
00 p
opul
atio
n
United States¹
California²
LA County³
1CDC. Sexually Transmitted Disease Surveillance, 2006 (2007 data was not available as of July 18, 2008).2California Department of Health Services, STD Control Branch, Chlamydia, Cases and Rates, California Counties & Selected City Health Jurisdictions, 2003-2007 Provisional Data. 3Los Angeles County Sexually Transmitted Disease Program, 2007. Excludes cases from Pasadena and Long Beach.

Sexually Transmitted Disease Morbidity Report - 2007 (Volume 1) II-2
No. (%) Rate No. (%) Rate No. (%) Rate No. (%) Rate No. (%) Rate
0-14 365 1.0 16.6 403 1.1 18.3 391 1.0 17.8 357 0.9 16.2 348 0.9 16.1
15-19 9,802 26.6 1,440.8 10,417 27.2 1,508.8 10,801 27.8 1,541.4 11,044 27.7 1,561.6 11,458 28.0 1,564.8
20-24 12,545 34.0 1,888.9 13,050 34.1 1,952.0 13,371 34.4 1,991.3 13,681 34.3 2,022.5 13,902 34.0 1,980.1
25-29 6,785 18.4 967.0 6,818 17.8 985.8 6,845 17.6 1,006.3 7,195 18.0 1,070.0 7,439 18.2 1,110.6
30-34 3,519 9.5 454.4 3,399 8.9 444.0 3,410 8.8 454.9 3,440 8.6 468.0 3,430 8.4 482.7
35-44 2,704 7.3 181.6 2,915 7.6 194.2 2,876 7.4 190.8 2,933 7.4 194.7 3,029 7.4 202.0
45-54 716 1.9 59.4 746 2.0 60.2 770 2.0 60.6 832 2.1 64.0 843 2.1 63.9
55-64 127 0.3 16.7 138 0.4 17.3 146 0.4 17.5 166 0.4 19.1 196 0.5 22.1
65+ 54 0.1 5.8 49 0.1 5.2 45 0.1 4.7 32 0.1 3.3 38 0.1 3.8
Unknown 256 0.7 . 321 0.8 . 183 0.5 . 182 0.5 . 168 0.4 .
Total 36,873 392.2 38,256 402.4 38,838 405.4 39,862 413.3 40,851 421.6
Note: Cumulative percentages may not equal 100% because of rounding. Excludes cases from Pasadena and Long Beach.
2006
Table 2.1. Reported Chlamydia Cases and Rates per 100,000 Population by Age Group, Los Angeles County, 2003-2007
200520042003 2007
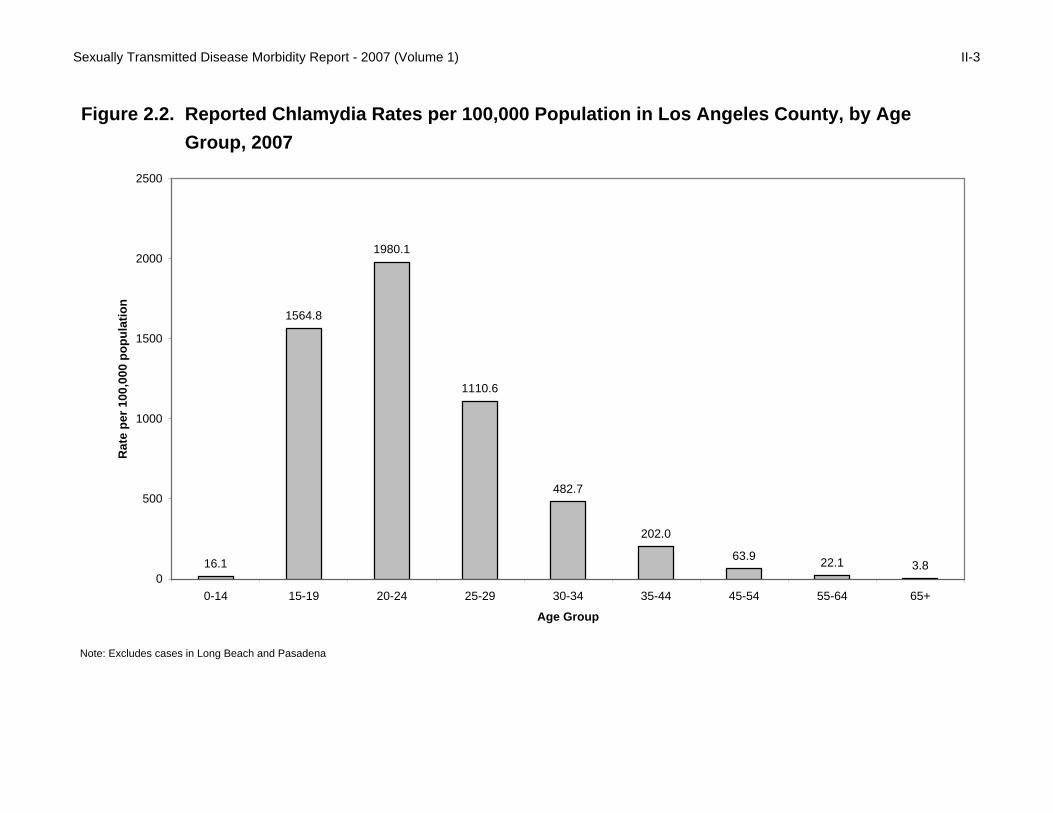
Sexually Transmitted Disease Morbidity Report - 2007 (Volume 1) II-3
16.1
1564.8
1980.1
1110.6
482.7
202.0
63.9 22.1 3.80
500
1000
1500
2000
2500
0-14 15-19 20-24 25-29 30-34 35-44 45-54 55-64 65+
Age Group
Rat
e pe
r 100
,000
pop
ulat
ion
Figure 2.2. Reported Chlamydia Rates per 100,000 Population in Los Angeles County, by Age Group, 2007
Note: Excludes cases in Long Beach and Pasadena
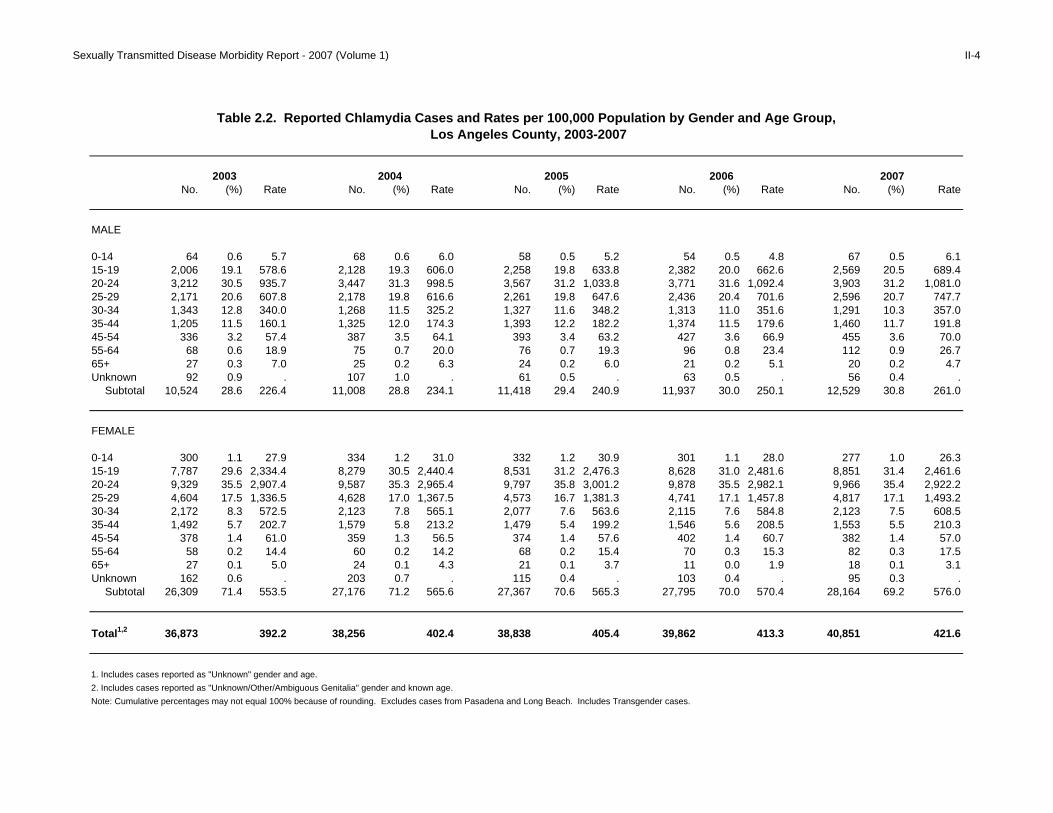
Sexually Transmitted Disease Morbidity Report - 2007 (Volume 1) II-4
No. (%) Rate No. (%) Rate No. (%) Rate No. (%) Rate No. (%) Rate
MALE
0-14 64 0.6 5.7 68 0.6 6.0 58 0.5 5.2 54 0.5 4.8 67 0.5 6.115-19 2,006 19.1 578.6 2,128 19.3 606.0 2,258 19.8 633.8 2,382 20.0 662.6 2,569 20.5 689.420-24 3,212 30.5 935.7 3,447 31.3 998.5 3,567 31.2 1,033.8 3,771 31.6 1,092.4 3,903 31.2 1,081.025-29 2,171 20.6 607.8 2,178 19.8 616.6 2,261 19.8 647.6 2,436 20.4 701.6 2,596 20.7 747.730-34 1,343 12.8 340.0 1,268 11.5 325.2 1,327 11.6 348.2 1,313 11.0 351.6 1,291 10.3 357.035-44 1,205 11.5 160.1 1,325 12.0 174.3 1,393 12.2 182.2 1,374 11.5 179.6 1,460 11.7 191.845-54 336 3.2 57.4 387 3.5 64.1 393 3.4 63.2 427 3.6 66.9 455 3.6 70.055-64 68 0.6 18.9 75 0.7 20.0 76 0.7 19.3 96 0.8 23.4 112 0.9 26.765+ 27 0.3 7.0 25 0.2 6.3 24 0.2 6.0 21 0.2 5.1 20 0.2 4.7Unknown 92 0.9 . 107 1.0 . 61 0.5 . 63 0.5 . 56 0.4 .
Subtotal 10,524 28.6 226.4 11,008 28.8 234.1 11,418 29.4 240.9 11,937 30.0 250.1 12,529 30.8 261.0
FEMALE
0-14 300 1.1 27.9 334 1.2 31.0 332 1.2 30.9 301 1.1 28.0 277 1.0 26.315-19 7,787 29.6 2,334.4 8,279 30.5 2,440.4 8,531 31.2 2,476.3 8,628 31.0 2,481.6 8,851 31.4 2,461.620-24 9,329 35.5 2,907.4 9,587 35.3 2,965.4 9,797 35.8 3,001.2 9,878 35.5 2,982.1 9,966 35.4 2,922.225-29 4,604 17.5 1,336.5 4,628 17.0 1,367.5 4,573 16.7 1,381.3 4,741 17.1 1,457.8 4,817 17.1 1,493.230-34 2,172 8.3 572.5 2,123 7.8 565.1 2,077 7.6 563.6 2,115 7.6 584.8 2,123 7.5 608.535-44 1,492 5.7 202.7 1,579 5.8 213.2 1,479 5.4 199.2 1,546 5.6 208.5 1,553 5.5 210.345-54 378 1.4 61.0 359 1.3 56.5 374 1.4 57.6 402 1.4 60.7 382 1.4 57.055-64 58 0.2 14.4 60 0.2 14.2 68 0.2 15.4 70 0.3 15.3 82 0.3 17.565+ 27 0.1 5.0 24 0.1 4.3 21 0.1 3.7 11 0.0 1.9 18 0.1 3.1Unknown 162 0.6 . 203 0.7 . 115 0.4 . 103 0.4 . 95 0.3 .
Subtotal 26,309 71.4 553.5 27,176 71.2 565.6 27,367 70.6 565.3 27,795 70.0 570.4 28,164 69.2 576.0
Total1,2 36,873 392.2 38,256 402.4 38,838 405.4 39,862 413.3 40,851 421.6
1. Includes cases reported as "Unknown" gender and age.2. Includes cases reported as "Unknown/Other/Ambiguous Genitalia" gender and known age.Note: Cumulative percentages may not equal 100% because of rounding. Excludes cases from Pasadena and Long Beach. Includes Transgender cases.
Table 2.2. Reported Chlamydia Cases and Rates per 100,000 Population by Gender and Age Group, Los Angeles County, 2003-2007
2003 2004 2005 2006 2007
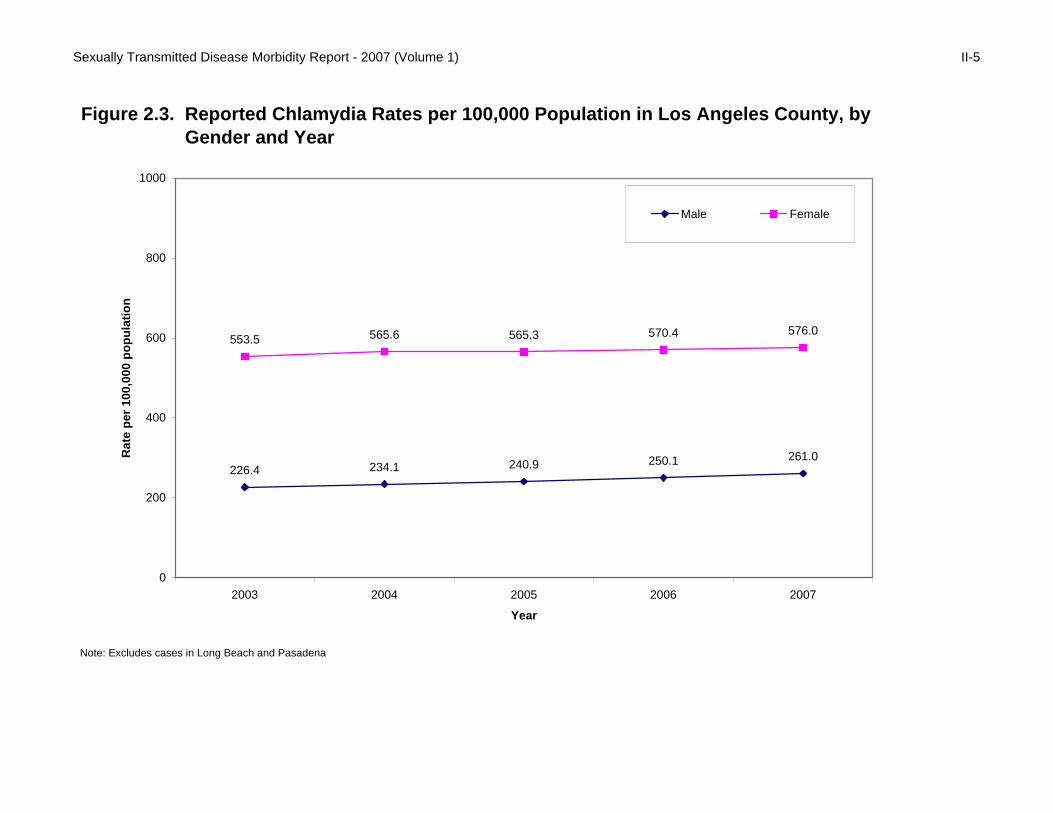
Sexually Transmitted Disease Morbidity Report - 2007 (Volume 1) II-5
226.4 234.1 240.9 250.1 261.0
553.5 565.6 565.3 570.4 576.0
0
200
400
600
800
1000
2003 2004 2005 2006 2007
Year
Rat
e pe
r 100
,000
pop
ulat
ion
Male Female
Figure 2.3. Reported Chlamydia Rates per 100,000 Population in Los Angeles County, by Gender and Year
Note: Excludes cases in Long Beach and Pasadena

Sexually Transmitted Disease Morbidity Report - 2007 (Volume 1) II-6
6.1
689.4
1081.0
747.7
357.0
191.8
70.0
26.7
4.7
0500100015002000250030003500
0-14
15-19
20-24
25-29
30-34
35-44
45-54
55-64
65+
26.3
2461.6
2922.2
1493.2
608.5
210.3
57.0
17.5
3.1
0 500 1000 1500 2000 2500 3000 3500
0-14
15-19
20-24
25-29
30-34
35-44
45-54
55-64
65+
Figure 2.4. Reported Chlamydia Rates per 100,000 Population in Los Angeles County, by Gender and Age Group, 2007
Note: Excludes cases in Long Beach and Pasadena
Male Rate per 100,000 population Female Age

Sexually Transmitted Disease Morbidity Report - 2007 (Volume 1) II-7
Adj. Adj. Adj. Adj. Adj. Adj.No. (%) Rate No. (%) Rate No. (%) Rate No. (%) Rate No. (%) Rate No. (%) Rate
MALE
2003 1,018 9.7 90.5 2,422 23.0 780.7 3,773 35.9 219.3 286 2.7 63.2 29 0.3 10,524 28.6 226.42004 1,021 9.3 90.7 2,792 25.4 901.3 3,705 33.7 210.8 322 2.9 69.8 55 0.5 11,008 28.8 234.12005 1,100 9.6 95.8 3,040 26.6 964.6 4,041 35.4 220.5 313 2.7 65.4 50 0.4 11,418 29.4 240.92006 1,144 9.6 99.8 3,215 26.9 1023.0 4,245 35.6 226.7 339 2.8 69.8 57 0.5 11,937 30.0 250.12007 1,289 10.3 111.2 3,327 26.6 1041.5 4,416 35.3 234.5 390 3.1 79.3 77 0.6 12,529 30.8 261.0
FEMALE
2003 1,879 7.1 159.9 5,335 20.3 1,453.9 11,466 43.6 659.9 992 3.8 194.4 50 0.2 26,309 71.4 553.52004 2,039 7.5 172.6 5,785 21.3 1,570.7 11,617 42.8 651.4 1,001 3.7 191.5 145 0.5 27,176 71.2 565.62005 2,216 8.1 182.8 6,134 22.4 1624.9 12,172 44.5 650.7 1,109 4.1 202.8 136 0.5 27,367 70.6 565.32006 2,222 8.0 183.0 6,499 23.4 1716.7 12,508 45.0 651.8 1,061 3.8 190.3 122 0.4 27,795 70.0 570.42007 2,381 8.5 196.0 6,608 23.5 1740.5 12,456 44.2 651.0 1,019 3.6 181.5 128 0.5 28,164 69.2 576.0
1. Includes data for ethnicity reported as "Other," "Native American," and "Mixed."
Note: If race/ethnicity was not specified, cases were prorated according to the distribution of cases for which race/ethnicity was specified. Rates were adjusted including the prorated cases. Therefore, these tables should be used only for race/ethnicity comparisons, not for overall totals or gender totals. Cumulative percentages may not equal 100% because of
2. Excludes cases reported with "Unknown/Other/Ambiguous Genitalia" gender. 3. Includes cases reported as "Unknown" race/ethnicity.
rounding. Cases from Pasadena and Long Beach were not included. Transgender cases were included.
Other1
Table 2.3. Reported Chlamydia Cases and Rates per 100,000 Population by Gender and Race/Ethnicity, Los Angeles County, 2003-2007
White Black Hispanic Asian-Pacific Total2,3

Sexually Transmitted Disease Morbidity Report - 2007 (Volume 1) II-8
111.2
1041.5
234.5
79.3
196.0
1740.5
651.0
181.5
0
200
400
600
800
1000
1200
1400
1600
1800
2000
White Black Hispanic Asian-Pacific
Rat
e pe
r 100
,000
pop
ulat
ion
Male Female
Figure 2.5. Reported Chlamydia Rates per 100,000 Population in Los Angeles County, by Gender and Race/Ethnicity, 2007
Note: Adjusted for unknown race. Excludes cases in Long Beach and Pasadena

Sexually Transmitted Disease Morbidity Report - 2007 (Volume 1) II-9
1Table 2.4. Reported Chlamydia Cases and Rates per 100,000 Population by Service Planning Area (SPA)and Health District (HD), Los Angeles County, 2003-2007
2003 2004 2005 2006 2007No. (%) Rate No. (%) Rate No. (%) Rate No. (%) Rate No. (%) Rate
SPA2/HD3
Antelope Valley (1) 1,172 3.2 361.6 1,302 3.4 392.4 1,354 3.5 397.4 1,453 3.6 417.7 1,720 4.2 480.0 Antelope Valley 1,172 3.2 361.6 1,302 3.4 392.4 1,354 3.5 397.4 1,453 3.6 417.7 1,720 4.2 480.0
East (7) 4,634 12.6 342.5 4,608 12.0 337.3 4,729 12.2 344.6 5,016 12.6 363.6 5,155 12.6 373.6 Bellflower 1,096 3.0 299.8 1,025 2.7 278.8 1,246 3.2 338.0 1,284 3.2 347.5 1,384 3.4 374.0 East Los Angeles 929 2.5 431.7 882 2.3 401.8 815 2.1 367.6 874 2.2 388.3 791 1.9 355.5 San Antonio 1,771 4.8 398.8 1,844 4.8 411.9 1,776 4.6 395.4 1,883 4.7 418.0 1,955 4.8 433.1 Whittier 838 2.3 255.4 857 2.2 258.6 892 2.3 267.9 975 2.4 291.5 1,025 2.5 305.3
Metro (4) 5,353 14.5 440.1 5,216 13.6 422.4 4,912 12.6 393.5 4,941 12.4 392.1 5,036 12.3 399.0 Central 1,765 4.8 497.3 1,734 4.5 479.9 1,557 4.0 425.5 1,611 4.0 435.4 1,679 4.1 454.6 Hollywood-Wilshire 2,183 5.9 413.2 2,069 5.4 387.5 2,097 5.4 389.8 2,138 5.4 395.4 2,252 5.5 416.2 Northeast 1,405 3.8 421.8 1,413 3.7 416.1 1,258 3.2 365.2 1,192 3.0 341.1 1,105 2.7 314.3
San Fernando (2) 5,425 14.7 259.6 5,459 14.3 258.3 5,502 14.2 258.0 5,482 13.8 255.4 5,797 14.2 268.5 East Valley 991 2.7 223.3 1,438 3.8 320.1 1,496 3.9 330.1 1,500 3.8 328.0 1,477 3.6 323.0 Glendale 491 1.3 141.3 474 1.2 134.9 482 1.2 136.6 533 1.3 150.8 555 1.4 156.6 San Fernando 1,482 4.0 336.1 1,107 2.9 246.9 1,124 2.9 246.6 1,092 2.7 237.2 1,167 2.9 250.8 West Valley 2,461 6.7 286.9 2,440 6.4 282.2 2,400 6.2 275.6 2,357 5.9 269.3 2,598 6.4 294.6
San Gabriel (3) 4,651 12.6 275.7 4,525 11.8 266.1 4,638 11.9 271.0 4,860 12.2 282.5 4,732 11.6 274.0 Alhambra 708 1.9 199.9 643 1.7 180.2 695 1.8 194.0 648 1.6 180.9 587 1.4 163.2 El Monte 1,668 4.5 359.1 1,639 4.3 348.8 1,635 4.2 345.1 1,663 4.2 348.1 1,430 3.5 297.4 Foothill 682 1.8 220.4 681 1.8 218.5 763 2.0 243.7 705 1.8 224.3 778 1.9 247.1 Pomona 1,593 4.3 285.2 1,562 4.1 278.0 1,545 4.0 272.9 1,844 4.6 323.5 1,937 4.7 339.0
South (6) 8,933 24.2 886.7 9,038 23.6 884.2 8,922 23.0 864.6 9,676 24.3 928.9 9,636 23.6 922.2 Compton 2,103 5.7 734.6 2,168 5.7 750.3 2,281 5.9 784.6 2,453 6.2 837.8 2,429 5.9 828.9 South 2,041 5.5 1148.6 2,083 5.4 1148.4 2,127 5.5 1153.6 2,263 5.7 1205.6 2,261 5.5 1211.0 Southeast 1,347 3.7 795.4 1,342 3.5 775.3 1,249 3.2 709.5 1,362 3.4 760.0 1,343 3.3 751.4 Southwest 3,442 9.3 920.0 3,445 9.0 909.7 3,265 8.4 857.5 3,598 9.0 941.9 3,603 8.8 932.4
South Bay (8) 3,939 10.7 360.6 3,980 10.4 361.2 4,310 11.1 389.3 4,329 10.9 389.2 4,610 11.3 412.4 Harbor 545 1.5 265.0 476 1.2 229.2 486 1.3 232.8 486 1.2 231.9 517 1.3 243.9 Inglewood 2,407 6.5 564.4 2,459 6.4 572.2 2,709 7.0 626.6 2,754 6.9 632.2 2,976 7.3 681.2 Torrance 987 2.7 214.5 1,045 2.7 224.9 1,115 2.9 239.2 1,089 2.7 233.1 1,117 2.7 238.1 West (5) 1,297 3.5 205.1 1,291 3.4 203.2 1,348 3.5 211.9 1,264 3.2 198.6 1,337 3.3 208.7 West 1,297 3.5 205.1 1,291 3.4 203.2 1,348 3.5 211.9 1,264 3.2 198.6 1,337 3.3 208.7
Unknown 1,469 4.0 . 2,837 7.4 . 3,123 8.0 . 2,841 7.1 . 2,828 6.9 .
Total 36,873 392.2 38,256 402.4 38,838 405.4 39,862 413.3 40,851 421.6
1. Excludes cases from Pasadena (SPA 3) and Long Beach (SPA 8).2. Main categories.3. Subcategories.Note: Cumulative percentages may not equal 100% because of rounding.

Sexually Transmitted Disease Morbidity Report - 2007 (Volume I) II - 10
0 8 164 Miles
Figure 2.6. Reported Chlamydia Rates per 100,000 Population by Service Planning Area (SPA), Los Angeles County, 2007.
Excludes cases from Pasadena (SPA 3) and Long Beach (SPA 8).
Antelope Valley (SPA 1)480.0
East (SPA 7)373.6
Metro (SPA 4)399.0
San Fernando (SPA 2)268.5
San Gabriel (SPA 3)274.0
South (SPA 6)922.2
South Bay (SPA 8)412.4
West (SPA 5)208.7
Sexually Transmitted Disease Morbidity Report, 2007
Section III: Gonorrhea

Sexually Transmitted Disease Morbidity Report - 2007 (Volume 1) III-1
Figure 3.1. Reported Gonorrhea Rates per 100,000 Population by Year, United States, California, and Los Angeles County (LAC), 2003-2007
115.2 112.4 114.6120.9
82.6
90.592.4
83.6
71.5
96.1
108.0109.5
101.0
85.9
0
20
40
60
80
100
120
140
2003 2004 2005 2006 2007
Year
Rat
es p
er 1
00,0
00 p
opul
atio
n
United States¹
California²
LA County³
1CDC. Sexually Transmitted Disease Surveillanc, 2006 (2007 data not available as of July, 18, 2008).2California Department of Health Services, STD Control Branch, Gonorrhea, Cases and Rates, California Counties & Selected City Health Jurisdictions, 2003-2007 Provisional Data. 3Los Angeles County Sexually Transmitted Disease Program, 2007. Excludes cases from Pasadena and Long Beach.

Sexually Transmitted Disease Morbidity Report - 2007 (Volume 1) III-2
No. (%) Rate No. (%) Rate No. (%) Rate No. (%) Rate No. (%) Rate
0-14 89 1.1 4.0 115 1.2 5.2 112 1.1 5.1 108 1.0 4.9 89 1.0 4.1
15-19 1,722 21.3 253.1 1,994 20.8 288.8 2,348 22.4 335.1 2,325 22.3 328.8 2,258 24.3 308.4
20-24 2,082 25.8 313.5 2,580 26.9 385.9 2,865 27.3 426.7 2,858 27.4 422.5 2,656 28.5 378.3
25-29 1,432 17.7 204.1 1,671 17.4 241.6 1,808 17.2 265.8 1,840 17.7 273.6 1,669 17.9 249.2
30-34 940 11.6 121.4 1,089 11.3 142.2 1,119 10.7 149.3 1,089 10.5 148.2 942 10.1 132.6
35-44 1,263 15.6 84.8 1,471 15.3 98.0 1,551 14.8 102.9 1,479 14.2 98.2 1,134 12.2 75.6
45-54 386 4.8 32.0 478 5.0 38.6 528 5.0 41.5 547 5.3 42.1 426 4.6 32.3
55-64 72 0.9 9.5 90 0.9 11.3 86 0.8 10.3 83 0.8 9.6 89 1.0 10.0
65+ 17 0.2 1.8 28 0.3 3.0 23 0.2 2.4 30 0.3 3.1 18 0.2 1.8
Unknown 75 0.9 . 88 0.9 . 52 0.5 . 57 0.5 . 27 0.3 .
Total 8,078 85.9 9,604 101.0 10,492 109.5 10,416 108.0 9,308 96.1
Note: Cumulative percentages may not equal 100% because of rounding. Excludes cases from Pasadena and Long Beach.
2006
Table 3.1. Reported Gonorrhea Cases and Rates per 100,000 Population by Age Group, Los Angeles County, 2003-2007
200520042003 2007

Sexually Transmitted Disease Morbidity Report - 2007 (Volume 1) III-3
4.1
308.4
378.3
249.2
132.6
75.6
32.3
10.01.8
0
50
100
150
200
250
300
350
400
0-14 15-19 20-24 25-29 30-34 35-44 45-54 55-64 65+
Age Group
Rat
e pe
r 100
,000
pop
ulat
ion
Figure 3.2. Reported Gonorrhea Rates per 100,000 Population in Los Angeles County, by Age Group, 2007
Note: Excludes cases in Long Beach and Pasadena

Sexually Transmitted Disease Morbidity Report - 2007 (Volume 1) III-4
No. (%) Rate No. (%) Rate No. (%) Rate No. (%) Rate No. (%) Rate
MALE
0-14 19 0.4 1.7 19 0.4 1.7 25 0.4 2.2 29 0.5 2.6 22 0.4 2.015-19 538 12.4 155.2 649 12.5 184.8 771 13.4 216.4 725 13.1 201.7 742 14.7 199.120-24 963 22.2 280.5 1,229 23.6 356.0 1,326 23.1 384.3 1,309 23.7 379.2 1,320 26.2 365.625-29 797 18.4 223.1 947 18.2 268.1 1,070 18.7 306.5 1,070 19.4 308.2 1,003 19.9 288.930-34 639 14.7 161.8 729 14.0 187.0 793 13.8 208.1 713 12.9 190.9 630 12.5 174.235-44 962 22.2 127.8 1,107 21.3 145.6 1,195 20.8 156.3 1,114 20.2 145.6 862 17.1 113.345-54 301 6.9 51.4 377 7.2 62.4 429 7.5 69.0 438 7.9 68.7 351 7.0 54.055-64 60 1.4 16.7 66 1.3 17.6 72 1.3 18.3 64 1.2 15.6 73 1.5 17.465+ 13 0.3 3.4 24 0.5 6.1 21 0.4 5.2 24 0.4 5.9 18 0.4 4.2Unknown 45 1.0 . 58 1.1 . 33 0.6 . 32 0.6 . 12 0.2 .
Subtotal 4,337 53.8 93.3 5,205 54.3 110.7 5,735 54.8 121.0 5,518 53.2 115.6 5,033 54.2 104.8
FEMALE
0-14 70 1.9 6.5 96 2.2 8.9 87 1.8 8.1 79 1.6 7.4 66 1.6 6.315-19 1,183 31.7 354.6 1,344 30.7 396.2 1,575 33.3 457.2 1,594 32.8 458.5 1,513 35.6 420.820-24 1,119 30.0 348.7 1,349 30.8 417.3 1,534 32.4 469.9 1,543 31.8 465.8 1,332 31.3 390.625-29 633 17.0 183.8 723 16.5 213.6 736 15.5 222.3 763 15.7 234.6 664 15.6 205.830-34 297 8.0 78.3 358 8.2 95.3 323 6.8 87.6 373 7.7 103.1 307 7.2 88.035-44 298 8.0 40.5 359 8.2 48.5 352 7.4 47.4 360 7.4 48.6 269 6.3 36.445-54 85 2.3 13.7 100 2.3 15.8 98 2.1 15.1 105 2.2 15.9 75 1.8 11.255-64 12 0.3 3.0 22 0.5 5.2 14 0.3 3.2 18 0.4 3.9 15 0.4 3.265+ 4 0.1 0.7 4 0.1 0.7 2 0.0 0.4 5 0.1 0.9 0 0.0 0.0Unknown 27 0.7 . 28 0.6 . 14 0.3 . 18 0.4 . 14 0.3 .
Subtotal 3,728 46.2 78.4 4,383 45.7 91.2 4,735 45.2 97.8 4,858 46.8 99.7 4,255 45.8 87.0
Total1,2 8,078 85.9 9,604 101.0 10,492 109.5 10,416 108.0 9,308 96.1
1. Includes cases reported as "Unknown" gender and age.2. Includes cases reported as "Unknown/Other/Ambiguous Genitalia" gender and known age.Note: Cumulative percentages may not equal 100% because of rounding. Excludes cases from Pasadena and Long Beach. Includes Transgender cases.
Table 3.2. Reported Gonorrhea Cases and Rates per 100,000 Population by Gender and Age Group, Los Angeles County, 2003-2007
2003 2004 2005 2006 2007
Sexually Transmitted Disease Morbidity Report - 2007 (Volume 1) III-5
93.3
110.7
121.0115.6
104.8
78.4
91.297.8 99.7
87.0
0
50
100
150
200
2003 2004 2005 2006 2007
Year
Rat
e pe
r 100
,000
pop
ulat
ion
Male Female
Figure 3.3. Reported Gonorrhea Rates per 100,000 Population in Los Angeles County, by Gender and Year
Note: Excludes cases in Long Beach and Pasadena

Sexually Transmitted Disease Morbidity Report - 2007 (Volume 1) III-6
2.0
199.1
365.6
288.9
174.2
113.3
54.0
17.4
4.2
0100200300400500
0-14
15-19
20-24
25-29
30-34
35-44
45-54
55-64
65+
6.3
420.8
390.6
205.8
88.0
36.4
11.2
3.2
0.0
0 100 200 300 400 500
0-14
15-19
20-24
25-29
30-34
35-44
45-54
55-64
65+
Figure 3.4. Reported Gonorrhea Rates per 100,000 Population in Los Angeles County, by Gender and Age Group, 2007
Note: Excludes cases in Long Beach and Pasadena
Male Rate per 100,000 population Female Age
Sexually Transmitted Disease Morbidity Report - 2007 (Volume 1) III-7
Adj. Adj. Adj. Adj. Adj. Adj.No. (%) Rate No. (%) Rate No. (%) Rate No. (%) Rate No. (%) Rate No. (%) Rate
MALE
2003 750 17.3 65.0 1,533 35.4 482.2 853 19.7 48.4 87 2.0 18.7 14 0.3 4,337 53.8 93.32004 757 14.5 64.7 2,111 40.6 655.9 1,005 19.3 55.0 85 1.6 17.7 26 0.5 5,205 54.3 110.72005 918 16.0 77.8 2,201 38.4 679.4 1,253 21.9 66.5 85 1.5 17.3 29 0.5 5,735 54.8 121.02006 827 15.0 70.5 2,242 40.6 697.1 1,137 20.6 59.3 87 1.6 17.5 25 0.5 5,518 53.2 115.62007 846 16.8 69.7 1,944 38.6 581.3 1,178 23.4 59.7 93 1.9 18.1 35 0.7 5,033 54.2 104.8
FEMALE
2003 352 9.4 29.4 1,623 43.5 434.7 805 21.6 45.5 88 2.4 17.0 7 0.2 3,728 46.2 78.42004 376 8.6 31.3 1,946 44.4 519.2 986 22.5 54.3 92 2.1 17.3 15 0.3 4,383 45.7 91.22005 513 10.8 41.3 2,117 44.7 546.7 1,132 23.9 59.0 119 2.5 21.2 28 0.6 4,735 45.2 97.82006 499 10.3 39.9 2,192 45.1 562.9 1,224 25.2 62.0 135 2.8 23.5 29 0.6 4,858 46.8 99.72007 440 10.3 34.8 2,089 49.1 528.8 972 22.8 48.8 90 2.1 15.4 21 0.5 4,255 45.8 87.0
1. Includes data for ethnicity reported as "Other," "Native American," and "Mixed."
Note: If race/ethnicity was not specified, cases were prorated according to the distribution of cases for which race/ethnicity was specified. Rates were adjusted including the prorated cases. Therefore, these tables should be used only for race/ethnicity comparisons, not for overall totals or gender totals. Cumulative percentages may not equal 100% because of
2. Excludes cases reported with "Unknown/Other/Ambiguous Genitalia" gender. 3. Includes cases reported as "Unknown" race/ethnicity.
rounding. Cases from Pasadena and Long Beach were not included. Transgender cases were included.
Table 3.3. Reported Gonorrhea Cases and Rates per 100,000 Population by Gender and Race/Ethnicity, Los Angeles County, 2002-2006
White Black Hispanic Asian-Pacific Other1 Total2,3

Sexually Transmitted Disease Morbidity Report - 2007 (Volume 1) III-8
69.7
581.3
59.7
18.134.8
528.8
48.815.4
0
100
200
300
400
500
600
700
White Black Hispanic Asian-Pacific
Rat
e pe
r 100
,000
pop
ulat
ion
Male Female
Figure 3.5. Reported Gonnorhea Rates per 100,000 Population in Los Angeles County, by Gender and Race/Ethnicity, 2007
Note: Adjusted for unknown race. Excludes cases in Long Beach and Pasadena

Sexually Transmitted Disease Morbidity Report - 2007 (Volume 1) III-9
Table 3.4. Reported Gonorrhea Cases and Rates per 100,000 Population by Service Planning Area (SPA)1
and Health District (HD), Los Angeles County, 2003-2007
2003 2004 2005 2006 2007No. (%) Rate No. (%) Rate No. (%) Rate No. (%) Rate No. (%) Rate
SPA2/HD3
Antelope Valley (1) 289 3.6 89.2 428 4.5 129.0 409 3.9 120.0 330 3.2 94.9 375 4.0 104.7 Antelope Valley 289 3.6 89.2 428 4.5 129.0 409 3.9 120.0 330 3.2 94.9 375 4.0 104.7
East (7) 559 6.9 41.3 616 6.4 45.1 723 6.9 52.7 746 7.2 54.1 714 7.7 51.7 Bellflower 180 2.2 49.2 172 1.8 46.8 246 2.3 66.7 207 2.0 56.0 248 2.7 67.0 East Los Angeles 78 1.0 36.2 96 1.0 43.7 95 0.9 42.8 95 0.9 42.2 85 0.9 38.2 San Antonio 174 2.2 39.2 216 2.2 48.2 242 2.3 53.9 246 2.4 54.6 241 2.6 53.4 Whittier 127 1.6 38.7 132 1.4 39.8 140 1.3 42.0 198 1.9 59.2 140 1.5 41.7
Metro (4) 1,466 18.1 120.5 1,597 16.6 129.3 1,736 16.5 139.1 1,675 16.1 132.9 1,633 17.5 129.4 Central 425 5.3 119.8 459 4.8 127.0 458 4.4 125.2 480 4.6 129.7 410 4.4 111.0 Hollywood-Wilshire 843 10.4 159.6 927 9.7 173.6 1,106 10.5 205.6 1,007 9.7 186.2 1,012 10.9 187.0 Northeast 198 2.5 59.4 211 2.2 62.1 172 1.6 49.9 188 1.8 53.8 211 2.3 60.0
San Fernando (2) 792 9.8 37.9 918 9.6 43.4 1,124 10.7 52.7 986 9.5 45.9 986 10.6 45.7 East Valley 177 2.2 39.9 286 3.0 63.7 318 3.0 70.2 277 2.7 60.6 286 3.1 62.5 Glendale 84 1.0 24.2 89 0.9 25.3 118 1.1 33.5 121 1.2 34.2 135 1.5 38.1 San Fernando 168 2.1 38.1 143 1.5 31.9 198 1.9 43.4 144 1.4 31.3 152 1.6 32.7 West Valley 363 4.5 42.3 400 4.2 46.3 490 4.7 56.3 444 4.3 50.7 413 4.4 46.8
San Gabriel (3) 624 7.7 37.0 663 6.9 39.0 791 7.5 46.2 781 7.5 45.4 679 7.3 39.3 Alhambra 97 1.2 27.4 97 1.0 27.2 114 1.1 31.8 86 0.8 24.0 103 1.1 28.6 El Monte 164 2.0 35.3 180 1.9 38.3 213 2.0 45.0 201 1.9 42.1 166 1.8 34.5 Foothill 109 1.3 35.2 113 1.2 36.3 165 1.6 52.7 139 1.3 44.2 138 1.5 43.8 Pomona 254 3.1 45.5 273 2.8 48.6 299 2.8 52.8 355 3.4 62.3 272 2.9 47.6
South (6) 2,507 31.0 248.8 2,935 30.6 287.1 3,021 28.8 292.8 3,210 30.8 308.2 2,823 30.3 270.2 Compton 461 5.7 161.0 567 5.9 196.2 695 6.6 239.1 714 6.9 243.9 678 7.3 231.4 South 670 8.3 377.0 796 8.3 438.9 761 7.3 412.7 831 8.0 442.7 729 7.8 390.4 Southeast 274 3.4 161.8 354 3.7 204.5 290 2.8 164.7 328 3.1 183.0 276 3.0 154.4 Southwest 1,102 13.6 294.5 1,218 12.7 321.6 1,275 12.2 334.8 1,337 12.8 350.0 1,140 12.2 295.0
South Bay (8) 914 11.3 83.7 1,262 13.1 114.5 1,280 12.2 115.6 1,351 13.0 121.5 1,163 12.5 104.0 Harbor 77 1.0 37.4 98 1.0 47.2 92 0.9 44.1 115 1.1 54.9 74 0.8 34.9 Inglewood 648 8.0 151.9 881 9.2 205.0 929 8.9 214.9 956 9.2 219.5 866 9.3 198.2 Torrance 189 2.3 41.1 283 2.9 60.9 259 2.5 55.6 280 2.7 59.9 223 2.4 47.5 West (5) 471 5.8 74.5 425 4.4 66.9 409 3.9 64.3 444 4.3 69.8 406 4.4 63.4 West 471 5.8 74.5 425 4.4 66.9 409 3.9 64.3 444 4.3 69.8 406 4.4 63.4
Unknown 456 5.6 . 760 7.9 . 999 9.5 . 893 8.6 . 529 5.7 .
Total 8,078 85.9 9,604 101.0 10,492 109.5 10,416 108.0 9,308 96.1
1. Excludes cases from Pasadena (SPA 3) and Long Beach (SPA 8).2. Main categories.3. Subcategories.Note: Cumulative percentages may not equal 100% because of rounding.

Sexually Transmitted Disease Morbidity Report - 2007 (Volume I) III - 10
0 8 164 Miles
Figure 3.6. Reported Gonorrhea Rates per 100,000 Population by Service Planning Area (SPA), Los Angeles County, 2007.
Excludes cases from Pasadena (SPA 3) and Long Beach (SPA 8).
Antelope Valley (SPA 1)104.7
East (SPA 7)51.7
Metro (SPA 4)129.4
San Fernando (SPA 2)45.7
San Gabriel (SPA 3)39.3
South (SPA 6)270.2
South Bay (SPA 8)104.0
West (SPA 5)63.4

Sexually Transmitted Disease Morbidity Report, 2007
Section IV: Primary and Secondary Syphilis

Sexually Transmitted Disease Morbidity Report - 2007 (Volume 1) IV-1
Figure 4.1. Reported Primary and Secondary Syphilis Rates per 100,000 Population by Year, United States, California, and Los Angeles County (LAC),
2003-2007
2.5
2.7 2.9
3.3
5.4
5.04.4
3.83.6
8.78.2
6.9
4.95.1
0
1
2
3
4
5
6
7
8
9
10
2003 2004 2005 2006 2007Year
Rat
es p
er 1
00,0
00 p
opul
atio
n
United States¹
California²
LA County³
1CDC. Sexually Transmitted Disease Surveillance, 2006 (2007 data not available as of July 18, 2008).2California Department of Health Services, STD Control Branch, Primary and Secondary Syphilis, Cases and Rates, California Counties & Selected City Health Jurisdictions, 2003-2007 Provisional Data. 3Los Angeles County Sexually Transmitted Disease Program, 2007. Excludes cases from Pasadena and Long Beach.
Sexually Transmitted Disease Morbidity Report - 2007 (Volume 1) IV-2
No. (%) Rate No. (%) Rate No. (%) Rate No. (%) Rate No. (%) Rate
0-14 0 0.0 0.0 1 0.2 0.0 0 0.0 0.0 0 0.0 0.0 0 0.0 0.0
15-19 6 1.3 0.9 11 2.3 1.6 11 1.7 1.6 21 2.7 3.0 21 2.5 2.9
20-24 38 8.0 5.7 49 10.4 7.3 65 9.8 9.7 68 8.6 10.1 113 13.4 16.1
25-29 49 10.3 7.0 64 13.6 9.3 85 12.9 12.5 114 14.5 17.0 138 16.4 20.6
30-34 79 16.6 10.2 71 15.1 9.3 114 17.3 15.2 94 11.9 12.8 121 14.3 17.0
35-44 216 45.5 14.5 195 41.5 13.0 249 37.7 16.5 325 41.2 21.6 273 32.3 18.2
45-54 70 14.7 5.8 60 12.8 4.8 103 15.6 8.1 132 16.8 10.2 138 16.4 10.5
55-64 13 2.7 1.7 18 3.8 2.3 27 4.1 3.2 25 3.2 2.9 32 3.8 3.6
65+ 1 0.2 0.1 1 0.2 0.1 6 0.9 0.6 6 0.8 0.6 6 0.7 0.6
Unknown 3 0.6 . 0 0.0 . 0 0.0 . 3 0.4 . 2 0.2 .
Total 475 5.1 470 4.9 660 6.9 788 8.2 844 8.7
Note: Cumulative percentages may not equal 100% because of rounding. Excludes cases from Pasadena and Long Beach.
2006
Table 4.1. Reported Primary and Secondary Syphilis Cases and Rates per 100,000 Population by Age Group, Los Angeles County, 2003-2007
200520042003 2007

Sexually Transmitted Disease Morbidity Report - 2007 (Volume 1) IV-3
0.0
2.9
16.1
20.6
17.018.2
10.5
3.6
0.6
0
5
10
15
20
25
0-14 15-19 20-24 25-29 30-34 35-44 45-54 55-64 65+
Age Group
Rat
e pe
r 100
,000
pop
ulat
ion
Figure 4.2. Reported Primary and Secondary Syphilis Rates per 100,000 Population in Los Angeles County, by Age Group, 2007
Note: Excludes cases in Long Beach and Pasadena
Sexually Transmitted Disease Morbidity Report - 2007 (Volume 1) IV-4
No. (%) Rate No. (%) Rate No. (%) Rate No. (%) Rate No. (%) Rate
MALE
0-14 0 0.0 0.0 0 0.0 0.0 0 0.0 0.0 0 0.0 0.0 0 0.0 0.015-19 5 1.1 1.4 7 1.6 2.0 6 1.0 1.7 14 1.9 3.9 17 2.2 4.620-24 33 7.3 9.6 42 9.7 12.2 56 9.4 16.2 62 8.6 18.0 107 13.5 29.625-29 44 9.8 12.3 57 13.2 16.1 72 12.1 20.6 105 14.6 30.2 131 16.6 37.730-34 73 16.3 18.5 67 15.5 17.2 106 17.8 27.8 88 12.2 23.6 110 13.9 30.435-44 211 47.0 28.0 184 42.6 24.2 228 38.2 29.8 299 41.5 39.1 264 33.4 34.745-54 67 14.9 11.4 58 13.4 9.6 96 16.1 15.4 121 16.8 19.0 124 15.7 19.155-64 13 2.9 3.6 16 3.7 4.3 27 4.5 6.9 23 3.2 5.6 29 3.7 6.965+ 0 0.0 0.0 1 0.2 0.3 6 1.0 1.5 6 0.8 1.5 6 0.8 1.4Unknown 3 0.7 . 0 0.0 . 0 0.0 . 3 0.4 . 2 0.3 .
Subtotal 449 94.5 9.7 432 91.9 9.2 597 90.5 12.6 721 91.5 15.1 790 93.7 16.5
FEMALE
0-14 0 0.0 0.0 1 2.6 0.1 0 0.0 0.0 0 0.0 0.0 0 0.0 0.015-19 1 3.8 0.3 4 10.5 1.2 5 7.9 1.5 7 10.4 2.0 4 7.5 1.120-24 5 19.2 1.6 7 18.4 2.2 9 14.3 2.8 6 9.0 1.8 6 11.3 1.825-29 5 19.2 1.5 7 18.4 2.1 13 20.6 3.9 9 13.4 2.8 7 13.2 2.230-34 6 23.1 1.6 4 10.5 1.1 8 12.7 2.2 6 9.0 1.7 10 18.9 2.935-44 5 19.2 0.7 11 28.9 1.5 21 33.3 2.8 26 38.8 3.5 9 17.0 1.245-54 3 11.5 0.5 2 5.3 0.3 7 11.1 1.1 11 16.4 1.7 14 26.4 2.155-64 0 0.0 0.0 2 5.3 0.5 0 0.0 0.0 2 3.0 0.4 3 5.7 0.665+ 1 3.8 0.2 0 0.0 0.0 0 0.0 0.0 0 0.0 0.0 0 0.0 0.0Unknown 0 0.0 . 0 0.0 . 0 0.0 . 0 0.0 . 0 0.0 .
Subtotal 26 5.5 0.5 38 8.1 0.8 63 9.5 1.3 67 8.5 1.4 53 6.3 1.1
Total 475 5.1 470 4.9 660 6.9 788 8.2 844 8.7
Note: Cumulative percentages may not equal 100% because of rounding. Excludes cases from Pasadena and Long Beach. Includes Transgender cases.
Table 4.2. Reported Primary and Secondary Syphilis Cases and Rates per 100,000 Population by Gender and Age Group, Los Angeles County, 2003-2007
2003 2004 2005 2006 2007

Sexually Transmitted Disease Morbidity Report - 2006 (Volume 1) IV-5
9.7 9.2
12.6
15.116.5
0.5 0.8 1.3 1.4 1.1
0
10
20
30
2003 2004 2005 2006 2007
Year
Rat
e pe
r 100
,000
pop
ulat
ion
Male Female
Figure 4.3. Reported Primary and Secondary Syphilis Rates per 100,000 Population in Los Angeles County, by Gender and Year
Note: Excludes cases in Long Beach and Pasadena

Sexually Transmitted Disease Morbidity Report - 2007 (Volume 1) IV-6
0.0
4.6
29.6
37.7
30.4
34.7
19.1
6.9
1.4
0510152025303540
0-14
15-19
20-24
25-29
30-34
35-44
45-54
55-64
65+
0.0
1.1
1.8
2.2
2.9
1.2
2.1
0.6
0.0
0 5 10 15 20 25 30 35 40
0-14
15-19
20-24
25-29
30-34
35-44
45-54
55-64
65+
Figure 4.4. Reported Primary and Secondary Syphilis Rates per 100,000 Population in Los Angeles County, by Gender and Age Group, 2007
Note: Excludes cases in Long Beach and Pasadena
Male Rate per 100,000 population Female Age

Sexually Transmitted Disease Morbidity Report - 2007 (Volume 1) IV-7
Adj. Adj. Adj. Adj. Adj. Adj.No. (%) Rate No. (%) Rate No. (%) Rate No. (%) Rate No. (%) Rate No. (%) Rate
MALE
2003 232 51.7 16.8 55 12.3 14.4 126 28.1 6.0 15 3.3 2.7 1 0.2 449 94.5 9.72004 193 44.7 13.7 65 15.1 16.8 146 33.8 6.6 13 3.0 2.3 4 0.9 432 91.9 9.22005 252 42.2 18.3 85 14.2 22.5 206 34.5 9.4 23 3.9 4.0 6 1.0 597 90.5 12.62006 291 40.4 21.4 116 16.1 31.1 257 35.6 11.6 19 2.6 3.3 3 0.4 721 91.5 15.12007 274 34.7 19.7 138 17.5 36.0 321 40.6 14.2 24 3.0 4.1 5 0.6 790 93.7 16.5
FEMALE
2003 2 7.7 0.1 7 26.9 1.5 17 65.4 0.8 0 0.0 0.0 0 0.0 26 5.5 0.52004 5 13.2 0.4 19 50.0 4.3 10 26.3 0.5 2 5.3 0.3 1 2.6 38 8.1 0.82005 8 12.7 0.6 32 50.8 7.0 23 36.5 1.0 0 0.0 0.0 0 0.0 63 9.5 1.32006 12 17.9 0.9 35 52.2 8.0 18 26.9 0.8 0 0.0 0.0 0 0.0 67 8.5 1.42007 7 13.2 0.5 21 39.6 4.9 22 41.5 1.0 0 0.0 0.0 0 0.0 53 6.3 1.1
1. Includes data for ethnicity reported as "Other," "Native American," and "Mixed."
Note: If race/ethnicity was not specified, cases were prorated according to the distribution of cases for which race/ethnicity was specified. Rates were adjusted including the prorated cases. Therefore, these tables should be used only for race/ethnicity comparisons, not for overall totals or gender totals. Cumulative percentages may not equal 100% because of
Table 4.3. Reported Primary and Secondary Syphilis Cases and Rates per 100,000 Population by Gender and Race/Ethnicity, Los Angeles County, 2003-2007
White Black Hispanic Asian-Pacific Other1
rounding. Cases from Pasadena and Long Beach were not included. Transgender cases were included.
Total2
2. Includes cases reported as "Unknown" race/ethnicity.

Sexually Transmitted Disease Morbidity Report - 2007 (Volume 1) IV-8
19.7
36.0
14.2
4.1
0.5
4.9
1.00.0
0
5
10
15
20
25
30
35
40
White Black Hispanic Asian-Pacific
Rat
e pe
r 100
,000
pop
ulat
ion
Male Female
Figure 4.5. Reported Primary and Secondary Syphilis Rates per 100,000 Population in Los Angeles County, by Gender and Race/Ethnicity, 2007
Note: Adjusted for unknown race. Excludes cases in Long Beach and Pasadena

Sexually Transmitted Disease Morbidity Report - 2007 (Volume 1) IV-9
Table 4.4. Reported Primary and Secondary Syphilis Cases and Rates per 100,000 Population by Service Planning Area (SPA)1 and Health District (HD), Los Angeles County, 2003-2007
2003 2004 2005 2006 2007No. (%) Rate No. (%) Rate No. (%) Rate No. (%) Rate No. (%) Rate
SPA2/HD3
Antelope Valley (1) 4 0.8 1.2 3 0.6 0.9 7 1.1 2.1 10 1.3 2.9 8 0.9 2.2 Antelope Valley 4 0.8 1.2 3 0.6 0.9 7 1.1 2.1 10 1.3 2.9 8 0.9 2.2
East (7) 29 6.1 2.1 36 7.7 2.6 47 7.1 3.4 45 5.7 3.3 85 10.1 6.2 Bellflower 11 2.3 3.0 10 2.1 2.7 8 1.2 2.2 9 1.1 2.4 28 3.3 7.6 East Los Angeles 7 1.5 3.3 6 1.3 2.7 7 1.1 3.2 11 1.4 4.9 10 1.2 4.5 San Antonio 8 1.7 1.8 13 2.8 2.9 23 3.5 5.1 19 2.4 4.2 28 3.3 6.2 Whittier 3 0.6 0.9 7 1.5 2.1 9 1.4 2.7 6 0.8 1.8 19 2.3 5.7
Metro (4) 241 50.7 19.8 226 48.1 18.3 305 46.2 24.4 352 44.7 27.9 368 43.6 29.2 Central 54 11.4 15.2 41 8.7 11.3 69 10.5 18.9 106 13.5 28.6 100 11.8 27.1 Hollywood-Wilshire 176 37.1 33.3 175 37.2 32.8 214 32.4 39.8 212 26.9 39.2 231 27.4 42.7 Northeast 11 2.3 3.3 10 2.1 2.9 22 3.3 6.4 34 4.3 9.7 37 4.4 10.5
San Fernando (2) 76 16.0 3.6 59 12.6 2.8 98 14.8 4.6 118 15.0 5.5 133 15.8 6.2 East Valley 35 7.4 7.9 29 6.2 6.5 40 6.1 8.8 47 6.0 10.3 49 5.8 10.7 Glendale 2 0.4 0.6 3 0.6 0.9 20 3.0 5.7 13 1.6 3.7 17 2.0 4.8 San Fernando 9 1.9 2.0 6 1.3 1.3 5 0.8 1.1 7 0.9 1.5 19 2.3 4.1 West Valley 30 6.3 3.5 21 4.5 2.4 33 5.0 3.8 51 6.5 5.8 48 5.7 5.4
San Gabriel (3) 20 4.2 1.2 26 5.5 1.5 28 4.2 1.6 45 5.7 2.6 45 5.3 2.6 Alhambra 2 0.4 0.6 4 0.9 1.1 9 1.4 2.5 10 1.3 2.8 9 1.1 2.5 El Monte 1 0.2 0.2 9 1.9 1.9 5 0.8 1.1 13 1.6 2.7 10 1.2 2.1 Foothill 5 1.1 1.6 3 0.6 1.0 7 1.1 2.2 7 0.9 2.2 8 0.9 2.5 Pomona 12 2.5 2.1 10 2.1 1.8 7 1.1 1.2 15 1.9 2.6 18 2.1 3.1
South (6) 41 8.6 4.1 50 10.6 4.9 85 12.9 8.2 89 11.3 8.5 90 10.7 8.6 Compton 8 1.7 2.8 13 2.8 4.5 9 1.4 3.1 12 1.5 4.1 16 1.9 5.5 South 6 1.3 3.4 6 1.3 3.3 17 2.6 9.2 14 1.8 7.5 13 1.5 7.0 Southeast 9 1.9 5.3 7 1.5 4.0 11 1.7 6.2 13 1.6 7.3 15 1.8 8.4 Southwest 18 3.8 4.8 24 5.1 6.3 48 7.3 12.6 50 6.3 13.1 46 5.5 11.9
South Bay (8) 18 3.8 1.6 18 3.8 1.6 40 6.1 3.6 46 5.8 4.1 46 5.5 4.1 Harbor 2 0.4 1.0 3 0.6 1.4 9 1.4 4.3 6 0.8 2.9 3 0.4 1.4 Inglewood 8 1.7 1.9 10 2.1 2.3 22 3.3 5.1 26 3.3 6.0 29 3.4 6.6 Torrance 8 1.7 1.7 5 1.1 1.1 9 1.4 1.9 14 1.8 3.0 14 1.7 3.0 West (5) 31 6.5 4.9 34 7.2 5.4 34 5.2 5.3 43 5.5 6.8 42 5.0 6.6 West 31 6.5 4.9 34 7.2 5.4 34 5.2 5.3 43 5.5 6.8 42 5.0 6.6
Unknown 15 3.2 . 18 3.8 . 16 2.4 . 40 5.1 . 27 3.2 .
Total 475 5.1 470 4.9 660 6.9 788 8.2 844 8.7
1. Excludes cases from Pasadena (SPA 3) and Long Beach (SPA 8).2. Main categories.3. Subcategories.Note: Cumulative percentages may not equal 100% because of rounding.
Sexually Transmitted Disease Morbidity Report - 2007 (Volume I) IV - 10
0 8 164 Miles
Figure 4.6. Reported Primary and Secondary Syphilis Rates per 100,000 Population by Service Planning Area (SPA), Los Angeles County, 2007.
Excludes cases from Pasadena (SPA 3) and Long Beach (SPA 8).
Antelope Valley (SPA 1)2.2
East (SPA 7)6.2
Metro (SPA 4)29.2
San Fernando (SPA 2)6.2
San Gabriel (SPA 3)2.6
South (SPA 6)8.6
South Bay (SPA 8)4.1
West (SPA 5)6.6

Sexually Transmitted Disease Morbidity Report, 2007
Section V: Early Latent Syphilis
Sexually Transmitted Disease Morbidity Report - 2007 (Volume 1) V-1
Figure 5.1. Reported Early Latent Syphilis Rates per 100,000 Population by Year, United States, California, and Los Angeles County (LAC), 2003-2007
2.92.6
2.83.1
3.93.7
3.2
2.42.3
8.17.8
6.1
4.24.1
0
1
2
3
4
5
6
7
8
9
10
2003 2004 2005 2006 2007
Year
Rat
es p
er 1
00,0
00 p
opul
atio
n
United States¹
California²
LA County³
1CDC. Sexually Transmitted Disease Surveillance, 2006 (2007 data not available as of July 18, 2008).2California Department of Health Services, STD Control Branch, Early Latent Syphilis, Cases and Rates, California Counties & Selected City Health Jurisdictions, 2003-2007 Provisional Data. 3 Los Angeles County Sexually Transmitted Disease Program, 2007. Excludes cases from Pasadena and Long Beach.

Sexually Transmitted Disease Morbidity Report - 2007 (Volume 1) V-2
No. (%) Rate No. (%) Rate No. (%) Rate No. (%) Rate No. (%) Rate
0-14 0 0.0 0.0 0 0.0 0.0 0 0.0 0.0 1 0.1 0.0 0 0.0 0.0
15-19 12 3.1 1.8 11 2.8 1.6 17 2.9 2.4 18 2.4 2.5 26 3.3 3.6
20-24 37 9.6 5.6 47 11.8 7.0 57 9.8 8.5 60 8.0 8.9 103 13.1 14.7
25-29 50 12.9 7.1 45 11.3 6.5 60 10.3 8.8 99 13.2 14.7 120 15.2 17.9
30-34 63 16.3 8.1 57 14.4 7.4 87 14.9 11.6 92 12.3 12.5 125 15.9 17.6
35-44 156 40.3 10.5 169 42.6 11.3 253 43.3 16.8 300 40.0 19.9 257 32.6 17.1
45-54 55 14.2 4.6 56 14.1 4.5 79 13.5 6.2 137 18.3 10.5 120 15.2 9.1
55-64 10 2.6 1.3 9 2.3 1.1 21 3.6 2.5 33 4.4 3.8 27 3.4 3.0
65+ 2 0.5 0.2 3 0.8 0.3 9 1.5 0.9 8 1.1 0.8 8 1.0 0.8
Unknown 2 0.5 . 0 0.0 . 1 0.2 . 2 0.3 . 2 0.3 .
Total 387 4.1 397 4.2 584 6.1 750 7.8 788 8.1
Note: Cumulative percentages may not equal 100% because of rounding. Excludes cases from Pasadena and Long Beach.
2006
Table 5.1. Reported Early Latent Syphilis Cases and Rates per 100,000 Population by Age Group, Los Angeles County, 2003-2007
200520042003 2007
Sexually Transmitted Disease Morbidity Report - 2007 (Volume 1) V-3
0.0
3.6
14.7
17.9 17.617.1
9.1
3.0
0.8
0
2
4
6
8
10
12
14
16
18
20
0-14 15-19 20-24 25-29 30-34 35-44 45-54 55-64 65+
Age Group
Rat
e pe
r 100
,000
pop
ulat
ion
Figure 5.2. Reported Early Latent Syphilis Rates per 100,000 Population in Los Angeles County, by Age Group, 2007
Note: Excludes cases in Long Beach and Pasadena

Sexually Transmitted Disease Morbidity Report - 2007 (Volume 1) V-4
No. (%) Rate No. (%) Rate No. (%) Rate No. (%) Rate No. (%) Rate
MALE
0-14 0 0.0 0.0 0 0.0 0.0 0 0.0 0.0 0 0.0 0.0 0 0.0 0.015-19 6 1.8 1.7 4 1.2 1.1 5 1.0 1.4 13 2.1 3.6 19 2.9 5.120-24 27 8.2 7.9 38 11.1 11.0 43 8.5 12.5 45 7.1 13.0 81 12.2 22.425-29 43 13.0 12.0 31 9.0 8.8 48 9.5 13.7 81 12.8 23.3 95 14.3 27.430-34 54 16.3 13.7 50 14.6 12.8 80 15.9 21.0 79 12.5 21.2 103 15.5 28.535-44 140 42.3 18.6 155 45.2 20.4 231 45.9 30.2 259 41.0 33.9 229 34.5 30.145-54 49 14.8 8.4 53 15.5 8.8 69 13.7 11.1 119 18.9 18.7 105 15.8 16.255-64 9 2.7 2.5 9 2.6 2.4 19 3.8 4.8 26 4.1 6.3 23 3.5 5.565+ 1 0.3 0.3 3 0.9 0.8 7 1.4 1.7 7 1.1 1.7 8 1.2 1.9Unknown 2 0.6 . 0 0.0 . 1 0.2 . 2 0.3 . 1 0.2 .
Subtotal 331 85.5 7.1 343 86.4 7.3 503 86.1 10.6 631 84.1 13.2 664 84.3 13.8
FEMALE
0-14 0 0.0 0.0 0 0.0 0.0 0 0.0 0.0 1 0.8 0.1 0 0.0 0.015-19 6 10.7 1.8 7 13.0 2.1 12 14.8 3.5 5 4.2 1.4 7 5.6 1.920-24 10 17.9 3.1 9 16.7 2.8 14 17.3 4.3 15 12.6 4.5 22 17.7 6.525-29 7 12.5 2.0 14 25.9 4.1 12 14.8 3.6 18 15.1 5.5 25 20.2 7.730-34 9 16.1 2.4 7 13.0 1.9 7 8.6 1.9 13 10.9 3.6 22 17.7 6.335-44 16 28.6 2.2 14 25.9 1.9 22 27.2 3.0 41 34.5 5.5 28 22.6 3.845-54 6 10.7 1.0 3 5.6 0.5 10 12.3 1.5 18 15.1 2.7 15 12.1 2.255-64 1 1.8 0.2 0 0.0 0.0 2 2.5 0.5 7 5.9 1.5 4 3.2 0.965+ 1 1.8 0.2 0 0.0 0.0 2 2.5 0.4 1 0.8 0.2 0 0.0 0.0Unknown 0 0.0 . 0 0.0 . 0 0.0 . 0 0.0 . 1 0.8 .
Subtotal 56 14.5 1.2 54 13.6 1.1 81 13.9 1.7 119 15.9 2.4 124 15.7 2.5
Total 387 4.1 397 4.2 584 6.1 750 7.8 788 8.1
Note: Cumulative percentages may not equal 100% because of rounding. Excludes cases from Pasadena and Long Beach. Includes Transgender cases.
Table 5.2. Reported Early Latent Syphilis Cases and Rates per 100,000 Population by Gender and Age Group, Los Angeles County, 2003-2007
2003 2004 2005 2006 2007
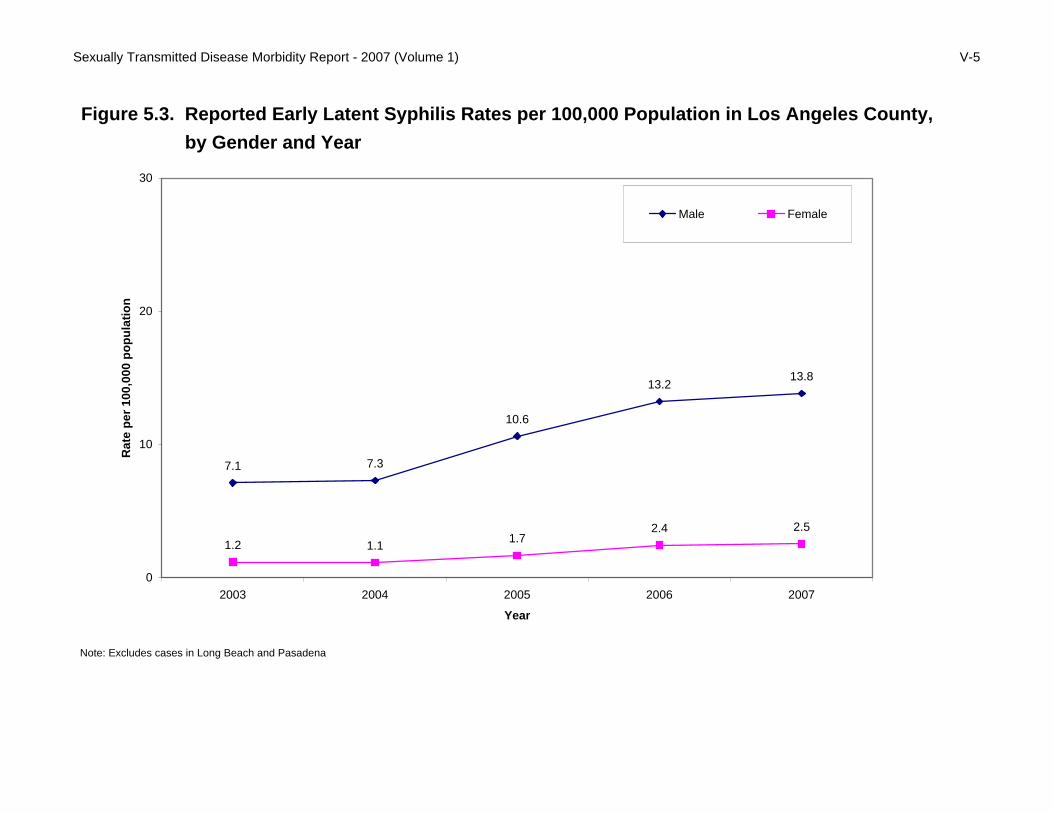
Sexually Transmitted Disease Morbidity Report - 2007 (Volume 1) V-5
7.1 7.3
10.6
13.213.8
1.2 1.1 1.72.4 2.5
0
10
20
30
2003 2004 2005 2006 2007
Year
Rat
e pe
r 100
,000
pop
ulat
ion
Male Female
Figure 5.3. Reported Early Latent Syphilis Rates per 100,000 Population in Los Angeles County, by Gender and Year
Note: Excludes cases in Long Beach and Pasadena
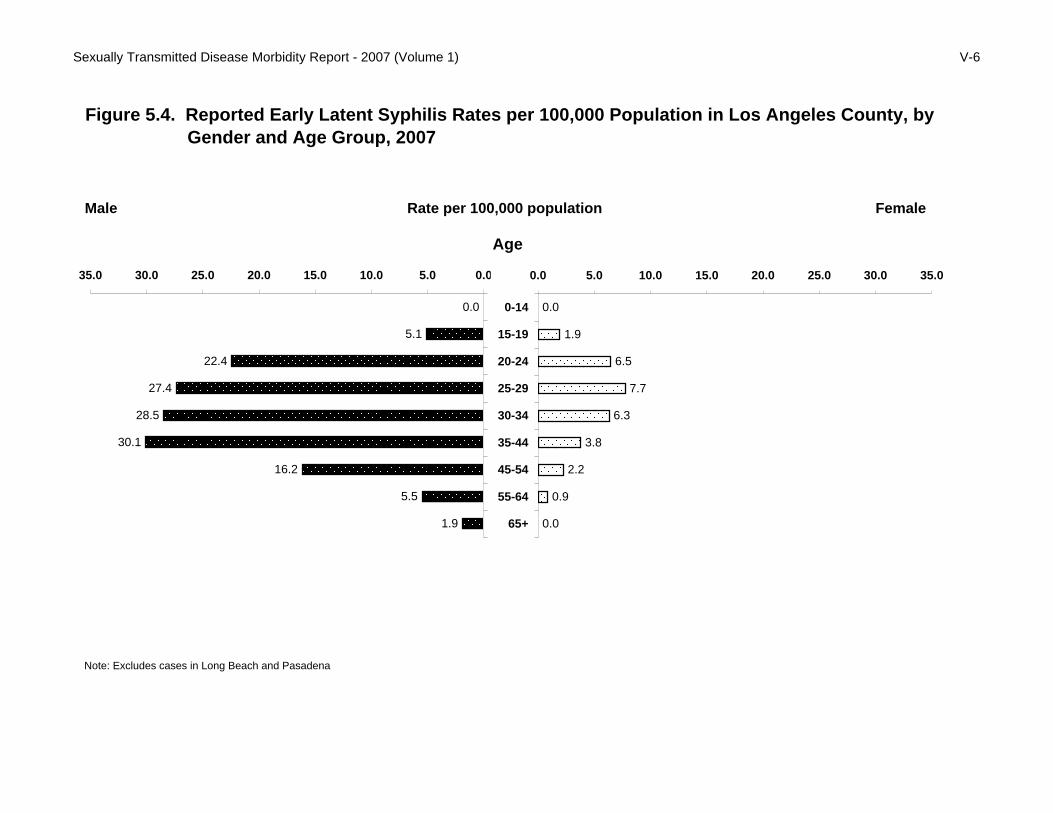
Sexually Transmitted Disease Morbidity Report - 2007 (Volume 1) V-6
0.0
5.1
22.4
27.4
28.5
30.1
16.2
5.5
1.9
0.05.010.015.020.025.030.035.0
0-14
15-19
20-24
25-29
30-34
35-44
45-54
55-64
65+
0.0
1.9
6.5
7.7
6.3
3.8
2.2
0.9
0.0
0.0 5.0 10.0 15.0 20.0 25.0 30.0 35.0
0-14
15-19
20-24
25-29
30-34
35-44
45-54
55-64
65+
Figure 5.4. Reported Early Latent Syphilis Rates per 100,000 Population in Los Angeles County, by Gender and Age Group, 2007
Note: Excludes cases in Long Beach and Pasadena
Male Rate per 100,000 population Female Age

Sexually Transmitted Disease Morbidity Report - 2007 (Volume 1) V-7
Adj. Adj. Adj. Adj. Adj. Adj.No. (%) Rate No. (%) Rate No. (%) Rate No. (%) Rate No. (%) Rate No. (%) Rate
MALE
2003 117 35.4 8.4 38 11.5 9.9 152 45.9 7.2 10 3.0 1.8 1 0.3 331 85.5 7.12004 132 38.5 9.3 53 15.5 13.6 140 40.8 6.3 8 2.3 1.4 3 0.9 343 86.4 7.32005 177 35.2 12.7 91 18.1 23.8 199 39.6 9.0 18 3.6 3.1 2 0.4 503 86.1 10.62006 179 28.4 13.1 116 18.4 30.9 288 45.6 12.9 11 1.7 1.9 9 1.4 631 84.1 13.22007 175 26.4 12.4 112 16.9 28.9 331 49.9 14.5 26 3.9 4.4 5 0.8 664 84.3 13.8
FEMALE
2003 3 5.4 0.2 21 37.5 4.9 25 44.6 1.2 3 5.4 0.5 0 0.0 56 14.5 1.22004 1 1.9 0.1 21 38.9 4.6 30 55.6 1.4 2 3.7 0.3 0 0.0 54 13.6 1.12005 9 11.1 0.7 28 34.6 6.8 34 42.0 1.7 2 2.5 0.3 0 0.0 81 13.9 1.72006 15 12.6 1.1 33 27.7 7.6 61 51.3 2.8 3 2.5 0.5 3 2.5 119 15.9 2.42007 13 10.5 0.9 40 32.3 9.2 63 50.8 2.9 2 1.6 0.3 0 0.0 124 15.7 2.5
1. Includes data for ethnicity reported as "Other," "Native American," and "Mixed."2. Includes cases reported as "Unknown" race/ethnicity.Note: If race/ethnicity was not specified, cases were prorated according to the distribution of cases for which race/ethnicity was specified. Rates were adjusted including the prorated cases. Therefore, these tables should be used only for race/ethnicity comparisons, not for overall totals or gender totals. Cumulative percentages may not equal 100% because of rounding. Cases from Pasadena and Long Beach were not included. Transgender cases were included.
Table 5.3. Reported Early Latent Syphilis Cases and Rates per 100,000 Population by Gender and Race/Ethnicity, Los Angeles County, 2003-2007
White Black Hispanic Asian-Pacific Other1 Total2
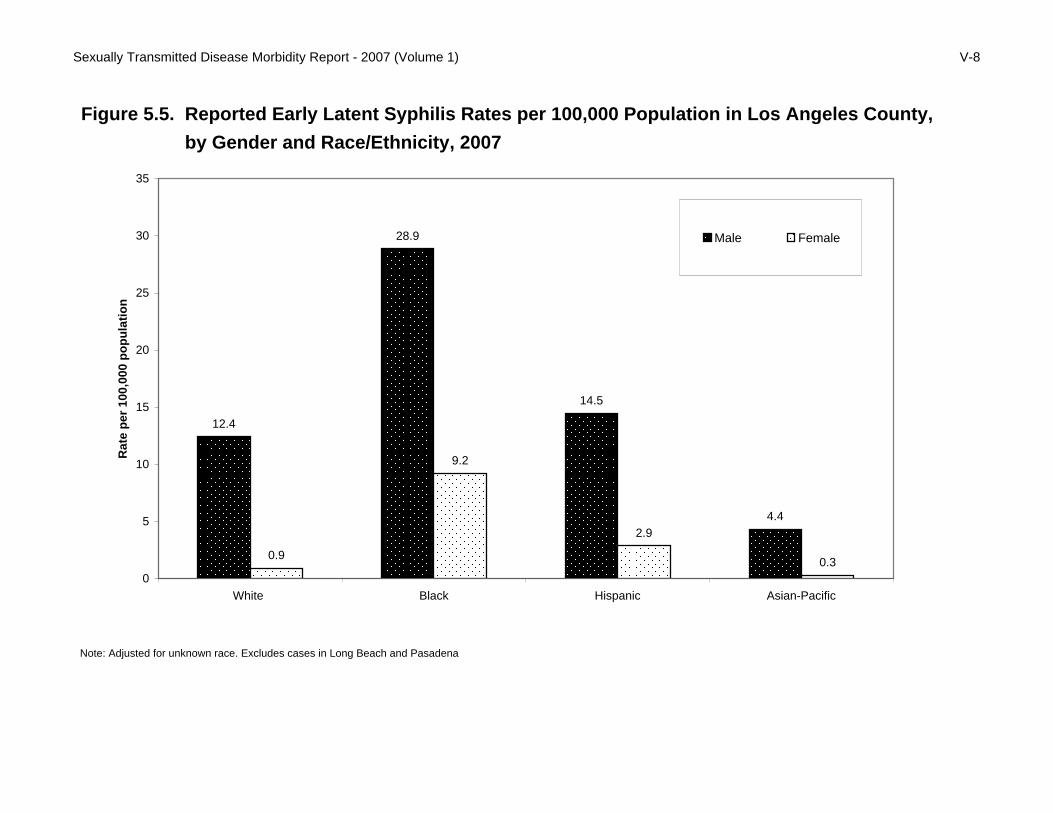
Sexually Transmitted Disease Morbidity Report - 2007 (Volume 1) V-8
12.4
28.9
14.5
4.4
0.9
9.2
2.9
0.30
5
10
15
20
25
30
35
White Black Hispanic Asian-Pacific
Rat
e pe
r 100
,000
pop
ulat
ion
Male Female
Figure 5.5. Reported Early Latent Syphilis Rates per 100,000 Population in Los Angeles County, by Gender and Race/Ethnicity, 2007
Note: Adjusted for unknown race. Excludes cases in Long Beach and Pasadena

Sexually Transmitted Disease Morbidity Report - 2007 (Volume 1) V-9
Table 5.4. Reported Early Latent Syphilis Cases and Rates per 100,000 Population by Service Planning Area (SPA)1 and Health District (HD), Los Angeles County, 2003-2007
2003 2004 2005 2006 2007No. (%) Rate No. (%) Rate No. (%) Rate No. (%) Rate No. (%) Rate
SPA2/HD3
Antelope Valley (1) 2 0.5 0.6 0 0.0 0.0 3 0.5 0.9 6 0.8 1.7 7 0.9 2.0 Antelope Valley 2 0.5 0.6 3 0.5 0.9 6 0.8 1.7 7 0.9 2.0
0 0.00 0.0East (7) 15 3.9 1.1 34 8.6 2.5 37 6.3 2.7 71 9.5 5.1 63 8.0 4.6 Bellflower 3 0.8 0.8 4 1.0 1.1 8 1.4 2.2 15 2.0 4.1 16 2.0 4.3 East Los Angeles 3 0.8 1.4 10 2.5 4.6 10 1.7 4.5 15 2.0 6.7 13 1.6 5.8 San Antonio 8 2.1 1.8 14 3.5 3.1 18 3.1 4.0 20 2.7 4.4 23 2.9 5.1 Whittier 1 0.3 0.3 6 1.5 1.8 1 0.2 0.3 21 2.8 6.3 11 1.4 3.3
Metro (4) 181 46.8 14.9 181 45.6 14.7 258 44.2 20.7 342 45.6 27.1 343 43.5 27.2 Central 43 11.1 12.1 55 13.9 15.2 76 13.0 20.8 116 15.5 31.4 96 12.2 26.0 Hollywood-Wilshire 120 31.0 22.7 112 28.2 21.0 167 28.6 31.0 198 26.4 36.6 210 26.6 38.8 Northeast 18 4.7 5.4 14 3.5 4.1 15 2.6 4.4 28 3.7 8.0 37 4.7 10.5
San Fernando (2) 63 16.3 3.0 57 14.4 2.7 87 14.9 4.1 97 12.9 4.5 93 11.8 4.3 East Valley 16 4.1 3.6 19 4.8 4.2 34 5.8 7.5 39 5.2 8.5 21 2.7 4.6 Glendale 10 2.6 2.9 6 1.5 1.7 10 1.7 2.8 7 0.9 2.0 20 2.5 5.6 San Fernando 12 3.1 2.7 11 2.8 2.5 7 1.2 1.5 14 1.9 3.0 11 1.4 2.4 West Valley 25 6.5 2.9 21 5.3 2.4 36 6.2 4.1 37 4.9 4.2 41 5.2 4.6
San Gabriel (3) 24 6.2 1.4 24 6.0 1.4 26 4.5 1.5 35 4.7 2.0 45 5.7 2.6 Alhambra 3 0.8 0.8 2 0.5 0.6 4 0.7 1.1 3 0.4 0.8 6 0.8 1.7 El Monte 9 2.3 1.9 6 1.5 1.3 12 2.1 2.5 13 1.7 2.7 17 2.2 3.5 Foothill 4 1.0 1.3 9 2.3 2.9 3 0.5 1.0 10 1.3 3.2 4 0.5 1.3 Pomona 8 2.1 1.4 7 1.8 1.2 7 1.2 1.2 9 1.2 1.6 18 2.3 3.1
South (6) 45 11.6 4.5 48 12.1 4.7 75 12.8 7.3 95 12.7 9.1 112 14.2 10.7 Compton 5 1.3 1.7 9 2.3 3.1 7 1.2 2.4 16 2.1 5.5 13 1.6 4.4 South 7 1.8 3.9 6 1.5 3.3 18 3.1 9.8 17 2.3 9.1 28 3.6 15.0 Southeast 11 2.8 6.5 9 2.3 5.2 7 1.2 4.0 19 2.5 10.6 18 2.3 10.1 Southwest 22 5.7 5.9 24 6.0 6.3 43 7.4 11.3 43 5.7 11.3 53 6.7 13.7
South Bay (8) 24 6.2 2.2 28 7.1 2.5 46 7.9 4.2 45 6.0 4.0 63 8.0 5.6 Harbor 3 0.8 1.5 6 1.5 2.9 6 1.0 2.9 5 0.7 2.4 10 1.3 4.7 Inglewood 16 4.1 3.8 13 3.3 3.0 35 6.0 8.1 35 4.7 8.0 40 5.1 9.2 Torrance 5 1.3 1.1 9 2.3 1.9 5 0.9 1.1 5 0.7 1.1 13 1.6 2.8 West (5) 21 5.4 3.3 19 4.8 3.0 27 4.6 4.2 29 3.9 4.6 33 4.2 5.2 West 21 5.4 3.3 19 4.8 3.0 27 4.6 4.2 29 3.9 4.6 33 4.2 5.2
Unknown 12 3.1 . 6 1.5 . 25 4.3 . 30 4.0 . 29 3.7 .
Total 387 4.1 397 4.2 584 6.1 750 7.8 788 8.1
1. Excludes cases from Pasadena (SPA 3) and Long Beach (SPA 8).2. Main categories.3. Subcategories.Note: Cumulative percentages may not equal 100% because of rounding.

Sexually Transmitted Disease Morbidity Report - 2007 (Volume I) V - 10
0 8 164 Miles
Figure 5.6. Reported Early Latent Syphilis Rates per 100,000 Population by Service Planning Area (SPA), Los Angeles County, 2007.
Excludes cases from Pasadena (SPA 3) and Long Beach (SPA 8).
Antelope Valley (SPA 1)2.0
East (SPA 7)4.6
Metro (SPA 4)27.2
San Fernando (SPA 2)4.3
San Gabriel (SPA 3)2.6
South (SPA 6)10.7
South Bay (SPA 8)5.6
West (SPA 5)5.2

Sexually Transmitted Disease Morbidity Report, 2007
Section VI: Late and Late Latent Syphilis

Sexually Transmitted Disease Morbidity Report - 2007 (Volume 1) VI-1
Figure 6.1. Reported Late and Late Latent Syphilis Rates per 100,000 Population by Year, United States, California, and Los Angeles County (LAC), 2003-2007
6.05.4
5.9
6.3
5.8
6.77.3
7.9 7.5
10.5
13.4
15.617.0
14.2
0
5
10
15
20
2003 2004 2005 2006 2007Year
Rat
es p
er 1
00,0
00 p
opul
atio
n
United States¹
California²
LA County³
1CDC. Sexually Transmitted Disease Surveillance, 2006 (2007 data not available as of July 18, 2008).2California Department of Health Services, STD Control Branch,Latent Unknown Duration/Late/Late Latent Syphilis, Cases and Rates, California Counties & Selected City Health Jurisdictions, 2003-2007 Provisional Data. 3Los Angeles County Sexually Transmitted Disease Program, 2007. Excludes cases from Pasadena and Long Beach.Note: Late and late latent syphilis is classified as late latent, latent unknown duration, and late syphilis with clinical manifestations (including neurosyphilis).

Sexually Transmitted Disease Morbidity Report - 2007 (Volume 1) VI-2
No. (%) Rate No. (%) Rate No. (%) Rate No. (%) Rate No. (%) Rate
0-14 1 0.1 0.0 0 0.0 0.0 0 0.0 0.0 0 0.0 0.0 2 0.1 0.1
15-19 29 2.9 4.3 47 3.7 6.8 42 2.8 6.0 39 2.4 5.5 25 1.8 3.4
20-24 83 8.4 12.5 92 7.2 13.8 118 7.9 17.6 130 7.9 19.2 130 9.5 18.5
25-29 130 13.2 18.5 153 12.0 22.1 154 10.3 22.6 191 11.7 28.4 162 11.8 24.2
30-34 148 15.0 19.1 165 13.0 21.6 185 12.4 24.7 171 10.4 23.3 172 12.5 24.2
35-44 307 31.1 20.6 363 28.6 24.2 441 29.5 29.3 516 31.5 34.3 365 26.6 24.3
45-54 145 14.7 12.0 228 18.0 18.4 267 17.9 21.0 313 19.1 24.1 236 17.2 17.9
55-64 86 8.7 11.3 121 9.5 15.2 136 9.1 16.3 153 9.3 17.6 158 11.5 17.8
65+ 54 5.5 5.8 100 7.9 10.6 141 9.4 14.6 120 7.3 12.3 120 8.7 11.9
Unknown 5 0.5 . 1 0.1 . 10 0.7 . 4 0.2 . 3 0.2 .
Total 988 10.5 1,270 13.4 1,494 15.6 1,637 17.0 1,373 14.2
Note: Cumulative percentages may not equal 100% because of rounding. Excludes cases from Pasadena and Long Beach.1. Late and late latent syphilis is classified as late latent, latent unknown duration, and late syphilis with clinical manifestations (including neurosyphilis)
2006
Table 6.1. Reported Late and Late Latent Syphilis1 Cases and Rates per 100,000 Population by Age Group, Los Angeles County, 2003-2007
200520042003 2007

Sexually Transmitted Disease Morbidity Report - 2007 (Volume 1) VI-3
No. (%) Rate No. (%) Rate No. (%) Rate No. (%) Rate No. (%) Rate
MALE
0-14 0 0.0 0.0 0 0.0 0.0 0 0.0 0.0 0 0.0 0.0 1 0.1 0.115-19 12 2.0 3.5 12 1.5 3.4 14 1.5 3.9 19 1.8 5.3 11 1.3 3.020-24 35 6.0 10.2 49 6.2 14.2 55 5.9 15.9 76 7.3 22.0 81 9.5 22.425-29 59 10.0 16.5 97 12.3 27.5 95 10.2 27.2 116 11.1 33.4 97 11.3 27.930-34 98 16.7 24.8 113 14.3 29.0 129 13.8 33.9 96 9.2 25.7 103 12.0 28.535-44 200 34.0 26.6 243 30.8 32.0 284 30.4 37.1 351 33.5 45.9 249 29.1 32.745-54 97 16.5 16.6 148 18.8 24.5 184 19.7 29.6 217 20.7 34.0 151 17.7 23.255-64 60 10.2 16.7 74 9.4 19.7 89 9.5 22.6 109 10.4 26.6 97 11.3 23.165+ 23 3.9 6.0 52 6.6 13.2 79 8.5 19.7 62 5.9 15.2 63 7.4 14.9Unknown 4 0.7 . 0 0.0 . 5 0.5 . 1 0.1 . 2 0.2 .
Subtotal 588 59.7 12.6 788 62.0 16.8 934 62.6 19.7 1,047 64.2 21.9 855 62.4 17.8
FEMALE
0-14 1 0.3 0.1 0 0.0 0.0 0 0.0 0.0 0 0.0 0.0 1 0.2 0.115-19 17 4.3 5.1 35 7.3 10.3 28 5.0 8.1 20 3.4 5.8 14 2.7 3.920-24 48 12.1 15.0 43 8.9 13.3 63 11.3 19.3 53 9.1 16.0 49 9.5 14.425-29 71 17.9 20.6 56 11.6 16.5 59 10.6 17.8 75 12.8 23.1 65 12.6 20.130-34 50 12.6 13.2 52 10.8 13.8 56 10.0 15.2 75 12.8 20.7 68 13.2 19.535-44 105 26.4 14.3 120 24.9 16.2 157 28.1 21.1 163 27.9 22.0 115 22.3 15.645-54 47 11.8 7.6 80 16.6 12.6 82 14.7 12.6 95 16.2 14.4 85 16.5 12.755-64 26 6.5 6.5 47 9.8 11.1 47 8.4 10.7 43 7.4 9.4 61 11.8 13.065+ 31 7.8 5.7 48 10.0 8.7 62 11.1 11.0 58 9.9 10.1 56 10.9 9.5Unknown 1 0.3 . 1 0.2 . 4 0.7 . 3 0.5 . 1 0.2 .
Subtotal 397 40.3 8.4 482 38.0 10.0 558 37.4 11.5 585 35.8 12.0 515 37.6 10.5
Total2 988 10.5 1,270 13.4 1,494 15.6 1,637 17.0 1,373 14.2
(Source: CDC. Sexually Transmitted Disease Surveillance)
Note: Cumulative percentages may not equal 100% because of rounding. Excludes cases from Pasadena and Long Beach. Includes Transgender cases.2. Includes cases reported as "Unknown/Other" gender and known age.
Table 6.2. Reported Late and Late Latent Syphilis1 Cases and Rates per 100,000 Population by Gender and Age Group, Los Angeles County, 2003-2007
2003 2004 2005 2006 2007
1. Late and late latent syphilis is classified as late latent, latent unknown duration and late syphilis with clinical manifestations (including neurosyphilis).

Sexually Transmitted Disease Morbidity Report - 2007 (Volume 1) VI-4
Adj. Adj. Adj. Adj. Adj. Adj.No. (%) Rate No. (%) Rate No. (%) Rate No. (%) Rate No. (%) Rate No. (%) Rate
MALE
2003 100 17.0 7.5 87 14.8 23.7 333 56.6 16.3 17 2.9 3.2 2 0.3 588 59.7 12.62004 133 16.9 10.0 122 15.5 33.5 419 53.2 20.3 33 4.2 6.1 10 1.3 788 62.0 16.82005 160 17.1 12.3 150 16.1 41.9 484 51.8 23.3 35 3.8 6.4 9 1.0 934 62.6 19.72006 179 17.1 14.3 169 16.1 49.3 504 48.1 24.7 40 3.8 7.6 7 0.7 1,047 64.2 21.92007 129 15.1 9.9 135 15.8 37.6 455 53.2 21.5 33 3.9 6.0 13 1.5 855 62.4 17.8
FEMALE
2003 17 4.3 1.2 63 15.9 14.7 265 66.8 13.1 23 5.8 3.9 0 0.0 397 40.3 8.42004 10 2.1 0.8 108 22.4 25.8 292 60.6 14.4 24 5.0 4.0 3 0.6 482 38.0 10.02005 27 4.8 2.0 112 20.1 26.3 332 59.5 15.7 47 8.4 7.6 2 0.4 558 37.4 11.52006 28 4.8 2.1 116 19.8 27.8 344 58.8 16.3 45 7.7 7.3 4 0.7 585 35.8 12.02007 40 7.8 3.0 89 17.3 21.6 302 58.6 14.5 25 4.9 4.1 7 1.4 515 37.6 10.5
1. Late and late latent syphilis is classified as late latent, latent unknown duration, and late syphilis with clinical manifestations (including neurosyphilis).2. Includes data for ethnicity reported as "Other," "Native American," and "Mixed."
Note: If race/ethnicity was not specified, cases were prorated according to the distribution of cases for which race/ethnicity was specified. Rates were adjusted including the prorated cases. Therefore, these tables should be used only for race/ethnicity comparisons, not for overall totals or gender totals. Cumulative percentages may not equal 100% because of rounding. Cases from Pasadena and Long Beach were not included. Transgender cases were included.
3. Excludes cases reported with "Unknown/Other" gender. 4. Includes cases reported as "Unknown" race/ethnicity.
Table 6.3. Reported Late and Late Latent Syphilis1 Cases and Rates per 100,000 Population by Gender and Race/Ethnicity, Los Angeles County, 2003-2007
White Black Hispanic Asian-Pacific Other2 Total3,4
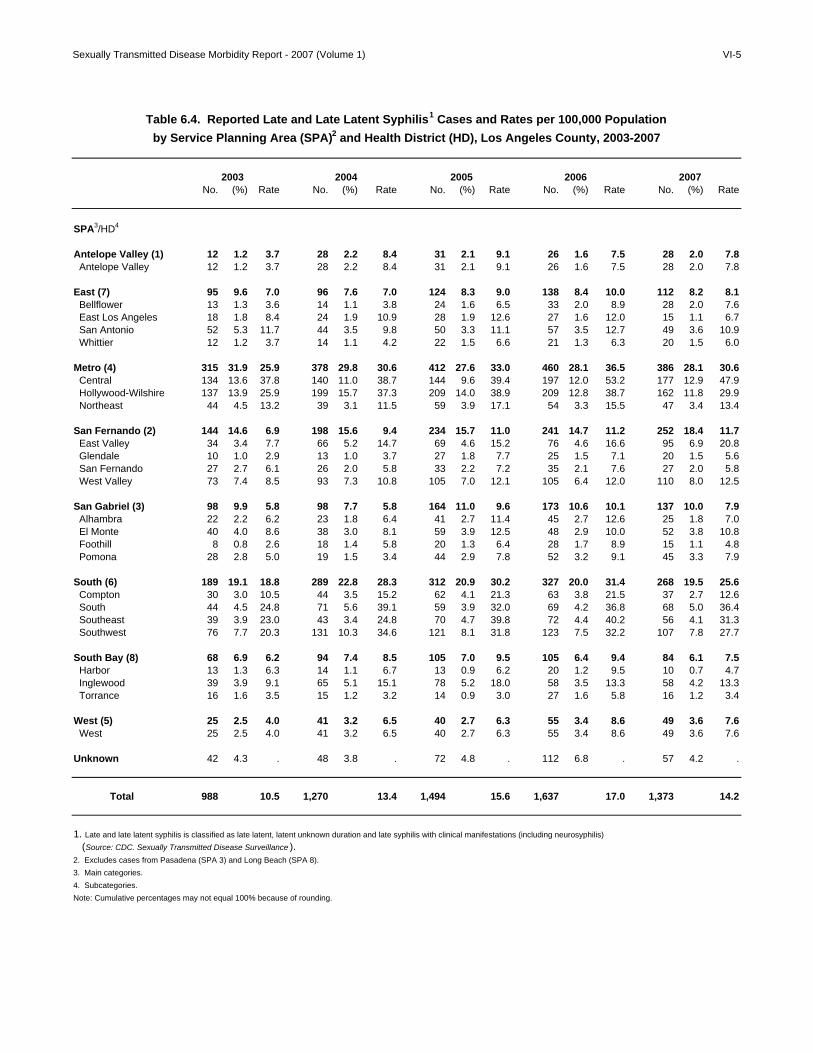
Sexually Transmitted Disease Morbidity Report - 2007 (Volume 1) VI-5
Table 6.4. Reported Late and Late Latent Syphilis1 Cases and Rates per 100,000 Population by Service Planning Area (SPA)2 and Health District (HD), Los Angeles County, 2003-2007
2003 2004 2005 2006 2007No. (%) Rate No. (%) Rate No. (%) Rate No. (%) Rate No. (%) Rate
SPA3/HD4
Antelope Valley (1) 12 1.2 3.7 28 2.2 8.4 31 2.1 9.1 26 1.6 7.5 28 2.0 7.8 Antelope Valley 12 1.2 3.7 28 2.2 8.4 31 2.1 9.1 26 1.6 7.5 28 2.0 7.8
East (7) 95 9.6 7.0 96 7.6 7.0 124 8.3 9.0 138 8.4 10.0 112 8.2 8.1 Bellflower 13 1.3 3.6 14 1.1 3.8 24 1.6 6.5 33 2.0 8.9 28 2.0 7.6 East Los Angeles 18 1.8 8.4 24 1.9 10.9 28 1.9 12.6 27 1.6 12.0 15 1.1 6.7 San Antonio 52 5.3 11.7 44 3.5 9.8 50 3.3 11.1 57 3.5 12.7 49 3.6 10.9 Whittier 12 1.2 3.7 14 1.1 4.2 22 1.5 6.6 21 1.3 6.3 20 1.5 6.0
Metro (4) 315 31.9 25.9 378 29.8 30.6 412 27.6 33.0 460 28.1 36.5 386 28.1 30.6 Central 134 13.6 37.8 140 11.0 38.7 144 9.6 39.4 197 12.0 53.2 177 12.9 47.9 Hollywood-Wilshire 137 13.9 25.9 199 15.7 37.3 209 14.0 38.9 209 12.8 38.7 162 11.8 29.9 Northeast 44 4.5 13.2 39 3.1 11.5 59 3.9 17.1 54 3.3 15.5 47 3.4 13.4
San Fernando (2) 144 14.6 6.9 198 15.6 9.4 234 15.7 11.0 241 14.7 11.2 252 18.4 11.7 East Valley 34 3.4 7.7 66 5.2 14.7 69 4.6 15.2 76 4.6 16.6 95 6.9 20.8 Glendale 10 1.0 2.9 13 1.0 3.7 27 1.8 7.7 25 1.5 7.1 20 1.5 5.6 San Fernando 27 2.7 6.1 26 2.0 5.8 33 2.2 7.2 35 2.1 7.6 27 2.0 5.8 West Valley 73 7.4 8.5 93 7.3 10.8 105 7.0 12.1 105 6.4 12.0 110 8.0 12.5
San Gabriel (3) 98 9.9 5.8 98 7.7 5.8 164 11.0 9.6 173 10.6 10.1 137 10.0 7.9 Alhambra 22 2.2 6.2 23 1.8 6.4 41 2.7 11.4 45 2.7 12.6 25 1.8 7.0 El Monte 40 4.0 8.6 38 3.0 8.1 59 3.9 12.5 48 2.9 10.0 52 3.8 10.8 Foothill 8 0.8 2.6 18 1.4 5.8 20 1.3 6.4 28 1.7 8.9 15 1.1 4.8 Pomona 28 2.8 5.0 19 1.5 3.4 44 2.9 7.8 52 3.2 9.1 45 3.3 7.9
South (6) 189 19.1 18.8 289 22.8 28.3 312 20.9 30.2 327 20.0 31.4 268 19.5 25.6 Compton 30 3.0 10.5 44 3.5 15.2 62 4.1 21.3 63 3.8 21.5 37 2.7 12.6 South 44 4.5 24.8 71 5.6 39.1 59 3.9 32.0 69 4.2 36.8 68 5.0 36.4 Southeast 39 3.9 23.0 43 3.4 24.8 70 4.7 39.8 72 4.4 40.2 56 4.1 31.3 Southwest 76 7.7 20.3 131 10.3 34.6 121 8.1 31.8 123 7.5 32.2 107 7.8 27.7
South Bay (8) 68 6.9 6.2 94 7.4 8.5 105 7.0 9.5 105 6.4 9.4 84 6.1 7.5 Harbor 13 1.3 6.3 14 1.1 6.7 13 0.9 6.2 20 1.2 9.5 10 0.7 4.7 Inglewood 39 3.9 9.1 65 5.1 15.1 78 5.2 18.0 58 3.5 13.3 58 4.2 13.3 Torrance 16 1.6 3.5 15 1.2 3.2 14 0.9 3.0 27 1.6 5.8 16 1.2 3.4 West (5) 25 2.5 4.0 41 3.2 6.5 40 2.7 6.3 55 3.4 8.6 49 3.6 7.6 West 25 2.5 4.0 41 3.2 6.5 40 2.7 6.3 55 3.4 8.6 49 3.6 7.6
Unknown 42 4.3 . 48 3.8 . 72 4.8 . 112 6.8 . 57 4.2 .
Total 988 10.5 1,270 13.4 1,494 15.6 1,637 17.0 1,373 14.2
1. Late and late latent syphilis is classified as late latent, latent unknown duration and late syphilis with clinical manifestations (including neurosyphilis) (Source: CDC. Sexually Transmitted Disease Surveillance ).2. Excludes cases from Pasadena (SPA 3) and Long Beach (SPA 8).3. Main categories.4. Subcategories.Note: Cumulative percentages may not equal 100% because of rounding.

Sexually Transmitted Disease Morbidity Report - 2007 (Volume I) VI - 6
0 8 164 Miles
Figure 6.2. Reported Late and Late Latent Syphilis Rates per 100,000 Population by Service Planning Area (SPA), Los Angeles County, 2007.
Excludes cases from Pasadena (SPA 3) and Long Beach (SPA 8).
Antelope Valley (SPA 1)7.8
East (SPA 7)8.1
Metro (SPA 4)30.6
San Fernando (SPA 2)11.7
San Gabriel (SPA 3)7.9
South (SPA 6)25.6
South Bay (SPA 8)7.5
West (SPA 5)7.6
Sexually Transmitted Disease Morbidity Report, 2007
Section VII: Congenital Syphilis

Sexually Transmitted Disease Morbidity Report - 2007 (Volume 1) VII-1
Figure 7.1. Reported Presumptive Congenital Syphilis Rates by Year, United States, California, and Los Angeles County (LAC), 2003-2007
31.1
10.69.1 8.2 8.5
14.412.512.9
11.612.8
22.7
17.6
21.6 21.2
0
10
20
30
40
50
60
2003 2004 2005 2006 2007
Year
Rat
es p
er 1
00,0
00 L
ive
Birt
hs
United States¹
Californa²
LA County³
1CDC. Sexually Transmitted Disease Surveillance, 2006 (2007 data not available as of July 18, 2008)2California Department of Health Services, STD Control Branch, Congenital Syphilis in Infants < 1 Year of Age, Cases and Rates, California Counties & Selected City Health Jurisdictions, 2003-2007 Provisional Data. 3Los Angeles County Sexually Transmitted Disease Program, 2007.Note: Excludes cases from Pasadena and Long Beach.
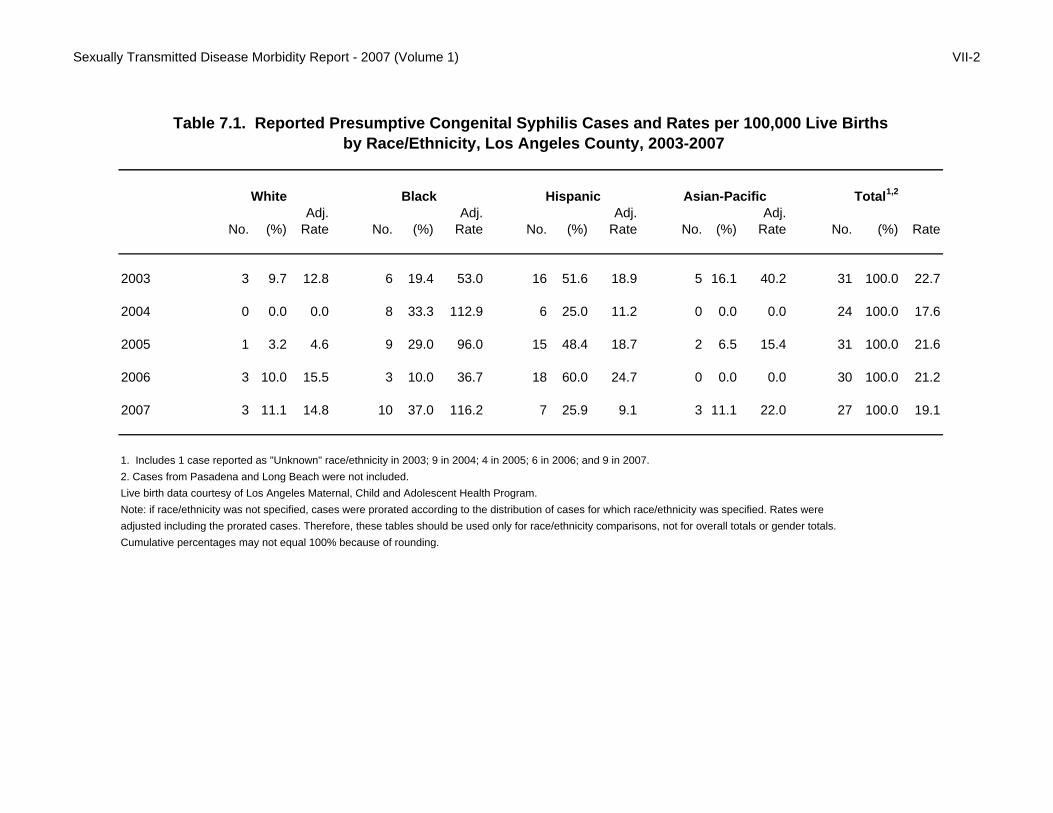
Sexually Transmitted Disease Morbidity Report - 2007 (Volume 1) VII-2
Table 7.1. Reported Presumptive Congenital Syphilis Cases and Rates per 100,000 Live Births by Race/Ethnicity, Los Angeles County, 2003-2007
White Black Hispanic Asian-Pacific Total1,2
Adj. Adj. Adj. Adj.No. (%) Rate No. (%) Rate No. (%) Rate No. (%) Rate No. (%) Rate
2003 3 9.7 12.8 6 19.4 53.0 16 51.6 18.9 5 16.1 40.2 31 100.0 22.7
2004 0 0.0 0.0 8 33.3 112.9 6 25.0 11.2 0 0.0 0.0 24 100.0 17.6
2005 1 3.2 4.6 9 29.0 96.0 15 48.4 18.7 2 6.5 15.4 31 100.0 21.6
2006 3 10.0 15.5 3 10.0 36.7 18 60.0 24.7 0 0.0 0.0 30 100.0 21.2
2007 3 11.1 14.8 10 37.0 116.2 7 25.9 9.1 3 11.1 22.0 27 100.0 19.1
1. Includes 1 case reported as "Unknown" race/ethnicity in 2003; 9 in 2004; 4 in 2005; 6 in 2006; and 9 in 2007.2. Cases from Pasadena and Long Beach were not included.Live birth data courtesy of Los Angeles Maternal, Child and Adolescent Health Program. Note: if race/ethnicity was not specified, cases were prorated according to the distribution of cases for which race/ethnicity was specified. Rates wereadjusted including the prorated cases. Therefore, these tables should be used only for race/ethnicity comparisons, not for overall totals or gender totals.Cumulative percentages may not equal 100% because of rounding.

Sexually Transmitted Disease Morbidity Report - 2007 (Volume 1) VII-3
Table 7.2. Reported Presumptive Congenital Syphilis Cases and Rates per 100,000 Live Births by Service Planning Area (SPA)1 and Health District (HD), Los Angeles County, 2003-2007
2003 2004 2005 2006 2007No. (%) Rate No. (%) Rate No. (%) Rate No. (%) Rate No. (%) Rate
SPA2/HD3
Antelope Valley (1) 1 3.2 18.1 0 0.0 0.0 0 0.0 0.0 1 3.3 16.3 0 0.0 0.0 Antelope Valley 1 3.2 18.1 0 0.0 0.0 0 0.0 0.0 1 3.3 16.3 0 0.0 0.0
East (7) 4 12.9 17.7 1 4.2 4.5 5 16.1 22.0 3 10.0 14.1 0 0.0 0.0 Bellflower 1 3.2 17.8 1 4.2 17.9 0 0.0 0.0 1 3.3 20.0 0 0.0 0.0 East Los Angeles 0 0.0 0.0 0 0.0 0.0 1 3.2 23.9 0 0.0 0.0 0 0.0 0.0 San Antonio 3 9.7 35.7 0 0.0 0.0 3 9.7 35.0 2 6.7 25.4 0 0.0 0.0 Whittier 0 0.0 0.0 0 0.0 0.0 1 3.2 21.2 0 0.0 0.0 0 0.0 0.0
Metro (4) 11 35.5 69.7 3 12.5 19.6 11 35.5 61.7 6 20.0 35.8 7 25.93 60.3 Central 2 6.5 42.6 2 8.3 44.3 6 19.4 108.5 3 10.0 88.7 3 11.11 74.7 Hollywood-Wilshire 5 16.1 86.3 1 4.2 17.9 3 9.7 45.9 1 3.3 13.2 0 0.0 0.0 Northeast 4 12.9 75.6 0 0.0 0.0 2 6.5 34.7 2 6.7 34.2 4 14.81 74.7
San Fernando (2) 2 6.5 6.9 5 20.8 17.3 1 3.2 3.4 4 13.3 13.6 6 22.22 21.2 East Valley 1 3.2 15.3 0 0.0 0.0 1 3.2 14.4 1 3.3 15.3 2 7.407 30.9 Glendale 0 0.0 0.0 0 0.0 0.0 0 0.0 0.0 0 0.0 0.0 0 0.0 0.0 San Fernando 0 0.0 0.0 1 4.2 15.8 0 0.0 0.0 1 3.3 14.1 1 3.704 16.2 West Valley 1 3.2 8.1 4 16.7 32.4 0 0.0 0.0 2 6.7 16.3 3 11.11 24.5
San Gabriel (3) 2 6.5 8.4 0 0.0 0.0 1 3.2 4.1 3 10.0 12.8 1 3.704 4.5 Alhambra 1 3.2 25.1 0 0.0 0.0 1 3.2 23.5 1 3.3 24.4 0 0.0 0.0 El Monte 0 0.0 0.0 0 0.0 0.0 0 0.0 0.0 0 0.0 0.0 1 3.704 13.6 Foothill 0 0.0 0.0 0 0.0 0.0 0 0.0 0.0 0 0.0 0.0 0 0.0 0.0 Pomona 1 3.2 12.5 0 0.0 0.0 0 0.0 0.0 2 6.7 25.6 0 0.0 0.0
South (6) 8 25.8 42.0 11 45.8 57.9 11 35.5 52.2 9 30.0 39.9 11 40.74 51.7 Compton 2 6.5 35.2 1 4.2 17.6 1 3.2 16.1 3 10.0 43.8 1 3.704 15.9 South 3 9.7 80.2 6 25.0 159.9 5 16.1 120.8 2 6.7 35.8 3 11.11 63.7 Southeast 3 9.7 81.5 1 4.2 27.4 1 3.2 23.1 3 10.0 73.0 2 7.407 49.4 Southwest 0 0.0 0.0 3 12.5 50.8 4 12.9 62.8 1 3.3 16.6 5 18.52 80.2
South Bay (8) 1 3.2 6.4 3 12.5 19.5 2 6.5 12.4 3 10.0 20.4 2 7.407 14.5 Harbor 1 3.2 34.2 1 4.2 34.4 0 0.0 0.0 0 0.0 0.0 0 0.0 0.0 Inglewood 0 0.0 0.0 1 4.2 14.1 2 6.5 27.3 3 10.0 47.1 1 3.704 16.4 Torrance 0 0.0 0.0 1 4.2 18.6 0 0.0 0.0 0 0.0 0.0 1 3.704 19.1 West (5) 0 0.0 0.0 0 0.0 0.0 0 0.0 0.0 0 0.0 0.0 0 0.0 0.0 West 0 0.0 0.0 0 0.0 0.0 0 0.0 0.0 0 0.0 0.0 0 0.0 0.0
Unknown4 2 6.5 . 1 4.2 . 0 0.0 . 1 3.3 . 0 0.0 .
Total 31 22.7 24 17.6 31 21.6 30 21.2 27 20.9
1. Excludes cases from Pasadena (SPA 3) and Long Beach (SPA 8).2. Main categories.3. Subcategories.4. Corresponds to cases of unknown HD but not necessarily unknown SPA.Live birth data courtesy of Los Angeles Maternal, Child and Adolescent Health Program.Note: Cumulative percentages may not equal 100% because of rounding.

Sexually Transmitted Disease Morbidity Report, 2007
Section VIII: All Pelvic Inflammatory Disease

Sexually Transmitted Disease Morbidity Report - 2007 (Volume 1) VIII-1
Table 8.1. Reported All Pelvic Inflammatory Disease (PID)1
Cases and Rates per 100,000 Female Population by Age Group, Los Angeles County, 2003-2007
2003 2004 2005 2006 2007No. (%) Rate No. (%) Rate No. (%) Rate No. (%) Rate No. (%) Rate
FEMALE
0-14 4 1.4 0.4 4 1.4 0.4 3 0.9 0.3 2 0.7 0.2 2 0.9 0.2
15-19 67 24.3 18.9 89 30.6 24.2 95 29.5 25.8 86 28.1 24.7 80 34.6 22.2
20-24 83 30.1 25.3 81 27.8 24.3 105 32.6 31.5 97 31.7 29.3 54 23.4 15.8
25-29 53 19.2 15.8 45 15.5 13.9 54 16.8 16.6 48 15.7 14.8 34 14.7 10.5
30-34 28 10.1 7.6 26 8.9 7.2 37 11.5 10.3 28 9.2 7.7 23 10.0 6.6
35-44 29 10.5 4.1 31 10.7 4.4 17 5.3 2.4 34 11.1 4.6 25 10.8 3.4
45-54 7 2.5 1.2 12 4.1 2.0 7 2.2 1.1 8 2.6 1.2 13 5.6 1.9
55-64 0 0.0 0.0 0 0.0 0.0 1 0.3 0.2 1 0.3 0.2 0 0.0 0.0
65+ 0 0.0 0.0 0 0.0 0.0 0 0.0 0.0 0 0.0 0.0 0 0.0 0.0
Unknown 5 1.8 . 3 1.0 . 3 0.9 . 2 0.7 . 0 0.0 .
Total 276 5.8 291 6.1 322 6.7 306 6.3 231 4.7
1. Includes chlamydial PID, gonococcal PID, and non-chlamydial/non-gonococcal PID.Note: Cumulative percentages may not equal 100% because of rounding. Excludes cases from Pasadena and Long Beach.

Sexually Transmitted Disease Morbidity Report - 2007 (Volume 1) VIII-2
0.2
22.2
15.8
10.5
6.6
3.4
1.9
0.0 0.00
5
10
15
20
25
0-14 15-19 20-24 25-29 30-34 35-44 45-54 55-64 65+
Age Group
Rat
e pe
r 100
,000
pop
ulat
ion
Figure 8.1. Reported All PID Rates per 100,000 Female Population in Los Angeles County, by Age Group, 2007
Note: Excludes cases in Long Beach and Pasadena
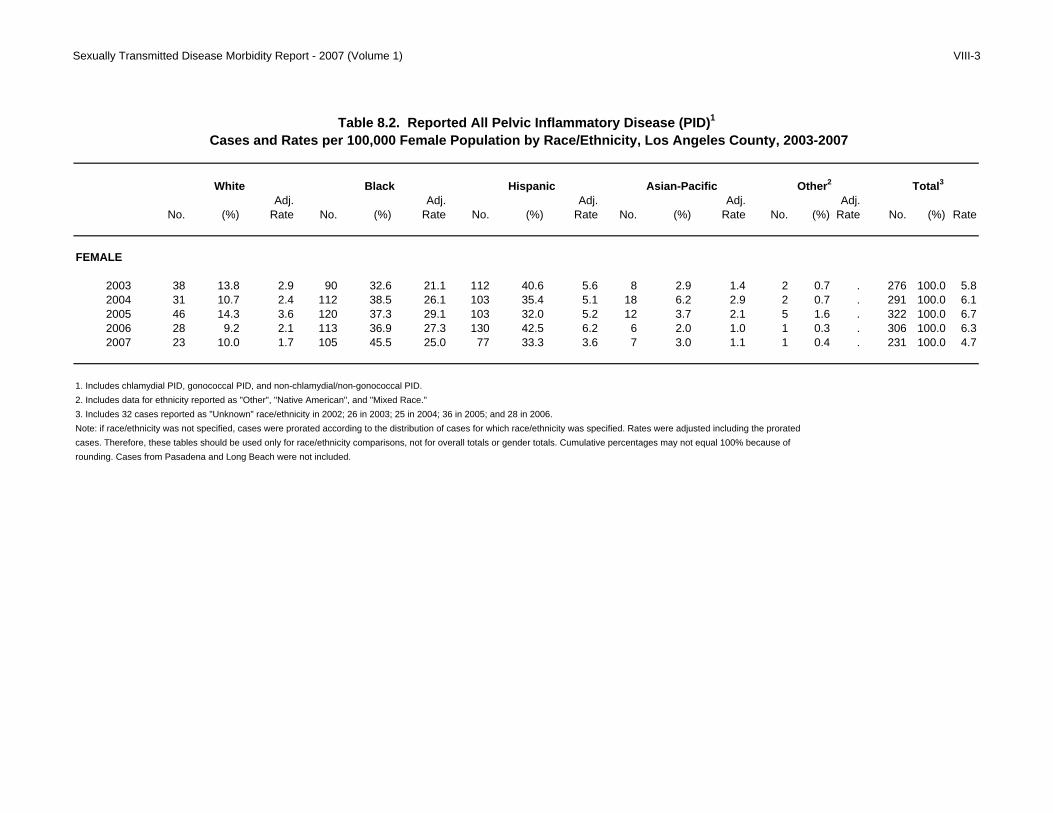
Sexually Transmitted Disease Morbidity Report - 2007 (Volume 1) VIII-3
Table 8.2. Reported All Pelvic Inflammatory Disease (PID)1
Cases and Rates per 100,000 Female Population by Race/Ethnicity, Los Angeles County, 2003-2007
White Black Hispanic Asian-Pacific Other2 Total3
Adj. Adj. Adj. Adj. Adj.No. (%) Rate No. (%) Rate No. (%) Rate No. (%) Rate No. (%) Rate No. (%) Rate
FEMALE
2003 38 13.8 2.9 90 32.6 21.1 112 40.6 5.6 8 2.9 1.4 2 0.7 . 276 100.0 5.82004 31 10.7 2.4 112 38.5 26.1 103 35.4 5.1 18 6.2 2.9 2 0.7 . 291 100.0 6.12005 46 14.3 3.6 120 37.3 29.1 103 32.0 5.2 12 3.7 2.1 5 1.6 . 322 100.0 6.72006 28 9.2 2.1 113 36.9 27.3 130 42.5 6.2 6 2.0 1.0 1 0.3 . 306 100.0 6.32007 23 10.0 1.7 105 45.5 25.0 77 33.3 3.6 7 3.0 1.1 1 0.4 . 231 100.0 4.7
1. Includes chlamydial PID, gonococcal PID, and non-chlamydial/non-gonococcal PID.2. Includes data for ethnicity reported as "Other", "Native American", and "Mixed Race."3. Includes 32 cases reported as "Unknown" race/ethnicity in 2002; 26 in 2003; 25 in 2004; 36 in 2005; and 28 in 2006.Note: if race/ethnicity was not specified, cases were prorated according to the distribution of cases for which race/ethnicity was specified. Rates were adjusted including the proratedcases. Therefore, these tables should be used only for race/ethnicity comparisons, not for overall totals or gender totals. Cumulative percentages may not equal 100% because of rounding. Cases from Pasadena and Long Beach were not included.

Sexually Transmitted Disease Morbidity Report - 2007 (Volume 1) VIII-4
1.7
25.0
3.6
1.1
0
5
10
15
20
25
30
White Black Hispanic Asian-Pacific
Rat
e pe
r 100
,000
pop
ulat
ion
Figure 8.2. Reported All PID Rates per 100,000 Female Population in Los Angeles County, by Race/Ethnicity, 2007
Note: Adjusted for unknown race. Excludes cases in Long Beach and Pasadena

Sexually Transmitted Disease Morbidity Report - 2007 (Volume 1) VIII-5
Table 8.3. Reported All Pelvic Inflammatory Disease (PID)1 Cases and Rates per 100,000 Female Population by Service Planning Area (SPA)2 and Health District (HD),
Los Angeles County, 2003-2007
2003 2004 2005 2006 2007No. (%) Rate No. (%) Rate No. (%) Rate No. (%) Rate No. (%) Rate
SPA3/HD4
Antelope Valley (1) 14 5.1 8.3 22 7.6 12.8 24 7.5 14.0 21 6.9 12.1 12 5.2 6.7 Antelope Valley 14 5.1 8.3 22 7.6 12.8 24 7.5 14.0 21 6.9 12.1 12 5.2 6.7
East (7) 32 11.6 4.7 10 3.4 1.4 24 7.5 3.5 22 7.2 3.2 16 6.9 2.3 Bellflower 9 3.3 4.8 4 1.4 2.1 8 2.5 4.2 3 1.0 1.6 3 1.3 1.6 East Los Angeles 8 2.9 7.4 1 0.3 0.9 1 0.3 0.9 7 2.3 6.2 3 1.3 2.7 San Antonio 10 3.6 4.4 2 0.7 0.9 7 2.2 3.1 8 2.6 3.5 7 3.0 3.1 Whittier 5 1.8 3.0 3 1.0 1.8 8 2.5 4.8 4 1.3 2.4 3 1.3 1.8
Metro (4) 34 12.3 5.9 58 19.9 10.0 28 8.7 4.6 29 9.5 4.7 24 10.4 3.9 Central 10 3.6 6.2 29 10.0 18.0 10 3.1 5.7 11 3.6 6.3 6 2.6 3.5 Hollywood-Wilshire 18 6.5 7.0 19 6.5 7.4 11 3.4 4.2 12 3.9 4.5 6 2.6 2.3 Northeast 6 2.2 3.7 10 3.4 6.2 7 2.2 4.2 6 2.0 3.4 12 5.2 6.8
San Fernando (2) 57 20.7 5.4 48 16.5 4.5 69 21.4 6.4 59 19.3 5.5 47 20.3 4.3 East Valley 9 3.3 4.0 11 3.8 4.9 14 4.3 6.3 20 6.5 8.8 7 3.0 3.1 Glendale 15 5.4 8.2 7 2.4 3.8 9 2.8 4.9 6 2.0 3.3 2 0.9 1.1 San Fernando 13 4.7 6.0 11 3.8 5.0 20 6.2 8.5 14 4.6 6.1 25 10.8 10.9 West Valley 20 7.2 4.5 19 6.5 4.2 26 8.1 6.0 19 6.2 4.3 13 5.6 2.9
San Gabriel (3) 27 9.8 3.1 22 7.6 2.5 24 7.5 2.8 19 6.2 2.2 16 6.9 1.8 Alhambra 2 0.7 1.1 3 1.0 1.6 1 0.3 0.5 1 0.3 0.5 5 2.2 2.7 El Monte 6 2.2 2.6 9 3.1 3.9 7 2.2 3.0 2 0.7 0.8 4 1.7 1.7 Foothill 7 2.5 4.4 6 2.1 3.7 7 2.2 4.4 5 1.6 3.1 5 2.2 3.1 Pomona 12 4.3 4.2 4 1.4 1.4 9 2.8 3.1 11 3.6 3.8 2 0.9 0.7
South (6) 62 22.5 12.0 64 22.0 12.3 93 28.9 17.5 95 31.0 17.8 71 30.7 13.3 Compton 11 4.0 7.6 20 6.9 13.7 27 8.4 18.6 16 5.2 10.8 21 9.1 14.2 South 13 4.7 14.3 11 3.8 12.0 14 4.3 15.1 17 5.6 17.7 16 6.9 16.7 Southeast 6 2.2 7.3 5 1.7 6.1 10 3.1 12.0 13 4.2 14.7 11 4.8 12.5 Southwest 32 11.6 16.1 28 9.6 14.0 42 13.0 20.1 49 16.0 24.4 23 10.0 11.4
South Bay (8) 27 9.8 4.8 38 13.1 6.8 39 12.1 6.9 49 16.0 8.6 30 13.0 5.3 Harbor 3 1.1 2.9 1 0.3 1.0 3 0.9 2.9 6 2.0 5.7 8 3.5 7.5 Inglewood 19 6.9 8.6 26 8.9 11.6 23 7.1 10.4 31 10.1 13.8 17 7.4 7.6 Torrance 5 1.8 2.1 11 3.8 4.7 13 4.0 5.5 12 3.9 5.1 5 2.2 2.1 West (5) 20 7.2 6.0 21 7.2 6.3 17 5.3 5.1 10 3.3 3.0 9 3.9 2.7 West 20 7.2 6.0 21 7.2 6.3 17 5.3 5.1 10 3.3 3.0 9 3.9 2.7
Unknown 3 1.1 . 8 2.7 . 4 1.2 . 2 0.7 . 6 2.6 .
Total 276 5.8 291 6.1 322 6.7 306 6.3 231 4.7
1. Includes chlamydial PID, gonococcal PID, and non-chlamydial/non-gonococcal PID.2. Excludes cases from Pasadena (SPA 3) and Long Beach (SPA 8).3. Main categories.4. Subcategories.Note: Cumulative percentages may not equal 100% because of rounding.

Sexually Transmitted Disease Morbidity Report - 2007 (Volume I) VIII - 6
0 8 164 Miles
Figure 8.3. Reported All Pelvic Inflammatory Disease (PID) Rates per 100,000 Population by Service Planning Area (SPA), Los Angeles County, 2007.
Excludes cases from Pasadena (SPA 3) and Long Beach (SPA 8).
Antelope Valley (SPA 1)6.7
East (SPA 7)2.3
Metro (SPA 4)3.9
San Fernando (SPA 2)4.3
San Gabriel (SPA 3)1.8
South (SPA 6)13.3
South Bay (SPA 8)5.3
West (SPA 5)2.7
Sexually Transmitted Disease Morbidity Report, 2007
Section IX: Technical Notes and Appendices

Sexually Transmitted Disease Morbidity Report – 2007 (Volume 1) IX-1
TECHNICAL NOTES Data Sources: Data on sexually transmitted disease (STD) in LAC are obtained through passive and active surveillance, and stored in CaseWatch, a case management and surveillance system. California law requires that positive laboratory results of STDs and clinically identified suspected cases be reported to local health departments. Suspected and confirmed STD cases are reported confidentially to the California Department of Health Services and the Centers for Disease Control and Prevention (CDC) as required by California Code of Regulations (Section 2500 and Section 2505).
1. The STD case definitions are based on the CDC Sexually Transmitted Disease Surveillance 2006 at: http://www.cdc.gov/std/stats/app-casedef.htm.
2. Passive surveillance relies on physicians, laboratories, and other healthcare providers to report STDs to the Department of Public Health (DPH) by submitting the Confidential Morbidity Report (CMR) form by telephone, fax, or online.
3. Active surveillance entails STD staff regularly contacting hospitals, laboratories, physicians, and other health providers in an effort to identify all cases of a given STD. In addition, STD staff contact schools, hospitals, jails, student health centers, and sentinel physicians and clinics to collect reports of STDs.
4. CaseWatch is an open system for ongoing data collection and updating. With a base of live data, the results of this report are snapshots of the CaseWatch System for July 2008, the time the report was prepared. Therefore, the impact of reporting updates must be considered.
5. The population data is prepared by Walter R. McDonald & Associates, Inc. (WRMA) for Urban Research, Los Angeles County Chief Administration Office and released in July 2008 by the Office of Health Assessment and Epidemiology, Los Angeles County Department of Public Health. The new birth population data is from the Maternal, Child and Adolescent Health Program, Los Angeles County Department of Public Health.
Data Codes: The table below lists the SAS codes for the CaseWatch data that were used to define each STD and related demographics in this report:
Subject SAS Code Interpretation Diagnosis Year (DYEAR) If DYEAR in
(2003, 2004, 2005, 2006, 2007)
Years based on CDC calendar.
Chlamydia All Sub-datasets from ‘CT2003’ to ‘CT2007’. Gonorrhea All Sub-datasets from ‘GC2003’ to ‘GC2007’. Syphilis (Primary and Secondary)
If DIAGNOS in (2, 3, 56*3, 3*56)
Sub-datasets from ‘SY2003’ to ‘SY2007’: 2=”Primary (421)”; 3=”Secondary (422)”; 56=”Neurosyphilis (770)”.
Syphilis (Early Latent)
If DIAGNOS in (4, 56*4, 4*56)
Sub-datasets from ‘SY2003’ to ‘SY2007’: 4=”Early Latent (423)”; 56=”Neurosyphilis (770)”.
Syphilis (Late and Late Latent)
If DIAGNOS in (1, 6, 14, 16, 17, 55, 56*6, 6*56, 55*56, 56*55)
Sub-datasets from ‘SY2003’ to ‘SY2007’: 1=”Type Not Specified”; 6=”Late Latent (424)”; 14=”Neurosyphilis-Late Sympotomatic (426)”; 16=”Benign Late Symptomatic (427)”; 17=”Other-Late Symptomatic (427)”; 55=”Latent Unknown Duration (488)”;

Sexually Transmitted Disease Morbidity Report – 2007 (Volume 1) IX-2
56=”Neurosyphilis (770)”. Congenital Syphilis If DIAGNOS in
(10) Sub-datasets from ‘SY2003’ to ‘SY2007’: 10=”Congenital-Presumptive (436)”;
Pelvic Inflammatory Disease (PID, including Chlamydial, Non-Chlamydial, Gonococcal and NonGonococcal.)
If DIAGNOS in (30, 38); Plus all from sub-datasets PID2003 to PID2007
Sub-datasets from ‘CT2003’ to ‘CT2007’: 30=”Chlamydial PID”; Sub-datasets from ‘GC2003’ to ‘GC2007’: 38=”Gonococcal PID”; Sub-datasets from PID2003 to PID2007.
Incident of EPI Treated (MORB)
If MORB='N' Then delete;
All datasets: Excluding those CT and GC cases with EPI treated.
Age Group (AGENUM) If AGENUM in (missing, 0, 1, 2, ….)
All datasets: 0<=AGENUM<=14 means ”0-14 years old”; 15<=AGENUM<=19 means ”15-19 years old”; 20<=AGENUM<=24 means ”20-24 years old”; 25<=AGENUM<=29 means ”25-29 years old”; 30<=AGENUM<=34 means ”30-34 years old”; 35<=AGENUM<=44 means ”35-44 years old”; 45<=AGENUM<=54 means ”45-54 years old”; 55<=AGENUM<=64 means ”55-64 years old”; 65<=AGENUM<=115 means ”65+ years old”; 116<=AGENUM, missing means ”Unknown”.
Gender (CWSEX) If CWSEX in (1, 2, 7, 9)
All datasets: 1, 9=”Male”; 2, 7=”Female”.
Race/Ethnicity (ETHNIC) If ETHNIC in (1, 2, 3, 4, 5, 6, 7, 8, 9)
All datasets: 1=”White”; 2=”Black” ; 7=”Hispanic”; 3, 8=”Asian/Pacific Islander”; 4, 5, 9=”Other”; 6=”Unknown”.
Service Planning Area (SPA)
If SPA in (1, 2, 3, 4, 5, 6, 7, 8, 9)
All datasets: 1=”Antelope Valley”; 2=”San Fernando Valley”; 3=”San Gabriel”; 4=”Metro”; 5=”West”; 6=”South”; 7=”East”; 8=”South Bay”; 9=”Unknown”.
Health District (RES) If RES in (‘016’,’025’) then delete;
All datasets: Excluding Long Beach and Pasadena. '000' ='Antelope Valley'; '001'='Alhambra'; '002' ='Central'; '003' ='East LA'; '004' ='El Monte'; '005' ='Foothill'; '006' ='Northeast'; '007' ='Pomona'; '008' ='Whittier';
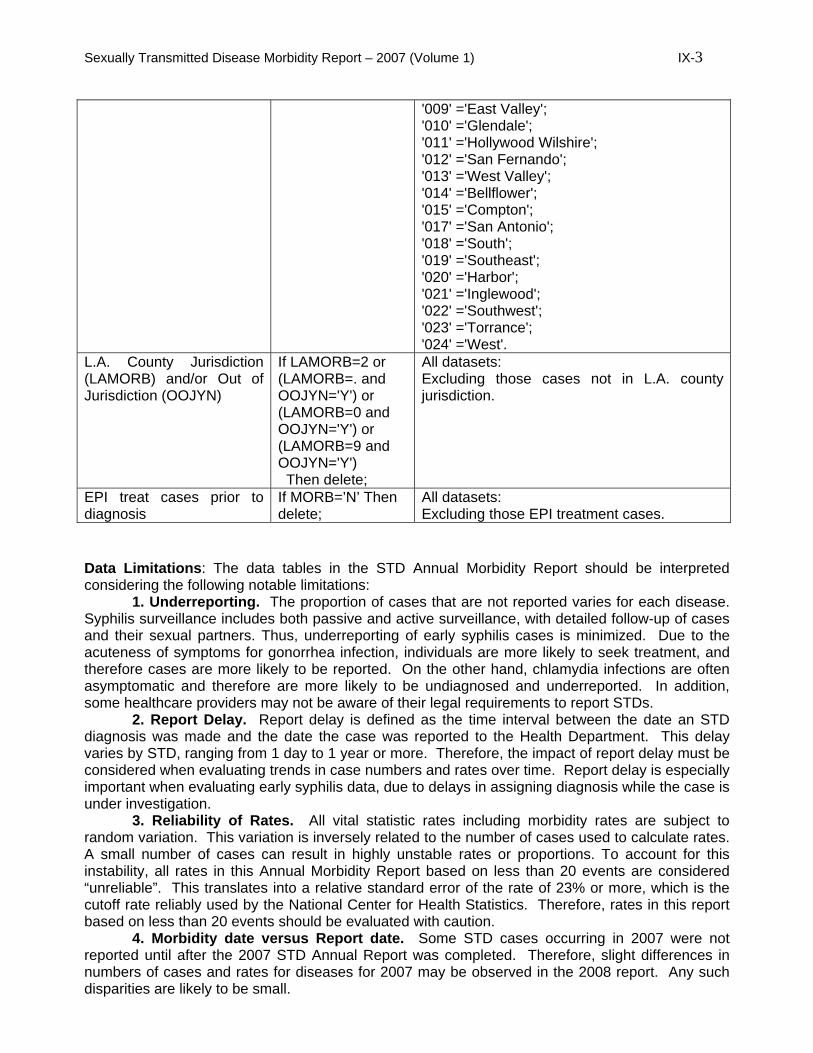
Sexually Transmitted Disease Morbidity Report – 2007 (Volume 1) IX-3
'009' ='East Valley'; '010' ='Glendale'; '011' ='Hollywood Wilshire'; '012' ='San Fernando'; '013' ='West Valley'; '014' ='Bellflower'; '015' ='Compton'; '017' ='San Antonio'; '018' ='South'; '019' ='Southeast'; '020' ='Harbor'; '021' ='Inglewood'; '022' ='Southwest'; '023' ='Torrance'; '024' ='West'.
L.A. County Jurisdiction (LAMORB) and/or Out of Jurisdiction (OOJYN)
If LAMORB=2 or (LAMORB=. and OOJYN='Y') or (LAMORB=0 and OOJYN='Y') or (LAMORB=9 and OOJYN='Y') Then delete;
All datasets: Excluding those cases not in L.A. county jurisdiction.
EPI treat cases prior to diagnosis
If MORB=’N’ Then delete;
All datasets: Excluding those EPI treatment cases.
Data Limitations: The data tables in the STD Annual Morbidity Report should be interpreted considering the following notable limitations: 1. Underreporting. The proportion of cases that are not reported varies for each disease. Syphilis surveillance includes both passive and active surveillance, with detailed follow-up of cases and their sexual partners. Thus, underreporting of early syphilis cases is minimized. Due to the acuteness of symptoms for gonorrhea infection, individuals are more likely to seek treatment, and therefore cases are more likely to be reported. On the other hand, chlamydia infections are often asymptomatic and therefore are more likely to be undiagnosed and underreported. In addition, some healthcare providers may not be aware of their legal requirements to report STDs. 2. Report Delay. Report delay is defined as the time interval between the date an STD diagnosis was made and the date the case was reported to the Health Department. This delay varies by STD, ranging from 1 day to 1 year or more. Therefore, the impact of report delay must be considered when evaluating trends in case numbers and rates over time. Report delay is especially important when evaluating early syphilis data, due to delays in assigning diagnosis while the case is under investigation. 3. Reliability of Rates. All vital statistic rates including morbidity rates are subject to random variation. This variation is inversely related to the number of cases used to calculate rates. A small number of cases can result in highly unstable rates or proportions. To account for this instability, all rates in this Annual Morbidity Report based on less than 20 events are considered “unreliable”. This translates into a relative standard error of the rate of 23% or more, which is the cutoff rate reliably used by the National Center for Health Statistics. Therefore, rates in this report based on less than 20 events should be evaluated with caution. 4. Morbidity date versus Report date. Some STD cases occurring in 2007 were not reported until after the 2007 STD Annual Report was completed. Therefore, slight differences in numbers of cases and rates for diseases for 2007 may be observed in the 2008 report. Any such disparities are likely to be small.

Sexually Transmitted Disease Morbidity Report – 2007 (Volume 1) IX-4 Though not accounted for in census data, visitors and other non-residents may have an effect on STD disease occurrence. 5. Place of acquisition of infection. Some cases of STDs reported in this Annual Morbidity Report may have been acquired outside the county. Therefore, most disease rates more accurately reflect the place of diagnosis than the location where an infection was acquired. However, every effort is made in early syphilis cases to determine where the infection actually occurred, in order to more effectively investigate and control the spread of disease. Early syphilis cases determined to have been acquired outside LAC jurisdiction are not included in this report. 6. Jurisdiction. This report does not include cases identified by Long Beach or Pasadena Health Departments. Cases from these jurisdictions are reported directly to the California Department of Health Services and to the CDC. Rates:
Rate per 100,000 population = (# of cases / population) x 100,000 1. Adjusted Rate. Rates appearing in the race/ethnicity related tables were adjusted for the unknown race/ethnicity. If race/ethnicity was not specified, cases were prorated according to the distribution of cases for which race/ethnicity was specified. Rates were adjusted including the prorated cases.

Sexually Transmitted Disease Morbidity Report – 2007 (Volume 1) IX-5
APPENDIX A: WHERE TO REPORT COMMUNICABLE DISEASES IN LOS ANGELES COUNTY
LABORATORY SLIP
CLINICIAN’S CMR
SEND REPORTS TO:
Syphilis Chlamydia Gonorrhea
Syphilis Chlamydia Gonorrhea Chancroid Pelvic Inflammatory Disease
Sexually Transmitted Disease Program 2615 S. Grand Avenue, Rm. 450 Los Angeles, CA 90007 Telephone: 213-744-3070 Fax: 213-749-9602
AIDS HIV (As of July 1, 2002)
AIDS HIV (As of July 1, 2002)
HIV Epidemiology Program 600 S. Commonwealth Ave., Suite 805 Los Angeles, CA 90005 Telephone: 213-351-8516 Fax: 213-467-4683 http://lapublichealth.org/hiv/hivreporting.htm
Tuberculosis
Tuberculosis
Tuberculosis Control 2615 S. Grand Avenue, Rm. 507 Los Angeles, CA 90007 Telephone: 213-744-6271 Fax: 213-749-0926
Cryptosporidiosis Diphtheria Encephalitis arboviral E. coli O157:H7 Hepatitis A, acute Hepatitis B, acute Listeriosis Malaria Measles (Rubeola) Plague Rabies Typhoid Vibrio Species
List of reportable diseases: http://lapublichealth.org/acd/cdrs.htm
Acute Communicable Diseases Morbidity Unit 313 N. Figueroa St., Rm. 117 Los Angeles, CA 90012 Telephone: 213-240-7821 Call toll free: 888-397-3993 Fax toll free: 888-397-3778
REQUIRED INFORMATION ON THE CMR:
Patient Information: Name, gender, ethnic group, date of birth, occupation, address,
telephone number, social security number.
Diagnosis: Diagnosis, date of diagnosis, date of onset.
Reporting Person: Name, address, telephone number.
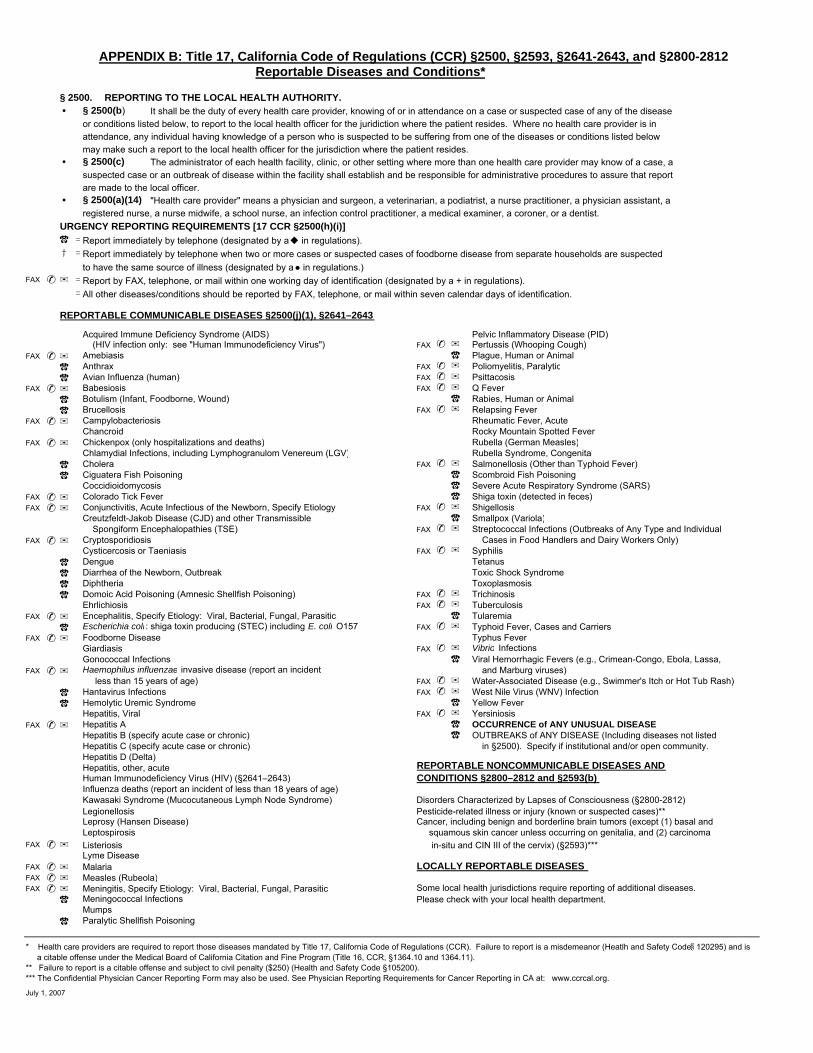
APPENDIX B: Title 17, California Code of Regulations (CCR) §2500, §2593, §2641-2643, and §2800-2812Reportable Diseases and Conditions*
§ 2500. REPORTING TO THE LOCAL HEALTH AUTHORITY.● § 2500(b) It shall be the duty of every health care provider, knowing of or in attendance on a case or suspected case of any of the disease
or conditions listed below, to report to the local health officer for the juridiction where the patient resides. Where no health care provider is in attendance, any individual having knowledge of a person who is suspected to be suffering from one of the diseases or conditions listed below may make such a report to the local health officer for the jurisdiction where the patient resides.
● § 2500(c) The administrator of each health facility, clinic, or other setting where more than one health care provider may know of a case, asuspected case or an outbreak of disease within the facility shall establish and be responsible for administrative procedures to assure that reportare made to the local officer.
● § 2500(a)(14) "Health care provider" means a physician and surgeon, a veterinarian, a podiatrist, a nurse practitioner, a physician assistant, aregistered nurse, a nurse midwife, a school nurse, an infection control practitioner, a medical examiner, a coroner, or a dentist.
URGENCY REPORTING REQUIREMENTS [17 CCR §2500(h)(i)]☎ =Report immediately by telephone (designated by a ◆ in regulations). † =Report immediately by telephone when two or more cases or suspected cases of foodborne disease from separate households are suspected
to have the same source of illness (designated by a ● in regulations.)FAX ✆✉ =Report by FAX, telephone, or mail within one working day of identification (designated by a + in regulations).
=All other diseases/conditions should be reported by FAX, telephone, or mail within seven calendar days of identification.
REPORTABLE COMMUNICABLE DISEASES §2500(j)(1), §2641–2643
Acquired Immune Deficiency Syndrome (AIDS) Pelvic Inflammatory Disease (PID) (HIV infection only: see "Human Immunodeficiency Virus") FAX ✆ ✉ Pertussis (Whooping Cough)
FAX ✆✉ Amebiasis ☎ Plague, Human or Animal☎ Anthrax FAX ✆ ✉ Poliomyelitis, Paralytic☎ Avian Influenza (human) FAX ✆ ✉ Psittacosis
FAX ✆✉ Babesiosis FAX ✆ ✉ Q Fever☎ Botulism (Infant, Foodborne, Wound) ☎ Rabies, Human or Animal☎ Brucellosis FAX ✆ ✉ Relapsing Fever
FAX ✆✉ Campylobacteriosis Rheumatic Fever, AcuteChancroid Rocky Mountain Spotted Fever
FAX ✆✉ Chickenpox (only hospitalizations and deaths) Rubella (German Measles)Chlamydial Infections, including Lymphogranulom Venereum (LGV) Rubella Syndrome, Congenital
☎ Cholera FAX ✆ ✉ Salmonellosis (Other than Typhoid Fever)☎ Ciguatera Fish Poisoning ☎ Scombroid Fish Poisoning
Coccidioidomycosis ☎ Severe Acute Respiratory Syndrome (SARS)FAX ✆✉ Colorado Tick Fever ☎ Shiga toxin (detected in feces)FAX ✆✉ Conjunctivitis, Acute Infectious of the Newborn, Specify Etiology FAX ✆ ✉ Shigellosis
Creutzfeldt-Jakob Disease (CJD) and other Transmissible ☎ Smallpox (Variola) Spongiform Encephalopathies (TSE) FAX ✆ ✉ Streptococcal Infections (Outbreaks of Any Type and Individual
FAX ✆✉ Cryptosporidiosis Cases in Food Handlers and Dairy Workers Only)Cysticercosis or Taeniasis FAX ✆ ✉ Syphilis
☎ Dengue Tetanus☎ Diarrhea of the Newborn, Outbreak Toxic Shock Syndrome☎ Diphtheria Toxoplasmosis☎ Domoic Acid Poisoning (Amnesic Shellfish Poisoning) FAX ✆ ✉ Trichinosis
Ehrlichiosis FAX ✆ ✉ Tuberculosis FAX ✆✉ Encephalitis, Specify Etiology: Viral, Bacterial, Fungal, Parasitic ☎ Tularemia
☎ Escherichia coli : shiga toxin producing (STEC) including E. coli O157 FAX ✆ ✉ Typhoid Fever, Cases and Carriers FAX ✆✉ Foodborne Disease Typhus Fever
Giardiasis FAX ✆ ✉ Vibrio InfectionsGonococcal Infections ☎ Viral Hemorrhagic Fevers (e.g., Crimean-Congo, Ebola, Lassa,
FAX ✆✉ Haemophilus influenzae invasive disease (report an incident and Marburg viruses) less than 15 years of age) FAX ✆ ✉ Water-Associated Disease (e.g., Swimmer's Itch or Hot Tub Rash)
☎ Hantavirus Infections FAX ✆ ✉ West Nile Virus (WNV) Infection☎ Hemolytic Uremic Syndrome ☎ Yellow Fever
Hepatitis, Viral FAX ✆ ✉ Yersiniosis FAX ✆✉ Hepatitis A ☎ OCCURRENCE of ANY UNUSUAL DISEASE
Hepatitis B (specify acute case or chronic) ☎ OUTBREAKS of ANY DISEASE (Including diseases not listed Hepatitis C (specify acute case or chronic) in §2500). Specify if institutional and/or open community. Hepatitis D (Delta) Hepatitis, other, acute Human Immunodeficiency Virus (HIV) (§2641–2643)Influenza deaths (report an incident of less than 18 years of age)Kawasaki Syndrome (Mucocutaneous Lymph Node Syndrome) Disorders Characterized by Lapses of Consciousness (§2800-2812)Legionellosis Pesticide-related illness or injury (known or suspected cases)** Leprosy (Hansen Disease) Cancer, including benign and borderline brain tumors (except (1) basal andLeptospirosis squamous skin cancer unless occurring on genitalia, and (2) carcinoma
FAX ✆✉ Listeriosis in-situ and CIN III of the cervix) (§2593)***Lyme Disease
FAX ✆✉ MalariaFAX ✆✉ Measles (Rubeola)FAX ✆✉ Meningitis, Specify Etiology: Viral, Bacterial, Fungal, Parasitic
☎ Meningococcal InfectionsMumps
☎ Paralytic Shellfish Poisoning
* Health care providers are required to report those diseases mandated by Title 17, California Code of Regulations (CCR). Failure to report is a misdemeanor (Heatlh and Safety Code §120295) and is a citable offense under the Medical Board of California Citation and Fine Program (Title 16, CCR, §1364.10 and 1364.11).** Failure to report is a citable offense and subject to civil penalty ($250) (Health and Safety Code §105200).*** The Confidential Physician Cancer Reporting Form may also be used. See Physician Reporting Requirements for Cancer Reporting in CA at: www.ccrcal.org.
REPORTABLE NONCOMMUNICABLE DISEASES AND CONDITIONS §2800–2812 and §2593(b)
LOCALLY REPORTABLE DISEASES
July 1, 2007
Some local health jurisdictions require reporting of additional diseases. Please check with your local health department.