maternal obesity - department of public...
TRANSCRIPT
11/3/2011
1
MATERNAL OBESITY Interconception & Preconception Health Summit
November 1, 2011
Presented by:
Denise C. Gee, MPH, RD
PHFE WIC
The 4 R’s of Maternal Obesity
Rates
Risks
Recommendations
Resources
U.S. Rates
2010 Premature birth report cards
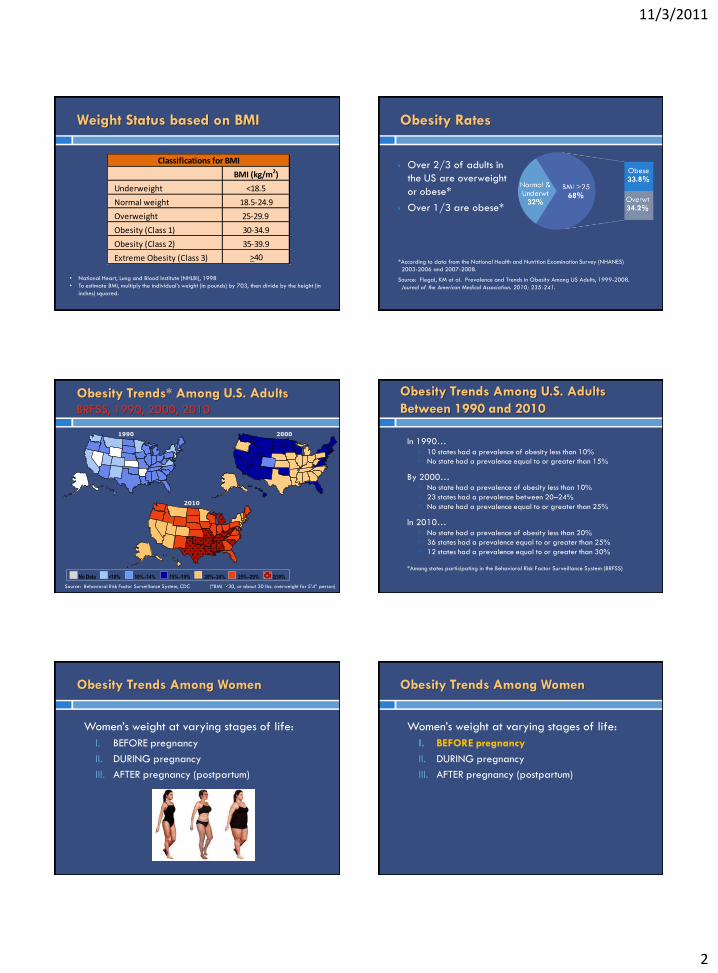
Source: National Center for Health Statistics, 2008 preliminary data.
Nation scores a “D” One in eight babies born in our country is premature.
2010 March of Dimes Prematurity Report Card
Map of Preterm Births
US 12.3%
Obesity Trends* Among U.S. Adults BRFSS, 2010
Obesity
Obesity is the fastest-growing health problem in the US.
Definition of Obesity: excess adipose (fat) tissue
• Can be measured by Body Mass Index (BMI)
• BMI is a reliable, more accurate measure of total body fat compared with body weight alone.
• Body Mass Index (BMI) formula:
A measure of an adult’s weight in relation to his or her height, specifically the adult’s weight in pounds divided by height in inches squared multiplied by 703, or:
BMI = ( Weight in Pounds ) x 703
(Height in inches) x (Height in inches)
11/3/2011
2
Weight Status based on BMI
BMI (kg/m2)
Underweight <18.5
Normal weight 18.5-24.9
Overweight 25-29.9
Obesity (Class 1) 30-34.9
Obesity (Class 2) 35-39.9
Extreme Obesity (Class 3) >40
Classifications for BMI
• National Heart, Lung and Blood Institute (NHLBI), 1998
• To estimate BMI, multiply the individual’s weight (in pounds) by 703, then divide by the height (in
inches) squared.
Obesity Rates
Over 2/3 of adults in
the US are overweight
or obese*
Over 1/3 are obese*
*According to data from the National Health and Nutrition Examination Survey (NHANES)
2003-2006 and 2007-2008.
Source: Flegal, KM et al. Prevalence and Trends in Obesity Among US Adults, 1999-2008.
Journal of the American Medical Association. 2010; 235-241.
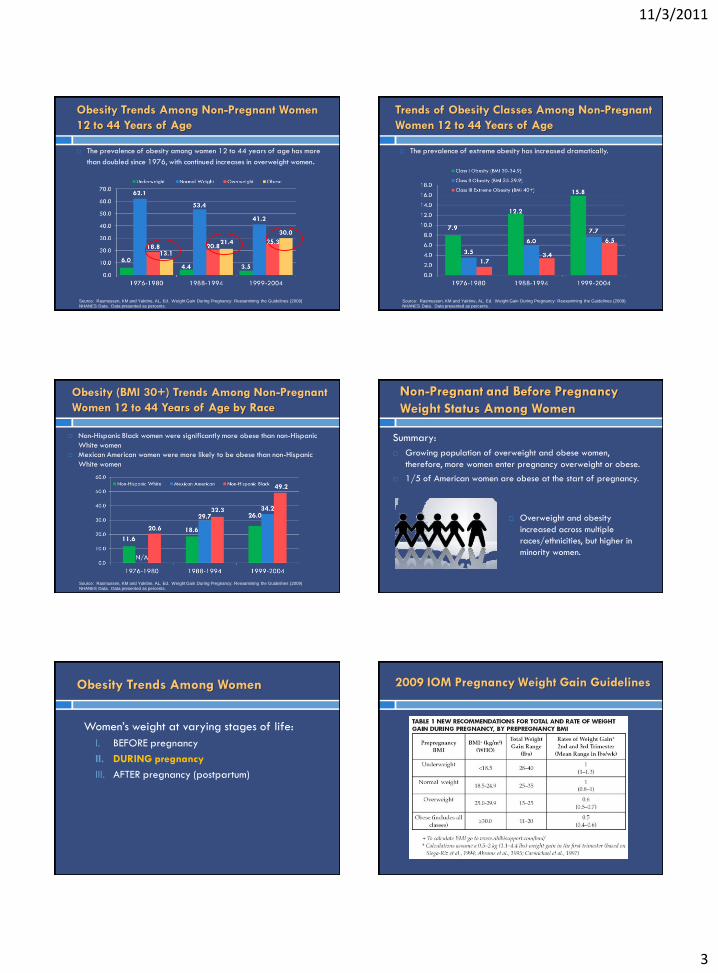
Obesity Trends* Among U.S. Adults
BRFSS, 1990, 2000, 2010
2000
2010
1990
No Data <10% 10%–14% 15%–19% 20%–24% 25%–29% ≥30%
Source: Behavioral Risk Factor Surveillance System, CDC (*BMI 30, or about 30 lbs. overweight for 5’4” person)
Obesity Trends Among U.S. Adults
Between 1990 and 2010
In 1990… 10 states had a prevalence of obesity less than 10%
No state had a prevalence equal to or greater than 15%
By 2000… No state had a prevalence of obesity less than 10%
23 states had a prevalence between 20–24%
No state had a prevalence equal to or greater than 25%
In 2010… No state had a prevalence of obesity less than 20%
36 states had a prevalence equal to or greater than 25%
12 states had a prevalence equal to or greater than 30%
*Among states participating in the Behavioral Risk Factor Surveillance System (BRFSS)
Obesity Trends Among Women
Women’s weight at varying stages of life:
I. BEFORE pregnancy
II. DURING pregnancy
III. AFTER pregnancy (postpartum)
Obesity Trends Among Women
Women’s weight at varying stages of life:
I. BEFORE pregnancy
II. DURING pregnancy
III. AFTER pregnancy (postpartum)
11/3/2011
3
Obesity Trends Among Non-Pregnant Women
12 to 44 Years of Age
The prevalence of obesity among women 12 to 44 years of age has more
than doubled since 1976, with continued increases in overweight women.
Source: Rasmussen, KM and Yaktine, AL, Ed. Weight Gain During Pregnancy: Reexamining the Guidelines (2009)
NHANES Data. Data presented as percents.
Trends of Obesity Classes Among Non-Pregnant
Women 12 to 44 Years of Age
The prevalence of extreme obesity has increased dramatically.
Source: Rasmussen, KM and Yaktine, AL, Ed. Weight Gain During Pregnancy: Reexamining the Guidelines (2009)
NHANES Data. Data presented as percents.
Obesity (BMI 30+) Trends Among Non-Pregnant
Women 12 to 44 Years of Age by Race
Non-Hispanic Black women were significantly more obese than non-Hispanic
White women
Mexican American women were more likely to be obese than non-Hispanic
White women
Source: Rasmussen, KM and Yaktine, AL, Ed. Weight Gain During Pregnancy: Reexamining the Guidelines (2009)
NHANES Data. Data presented as percents.
Non-Pregnant and Before Pregnancy
Weight Status Among Women
Overweight and obesity
increased across multiple
races/ethnicities, but higher in
minority women.
Summary:
Growing population of overweight and obese women,
therefore, more women enter pregnancy overweight or obese.
1/5 of American women are obese at the start of pregnancy.
Obesity Trends Among Women
Women’s weight at varying stages of life:
I. BEFORE pregnancy
II. DURING pregnancy
III. AFTER pregnancy (postpartum)
2009 IOM Pregnancy Weight Gain Guidelines
11/3/2011
4
Gestational Weight Gain (GWG) Patterns (Birth certificate data)
GWG of >40 lbs. increased from 1990 to 2005.
Source: National Center for Health Statistics (NCHS), 2007. Based on Birth Certificate data, 1990-2005.
1990 – n=456,678; 2000 – n=588,253; and 2005 – n=656,363
*Singleton, term deliveries of US women
High GWG (>40 lbs.) by Race/Ethnicity (Birth certificate data)
Source: National Center for Health Statistics (NCHS), 2007. Based on Birth Certificate data, 1990-2005.
1990 – n=456,678; 2000 – n=588,253; and 2005 – n=656,363
By race/ethnicity, Non-Hispanic White women represented the largest
percentage of women with high GWG.
*Singleton, term deliveries of US women
Gestational Weight Gain by Pre-Pregnant BMI (PRAMS data)
*Singleton, term deliveries from 1993-2003; based on 1990 IOM Pregnancy Weight Gain Guidelines
Source: Rasmussen, KM and Yaktine, AL, Ed. Weight Gain During Pregnancy: Reexamining the Guidelines (2009)
PRAMS Data from 8 states. Data presented as percents.
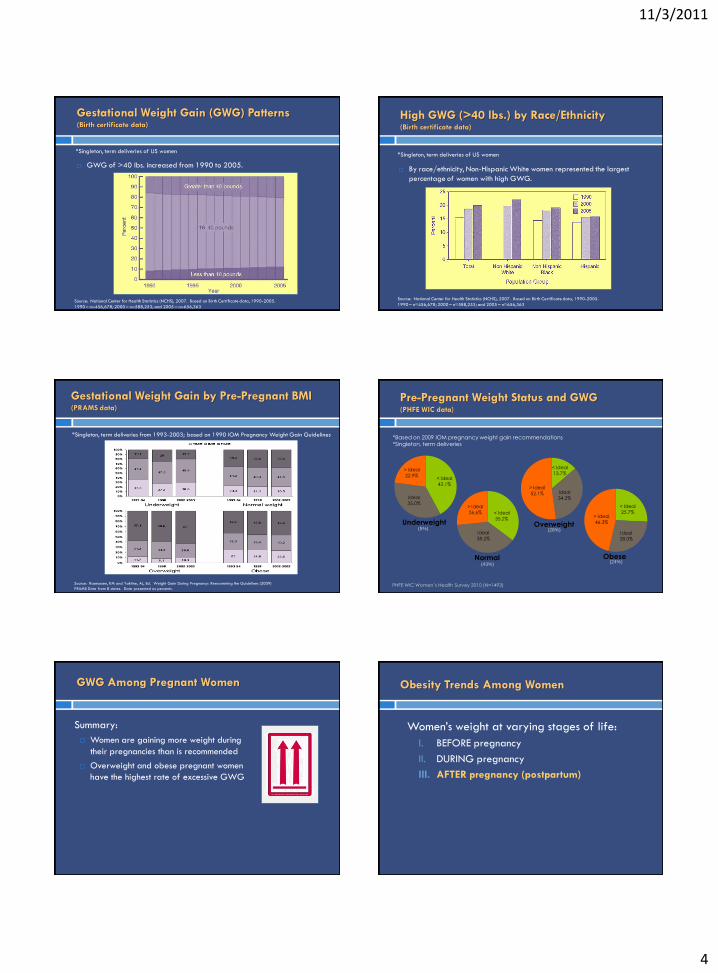
Pre-Pregnant Weight Status and GWG (PHFE WIC data)
PHFE WIC Women’s Health Survey 2010 (N=1493)
< Ideal
42.1%
Ideal
35.0%
> Ideal
22.9%
Underweight
< Ideal
35.2%
Ideal
38.2%
> Ideal
26.6%
Normal
< Ideal
13.7%
Ideal
34.2%
> Ideal
52.1%
Overweight
< Ideal
25.7%
Ideal
28.0%
> Ideal
46.3%
Obese
*Based on 2009 IOM pregnancy weight gain recommendations
*Singleton, term deliveries
(5%)
(43%)
(28%)
(24%)
GWG Among Pregnant Women
Summary:
Women are gaining more weight during
their pregnancies than is recommended
Overweight and obese pregnant women
have the highest rate of excessive GWG
Obesity Trends Among Women
Women’s weight at varying stages of life:
I. BEFORE pregnancy
II. DURING pregnancy
III. AFTER pregnancy (postpartum)
11/3/2011
5
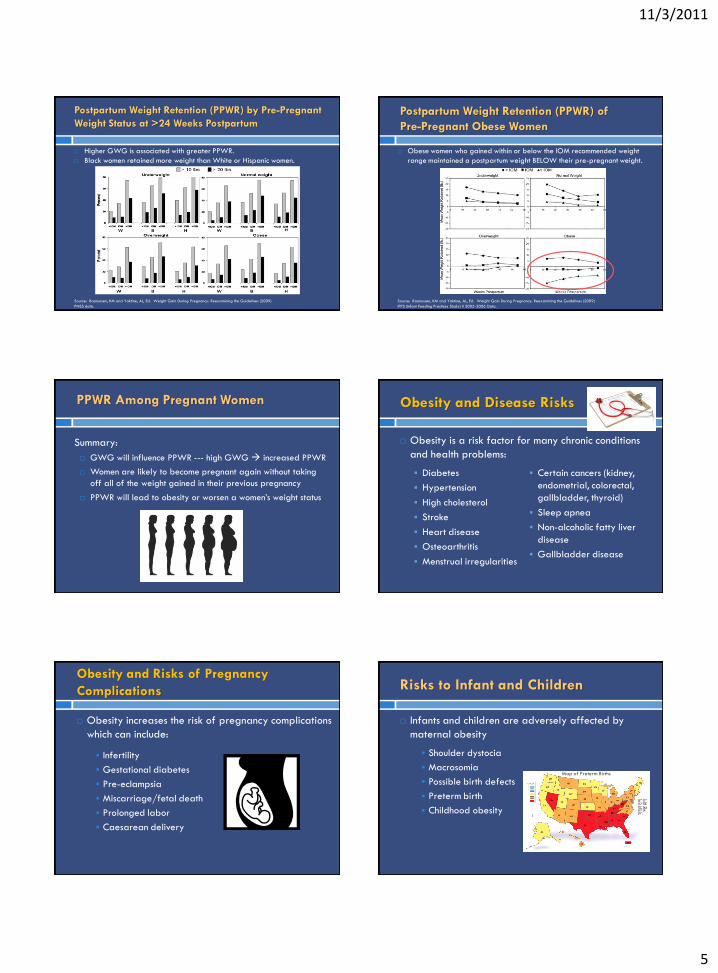
Postpartum Weight Retention (PPWR) by Pre-Pregnant
Weight Status at >24 Weeks Postpartum
Source: Rasmussen, KM and Yaktine, AL, Ed. Weight Gain During Pregnancy: Reexamining the Guidelines (2009)
PNSS data.
Higher GWG is associated with greater PPWR.
Black women retained more weight than White or Hispanic women.
Postpartum Weight Retention (PPWR) of
Pre-Pregnant Obese Women
Source: Rasmussen, KM and Yaktine, AL, Ed. Weight Gain During Pregnancy: Reexamining the Guidelines (2009)
IFPS (Infant Feeding Practices Study) II 2005-2006 Data.
Obese women who gained within or below the IOM recommended weight
range maintained a postpartum weight BELOW their pre-pregnant weight.
PPWR Among Pregnant Women
Summary:
GWG will influence PPWR --- high GWG increased PPWR
Women are likely to become pregnant again without taking
off all of the weight gained in their previous pregnancy
PPWR will lead to obesity or worsen a women’s weight status
Obesity and Disease Risks
Obesity is a risk factor for many chronic conditions
and health problems:
Diabetes
Hypertension
High cholesterol
Stroke
Heart disease
Osteoarthritis
Menstrual irregularities
Certain cancers (kidney,
endometrial, colorectal,
gallbladder, thyroid)
Sleep apnea
Non-alcoholic fatty liver
disease
Gallbladder disease
Obesity and Risks of Pregnancy
Complications
Obesity increases the risk of pregnancy complications
which can include:
Infertility
Gestational diabetes
Pre-eclampsia
Miscarriage/fetal death
Prolonged labor
Caesarean delivery
Risks to Infant and Children
Infants and children are adversely affected by
maternal obesity
Shoulder dystocia
Macrosomia
Possible birth defects
Preterm birth
Childhood obesity
Map of Preterm Births
11/3/2011
6
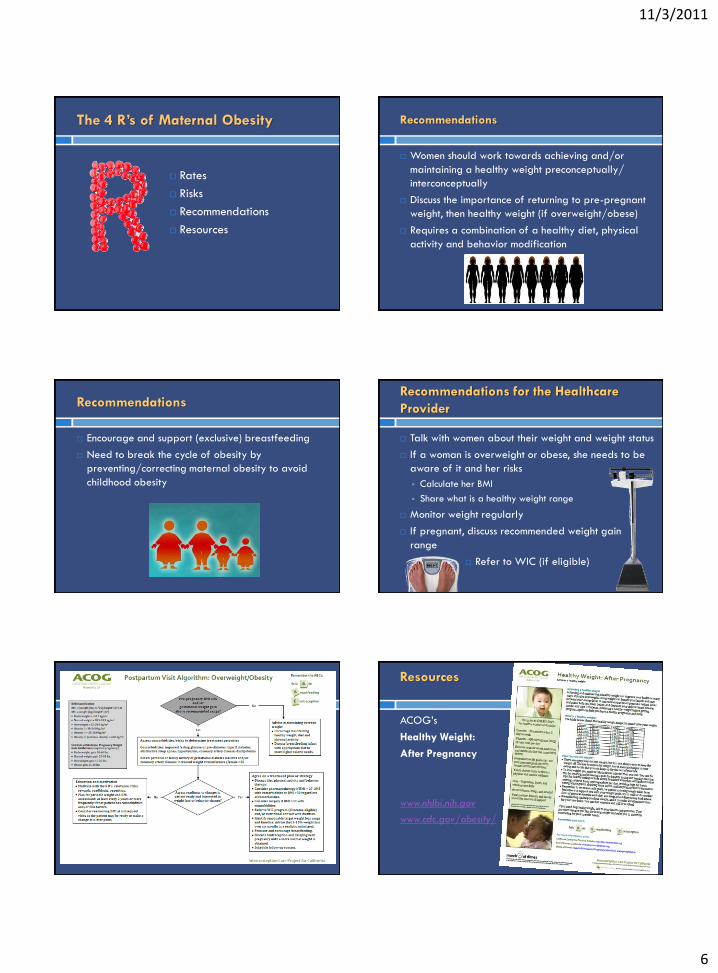
The 4 R’s of Maternal Obesity
Rates
Risks
Recommendations
Resources
Recommendations
Women should work towards achieving and/or
maintaining a healthy weight preconceptually/
interconceptually
Discuss the importance of returning to pre-pregnant
weight, then healthy weight (if overweight/obese)
Requires a combination of a healthy diet, physical
activity and behavior modification
Recommendations
Encourage and support (exclusive) breastfeeding
Need to break the cycle of obesity by
preventing/correcting maternal obesity to avoid
childhood obesity
Talk with women about their weight and weight status
If a woman is overweight or obese, she needs to be
aware of it and her risks
Calculate her BMI
Share what is a healthy weight range
Monitor weight regularly
If pregnant, discuss recommended weight gain
range
Refer to WIC (if eligible)
Recommendations for the Healthcare
Provider
Algorithm
Resources
ACOG’s
Healthy Weight:
After Pregnancy
www.nhlbi.nih.gov
www.cdc.gov/obesity/
11/3/2011
7
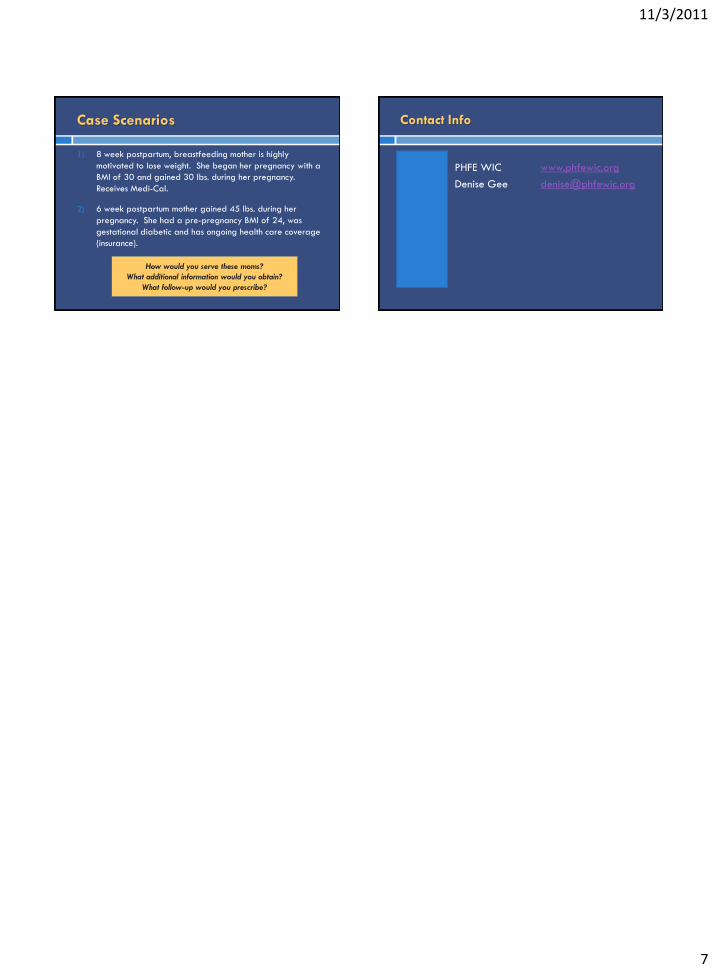
Case Scenarios
1) 8 week postpartum, breastfeeding mother is highly
motivated to lose weight. She began her pregnancy with a
BMI of 30 and gained 30 lbs. during her pregnancy.
Receives Medi-Cal.
2) 6 week postpartum mother gained 45 lbs. during her
pregnancy. She had a pre-pregnancy BMI of 24, was
gestational diabetic and has ongoing health care coverage
(insurance).
How would you serve these moms?
What additional information would you obtain?
What follow-up would you prescribe?
PHFE WIC www.phfewic.org
Denise Gee [email protected]
Contact Info