michael beckley, yusaku horiuchi and jennifer m. miller€¦ · michael beckley, yusaku horiuchi...
TRANSCRIPT

Michael Beckley, Yusaku Horiuchi and Jennifer M. Miller
AMERICA ’S ROLE IN THE MAKING OF JAPAN ’S
ECONOMIC MIRACLE
AbstractJapan’s remarkable postwar growth spurt in the 1960s would not have been possible withoutJapan’s alliance with the United States. Policy makers, political scientists, economists, historians,and journalists on both sides of the Pacific have made this claim, but no study has yet tested it withmodern statistical methods. In this article, we compare the economic growth trajectories of Japanand a statistically constructed “synthetic” Japan, which had a similar profile until the late 1950s butdid not experience the consolidation of the US–Japan alliance, a process that began in 1958 andculminated with the signing of a formal defense pact in January 1960. We find that Japan’s percapita gross domestic product (GDP) grew much faster than the synthetic Japan’s from 1958 to1968.We substantiate these results with in-depth historical analyses on how the United States facil-itated Japan’s economic miracle.
Keywordseconomic growth, US–Japan relations, synthetic control, Japan
INTRODUCTION
The postwar rise of Japan is one of the most dramatic cases of rapid economic develop-ment in modern history. Only a decade after suffering total military defeat, Japan returnedto its pre-war standard of living. More remarkable, Japan’s growth accelerated after thisinitial recovery period. The average growth rate from 1945 to 1958 was 7.1 percent,whereas it was 9.5 percent from 1959 to 1970, according to the most widely used com-parative and historical data on GDP (Bolt and Van Zanden 2014).1 The official data pub-lished by Japan’s Cabinet Office also show that the real GDP growth rate was 6.8 percentin 1956, 8.1 percent in 1957, and 6.6 percent in 1958. Then, it sharply increased to 11.2percent in 1959, 12.0 percent in 1960, 11.7 percent in 1961, and so on. From 1959 to1970, the growth rate was above 10 percent in eight (out of 12) years.2 As a result ofthis growth spurt, by 1970 Japan boasted the third largest economy and ranked amongthe most developed countries in the world. As Babones (2011, 81) points out, Japan isthe only large country with a diversified economy that has risen from a below-averagelevel of development to the upper tier of the world economy.Why did Japan experience such a remarkable growth spurt?3 Numerous economists,
political scientists and historians have examined Japan’s economic growth, in particularits growth acceleration, and have stressed different factors, but the bulk of the literaturetells some version of the following story (e.g. Amsden 2001; Calder 1988; Denison 1976;
Journal of East Asian Studies 18 (2018), 1–21doi:10.1017/jea.2017.24
© East Asia Institute
terms of use, available at https://www.cambridge.org/core/terms. https://doi.org/10.1017/jea.2017.24Downloaded from https://www.cambridge.org/core. IP address: 54.39.106.173, on 15 Aug 2020 at 13:12:14, subject to the Cambridge Core

Dower 1979; Gao 2001; Johnson 1982; Kosai 1986; Nakamura 1995; Nishimizu andHulten 1978; Samuels 1987; World Bank 1993). In the 1950s and 1960s, a coalitionof Japanese bureaucrats and businesspersons set Japan on a path of export-led growth,buoyed by massive domestic investment, foreign technology acquisition, protectionistbarriers, and well-designed industrial policies. As a result of these far-sighted policies,economic growth accelerated dramatically and Japan ascended to the heights of theworld economy.On the other hand, some scholars argue that this conventional wisdom is incomplete
(e.g., Forsberg 2000; LaFeber 1997; Miller 2012; Pempel 1999; Schaller 1997;Shimizu 2001). According to these scholars, the success of Japan’s economic policiesdepended on Japan’s close alliance with the most powerful country in the world—theUnited States. Specifically, high investment rates required an abundance of capital,export-oriented growth required dedicated buyers, and technology-acquisition and pro-tectionist policies necessitated a tolerant international community. Japanese policy-makers could not take any of these growth ingredients for granted. Fortunately forthem, American leaders were both willing and able to provide Japan with such advan-tages, because US foreign policy during the early Cold War prioritized the cultivationof strong anti-communist allies. Japan still might have developed without Americanpatronage, but it is unlikely that it would have developed as quickly or thoroughly.Policymakers, political scientists, economists, historians, and journalists on both sides of
the Pacific have told this story, but no study has yet tested it with modern statisticalmethods. This lack of systematic evaluation is understandable because there is no suitablecomparison unit—a country sufficiently similar to Japan in many respects except in termsof its relationship with the United States—to serve as a valid counter-factual case.To overcome this methodological challenge, we employ a new statistical tool—the
synthetic control method—developed by Abadie and Gardeazabal (2003) and Abadie,Diamond, and Hainmueller (2010, 2015). Specifically, we use data from other countriesto construct a “synthetic” Japan whose growth trajectory closely resembles that of Japanbefore it consolidated its security relationship with the United States, a process that beganin June of 1957, accelerated substantially in 1958, and culminated with the signing of anew security treaty on January 19, 1960. We then compare this synthetic Japan’s eco-nomic trajectory with Japan’s actual economic experience after the consolidation ofthe relationship with the United States. The results suggest that while Japan’s averageannual growth rate was 9.3 percent from 1958 to 1968, the synthetic Japan only grewat 3.6 percent per year.These findings have important implications for the field of political economy. In par-
ticular, our results suggest that geopolitical context plays an essential but often over-looked role in shaping cross-national patterns of economic development. Japan’spostwar economic growth “miracle” is often cited as clear evidence of the virtues ofthe “East Asian model,” an ambitious growth blueprint that entails considerable state-intervention in the economy. Our results, however, indicate that the success of Japan’seconomic model, an allegedly effective and generally applicable model, required excep-tional international circumstances that no longer exist and are unlikely to return anytimesoon. If this is the case, then developing countries today may need to eschew textbookmodels derived from Japan’s Cold War experience in favor of more modest reforms tai-lored to their specific geopolitical circumstances.
2 Michael Beckley, Yusaku Horiuchi, and Jennifer M. Miller
terms of use, available at https://www.cambridge.org/core/terms. https://doi.org/10.1017/jea.2017.24Downloaded from https://www.cambridge.org/core. IP address: 54.39.106.173, on 15 Aug 2020 at 13:12:14, subject to the Cambridge Core

This paper proceeds in three sections. First, we review the history of the US–Japanrelationship from the early 1950s to the late 1960s and argue that a sequence of eventsin the late 1950s, particularly in 1958, was an important historical turning point forJapan’s growth spurt. Second, we introduce our statistical methods and present the empir-ical results. Finally, we discuss the implications of our results for development policy.
A H ISTOR ICAL TURNING PO INT IN THE LATE 1950S
On January 19, 1960, the United States and Japan signed a revised alliance treaty thatformally committed the United States to defend Japan from external aggression. Thistreaty, however, was the culmination of several years of negotiations and policychanges that began in June of 1957 and accelerated significantly in 1958. AlthoughJapan was the focal point of US security strategy in Asia throughout the 1950s, Americanleaders did not extend a security guarantee to Japan until the end of the decade, and theUS–Japan relationship was plagued by economic and diplomatic conflicts prior to thatpoint. In this section, we describe the evolution of US–Japan relations in the 1950sand explain how the sudden shift in the relationship in 1958 affected Japan’s subsequenteconomic growth.
THE SUDDEN SH IFT IN US– JAPAN RELAT IONS
After defeating Japan in World War II, the United States disbanded the Japanese militaryand assumed administrative control of the country. In 1951, the United States and Japansigned the San Francisco Peace Treaty, which officially restored Japan’s sovereignty.From a Japanese perspective, however, this treaty “was only a modest step from occupa-tion” (Destler et al. 1976, 13; also see Miller 2012, 88–92). The treaty gave the UnitedStates the right to station American troops in Japan and to use those troops to quelldomestic disturbances, but did not provide Japan with a formal US security guarantee.The unequal nature of the treaty, plus several high-profile incidents in which Japanesecitizens were killed by US military personnel—e.g. the Lucky Dragon incident inwhich the fallout from a US nuclear test killed a Japanese fisherman, and the Girard inci-dent in which a US soldier shot and killed a Japanese woman—aroused widespread Jap-anese contempt for the US presence and the broader US–Japan relationship.This discontent was fueled by the fact that the Japanese economy in the early- to mid-
1950s was “treading water, not moving forward” (Forsberg 2000, 83; also see Kim 1997,156; Mochizuki 2001, 16; Schaller 1997, 57). US procurement orders during the KoreanWar helped boost Japan’s GDP back to pre-war levels (Welfield 1988, 90; also seeCalder 1988, 43; Dower 1979, 315), but the “gift” of the wartime boom came with the“dagger” of inflation, shortages of raw materials (Dingman 1993), and a “distorted”economy that “cannot function without depending on special procurements” (EconomicWhite Paper of Japan 1953, quoted in Uchino 1983, 75; also see Samuels 1994, 146–148). In the mid-1950s, the United States did little to help Japan diversify itseconomy; in fact, in 1956 and 1957 the United States pressured Japan to implement aset of voluntary export restraints that the US Ambassador to Japan described as “aboutas voluntary as your doing something if you’ve got a pistol pointed at your head”(quoted in Forsberg 2000, 212).
America’s Role in the Making of Japan’s Economic Miracle 3
terms of use, available at https://www.cambridge.org/core/terms. https://doi.org/10.1017/jea.2017.24Downloaded from https://www.cambridge.org/core. IP address: 54.39.106.173, on 15 Aug 2020 at 13:12:14, subject to the Cambridge Core
By the mid-1950s, American officials were becoming increasingly aware that USpolicy was failing to produce a strong alliance. The US National Security Council(NSC) issued reports documenting Japan’s “creeping neutralism” and “tendency todrift away” from alignment with the United States (LaFeber 1997, 314; Schaller 1997,114). After a series of conflicts over Japanese rearmament, the US ambassador toJapan reported to the Secretary of State that
Japan does not consider itself an ally or partner with the United States but rather a nation which forthe time being is being forced by circumstances to cooperate with the United States and whichintends… to wring out of this relationship every possible advantage at minimum cost (US Depart-ment of State 1952–1954, 1714–1715).
Indeed, in 1956, Japanese Prime Minister Hatoyama Ichiro4 normalized Japanese diplo-matic relations with the Soviet Union and sought to forge new economic links betweenJapan and Communist China (Forsberg 2000; LaFeber 1997; Schaller 1997; Swenson-Wright 2005).By the start of 1957, the US–Japan relationship was fraught with tension, and US
leaders worried that they were losing their main foothold in Asia. As the NSC notedin 1957, the “major US objective—a firm alliance in the Pacific—is not being achieved”(Schaller 1997, 130). In January 1957, Ishibashi Tanzan became Prime Minister anddeclared his intention to normalize Japan’s relations with Communist China, anotherblow to American hopes for an active and strong US–Japan relationship.The next month, however, Ishibashi became seriously ill and was replaced as Prime
Minister by Kishi Nobusuke,5 a staunch anticommunist and advocate of close relationswith the United States. Kishi was a former member of Japan’s cabinet during World WarII and an accused Class A war criminal. Yet, he endeared himself to US officials becauseof his willingness to crack down on leftist activism, his disdain for the Soviets, and hiswillingness to curtail Japan’s economic links with China (LaFeber 1997, 135; Schaller1997, 315). Secretary of State John Foster Dulles described Kishi as “the strongest gov-ernment leader to emerge in postwar Japan” (US Department of State 1955–1957, 346–347), and Douglas MacArthur II, the US ambassador to Japan, said Kishi was “by far thebest leader in sight in terms of US objectives” (US Department of State 1955–1957, 271).Reiterating that Kishi presented new and important opportunities, MacArthur II argued,“[W]e have at last an able leader of Japan. [Kishi] indicates he wants to make a bold newstart with us… I think we can do business with him” (quoted in Miller 2012, 224). Thissudden and unexpected change in Japanese leadership from Ishibashi to Kishi opened upthe possibility for a new US–Japan relationship, and both sides seized the opportunity.In June 1957, Kishi made a state visit to the United States. During the visit, American
officials made several major concessions, including withdrawing a large number of UStroops to assuage the outcry prompted by the Girard incident, and more importantly,opening the possibility of renegotiating the US–Japan security treaty, which the Japanesehad first requested in 1955. This shift showed US officials’ desire to strengthen the US–Japan relationship and to secure Kishi’s political standing in Japan (US Department ofState 1955–1957, 485–535; also see US Department of State 1958–1960, 23). In ajoint statement, Kishi and Eisenhower declared they were “convinced that relationsbetween Japan and the United States are entering a new era firmly based on common
4 Michael Beckley, Yusaku Horiuchi, and Jennifer M. Miller
terms of use, available at https://www.cambridge.org/core/terms. https://doi.org/10.1017/jea.2017.24Downloaded from https://www.cambridge.org/core. IP address: 54.39.106.173, on 15 Aug 2020 at 13:12:14, subject to the Cambridge Core

interests and trust” (emphasis added). Other US officials echoed this sentiment, charac-terizing Kishi’s visit as a “bold new start” that would usher in a “new era” in the bilateralrelationship (US Department of State 1955–1957, 328–375). Formal negotiations for anew security treaty began in 1958.
THE ECONOMIC CONSEQUENCES OF THE US – JAPAN ALL IANCE
The security treaty negotiations in 1958 were accompanied by various economic initia-tives designed to facilitate Japan’s economic growth. American leaders were driven by“the conviction that economic growth by strategic allies would defuse the potentialappeal of anticapitalist ideologies” (Pempel 1999, 174) and decided to “promote Japanas a bulwark, if not a base camp, against communist encroachments” in Asia (Encarna-tion and Mason 1990, 37; also see Miller 2012, 204). Importantly, these major economicinitiatives, which we describe below in detail, to strengthen Japanese economy took placewithin a short period of time, mostly in 1958.First, the United States orchestrated a series of low-interest loans to Japan (Calder
1988, 89; Welfield 1988, 90). By the mid-1950s, Japan had faced a scarcity of capitalnecessary for active domestic investments. As a result of US efforts, however, foreignloans to Japan doubled in 1958, most of which came from the World Bank, “whichthe United States dominated,” as well as the US Export-Import bank and Americanbanks, which started “to play a major role as capital supplier[s] in the development ofJapanese utilities and heavy industry” (Calder 1988, 89–90). Such capital injectionsspurred a dramatic increase in Japanese investment, one of the key variables in a standardeconomic growth model (e.g., Solow 1956, 1957).Second, the Eisenhower administration approved a reduction in Japanese defense
spending, specifically Japan’s financial support of US forces (US Department of State1958–1960, 1–3). More broadly, American policymakers refrained from pressuringJapan to further develop its military, a major shift from the first half of the 1950s. Asa result, Japanese defense spending as a share of GDP declined by 20 percent between1958 and 1960, the sharpest shift of the entire post-war era, and continued to declinethereafter, falling below 1 percent of GDP by 1970 (Calder 1988, 415, 431–432). Inessence, the United States allowed Japan to “tur[n] inward and ma[k]e economicgrowth and the pursuit of affluence its highest priorities” (Sasaki 1991, 2). This USpolicy shift allowed Japan to “minimize expenditures for its own defense and… allocateits scarce resources mostly to expand its private sector …. Consequently, Japan’s eco-nomic growth was considerably accelerated” (Shibuya, Maruyama, and Ito 2002, 4).Indeed, Patrick and Rosovsky (1976) estimate that Japan’s economy would have been30 percent smaller by 1976 if it had shouldered its own defense burden.Third, the United States helped promote Japanese exports. Japan had become a
member of General Agreement on Tariffs and Trade (GATT) in September 1955, but14 of the 32 members refused to grant most-favored-nation status to Japan, and theremaining 18 members “established stand-by measures … to protect their industries inthe event Japanese imports [threatened] their domestic industry” (Shimizu 2001, 156).As a result, the GATT agreement was “slight in substance,” and Japan’s balance-of-payment deficit spiraled to dangerous levels in the mid-1950s (Forsberg 2000, 5, 150–168). US leaders like Ambassador Douglas MacArthur II worried that Japan would be
America’s Role in the Making of Japan’s Economic Miracle 5
terms of use, available at https://www.cambridge.org/core/terms. https://doi.org/10.1017/jea.2017.24Downloaded from https://www.cambridge.org/core. IP address: 54.39.106.173, on 15 Aug 2020 at 13:12:14, subject to the Cambridge Core

“forced into some form of economic accommodation with [the] Communist Bloc” if theUnited States did not provide an outlet for Japanese exports (US Department of State1958–1960, 4). To prevent this outcome, the Eisenhower administration (and subse-quently the Kennedy and Johnson administrations) resisted protectionist demandsfrom US interest groups and worked to open the US market to Japanese goods.Specifically, in 1958, US and Japanese business leaders established the Joint Commit-
tee on US–Japan Trade, and Japan sent its first government-funded trade mission to theUnited States. Eisenhower also used the flexibility given by the US Trade Act of 1958,which authorized the president to lower tariffs by 20 percent and gave him four years ofenhanced authority to negotiate trade deals, to expand US–Japanese trade (Forsberg2000, 218–219). Many US industries called for protection from Japanese goods, but“the Eisenhower administration successfully deflected most of the pressure for restric-tions on Japanese imports” (Forsberg 2000, 225). For example, during a closelywatched discussion over imports of Japanese-made stainless-steel flatware in 1958, theEisenhower administration resisted business pressure for increased tariffs by instead pro-posing that Japan accept a slightly lower Voluntary Export Restraint (VER) (Forsberg2000, 218–225; Shimizu 2001, 167–170).As a result of these deliberate US policies to boost Japan’s exports, American pur-
chases from Japan increased by more than 150 percent from 1958 to 1960, givingJapan its first-ever trade surplus (Forsberg 2000, 218; Shimizu 2001, 3). Over the subse-quent decade, the United States absorbed more than 30 percent of Japan’s exports, a sit-uation comparable to Bulgaria’s export dependence on the Soviet Union (Hunsberger1972, 134; Pempel 1999, 177). Such aggressive exports from Japan to the US increasedprofits and thus mitigated Japan’s balance-of-payment constraint for further investmentand productivity growth (McCombie and Thirlwall 1994).Finally, fearing the growing popularity of the Japanese Socialist Party (JSP), the
United States intervened financially in Japanese politics. Evidence in a variety of openand (according to scholars who have seen them) still-classified US government docu-ments shows that the Eisenhower administration, through the Central IntelligenceAgency, began providing millions of dollars in secret campaign funds to Kishi andother Liberal Democratic Party (LDP) politicians in early 1958 as part of their largergoal of rebuilding the US–Japan alliance (Johnson 1995; LaFeber 1997, 312–337;Samuels 2001; Schaller 1997, 130–35; Schaller 2001, 46). American officials—includ-ing Alfred C. Ulmer, Jr., the CIA’s operations chief for East Asia from 1955 to 1958;Roger Hilsman, the head of Intelligence and Research at the State Department in theKennedy and Johnson administrations; Norbert A. Schlei, a legal adviser in theKennedy and Johnson administrations; and U. Alexis Johnson, American ambassadorto Japan from 1966 to 1969—have publicly acknowledged making or authorizing mil-lions of dollars in payments to LDP politicians. US officials believed that US securityand the efficacy of the US–Japanese alliance rested on “a conservative political hege-mony within Japan” (Schaller 1985, 122; Johnson 1995). Scholarly research (e.g.,Alesina, et al. 1996) suggests that maintaining political stability was another likely deter-minant of Japan’s economic growth spurt.It should be noted that the alliance consolidation process was far from smooth. Kishi’s
determination to ram the ratification of the revised security treaty through the Diet, espe-cially on the heels of his push for a highly controversial police bill in 1958, gave Japanese
6 Michael Beckley, Yusaku Horiuchi, and Jennifer M. Miller
terms of use, available at https://www.cambridge.org/core/terms. https://doi.org/10.1017/jea.2017.24Downloaded from https://www.cambridge.org/core. IP address: 54.39.106.173, on 15 Aug 2020 at 13:12:14, subject to the Cambridge Core

citizens the impression that Kishi was reviving the pre-war authoritarian state (Calder1988, 88). When the Socialist party tried to stop voting in the Diet on the revised securitytreaty, Kishi ordered 500 policemen to remove them; the Diet then passed the treaty in theabsence of the opposition. In response to both the treaty and Kishi’s actions, socialists,labor unions, anti-base groups, and student groups helped organize massive protestsand strikes that brought millions of Japanese to the streets in June 1960 (Kapur 2011,13). In the face of such a large public outcry, Kishi resigned after the new securitytreaty passed through the Diet, and Eisenhower canceled his planned trip to Japan to cel-ebrate the signing of the new treaty (Packard 1966).Despite this turmoil in 1960, however, the strategic bargain between the United States
and Japan persisted and economic ties continued to flourish. By focusing on economicgrowth, Japan’s new Prime Minister, Ikeda Hayato, sought to overcome the contentiouspolitics of the 1950s. In particular, in November 1960, Ikeda announced his ten-yearIncome Doubling Plan, which grew out of an earlier 1957 plan that combined domesticand international factors (Metzler 2013, 199). Economic interactions also remainedcentral to the US–Japan alliance; in 1961 the Kennedy administration passed severaltrade expansion initiatives that lowered tariffs on a broad range of Japanese productsand allowed Japan to raise textile exports to the United States by 5 percent, all part ofKennedy’s public pledge to assist Ikeda’s Income Doubling Plan (Schaller 1997,177–183). As Forsberg concludes, “the US desire to consolidate the Cold War allianceprovided Japan the opportunity to crack the lucrative American market, and Japaneseindustry seized the moment” (Forsberg 2000, 230).In sum, Japan profited tremendously from the consolidation of the US–Japan alliance.
By the end of the 1960s, however, American leaders, facing a costly war in Vietnam, anexpanding trade deficit, and tepid economic growth, had become less tolerant of Japan’sprivileged position in US economic and security policy. In 1969, President Nixon pulledtens of thousands of US soldiers out of Asia and declared that US allies would have to“assume the primary responsibility of providing the manpower for [their] defense.”6 In1971, the Nixon administration abandoned the dollar’s peg to gold and imposed a 10percent surcharge on imports. Nixon later described these policies as an effort to“stick it to the Japanese” (Quoted in Hoff 1994, 140). Indeed, theymarked “the beginningof the end of the special dependency relationship that had prevailed between the UnitedStates and Japan” (Schaller 1997, 245). Japan was forced to revalue its currency, and Jap-anese leaders “could no longer count on transferring many of the economic consequencesof their domestic policies onto the United States, nor could they even anticipate worldeconomic conditions that would allow them to continue their prior policies of highgrowth” (Pempel 1987, 282).Not coincidentally, Japan’s annual economic growth rate plunged from 10 percent (the
1960s average) to 3 percent in 1971, where it remained until the 1980s when it declinedstill further. To be sure, other factors help explain why Japanese growth decelerated in the1970s, among them the surge in oil prices after the 1973 OPEC crisis. The correspon-dence between the downturn in US–Japan relations and the end of rapid Japanesegrowth, however, is consistent with the argument that the formation and strengtheningof the US–Japan alliance in the early decades of the Cold War played a crucial role infacilitating Japan’s exceptional economic performance.
America’s Role in the Making of Japan’s Economic Miracle 7
terms of use, available at https://www.cambridge.org/core/terms. https://doi.org/10.1017/jea.2017.24Downloaded from https://www.cambridge.org/core. IP address: 54.39.106.173, on 15 Aug 2020 at 13:12:14, subject to the Cambridge Core

EMP IR ICAL TESTS
If the consolidation of the US–Japan alliance was a key factor behind Japan’s economicmiracle, then this consolidation should coincide with the start of Japan’s growth accel-eration. In this section, we test this observable implication with a non-parametricapproach known as the synthetic control method (Abadie and Gardeazabal 2003;Abadie, Diamond, and Hainmueller 2010, 2015). We first introduce this method. Aftershowing the results of estimation and placebo tests, we discuss possible alternative inter-pretations of the estimated effects.
THE SYNTHET IC CONTROL METHOD
To study the consequences of major historical events, scholars typically do what we didin the previous section; namely, they describe the chronology of events and highlightcertain quotations and coincidences as evidence of a causal story. Such qualitativeprocess-tracing is valuable, but it provides only suggestive evidence and is thereforean inadequate method to answer the key counter-factual question necessary for causalidentification: What would have happened in the absence of the critical event?To address this problem, we use a non-parametric statistical method developed by
Abadie and Gardeazabal (2003) and Abadie, Diamond, and Hainmueller (2010, 2015).Their “synthetic control” method uses data from multiple comparison units to constructa single, synthetic comparison unit that resembles the unit of interest before it experi-enced a critical event. Previous studies have used this method to examine the effect ofthe outbreak of terrorism in the late 1960s on per capita GDP in the Basque Countryin northern Spain (Abadie and Gardeazabal 2003), the effects of economic liberalizationon per capita GDP in a worldwide sample of countries (Billmeier and Nannicini 2013),the effect of the German reunification in 1990 on West Germany’s per capita GDP(Abadie, Diamond, and Hainmueller 2015), the effect of the outbreak of the 2000 Pales-tinian Intifada on Israel’s per capita GDP (Horiuchi and Mayerson 2015), and manyothers (see Craig 2015 for a review).We use this method to compare the growth trajectoryof Japan vis-à-vis that of a “synthetic” Japan. If the consolidation of the US–Japan alli-ance had substantial economic ramifications, then the economic trajectories of Japan andthe synthetic Japan should be similar until 1958 and then diverge thereafter.Three important remarks are in order. First, although the US and Japan formally signed
the revised security treaty on January 19, 1960, the historical documents presented in theprevious section show that the economic groundwork for the alliance was laid in 1958.7
For this reason, we use 1958 as the year of “intervention” (or “treatment”) rather than1960.8
Second, the policy changes in 1958 constituted a sudden and major shift in US–Japanrelations and thus function methodologically as a valid treatment for the synthetic controlmethod. As we emphasized in the previous section, the nature of US–Japan relationschanged unexpectedly in 1957 when Ishibashi Tanzan became ill and was replaced asprime minister by Kishi Nobusuke. Kishi’s visit to the United States in June 1957spurred a series of major economic agreements in 1958. In this regard, our applicationof the synthetic control method is similar to those used in other studies that have exam-ined the effects of sudden incidents (e.g., terrorist attacks) or major policy changes (e.g.,
8 Michael Beckley, Yusaku Horiuchi, and Jennifer M. Miller
terms of use, available at https://www.cambridge.org/core/terms. https://doi.org/10.1017/jea.2017.24Downloaded from https://www.cambridge.org/core. IP address: 54.39.106.173, on 15 Aug 2020 at 13:12:14, subject to the Cambridge Core

the German reunification, the introduction of tobacco controls) on economic growth.None of these events were totally random exogenous shocks, but the synthetic controlmethod has nevertheless demonstrated to be a helpful way to analyze their effects in con-junction with qualitative evidence and traditional counter-factual analyses.Finally, strictly speaking, our statistical analysis only allows us to examine whether
some events in 1958 set Japan on a higher growth trajectory. As we discussed in the pre-vious section, the efforts to consolidate the US–Japan security relationship fundamen-tally altered Japan’s economic prospects. We therefore regard the alliance as the mostlikely driver of Japan’s growth acceleration after the late 1950s. At the end of thissection, however, we discuss several alternative events that may have triggered thegrowth takeoff.
SPEC IF ICAT IONS
Following the studies cited above, we use per capita GDP as our outcome variable. Thedata comes from the Maddison Project (Bolt and Van Zanden 2014), which is the onlydataset that provides the estimated GDP and population for many countries for a suffi-ciently long time-period. Another data set commonly used to study variations in GDPacross countries and over a long time-period is the Penn World Table (Feenstra,Inklaar, and Timmer 2015).9 The period of coverage, however, is from 1950, onlyeight years before the year of intervention (in 1958). Abadie, Diamond and Hainmueller(2010, 495) show that a longer pre-treatment period is necessary to improve the accuracyof estimation. In this regard, the Penn World Table is not suitable for our analysis.10
Specifically, the period of investigation for our analysis is from 1920 to 1969. As wenoted earlier, we use 1958 as the treatment year. Our post-treatment period (including1958) spans 11 years, from 1958 to 1968. We do not extend the post-treatment periodbeyond these years (say, from 1958 to 1978), because as we discussed earlier, theUS–Japan relationship deteriorated in the late 1960s in part due to the post-treatmentoutcome (i.e., the growth acceleration in the 1960s) itself.11 Indeed, Japan’s growthacceleration and resulting trade surplus with the United States was one of the factorsthat drove the Nixon administration to end some of the economic perks that theUnited States was providing Japan.The synthetic control method makes a weighted-average comparison unit based on
two steps. The initial step is to choose countries, and the second is to choose a set of pre-dictors to assign optimal weights. For the first step, to avoid an arbitrary selection,12 weuse as many countries included in the Maddison Project as possible, as a “donor pool”(i.e., the base set of countries, not all of which could be chosen to construct a syntheticcontrol). Some of these donor countries experienced post-war economic and/or militaryassistance from the United States during the period of investigation, but none of themexperienced a dramatic and sudden consolidation of security and economic alliancewith the US in the late 1950s.13 Specifically, we include the following 48 countries inour donor pool: Argentina, Australia, Austria, Belgium, Brazil, Bulgaria, Canada,Chile, Colombia, Costa Rica, Cuba, Czechoslovakia, Denmark, Ecuador, El Salvador,Finland, France, Germany, Greece, Guatemala, Honduras, Hungary, India, Indonesia,Ireland, Italy, Malaysia, Mexico, Netherlands, New Zealand, Nicaragua, Norway,Peru, Philippines, Portugal, Singapore, South Korea, Spain, Sri Lanka, Sweden,
America’s Role in the Making of Japan’s Economic Miracle 9
terms of use, available at https://www.cambridge.org/core/terms. https://doi.org/10.1017/jea.2017.24Downloaded from https://www.cambridge.org/core. IP address: 54.39.106.173, on 15 Aug 2020 at 13:12:14, subject to the Cambridge Core

Switzerland, Taiwan, USSR, the United Kingdom, United States, Uruguay, Venezuela,and Yugoslavia.Second, we choose a set of predictors to assign optimal weights. Formally, we have a
sample of J + 1(= 49) countries, where j = 1 is the “treated unit” (i.e., Japan) and units j =2 to j = J + 1 are comparison units in the donor pool. We construct a synthetic Japan usinga weighted average of the countries in the donor pool, represented by a (J × 1) vector ofweights W = (w2, … wj+1)′ with 0≤wj≤ 1 for j = {2, … ,J + 1} and w2+ … +wj+1 = 1.This vector is estimated by the constrained optimization with a set of “predictors” thatare not influenced by the treatment but are expected to affect the post-treatment trajectoryof Japan’s per capita GDP.14 With these predictors, countries that are not sufficientlysimilar to Japan are assigned zero or small weights.In selecting predictors, we confronted a challenge: data on standard predictors of
economic growth, such as measures of investment, consumption, human capital, tradeopenness, and inflation are only available from 1950 onwards for a large set of coun-tries.15 Therefore, we use several alternative variables as predictors.First, we add variables representing the growth of each country’s economy and pop-
ulation prior to 1958. The economic growth variable is calculated by dividing each coun-try’s level of per capita GDP in 1957 by the level of its per capita GDP in 1945. Thepopulation growth variable is calculated in the same manner. These two variables areessential in characterizing each country’s post-war economic recovery.Second, following previous studies applying the synthetic control method, we include
three lagged outcome variables. First, the average per capita GDP during the entire pre-intervention period (i.e., from 1920 to 1957) is necessary to give higher weights to coun-tries that are similar to Japan, on average, with regard to the level of economic develop-ment. Furthermore, we add per capita GDP in 1944, the year in which Japan’scatastrophic economic disasters started, and per capita GDP in 1958, the year of the inter-vention, both of which are used to improve the construction of the synthetic control.16
Finally, we use a dummy variable indicating whether or not a country was a member ofthe United Nations (UN) as of its foundation in 1945. Japan and other defeated nationswere initially excluded from the UN, a fact that testifies to their unique and inauspiciousgeopolitical circumstances at the start of the postwar era.
MAIN RESULTS
As long as the model specifications (i.e., the selections of a donor pool, predictors, andthe length of a pre-treatment period) are valid, we should obtain a synthetic control thatprovides a good fit for the treated unit during the pre-treatment period. The top panel inFigure 1 shows that this is indeed the case. It compares the trajectories of per capita GDPbetween Japan (black line) and the synthetic Japan (gray line). The two lines are almostexactly the same until 1958. Then they begin to diverge and continue to do so at anincreasing rate until the end of the period of investigation. This result is consistentwith the historical narrative sketched out in the previous section: Kishi’s June 1957visit to the United States set in motion plans for a new and more robust US–Japan rela-tionship, which developed during 1958, culminated in the signing of the revised securitytreaty, and persisted throughout the 1960s.
10 Michael Beckley, Yusaku Horiuchi, and Jennifer M. Miller
terms of use, available at https://www.cambridge.org/core/terms. https://doi.org/10.1017/jea.2017.24Downloaded from https://www.cambridge.org/core. IP address: 54.39.106.173, on 15 Aug 2020 at 13:12:14, subject to the Cambridge Core

Japan’s per capita GDP grew at an average annual rate of 9.3 percent from 1958 to1968 (from $3,289 to $7,983). By contrast, the synthetic Japan’s per capita GDP onlygrew at 3.6 percent (from $3,346 to $4,757). This result suggests that Japan’s percapita GDP would have been smaller by an average of about $1,288 per year withoutthe US–Japan alliances. This growth gap is equivalent to 39.2 percent of the 1958level. In a well-known study of Japan’s economic growth, Patrick and Rosovsky(1976) note that Japan’s economy would have been 30 percent smaller without the lowdefense spending, although they do not explain their method of estimation. Based on amodern statistical technique, we show that their estimated/claimed effect is similar to ours.
FIGURE 1 The Effect of Intervention in 1958 in Japan on Per Capita GDP
Note: [Top] After 1958, the rate of increase in Japan’s per capita GDP (black line) accelerated, ascompared to the counter-factual scenario (gray line). The counter-factual trajectory is based on thesynthetic control method. [Bottom-Left] The dark line shows the difference in per capita GDPbetween Japan and the synthetic Japan. The grey lines show the results of an “in-space” placebotest in which the intervention (or “treatment”) was assigned to each of the other countries in thedonor pool. [Bottom-Right] Each dot shows the log ratio of pre-1958 (inclusive) mean squared pre-diction error (MSPE) and post-1958 (exclusive) mean squared prediction error. If we were to selecta country at random, the probability that its post- versus pre-intervention MSPE ratio would be thelargest for Japan out of the 16 countries is 1/49 = 0.020, which is smaller than 5 percent.
America’s Role in the Making of Japan’s Economic Miracle 11
terms of use, available at https://www.cambridge.org/core/terms. https://doi.org/10.1017/jea.2017.24Downloaded from https://www.cambridge.org/core. IP address: 54.39.106.173, on 15 Aug 2020 at 13:12:14, subject to the Cambridge Core

Table 1 shows a list of countries in the donor pool and the weights assigned to these coun-tries by the synthetic controlmethod. The synthetic Japan in our analysis is comprised of 42.6percent Austria, 18.1 percent South Korea, 15.7 percent Indonesia, 13.4 percent the Philip-pines, 8.9 percent Malaysia, and 1.3 percent the United States. Table 2 shows the values ofpredictors for Japan during the pre-intervention period, as well as the weighted averagevalues of predictors for the synthetic Japan. These values are very similar: Japan and the syn-thetic Japan (except for the Philippines and the United States, which constitute 14.7 percentof the synthetic Japan) are not founding UN members; per capita GDP more than doubledfrom 1945 to 1957 in both Japan (2.33 times) and the synthetic Japan (2.18 times);duringthe same period, the population increased by 20.1 percent in Japan and 17.9 percent in thesynthetic Japan; and the average per capita GDP from 1920 to 1957, as well as the levelsof per capita GDP in 1944 and 1958, are all fairly similar for the actual Japan and the syn-thetic Japan. These results suggest that our synthetic Japan serves as a valid counter-factualcase for Japan’s economic growth in the absence of the US–Japan alliance.
PLACEBO TESTS
To assess the credibility of the estimated treatment effect, we conducted two types ofplacebo tests suggested by Abadie, Diamond, and Hainmueller (2010, 2015). The first
TABLE 1 Weights for Synthetic Japan
Unit Weight
Austria 0.426Indonesia 0.157Malaysia 0.089the Philippines 0.134South Korea 0.181the United States 0.013
Note: The weights are assigned using the synthetic control method. The countries assigned 0 weight includeArgentina, Australia, Belgium, Brazil, Bulgaria, Canada, Chile, Colombia, Costa Rica, Cuba, Czechoslovakia,Denmark, Ecuador, El Salvador, Finland, France, Germany, Greece, Guatemala, Honduras, Hungary, India,Ireland, Italy, Mexico, Netherlands, New Zealand, Nicaragua, Norway, Peru, Portugal, Singapore, Spain, SriLanka, Sweden, Switzerland, Taiwan, USSR, the United Kingdom, Uruguay, Venezuela, Yugoslavia.
TABLE 2 The Means of Predictors During the Pre-Intervention Period
(Actual) Japan Synthetic Japan
Post-war Economic Recovery 2.330 2.179Post-war Population Growth 1.201 1.179Per capita GDP (1920–1957 average) 2,175.99 2,176.82Per capita GDP (1944) 2,658.97 2,497.22Per capita GDP (1958) 3,288.90 3,346.16Member of U.N. in 1945 0 0.147
Note: Post-war Economic Recovery is per capita GDP in 1957 divided by per capita GDP in 1945. Post-warPopulation Growth is population in 1957 divided by population in 1945.
12 Michael Beckley, Yusaku Horiuchi, and Jennifer M. Miller
terms of use, available at https://www.cambridge.org/core/terms. https://doi.org/10.1017/jea.2017.24Downloaded from https://www.cambridge.org/core. IP address: 54.39.106.173, on 15 Aug 2020 at 13:12:14, subject to the Cambridge Core
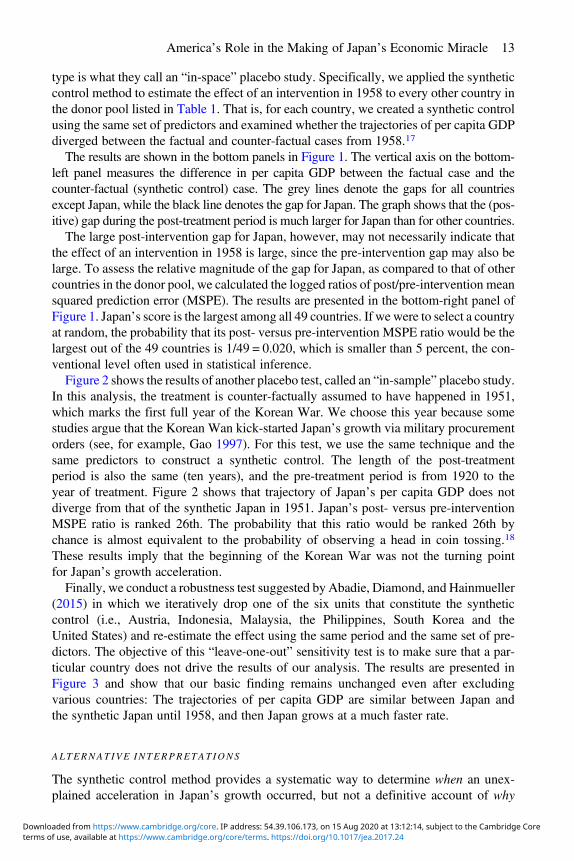
type is what they call an “in-space” placebo study. Specifically, we applied the syntheticcontrol method to estimate the effect of an intervention in 1958 to every other country inthe donor pool listed in Table 1. That is, for each country, we created a synthetic controlusing the same set of predictors and examined whether the trajectories of per capita GDPdiverged between the factual and counter-factual cases from 1958.17
The results are shown in the bottom panels in Figure 1. The vertical axis on the bottom-left panel measures the difference in per capita GDP between the factual case and thecounter-factual (synthetic control) case. The grey lines denote the gaps for all countriesexcept Japan, while the black line denotes the gap for Japan. The graph shows that the (pos-itive) gap during the post-treatment period is much larger for Japan than for other countries.The large post-intervention gap for Japan, however, may not necessarily indicate that
the effect of an intervention in 1958 is large, since the pre-intervention gap may also belarge. To assess the relative magnitude of the gap for Japan, as compared to that of othercountries in the donor pool, we calculated the logged ratios of post/pre-intervention meansquared prediction error (MSPE). The results are presented in the bottom-right panel ofFigure 1. Japan’s score is the largest among all 49 countries. If we were to select a countryat random, the probability that its post- versus pre-intervention MSPE ratio would be thelargest out of the 49 countries is 1/49 = 0.020, which is smaller than 5 percent, the con-ventional level often used in statistical inference.Figure 2 shows the results of another placebo test, called an “in-sample” placebo study.
In this analysis, the treatment is counter-factually assumed to have happened in 1951,which marks the first full year of the Korean War. We choose this year because somestudies argue that the Korean Wan kick-started Japan’s growth via military procurementorders (see, for example, Gao 1997). For this test, we use the same technique and thesame predictors to construct a synthetic control. The length of the post-treatmentperiod is also the same (ten years), and the pre-treatment period is from 1920 to theyear of treatment. Figure 2 shows that trajectory of Japan’s per capita GDP does notdiverge from that of the synthetic Japan in 1951. Japan’s post- versus pre-interventionMSPE ratio is ranked 26th. The probability that this ratio would be ranked 26th bychance is almost equivalent to the probability of observing a head in coin tossing.18
These results imply that the beginning of the Korean War was not the turning pointfor Japan’s growth acceleration.Finally, we conduct a robustness test suggested by Abadie, Diamond, and Hainmueller
(2015) in which we iteratively drop one of the six units that constitute the syntheticcontrol (i.e., Austria, Indonesia, Malaysia, the Philippines, South Korea and theUnited States) and re-estimate the effect using the same period and the same set of pre-dictors. The objective of this “leave-one-out” sensitivity test is to make sure that a par-ticular country does not drive the results of our analysis. The results are presented inFigure 3 and show that our basic finding remains unchanged even after excludingvarious countries: The trajectories of per capita GDP are similar between Japan andthe synthetic Japan until 1958, and then Japan grows at a much faster rate.
ALTERNAT IVE INTERPRETAT IONS
The synthetic control method provides a systematic way to determine when an unex-plained acceleration in Japan’s growth occurred, but not a definitive account of why
America’s Role in the Making of Japan’s Economic Miracle 13
terms of use, available at https://www.cambridge.org/core/terms. https://doi.org/10.1017/jea.2017.24Downloaded from https://www.cambridge.org/core. IP address: 54.39.106.173, on 15 Aug 2020 at 13:12:14, subject to the Cambridge Core

Japan’s growth accelerated. As we discussed in detail with our qualitative analysis, webelieve that the sudden shift in the US–Japan relations was the major trigger of growthspurt. Yet, we acknowledge that it is possible that our results are driven by otherevents that occurred around the same time. Below, we highlight several alternative expla-nations and discuss why we think they did not significantly affect Japan’s growth accel-eration from the late 1950s.One such event could be the 1958 Japanese elections in which the LDP secured more
than 60 percent of the seats in the Lower House election. The LDP would go on to retainpower until 1993. It is possible that the consolidation of conservative power in Japanmarked a major turning point in Japan’s postwar economic growth, but we are skeptical
FIGURE 2 The Effect of Intervention in 1951 in Japan on Per Capita GDP
Note: [Top] After 1951, the rate of increase in Japan’s per capita GDP (black line) accelerated, ascompared to the counterfactual scenario (gray line). The counterfactual trajectory is based on thesynthetic control method. [Bottom-Left] The dark line shows the difference in per capita GDPbetween Japan and the synthetic Japan. The grey lines show the results of an “in-space” placebotest in which the treatment was assigned to each of the other countries in the donor pool.[Bottom-Right] Each dot shows the log ratio of pre-1951 (inclusive) mean squared predictionerror (MSPE) and post-1951 (exclusive) mean squared prediction error. If we were to select acountry at random, the probability that its post- versus pre-intervention MSPE ratio would bethe largest for Japan out of the 16 countries is 26/48 = 0.542, which is larger than 10 percent.
14 Michael Beckley, Yusaku Horiuchi, and Jennifer M. Miller
terms of use, available at https://www.cambridge.org/core/terms. https://doi.org/10.1017/jea.2017.24Downloaded from https://www.cambridge.org/core. IP address: 54.39.106.173, on 15 Aug 2020 at 13:12:14, subject to the Cambridge Core

that it fully explains our results. The 1958 election was not a landslide victory and, there-fore, did not allow investors to predict that the LDP would dominate Japanese politics for35 years. Although the LDP won 287 out of 467 seats in 1958, it was ten fewer seats thanthe Liberals and Democrats jointly won in 1955 (the Liberals and Democrats then mergedto form the LDP that same year). Moreover, the Japanese Socialist Party won 166 seats in1958, an amount greater than the number of seats the Socialists won in 1955. Finally, aswe explained earlier, there is reason to believe that the LDP’s electoral success in 1958and subsequent political dominance were at least partially due to the party’s close rela-tionship with the US, which funneled funds to LDP politicians and helped the LDP stim-ulate the Japanese economy once it was in power.The second alternative explanation for our statistical results is the Japanese business
cycle. In 1958, Japan recovered from a yearlong inventory recession and experiencedan economic boom (the “Iwato” boom), which was generated by a rapid influx of
FIGURE 3 The Results of Leave-One-Out Sensitivity Tests
Note: The dark and gray lines show the growth trajectories of Japan and the synthetic Japan, respec-tively. Even after excluding one of the countries given a positive weight, the results are similar: Thetrajectories of per capita GDP are similar between Japan and the synthetic Japan until 1958, but theystarted to diverge after the consolidation of the US–Japan relationship.
America’s Role in the Making of Japan’s Economic Miracle 15
terms of use, available at https://www.cambridge.org/core/terms. https://doi.org/10.1017/jea.2017.24Downloaded from https://www.cambridge.org/core. IP address: 54.39.106.173, on 15 Aug 2020 at 13:12:14, subject to the Cambridge Core

capital. This investment surge may explain the initial few years of economic growth after1958, but it seems an unlikely explanation for the next decade of double-digit growthrates. Moreover, as we explained earlier, the surge in Japanese investment rates begin-ning in 1958 may be partially owing to the consolidation of the US–Japan alliance;after agreeing to renegotiate the US–Japan security treaty in 1958, the United Statesorchestrated an influx of foreign investment to Japan and helped Japan free up capitalfor investment by significantly reducing Japan’s defense burden.A third alternative explanation highlights labor arrangements within Japan. The 1950s
was marked by economically disruptive labor activism in major industries, particularlybetween 1957 and 1961 (Gordon 1998, 104). By the late 1950s, however, changingunion values, a growing corporate ethos, and more generous pay schedules began tofoster a new pattern of “cooperative unionism” that increasingly eschewed strikes as amajor tactic (Gordon 1998, 129–32). But this shift was just beginning in 1958.Indeed, 1960 witnessed a yearlong strike at the large Mitsui Miike Coal Mine. Moreover,this corporate ethos was fostered in part by American policymakers, who promotedcooperation between Japanese business and labor as part of their emphasis on Japaneseeconomic growth.In sum, we acknowledge that there may be other factors that explain Japan’s dramatic
growth takeoff after 1958. We believe, however, that they cannot explain Japan’s sus-tained growth throughout the 1960s and may, in fact, be partially relevant to the “inter-vention” itself in our analysis; namely, the sudden and dramatic changes in Japan’srelationship with the United States in the late 1950s.
CONCLUS ION
Most analyses attribute Japan’s postwar prosperity to Japanese policies. Our study, bycontrast, suggests that such factors were necessary but insufficient: Japan rose in partbecause of its institutions and policies, but the effectiveness of those institutions and policieswas, in turn, enhanced by Japan’s privileged geopolitical environment. Specifically, Japanhad the good fortune to rebuild its economy during the Cold War when the most powerfulcountry in the world needed strong allies. The United States not only absorbed Japan’sexports and tolerated Japanese protectionism but also subsidized the Japanese economyand transferred technology to Japanese firms. Without such advantages, Japan might stillhave achieved solid economic growth, but probably not an economic miracle.What does this historical finding mean for contemporary development policy? The
harsh reality is that poor countries today confront a far less nurturing international envi-ronment than Japan enjoyed in the 1950s and 1960s. With the Cold War over, the UnitedStates is less willing to tolerate protectionism or curtail its own prosperity for the sake ofother countries.19 Moreover, many of the tools that Japan used to stimulate growth andcultivate globally competitive firms—e.g., export subsidies, import tariffs, foreigninvestment restrictions—are now regulated or banned by the World Trade Organization(WTO). As the United States and other rich countries dig themselves out of the recenteconomic crisis, they are unlikely to tolerate policies that give firms in poorer countriesan advantage over their own.In such a hostile economic environment, poor countries’ best option may be to
smuggle industrial policies and protectionism through the back door under the guise
16 Michael Beckley, Yusaku Horiuchi, and Jennifer M. Miller
terms of use, available at https://www.cambridge.org/core/terms. https://doi.org/10.1017/jea.2017.24Downloaded from https://www.cambridge.org/core. IP address: 54.39.106.173, on 15 Aug 2020 at 13:12:14, subject to the Cambridge Core

of innovation, monetary, and human development policies. For example, subsidies canbe funneled through R&D budgets, exports can be promoted through currency underval-uation and special economic zones, and industries can be protected by health and envi-ronmental standards. Alternatively, poor countries can simply flaunt the rules and try toget an entire industry up and running before the WTO can rule on a case or trade partnerscan retaliate. Indeed, several countries, most notably China, have shown how such“second-best” strategies can produce rapid growth even under the constraints of theWTO (Rodrik 2008).In general, however, we should not expect to see many Japan-style miracles in the
future. This conclusion, in turn, implies that the economic gap between rich and poorcountries will remain stubbornly persistent.20 Economic convergence is possible intheory, but Japan’s experience suggests that convergence will be the exception ratherthan the norm and that the success of any growth model will depend, to some degree,on the peculiarities of a country’s geopolitical circumstances. The most importantpoint to be made, therefore, is that the study of economic development should paycloser attention to historically specific geopolitical contexts. We believe that thisarticle demonstrates how such factors can be rigorously examined by grafting “qualita-tive flesh onto quantitative bones” (Tarrow 1995)—combining the granularity of histor-ical research with the rigor and mathematical precision of case-specific statisticalanalysis.
Michael Beckley is Assistant Professor in the Department of Political Science at Tufts University and Interna-tional Security Policy Fellow at Harvard’s Kennedy School of Government. Previously, he worked at the USDepartment of Defense, the RAND Corporation, and the Carnegie Endowment for International Peace. Heholds a Ph.D. in political science from Columbia University.
Yusaku Horiuchi is Professor of Government and Mitsui Professor of Japanese Studies at Dartmouth College.Horiuchi earned anM.A. in international and development economics fromYale University in 1995 and a Ph.D.in political science from the Massachusetts Institute of Technology in 2001. His research interests include com-parative politics (electoral politics, political economy, public opinion, Japan) and quantitative social science(research design, statistical methods, data visualization).
Jennifer M. Miller is an Assistant Professor of History at Dartmouth College. Miller earned an M.A. (2005) andPh.D. (2012) in the history of US foreign relations from the University of Wisconsin-Madison, with a focus onUS–East Asian relations. She is currently completing a book that examines the postwar US–Japanese alliancethrough the prism of competing ideas about democracy; portions of this project have been published in Diplo-matic History and the Journal of Contemporary History.
SUPPLEMENTARY MATER IAL
To view supplementary material for this article, please visit https://doi.org/10.1017/jea.2017.24.
NOTES
1. Another commonly used cross-national dataset, the PennWorld Table version 9.0 (Feenstra, Inklaar, andTimmer 2015), also shows the average growth rate of 7.9 percent for 1950–1958 (even with the huge spike in1951–1952 from the Korean War) and 10.6 percent for 1959–1970.
America’s Role in the Making of Japan’s Economic Miracle 17
terms of use, available at https://www.cambridge.org/core/terms. https://doi.org/10.1017/jea.2017.24Downloaded from https://www.cambridge.org/core. IP address: 54.39.106.173, on 15 Aug 2020 at 13:12:14, subject to the Cambridge Core

2. Cabinet Office, the Government of Japan. Accessed on April 27, 2017. www5.cao.go.jp/keizai3/2011/1221nk/n11_q/n11_q_1.html.
3. Clearly, a sequence of various events and policy decisions during the period of investigation contributedto Japan’s post-war economic growth. Our primal goal, however, is not necessarily to explain Japan’s entirepost-war economic growth “pathway” per se. Instead, we investigate when and why Japan’s growth rate accel-erated. We then estimate the magnitude of the accelerated growth rate.
4. For historical figures, all Japanese names are written in the Japanese style, with family name proceedinggiven name.
5. Kishi Nobusuke is a grandfather of the current prime minister of Japan, Abe Shinzo.6. Nixon, Address to the Nation on the War in Vietnam, 3 November 1969.7. We applied a statistical method to identify “structural breaks” to show that a turning point for Japan’s
economic growth was 1958. The results are presented in the online appendix. Note that this analysis uses ouroutcome variable (i.e., per capita GDP). Our qualitative analysis in the previous section substantiates this resultby showing that an important set of changes, which we argue as the factors contributing to Japan’s postwargrowth acceleration, happened in 1958.
8. Following the literature of research designs for causal inference, we use either of two words—interven-tion and treatment—to mean a critical event that is expected to have influenced the outcome variable. Thesewords are used interchangeably in this article.
9. Perhaps the most comprehensive, and most commonly used, cross-national and time-series data set forthe analysis of economic development is the World Bank Development Indicators. The period of data coveragefor Japan’s GDP statistics is, however, only 1966 onwards.
10. While acknowledging the limitation of a short pre-treatment period, we used the PWT data in our pre-liminary analysis and included household consumption, gross capital formation, government consumption,human capital, labor compensation in GDP at current national prices, and the average of real GDP per capitaat constant 2005 national prices (during the pre-treatment period) as predictors. The results are similar tothat of our main analysis: Japan and the synthetic Japan grow at similar rates before the year of intervention(in 1958) but diverge after that.
11. Overly extending the post-treatment period would introduce a problem of “post-treatment bias” (Rose-nbaum 1984). To estimate the impact of an intervention, we need to avoid including a period in which the post-treatment outcome itself brings about substantially different political and economic consequences.
12. Abadie, Diamond, and Hainmeuller (2010, 2015) argue that analysts should select a limited number ofcomparison units that are similar during the pre-treatment period to the unit of interests. In an earlier version ofthis article, we reported the results by focusing on 15 countries that are similar to Japan in the most critical sensefor our analysis—countries that experienced negative economic growth during the Second World War, just asJapan did, and tried to achieve economic recovery. The results are substantially very similar. We decided,however, to show the results using many more countries because what makes “similar” to Japan itself is con-troversial and because dissimilar countries would be given no weight anyway in the synthetic control method.
13. If their economic and security relationships with the US contributed to their economic growth after 1958(the year of intervention in our analysis), our analysis would produce an under-estimated effect, rather than anover-estimated one.
14. For complete technical details, see Abadie and Gardeazabal (2003) and Abadie, Diamond, and Hainmu-eller (2010, 2015).
15. See note 10. The results based on the Penn World Table (with the post-1950 data) are similar: The syn-thetic Japan grows much slower after 1958 than Japan’s actual rate of growth.
16. One may suggest the use of numerous lagged outcome variables for the entire pre-treatment period (i.e.,one lagged variable for each year). This approach, however, would induce another over-fitting problem (Kaulet al. 2015). Namely, the performance of prediction (in terms of the magnitude of prediction error) during thepre-treatment period would improve, while the performance of prediction during the post-treatment periodwould get worse substantially.
17. When constructing the synthetic controls for other countries, Japan is included in the donor pool.Whether to include the original treated unit in the donor pool for each in-country placebo is divided in the lit-erature. Although Abadie and Gardeazabal (2003) exclude it, other studies often keep it. We follow the commonapproach.
18. One country (Hungary) was dropped in this in-sample placebo test because the optimal weights toproduce a synthetic control was not calculated.
18 Michael Beckley, Yusaku Horiuchi, and Jennifer M. Miller
terms of use, available at https://www.cambridge.org/core/terms. https://doi.org/10.1017/jea.2017.24Downloaded from https://www.cambridge.org/core. IP address: 54.39.106.173, on 15 Aug 2020 at 13:12:14, subject to the Cambridge Core
19. In fact, the United States itself, under the new leadership of President Trump, is pursuing protectionistpolicies in favor of the United States at the possible cost of other trade partners.
20. For all the talk of global economic convergence, it is important to note that the difference in incomelevels between developed and developing countries remains as wide today as it was in 1950 (Rodrik 2011,11). Even the most successful developing countries have had trouble catching up. China, for example, stillranks 92nd in the world in terms of per capita income and continues to lag far behind OECD countries interms of innovation.
REFERENCES
Abadie, Alberto, Alexis Diamond, and Jens Hainmueller. 2010. “Synthetic Control Methods for ComparativeCase Studies: Estimating the Effect of California’s Tobacco Control Program.” Journal of the AmericanStatistical Association 105 (490): 493–505.
———. 2015. “Comparative Politics and the Synthetic Control Method.” American Journal of Political Science59 (2): 495–510.
Abadie, Alberto, and Javier Gardeazabal. 2003. “The Economic Costs of Conflict: A Case Study of the BasqueCountry.” American Economic Review 93 (1): 113–132.
Alesina, Alberto, Sule Ozler, Nouriel Roubini, and Phillip Swagel. 1996. “Political Instability and EconomicGrowth.” Journal of Economic Growth 1 (2): 189–211.
Amsden, Alice H. 2001. The Rise of “the Rest”: Challenges to the West from Late-Industrializing Economies.New York: Oxford University Press.
Babones, Salvatore. 2011. “The Middling Kingdom: The Hype and the Reality of China’s Rise.” ForeignAffairs 90 (5): 79–88.
Billmeier, Andreas, and TommasoNannicini. 2013. “Assessing Economic Liberalization Episodes: A SyntheticControl Approach.” Review of Economics and Statistics 95 (3): 983–1001.
Bolt, Jutta, and Jan Luiten van Zanden. 2014. “The Maddison Project: Collaborative Research on HistoricalNational Accounts.” The Economic History Review 67 (3): 627–651.
Calder, Kent E. 1988. Crisis and Compensation: Public Policy and Political Stability in Japan, 1949–1986.Princeton: Princeton University Press.
Craig, Peter. 2015. “Synthetic Controls: A New Approach to Evaluating Interventions.”What Works ScotlandWorking Paper, March.
Denison, Edward Fulton. 1976. How Japan’s Economy Grew So Fast: The Sources of Postwar Expansion.Washington, DC: Brookings Institution.
Destler, I. M., Priscilla Clapp, Hideo Sato, and Haruhiro Fukui. 1976. Managing an Alliance: The Politics ofUS–Japanese Relations. Washington, DC: Brookings Institution.
Dingman, Roger. 1993. “The Dagger and the Gift: The Impact of the Korean War on Japan.” The Journal ofAmerican-East Asian Relations 2 (1): 29–55.
Dower, John W. 1979. Empire and Aftermath: Yoshida Shigeru and the Japanese Experience, 1878–1954.Cambridge, MA: Council on East Asian Studies, Harvard University.
Encarnation, Dennis J., and Mark Mason. 1990. “Neither MITI nor America: The Political Economy of CapitalLiberalization in Japan.” International Organization 44 (1): 25–54.
Feenstra, Robert C., Robert Inklaar, and Marcel P. Timmer. 2015. “The Next Generation of the Penn WorldTable.” American Economic Review 105 (10): 3150–3182.
Forsberg, Aaron. 2000. America and the Japanese Miracle: The Cold War Context of Japan’s PostwarEconomic Revival, 1950–1960. Chapel Hill: University of North Carolina Press.
Gao, Bai. 1997. Economic Ideology and Japanese Industrial Policy: Developmentalism from 1931 to 1965.New York: Cambridge University Press.
———. 2001. Japan’s Economic Dilemma: The Institutional Origins of Prosperity and Stagnation. New York:Cambridge University Press.
Gordon, Andrew. 1998. The Wages of Affluence: Labor and Management in Postwar Japan. Cambridge, MA:Harvard University Press.
Hoff, Joan. 1994. Nixon Reconsidered. New York: Basic Books.Horiuchi, Yusaku, and Asher Mayerson. 2015. “The Opportunity Cost of Conflict: Statistically Comparing
Israel and Synthetic Israel.” Political Science Research and Methods 3 (3): 609–618.
America’s Role in the Making of Japan’s Economic Miracle 19
terms of use, available at https://www.cambridge.org/core/terms. https://doi.org/10.1017/jea.2017.24Downloaded from https://www.cambridge.org/core. IP address: 54.39.106.173, on 15 Aug 2020 at 13:12:14, subject to the Cambridge Core

Hunsberger, Warren S. 1972. “Japan-United States Trade–Patterns, Relationships, Problems.” In Pacific Part-nership: United States-Japan Trade, Prospects and Recommendations for the Seventies, edited by JeromeCohen. Lexington, MA: Lexington Books.
Johnson, Chalmers A. 1982. MITI and the Japanese Miracle: The Growth of Industrial Policy, 1925–1975.Stanford: Stanford University Press.
———. 1995. “The 1955 System and the American Connection: A Bibliographic Introduction.” Japan PolicyResearch Working Paper 11, Oakland, CA.
Kapur, Nikhil. 2011. “The 1960 US–Japan Security Treaty Crisis and the Origins of Contemporary Japan.” Ph.D. diss., Harvard University.
Kaul, Ashok, Stefan Klößner, Gregor Pfeifer, and Manuel Schieler. 2015. “Synthetic Control Methods: NeverUse All Pre-Intervention Outcomes as Economic Predictors.” Working Paper.
Kim, Nam G. 1997. From Enemies to Allies: The Impact of the Korean War on US–Japan Relations.San Francisco, CA: International Scholars Publications.
Kosai, Yutaka. 1986. The Era of High Speed Growth: Notes on the Postwar Japanese Economy. Tokyo, Japan:University of Tokyo Press.
LaFeber, Walter. 1997. The Clash: A History of US–Japan Relations. New York: WW Norton.McCombie, J. S. L., and A. P. Thirlwall. 1994. Economic Growth and the Balance-of-Payments Constraint.
New York: St. Martin’s.Metzler, Mark. 2013. Capital as Will and Imagination: Schumpeter’s Guide to the Postwar Japanese Miracle.
Ithaca: Cornell University Press.Miller, JenniferM. 2012. “Building a NewKind of Alliance: The United States, Japan, and the ColdWar, 1950–
1961.” Ph.D. diss., University of Wisconsin-Madison.Mochizuki, MikeM. 2001. “US–Japan Relations in the Asia-Pacific Region.” InPartnership: TheUnited States
and Japan, 1951–2001, edited by Akira Iriye and Robert A. Wampler. Tokyo: Kodansha International.Nakamura, Takafusa. 1995. The Postwar Japanese Economy: Its Development and Structure, 1937–1994. 2nd
ed. Tokyo: University of Tokyo Press.Nishimizu, Mieko, and Charles R. Hulten. 1978. “The Sources of Japanese Economic Growth: 1955–71.” The
Review of Economics and Statistics 60 (3): 351–361.Packard, George R. 1966. Protest in Tokyo: The Security Treaty Crisis of 1960. Princeton: Princeton University
Press.Patrick, Hugh, and Henry Rosovsky. 1976. “Japan’s Economic Performance: An Overview.” In Asia’s New
Giant: How the Japanese Economy Works, edited by Hugh Patrick and Henry Rosovksy. Washington,DC: Brookings Institution.
Pempel, T. J. 1987. “The Unbundling of ‘Japan, Inc.’: The Changing Dynamics of Japanese Policy Formation.”Journal of Japanese Studies 13 (2): 271–306.
———. 1999. “The Developmental Regime in a Changing World Economy.” In The Developmental State,edited by Meredith Woo-Cumings. Ithaca: Cornell University Press.
Rodrik, Dani. 2008. “Second-Best Institutions.” American Economic Review 98 (2): 100–104.———. 2011. “The Future of Economic Convergence.” NBER Working Paper No. 2011, Cambridge, MA.Rosenbaum, Paul R. 1984. “The Consequences of Adjustment for a Concomitant Variable That Has Been
Affected by the Treatment.” Journal of the Royal Statistical Society. Series A (General) 147 (5): 656–666.Samuels, Richard J. 1987. The Business of the Japanese State: Energy Markets in Comparative and Historical
Perspective. Ithaca: Cornell University Press.———. 1994. “Rich Nation, Strong Army”: National Security and the Technological Transformation of Japan.
Ithaca: Cornell University Press.———. 2001. “Kishi and Corruption: An Anatomy of the 1955 System.” Japan Policy Research Institute
Working Paper 83, Oakland, CA.Sasaki, Takeshi. 1991. “Postwar Japanese Politics at a Turning Point.” The Japan Foundation Newsletter 18
(5–6): 1–7.Schaller, Michael. 1985. The American Occupation of Japan: The Origins of the Cold War in Asia. New York:
Oxford University Press.———. 1997.Altered States: The United States and Japan Since the Occupation. NewYork: Oxford University
Press.———. 2001. “The United States, Japan, and China at Fifty.” In Partnership: The United States and Japan,
1951–2001, edited by Akira Irie and Robert A. Wampler. Tokyo: Kodansha International.
20 Michael Beckley, Yusaku Horiuchi, and Jennifer M. Miller
terms of use, available at https://www.cambridge.org/core/terms. https://doi.org/10.1017/jea.2017.24Downloaded from https://www.cambridge.org/core. IP address: 54.39.106.173, on 15 Aug 2020 at 13:12:14, subject to the Cambridge Core

Shibuya, Hiroshi, MakotoMaruyama, and Osamu Ito. 2002. “AViewpoint to Analyze Japan’s Social Economyand American Impacts.” In Japanese Economy and Society under Pax-Americana, edited by HiroshiShibuya, Makoto Maruyama, and M. Yasaka. Tokyo: University of Tokyo Press.
Shimizu, Sayuri. 2001. Creating People of Plenty: The United States and Japan’s Economic Alternatives,1950–1960. Kent, OH: Kent State University Press.
Solow, Robert M. 1956. “AContribution to the Theory of Economic Growth.”Quarterly Journal of Economics70 (1): 65–94.
———. 1957. “Technical Change and the Aggregate Production Function.” Review of Economics and Statistics39 (3): 312–320.
Swenson-Wright, John. 2005. Unequal Allies?: United States Security and Alliance Policy Toward Japan,1945–1960. Stanford: Stanford University Press.
Tarrow, Sidney. 1995. “Bridging the Quantitative-Qualitative Divide in Political Science.” American PoliticalScience Review 89 (2): 471–474.
US Department of State. 1952–1954. Foreign Relations of the United States, 1952–1955, Japan, Volume XIV.Washington, DC: US Government Printing Office.
———. 1955–1957. Foreign Relations of the United States, 1955–1957, Japan; Korea, Volume XXIII. Wash-ington, DC: US Government Printing Office.
———. 1958–1960. Foreign Relations of the United States, 1958–1960, Japan; Korea, Volume XVIII. Wash-ington, DC: US Government Printing Office.
Uchino, Tatsuro. 1983. Japan’s Postwar Economy: An Insider’s View of Its History and Its Future. 1st Englishedition. New York: Kodansha International.
Welfield, John. 1988. An Empire in Eclipse: Japan in the Postwar American Alliance System, a Study in theInteraction of Domestic Politics and Foreign Policy. Atlantic Highlands, NJ: Athlone Press.
World Bank. 1993. The East Asian Miracle: Economic Growth and Public Policy. New York: OxfordUniversity Press.
America’s Role in the Making of Japan’s Economic Miracle 21
terms of use, available at https://www.cambridge.org/core/terms. https://doi.org/10.1017/jea.2017.24Downloaded from https://www.cambridge.org/core. IP address: 54.39.106.173, on 15 Aug 2020 at 13:12:14, subject to the Cambridge Core