mfg strategy 2015 ab
TRANSCRIPT
Experience & KnowledgeforLeading Your CompanyProviding the direction to stay competitive and achieve growth
JOHN BARNEY

BSA-TPI COPY RIGHT 2015
CREATING A SMART WAY TO MANUFACTURE THE NEXT GENERATION OF PRODUCT
FOR
TODAYS NEEDS & TOMORROWS CHALLENGE
Blending People, Processes
and Technology for optimum
business performance
THIS REPRESENTS MY EXPERIENCE
IN THE AEROSPACE INDUSTRY

BSA-TPI COPY RIGHT 2015
STRATEGICALLY CHANGING TO SUPPORT
Better Thinking
+
Better Technology
=
BETTER RESULTS
THE FUTURE OF MANUFACTURING Technology
Best Part of Lean
Economical Structured Market
Time to Market (Days vs. Weeks)
TE
CH
NO
LO
GY
TE
CH
NO
LO
GY
VISION
This letter is to introduce you to my
professional experience in
Operations Management.

BSA-TPI COPY RIGHT 2015
THE FOLLOWING ARE
STRATEGIES AND
METHODOLOGIES THAT I HAVE
BEEN DEPLOYING FOR ALL OF
MY LEADERSHIP ENGAGEMENTS
BSA-TPI COPY RIGHT 2015
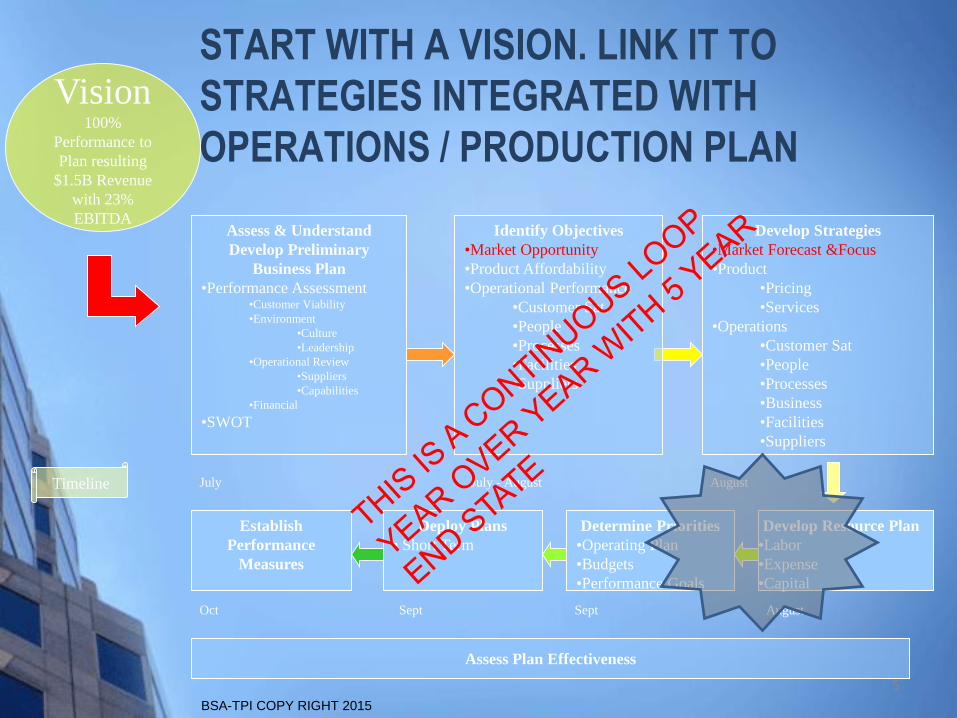
START WITH A VISION. LINK IT TO
STRATEGIES INTEGRATED WITH
OPERATIONS / PRODUCTION PLAN
Assess & Understand
Develop Preliminary
Business Plan
•Performance Assessment•Customer Viability
•Environment
•Culture
•Leadership
•Operational Review
•Suppliers
•Capabilities
•Financial
•SWOT
Vision100%
Performance to
Plan resulting
$1.5B Revenue
with 23%
EBITDAIdentify Objectives
•Market Opportunity
•Product Affordability
•Operational Performance
•Customer Sat.
•People
•Processes
•Facilities
•Suppliers
Develop Strategies
•Market Forecast &Focus
•Product
•Pricing
•Services
•Operations
•Customer Sat
•People
•Processes
•Business
•Facilities
•Suppliers
Develop Resource Plan
•Labor
•Expense
•Capital
Establish
Performance
Measures
Deploy Plans
• Short Term
Determine Priorities
•Operating Plan
•Budgets
•Performance Goals
Assess Plan Effectiveness
July July - August August
AugustSeptSeptOct
Timeline
5
BSA-TPI COPY RIGHT 2015
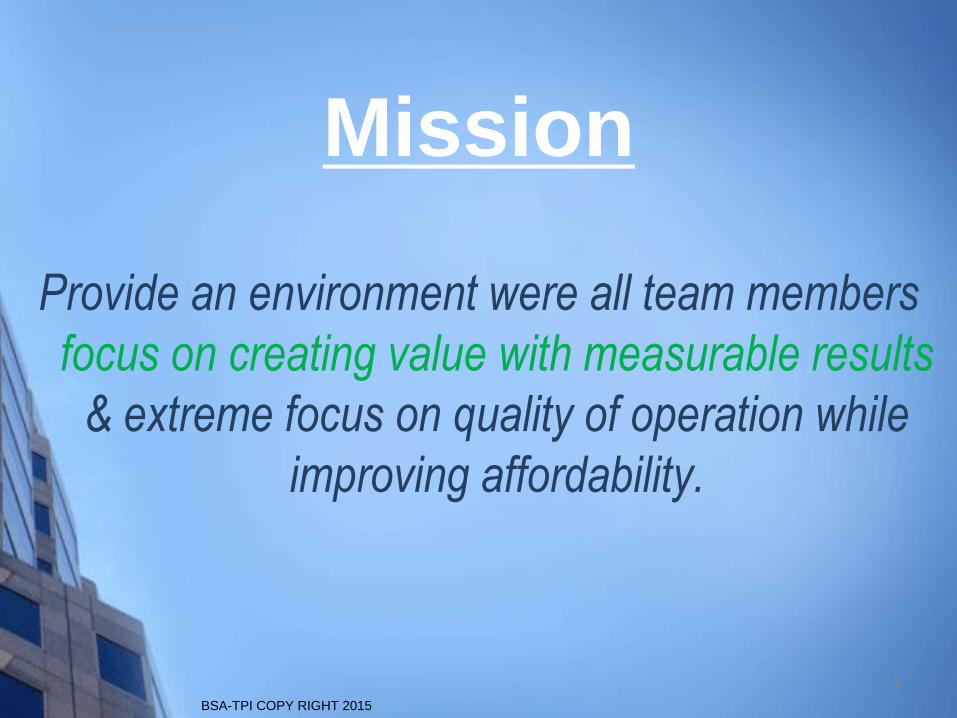
Provide an environment were all team members
focus on creating value with measurable results
& extreme focus on quality of operation while
improving affordability.
Mission
6

BSA-TPI COPY RIGHT 2015
Structure for Driving a Continuous Improvement Culture
Develop
Strategy
OVER ALL STRUCTURE
Demonstrated MOS
tool proficiency drives
improvement
Monitor Progress
Establish
Vision
2007 Vought Site Control Tower
Achieved Goal Yellow-Within 10% Red- Missed Target > 10% Not Applicable
Metrics
Target/Act Tar Act Tar Act Tar Act Tar Act Tar Act Tar Act Tar Act Tar Act Tar Act Tar Act Tar Act Tar Act Tar Act Tar Act Tar Act
July '07 1 1 100% 0% 100%100%$3.86 $2.46 11 9 90%80.0%90%55.9%100%100% 298 279 208 207 10.0%21.8%5.0% 8.8% 50.8%50%5.4 7.78 $17.5 $19.664
Aug '07 1 1 100%100%100%100%$3.86 $6.34 11 11 90%76.7%90%51.7%100%100% 298 278 208 208 10.0%20.6%5.0% 9.3% 50.8%49%5.4 7.25 $17.5 $21.109
Sept '07 1 1 100%67%100%100%$3.86 $5.24 11 9 90%73.7%90%46.5%100%100% 298 276 208 212 10.0%27.4%5.0%11.0%50.8%53%5.4 6.89 $17.5 $22.211
Oct-7 1 0 100% 100% $3.86 $2.67 11 8 90%72.6%90%45.7%100%100% 298 277 208 217 10.0%27.7%5.0%11.8%50.8%52%5.4 N/A $17.5 $20.145
Oct-14 1 1 100% 0% 100%100%$3.86 $2.62 11 7 90%79.3%90%42.3%100%94.7% 298 292 208 220 10.0%29.1%5.0%11.6%50.8%50%5.4 N/A $17.5 $21.630
Oct-21 1 0 100% 100% $3.86 $3.24 11 10 90%77.0%90%50.2%100%87.0% 298 297 208 227 10.0%25.4%5.0% 9.9% 50.8%48%5.4 N/A $17.5 $22.248
Oct-28 1 0 100% 100% $3.86 $3.47 11 9 90%81.7%90%52.1%100%100% 298 297 208 235 10.0%24.7%5.0%12.3%50.8%50%5.4 N/A $17.5 $22.712
% on Time
CA
R3
($/Std hr)
Tot. Inventory
(M)% Direct OT % Indirect OT
%
Productivity
Non-Touch
Headcount
(Indirect)
Cost Working CapitalSchedule
Inventory
TurnsFOB on Time
MTD Defects
/1000 std hrs
Starts on
Time
Completes on
Time
Touch
Headcount
(Direct)
OSHA
Recordables
Timeliness
Reporting
Safety Quality
Define Metrics
Create Roadmap
Qualifying
Learning Coaching,
Teaching &
Baselining
Using the tools; getting results
and
Building foundations
Bronze
Silver
Gold
Significantly improving
business metrics
Year-over-year
business metrics
improvements
Qualifying
Learning Coaching,
Teaching &
Baselining
Using the tools; getting results
and
Building foundations
Bronze
Silver
Gold
Significantly improving
business metrics
Year-over-year
business metrics
improvements
Achievement Levels
for
Cells/Sites/Programs
Enabling Flawless
ExecutionVOS Qualifying Level
0
1
3
1
1
21
11
2
1
1
2
00
1
2
3
4
5
VOC - Vo ice o f the Customer Survey
FOD Compliance
MOS Implementation
VOS Academy Training
5S
Visual Facto ry
VSM Current/Future
QCPC Implementation
Skills Training Matrix
RCCA Training
Standard Work Implementat ion
TPM - To tal Productive Maintenance
Program
Demand Pull System
Employee Development
Identify Business
Opportunities
KMI
Ops Measures
Financial Measures
Trend Data
Crew Plan / JDS Wkly Summary/Review
Drive product focus
Day to
Day Task
Lean
Model
G/O
Milestone
Track
Results
Drive Flawless
Execution
Prioritize
Opportunities
Communicate
Goals & Objectives
Improve
Processes
Voice of the Customer (VOC)
Key Input to the
Strategic Operating System (SOS)
Details make the difference

BSA-TPI COPY RIGHT 2015
Key Philosophy & Methodology
Group FacilitatorYou’re empowered
Task MasterHere is what to do &
How…do it!
Builder of Learning
OrganizationHere is our purpose & direction
I will guide & coach
Bureaucratic MgrFollow the rules
General
Management
Expertise
In-Depth
Understanding
Of Work
To
p-D
ow
n
Dire
ctive
s
Bo
tto
m -
Up
De
ve
lop
ment Leadership Model
Learning
Enterprise
Enabling Systems
Clear Expectations
Stable, Reliable Processes
Fair and Honorable Business Relations
Next Level
Of Improvement
Stability
•Map all elements together as a system
•Sense of accountability throughout Value Stream
•Coercive vs. Enabling
•Focus on the Manual Process, then automate
•Visual Control
People & Partners
Eliminate Process Waste
Philosophy-Long Term Thinking
Continuous
Learn to deal with PeopleDriving / Inspiring / Cautious / Steady people
•Driver
•Expressive
•Analytical
•Amiable= Reserved & Slow
= Outgoing & Fast
BSA-TPI COPY RIGHT 2015
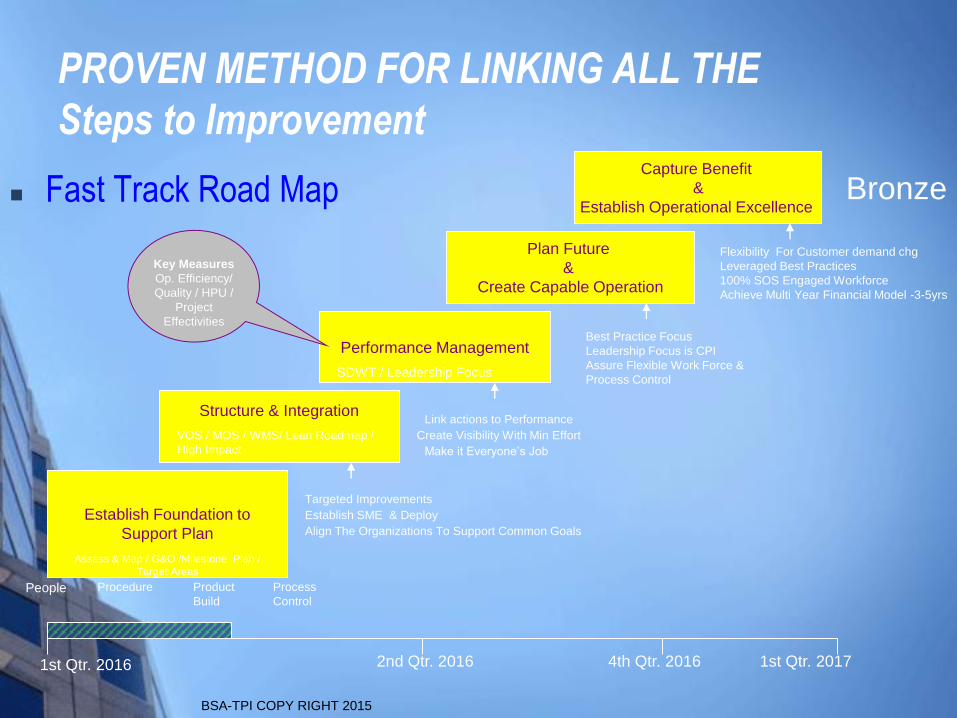
PROVEN METHOD FOR LINKING ALL THE
Steps to Improvement
Fast Track Road Map
Establish Foundation to
Support Plan
People Process
Control
Product
Build
Procedure
Structure & Integration
Performance Management
Plan Future
&
Create Capable Operation
Capture Benefit
&
Establish Operational Excellence
1st Qtr. 2016 2nd Qtr. 2016 4th Qtr. 2016 1st Qtr. 2017
Targeted Improvements
Establish SME & Deploy
Link actions to Performance
Create Visibility With Min Effort
Make it Everyone’s Job
Align The Organizations To Support Common Goals
Key Measures
Op. Efficiency/
Quality / HPU /
Project
Effectivities
Best Practice Focus
Leadership Focus is CPI
Assure Flexible Work Force &
Process Control
Flexibility For Customer demand chg
Leveraged Best Practices
100% SOS Engaged Workforce
Achieve Multi Year Financial Model -3-5yrs
Bronze
Assess & Map / G&O /Milestone Plan /
Target Areas
VOS / MOS / WMS/ Lean Roadmap /
High Impact
SDWT / Leadership Focus

BSA-TPI COPY RIGHT 2015
Lean linkage to Strategic PlanningEmployee Communication/ Factory Manufacturing Parts
Leadership Empowerment Organization Processes Management CPI
Timing Phase
-Organizational Development to -6S -Quality
integrate all factory operations -Develop SME's & -Tools
Establish Foundation -Right Sizing -Performance Visibility & Develop Develop Functional -Methods -Shop Floor
2nd - 3rd to Support Current -Recognize & establish trust Motivated, Trusting Workforce Org Structure -Sequenced Build Control
Quarter Business/Program -Communication (specific targets -Kaizen Events Plans (Crew Plans) -POU
2003 Requirements with commitments)
-VMS
-Organizational Development
3rd - 4th Structure -Empowerment - Mechanic owns QA -Process Definition -Perform
Quarter & -Situational Leadership Model -Skill Assessment & Training -IPT Deployment -Process Control -Supply Management Data
2003 Integration -Structured IPT -Cross Training On Factory Floor -Data Analysis -Integrated Kit Analysis
-Communicate the Future and -IBWI delivery from supplier -Project
the workforce involvement - Flight Line Close out - New Technology Selection
-Deploy Vision/Mission statement per roll back to B1 plan Development
input from LAI Model
1st -Establish job stability & establish -Electrical Shop Flow/ - Customer accept -JIT/Kanban
Quarter Performance Responsibility, Authority, Accountability Relocation to POU inside B1 -Inventory
2004 Management -Flow/Roll Backs -1st time quality yield rate Reduction
1st - 2nd -Flatten organization & establish processes
Quarter Plan Future to support self directed workforce
2004
2nd
Quarter Capture Benefits -Redeploy into IPT's
2004
**Strategies**Lean Methods
(Relationships to Key
Elements & Activities)
Engage Workforce
6S
Standard Solution/VSM
Flow/Pull
LINKING OBJECTIVES TO LEAN STRATEGIES
BSA-TPI COPY RIGHT 2015
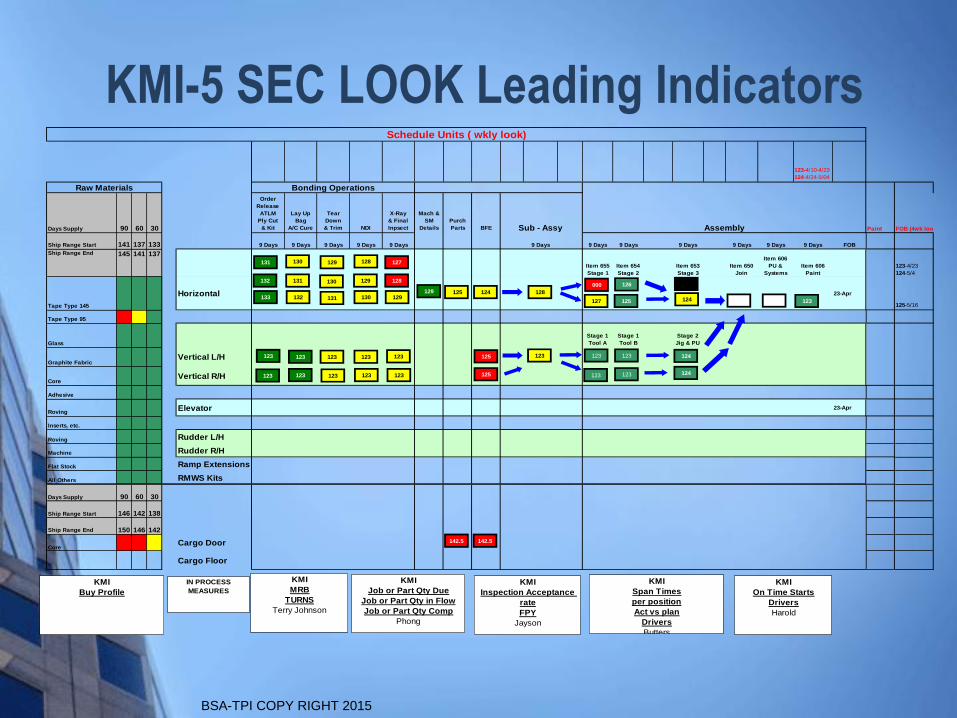
KMI-5 SEC LOOK Leading Indicators
123-4/10-4/23
124-4/24-5/04
Days Supply 90 60 30
Order
Release
ATLM
Ply Cut
& Kit
Lay Up
Bag
A/C Cure
Tear
Down
& Trim NDI
X-Ray
& Final
Inpsect
Mach &
SM
Details
Purch
Parts BFE Sub - Assy Paint FOB (4wk look)
Ship Range Start 141 137 133 9 Days 9 Days 9 Days 9 Days 9 Days 9 Days 9 Days 9 Days 9 Days 9 Days 9 Days 9 Days FOB
Ship Range End 145 141 137
Item 655
Stage 1
Item 654
Stage 2
Item 653
Stage 3
Item 650
Join
Item 606
PU &
Systems
Item 606
Paint
123-4/23
124-5/4
Tape Type 145
Horizontal 23-Apr
125-5/16
Tape Type 95
Glass
Stage 1
Tool A
Stage 1
Tool B
Stage 2
Jig & PU
Graphite FabricVertical L/H
CoreVertical R/H
Adhesive
RovingElevator 23-Apr
Inserts, etc.
Roving Rudder L/H
Machine Rudder R/H
Flat Stock Ramp Extensions
All Others RMWS Kits
Days Supply 90 60 30
Ship Range Start 146 142 138
Ship Range End 150 146 142
CoreCargo Door
Cargo Floor
Bonding Operations
Assembly
Raw Materials
Schedule Units ( wkly look)
123123123
000
127
126
125 124
123
128
123 123
123
123
123
124
127
123 123 123
131 130 129 128
123
123
123
123
123 123 123
125
124 125 129
125 124
128132 131 130 129
129133 132 131 130
142.5 142.5
KMI
MRB
TURNS
Terry Johnson
IN PROCESS
MEASURES
KMI
Span Times
per position
Act vs plan
Drivers
Butters
KMI
Inspection Acceptance
rate
FPY
Jayson
KMI
Job or Part Qty Due
Job or Part Qty in Flow
Job or Part Qty Comp
Phong
KMI
Buy Profile
KMI
On Time Starts
Drivers
Harold
BSA-TPI COPY RIGHT 2015
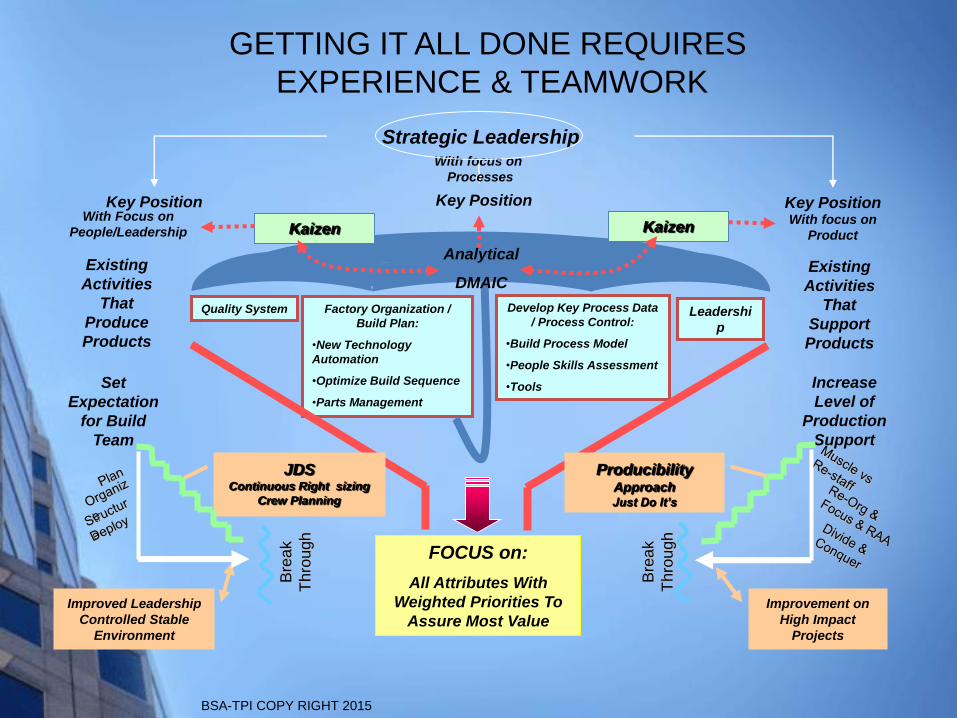
FOCUS on:
All Attributes With
Weighted Priorities To
Assure Most Value
Quality System Factory Organization /
Build Plan:
•New Technology
Automation
•Optimize Build Sequence
•Parts Management
Develop Key Process Data
/ Process Control:
•Build Process Model
•People Skills Assessment
•Tools
Leadershi
p
Increase
Level of
Production
Support
Producibility ApproachJust Do It’s
Improvement on
High Impact
ProjectsB
rea
k
Th
rou
gh
Set
Expectation
for Build
Team
JDSContinuous Right sizing
Crew Planning
Improved Leadership
Controlled Stable
Environment
Bre
ak
Th
rou
gh
Strategic Leadership
Key Position Key PositionKey PositionWith Focus on
People/Leadership
With focus on
Processes
With focus on
Product
Existing
Activities
That
Produce
Products
Analytical
DMAICExisting
Activities
That
Support
Products
KaizenKaizen
GETTING IT ALL DONE REQUIRES
EXPERIENCE & TEAMWORK

BSA-TPI COPY RIGHT 2015
DEPLOYING THE OBJECTIVES REQUIRES PROVEN TOOLS
Rapid Improvement Events
WASTE
Maintenance Technology
Value Map
Rapid Improvement Events
Lean
Assessment
Vision
Strategy & PD
Pull / Kanban
Single Pc Flow /
SMED
Supply JIT
Diagn
ostics
Create Stability
With Critical Processes
Strategy Continuous
Action
Evaluation
Waste
Std Work
Flow
Pull
5S Product Level
EvaluationFlow everything,
get the waste out
Roll out critical path Action Benefit Recognition
•Process Model
•Walk Thru - capture data points
•Comparative Analysis
•Key Focus
•VSA
•Product
•Support
•Admin
•Focus the Team
•Immediate action
•Near–long term action
•Establish Vision for ideal State
•Model Cell
•Performance Model
•People policy
•Best Practice Deployment
•Right Org. Structure (skill mix)
•Right types of Actions
•JDI / Kaizen / Project
•KMI / KPI
•Leveraged Assy. Group
•Crew Planning
•Structured Transformation
•100% of Product Value stream is
integrated
•Supply pipeline is stabilized
•Capture labor Improvement
•Institutionalization of CPI
•Performance Based
Mgmt. decision using Leading
Indicators
•N/10 Structure
Model of Excellence
Qualified Bronze
Deliv
era
ble
Recognizable Deliverables each step of the way
tollgate levels as of (date):
Leader's Commitment
Organization
Value Stream Analysis
Rapid Improvement
Corrective Action / 6-Sigma
Policy Deployment
3P Breakthroughs
On-Demand
Defect-Free
1-By-1 Flow
Lowest Cost
Visual Management
Product Team Progress
Lean Conversion Tollgates:
0
1
2
3
4
Leader's Commitment
Organization
Value Stream Analysis
Rapid Improvement
Corrective Action / 6-Sigma
Policy Deployment
3P Breakthroughs
On-Demand
Defect-Free
1-By-1 Flow
Lowest Cost
Visual Management
THIS IS A 3 TO 5 YEAR JOURNEY.
tollgate 1: evaluation (choose Lean)
tollgate 2: Qualify (start basics)
tollgate 3: Bronze(biggest changes)
tollgate 4: Gold (go solo)
12
3
4
EvalQualify
Bronze
Gold
real
#'s
asap
managed
risk
newculture
JSF Assembly Control Tower
John Barney: Site Director
Current Program VOS Level:Qualifying
VOS Next Level Goal: Bronze
Gold Metics
Silver Metrics
Bronze Metrics
2009 AOP
Targets
YTD Act / Goal Act Goal Act Goal Act Goal Act Goal Act Goal Act Goal Act Goal Act Goal Act Goal Act Goal Act Goal Act Goal Act Goal
2009 6.8 4.76 4.11 27.70 52.75% 36,655
Jan-09 Acceptable Acceptable 5.2 6.8 13 4.76 4.61 4.11 23.8 27.70 45.3% 52.75% 26,583 36,655 97.7% 100% 55% 58% 36.7% 30.0% Complete Qrtly 2.5 2.5 95% 90%
Feb-09 Acceptable Acceptable 6.8 6.9 4.76 6.17 4.11 7.9 27.70 44.8% 52.75% 36,655 36,655 91.7% 100% 58% 58% 28.7% 30.0% 2.5 90%
Mar-09 Acceptable 6.8 6.9 4.76 6.17 4.11 7.9 27.70 52.75% 92.9% 100% 60% 58% 28.9% 30.0% 2.5 90%
Apr-09 Acceptable 6.8 4.76 4.11 27.70 52.75% 100% 30.0% Qrtly 2.5 90%
May-09 Acceptable 6.8 4.76 4.11 27.70 52.75% 100% 30.0% 2.5 90%
Jun-09 Acceptable 6.8 4.76 4.11 27.70 52.75% 100% 30.0% 2.5 90%
Jul-09 Acceptable 6.8 4.76 4.11 27.70 52.75% 100% 30.0% Qrtly 2.5 90%
Aug-09 Acceptable 6.8 4.76 4.11 27.70 52.75% 100% 30.0% 2.5 90%
Sep-09 Acceptable 6.8 4.76 4.11 27.70 52.75% 100% 30.0% 2.5 90%
Oct-09 Acceptable 6.8 4.76 4.11 27.70 52.75% 100% 30.0% Qrtly 3.0 90%
Nov-09 Acceptable 6.8 4.76 4.11 27.70 52.75% 100% 30.0% 3.0 90%
Dec-09 Acceptable 6.8 4.76 4.11 27.70 52.75% 100% 30.0% 3.0 90%
YTD Act / Goal Acceptable Acceptable 13.6 6.8 4.76 6.17 4.11 7.9 27.70 46.4% 52.75% 35,927 36,655 92.9% 100% 60.0% 58% 28.7% 30.0% 2.5 95% 90%
Key Points
1st Qtr
Key Points
2nd Qtr
SAFETY
Per Plan > 90%54%100% by 2Q09Per AOPAcceptable 15% Reduction 25% Increase20% Reduction 15% Reduction 15% Reduction
VOICE OF THE Customer
(VOC)
CUSTOMER
OSHA RATE
PEOPLEFINANCIALS
DEFECTS/1000 REALIZATION% ON TIME FOB
QUALITY
CUSTOMER
ESCAPES
(C-CARTS)
Starts/Completes On
Time PerformanceSTANDARDS
SCHEDULE
R3
Per AOP
MOS
COMPLIANCE
COMMUNICATION
PLAN
OT%
Direct Touch5S
3.0 by YE
2009 JSF Assembly Product Team
Yellow - Within 5% of Goal Green - Achieved Goal Blue - Not ApplicableRed - Missed Goal by >5%
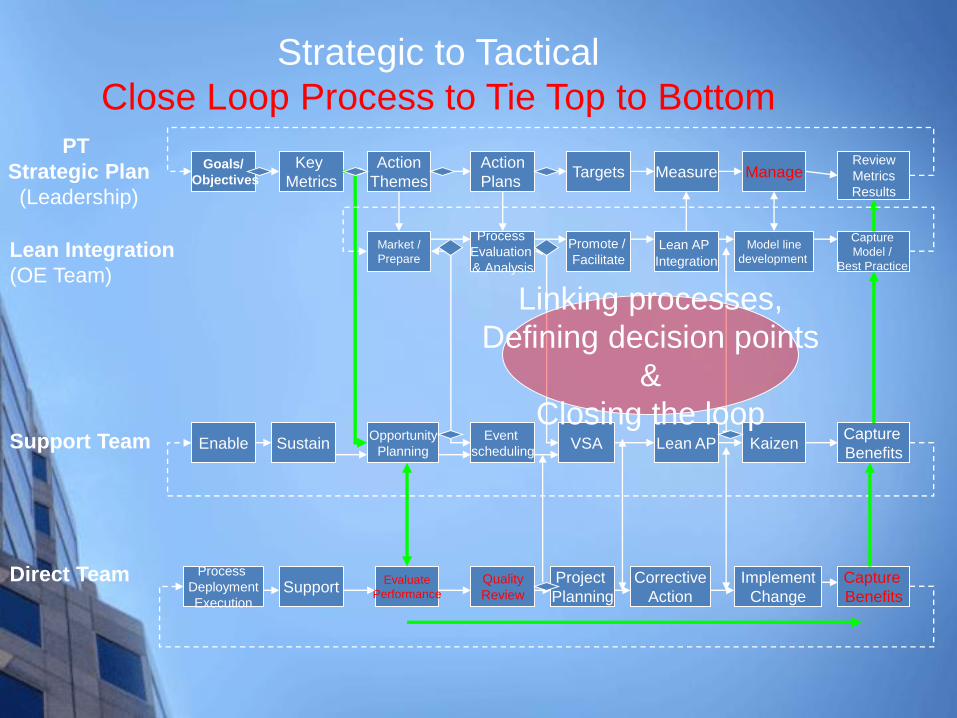
Goals/
Objectives
Key
Metrics
Action
Themes
Action
Plans Targets Measure
Promote /
Facilitate
Process
Evaluation
& Analysis
Market /
Prepare
VSA
Model line
development
Manage
Lean AP
Integration
Review
Metrics
Results
Capture
BenefitsKaizenLean AP
Event
scheduling
Capture
Model /
Best Practice
Opportunity
PlanningEnable SustainSupport Team
Lean Integration
(OE Team)
Direct Team Evaluate
Performance
Corrective
ActionSupport
Process
Deployment
Execution
Implement
ChangeQuality
Review
Project
Planning
Capture
Benefits
PT
Strategic Plan
(Leadership)
Strategic to Tactical
Close Loop Process to Tie Top to Bottom
Linking processes,
Defining decision points
&
Closing the loop

BSA-TPI COPY RIGHT 2015
2016- TYPICAL FAST TRACK Path Forward
100%
90%
100%
100%
90%
90%
%
Comp
100%
30 Days 60 Days 90 Days Beyond
Foundation Structure / Integration Create Capable Op Capture Benefit & Oper. Excellence
VOS / MOS Link Actions to Performance Drive Flawless Execution
Culture for Durable Continuous
Improvement
Performance Boards/Top Focus
Key Process Measures/Key Point
Sheets Assure Timely & Accurate Visibility Performance Management Benchmark Driven
Work Management System Make it Everyone's Job Stretch Goals 100% Compliant
Crew Plans - JDS - Multiple Person
Crew/High Level of Integration Competitive Requirements Preventive Bar Charts / Progress Charts - High
Rate or (1) person
Balanced Score Card w/ Leading
Indicators (Measure all functions) Proactive
L.O.B. Charts - Critical Parts
Comprehensive Action w/discrete
measures of successPredictive
Line Move- Ld / Unld – Recovery
Plans
Assure Progress on High Impact
items OP Excellence Steering CommitteeMeasurable Savings plotted on
performance metrics
Participative Leadership
Daily Board Walk-status Constraint Management
Wkly Skip Level Job Delays
Support Task @ Walk Thrus
Targeted High Impact
Improvements
-JDI Process & Challenge
-Event Driven
Establish Mechanisms to put Emphasis
on Progressive Thinking
-Projects
SME Development
Align Org. for Common
Goals/Objectives
Focus
360 0
Resource Allocation
April May June July Aug Oct
80%
75%
50%
100%
50%
%
Comp
60%Institutionalize Lean Concepts
•QCPC
•In Process Measures
•Kaizen Daily
Flexible Workforce
•SDWT
CPI Environment
Challenged Environment
VMS/Leadership Focus QCPC/QIP FocusAssure Total/Engagement to
Make Targets - FocusCPI Focus

BSA-TPI COPY RIGHT 2015
FAST TRACK REQUIRES GETTING EXPECTATIONS
VISUAL ON FACTORY FLOOR
# of Critical Paths
# Short
Bad Rivets
High Pins
MOS Board
1 2
3
4
1 - Fasteners
2 – Missing Parts
3 – Broken Tool
4 – Waiting on Insp

BSA-TPI COPY RIGHT 2015
Expectations /Communication
Everyone Must have complete
understanding
SOS / MOS
Know the Burning Platform
Staying on the same page- Make believers out of all
Daily-seeing & talking (crew plans/PCB’s/JDS) 5 second look
Daily-Documenting key points & publishing
Weekly-Reporting (Ops perf 5 charts/variance summary/Projection for next week)
Monthly-Reporting (PT perf 5 charts/IF/Projects w/CPI’s noted)
Qtrly-Reporting / All Hands (Town Hall)

BSA-TPI COPY RIGHT 2015
JOHN BARNEY-DOCUMENTED CREDIBILITY
Daniel Tulcan
Sr Supply Chain Manager at The Boeing Co
Over the past 20 years I have had the opportunity and pleasure to interface
with John in a number of different capacities. I have known John to be a very strong leader and a
very mature professional with a broad knowledge of the Aerospace Industry. John is unique in
the capacity to define processes from the earliest parts of the value stream to final delivery and
customer use. John has a unique ability to coach, mentor and lead his direct reports while
ensuring that he transfers company vision into detailed actionable plans that all can understand
and follow. I have witnessed John take companies and organizations from the brink of failure to
bench mark models in the industry by deploying Lean Principles and innovative factory
improvements. His keen sense of waste identification in any process allows him to pinpoint areas
of instability and bottlenecks in the process and define immediate containment and corrective
action. His continuous improvement attitude is a catalyst for company growth and cost savings
throughout the value stream ensuring that first time quality is delivered to the customer at the
negotiated schedule. The number one factor that distinguishes John from his peers is his
personal care for people and his dedication to coach mentor and develop his team. His genuine
concern for the wellbeing and advancement of his team are evident by the personal sacrifices he
makes to ensure that the team needs are met before anything else. John will always seek a win -
win solution ensuring that all this decisions take his team into consideration.
I would recommend John for any Executive position with any Manufacturing or Service
Company with confidence that he will be successful no matter how large or difficult the
task may be.
Mike Baldridge
DIRECTOR
Operations at Lockheed Martin AeronauticsJohn is a enthusiastic executive manager that utilizes his people skills and
knowledge to get any job done to a high degree of precision. John has been
instrumental in achieving success at several high profile / intense operations.
John has always been a pleasure to work alongside and I would never
hesitate to have John as a teammate. My most memorable and productive
years of my career were when working with John.
Debrah Bishop
Vice President at D. Edwards, Inc.John provided exceptional leadership for my group by assuring we
employed Key Measures that we could link to operations and assured we
Observe, Decide, and Act upon those elements. John is a champion for
implementing Lean manufacturing principles and was a constant force in
assuring success. John provided the style of leadership that employed
effective team work and employee involvement. Johns commitment to
success motivated and inspired his team to excel. John exemplified the
“trust” element that instilled total commitment for his company.
MARTON PRECISION MANUFACTURING
To whom it may concern:
John Barney has been an employee in good standing of Marton Precision
Manufacturing for six years and we are sorry to see him go. John brought to our
company three significant strengths that have been very beneficial to us. First,
he has a very broad and vast level of work experience, which has allowed him to
develop a Significant network of valuable industry contacts. This network provides John
with significant insight into trends and changes happening in a variety of industries,
particularly aerospace. It has also been beneficial to us in identifying and securing
major pieces of business. Secondly, John is a continuous student of business. In
addition to his extensive work experience, John aggressively studies the news, industry
updates and technology trends, which allows him to have the ability to develop long
term strategies and direction. He also possesses a strong understanding of the tax and
laws affecting businesses today and has been instrumental in guiding
us through several situations that have benefited our company to date. Third, John is a
hardworking and dedicated employee. His word is his word. If John says he will get
something done, you can bank on t. John is an incredibly driven person with high
morals. Finally, John has made it his personal agenda to train, coach, and mentor our
employees to help them achieve the goals they want in business and life. It is these
same employees, who have been instrumental in our efforts to grow our business, as
we have been so successful in doing during John's tenure as CEO of our company.
We wish John all the best of luck in his future endeavors.
Thomas P Bengard
Bob VoseVP MANUFACTURING –BOEING C17
John held two key leadership positions for the C17 Long Beach, with
progressive responsibility. As a Director of Production, he provided
vision for future process design, re-engineering, and technological
enhancements, supported strategic business and planning objectives
that set new standards for the corporation. John leadership was
instrumental in establishing the ‘Factory of the Future’. John has
proven himself as a Visionary and a Strategic leader, one that
produced results that are reflected in the bottom line company performance.