metropolitan council environmental services about …s3.amazonaws.com/zanran_storage/... ·...
TRANSCRIPT
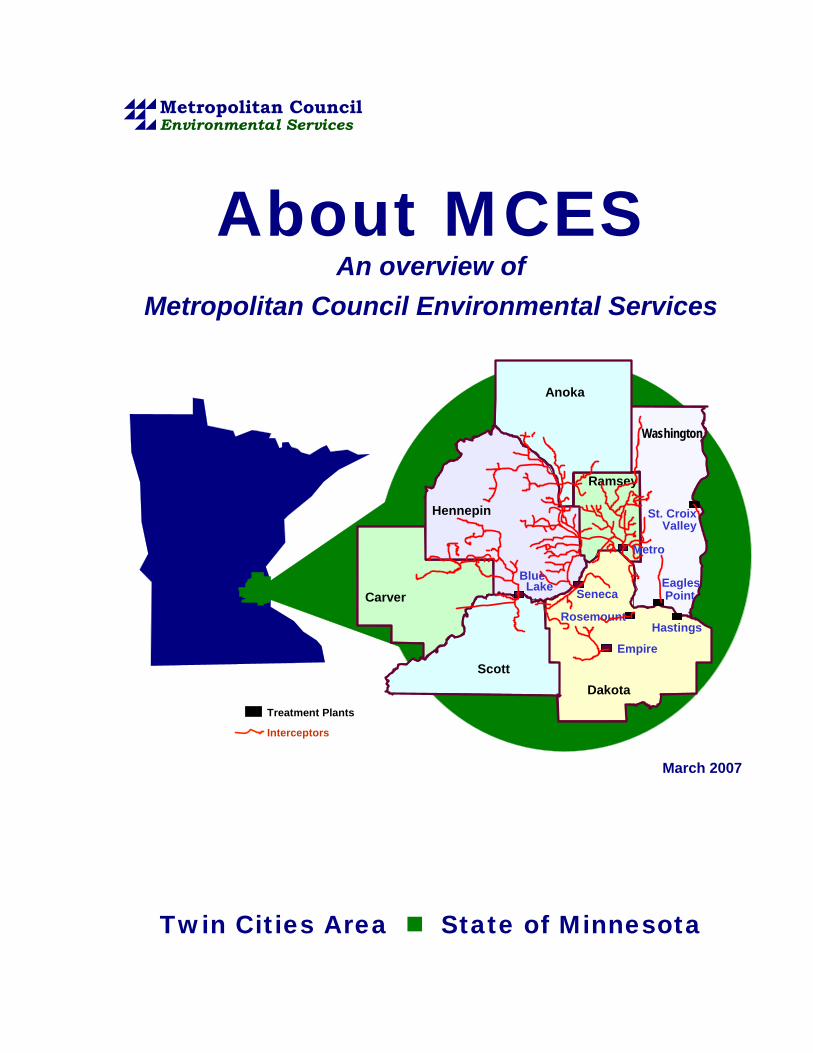
Metropolitan CouncilEnvironmental Services
About MCES An overview of
Metropolitan Council Environmental Services
St. CroixValley
Hastings
EaglesPoint
Rosemount
Empire
BlueLake Seneca
Metro
Anoka
Washington
Hennepin
Carver
ScottDakota
Ramsey
Treatment Plants
Interceptors
March 2007
Twin Cities Area State of Minnesota


Table of Contents Introduction ............................................................................................................................. 1 MCES’s Organization Chart .................................................................................................... 3 General Manager’s Office .......................................................................................................4 Interceptor Services Department ............................................................................................ 6 Treatment Services Department ............................................................................................. 7 Metropolitan Wastewater Treatment Plant ..................................................................... 9 Empire Wastewater Treatment Plant ........................................................................... 11 Rosemount Wastewater Treatment Plant .................................................................... 12 Eagles Point Wastewater Treatment Plant................................................................... 13 Hastings Wastewater Treatment Plant......................................................................... 14 St. Croix Valley Wastewater Treatment Plant .............................................................. 15 Seneca Wastewater Treatment Plant........................................................................... 16 Blue Lake Wastewater Treatment Plant....................................................................... 17 104 Communities Served by MCES’s Eight Treatment Plants..................................... 18 Technical Services Department ............................................................................................ 19 Environmental Quality Assurance Department ..................................................................... 20 Workforce Profile................................................................................................................... 22


1
Introduction Metropolitan Council Environmental Services (MCES) is one of three divisions of the Metropolitan Council. MCES collects and treats wastewater at its eight regional treatment plants. In providing this service to more than 90 percent of the seven-county metropolitan area’s population, MCES:
Operates and maintains approximately 600 miles of regional sewers that connect flow from 5,000 miles of sewers owned by 104 communities,
Capacity to treat 372 million gallons of wastewater daily at eight regional treatment plants,
Continues to achieve near-perfect compliance with federal and state clean water standards,
Establishes user fees that pay 100 percent of wastewater operations and debt service costs.
Maintains wastewater service rates consistently below the national average,
Works with more than 800 industrial clients to substantially reduce the amount of pollution entering our wastewater collection system,
Provides water resources monitoring and analysis for the region,
Partners with numerous public, private and nonprofit groups committed to a clean environment, and
Provides water supply and water resources planning for the seven-county metropolitan area.
MCES General Manager: William G. Moore
Metropolitan Council Environmental Services’ Mission Statement
The mission of Metropolitan Council Environmental Services (MCES) is to provide wastewater services that protect the public health and environment while supporting regional growth.

2

3
ENVIRONMENTAL SERVICES DIVISIONWilliam G. Moore, General Manager
AdministrationKaren Neis, Director
MCES Financial Managementand Planning
Jason Willett, Director
SafetyGary Hughes, Manager
EnvironmentalQuality Assurance
Keith ButtlemanAssistant General Manager
Technical Services
Bryce PickartAssistant General Manager
Treatment Services
Leisa ThompsonDeputy General Manager
Interceptor Services
Bill MoellerAssistant General Manager
Interceptor Area–Maintenance
Interceptor Area–Operations
Interceptor Area–Metering/Alarm
InterceptorEngineering
FleetManagement
Metro PlantLiquidsBusiness Unit
Metro PlantSolids ManagementBusiness Unit
EastBusiness UnitEmpire PlantRosemountPlantEagles PointPlantHastingsPlantSt. Croix ValleyPlant
SouthwestBusiness UnitSeneca PlantBlue LakePlant
Maintenanceand SecurityBusiness Unit
Support ServicesBusiness Unit
EngineeringServices
ConstructionServices
Drafting &Records
Industrial Waste/PollutionPrevention
Analytical (Lab)Services
EnvironmentalCompliance
EnvironmentalMonitoring –Water and AirQuality
Research andDevelopment
Water ResourcesAssessment
Water SupplyPlanning
Contracts and ProcurementRichard Halsted, Manager

4
General Manager’s Office (Administration, Financial Management and Planning, Safety, and Contracts and Procurement)
The General Manager’s Office includes staff for Administration, Financial Management and Planning, Contracts and Procurement, and Safety. The Offices of Administration and Financial Management and Planning provide expertise in finance and administration specific to the needs of MCES customers, staff and partners. In addition, both offices provide coordination with the regional administration departments of the Metropolitan Council.
Financial Overview. Resource allocation decisions are driven by the Council’s policy and plans and MCES’s performance objectives that align with those plans. MCES is a user-fee based organization, which is run as an enterprise. The Council’s rate-setting philosophy is that user classes should each pay their “cost of service.”
Revenues include the volume-based municipal wastewater charge, industry-specific charges, service availability charges (SAC), and miscellaneous revenues. Municipal wastewater charges account for 75.4 percent of total revenues and are determined by a utility-like rate that reflects the cost of providing service based on the volume of use. This rate is a wholesale rate that MCES charges to its customer communities. The communities charge their residents (customers) a retail rate that is specific to their city and covers their administrative and infrastructure costs.
Expenses fall into three major categories. The largest, debt service, includes costs of infrastructure planning, design, construction and rehabilitation. Labor is the second largest and includes all staff costs including salaries, wages, and benefits. The third category, non-labor, includes costs for utilities, chemicals, materials and supplies, and contracted services. MCES’s revenue and expense categories are represented in the following graphic.
Revenue and Expense Categories: Based on MCES’s 2007 Operating Budget
MunicipalWastewater
Charges
75.4%
Industry-specificCharges: 4.9%
SAC*Transfer
17.8%
Other: 1.9%
*SAC = Service AvailabilityCharge
Non-Labor
28%
MCESLabor
29.8%
DebtService
42.2%

5
MCES’s 2007 Annual (Operating) Budget. The rate for the 2007 operating budget is approximately $152.6 per 100,000 gallons of treated wastewater. The budget is based on actual systemwide flows from June 2005 to June 2006 of 95.6 billion gallons. Budgeted revenues and expenses for 2007 are shown in the following table:
MCES’s 2007 Operating Budget ($s in millions)
REVENUES EXPENSES Municipal Wastewater Charges $146.0 Program: Labor $57.8 SAC Transfer 34.6 Program: Non-Labor 53.0 Industry-Specific Charges 9.4 Debt Service 81.8 Other Revenue 3.6 Other Expenses 1.0
Total Revenue $193.6 Total Expenses $193.6
The MCES budget process includes interaction with the MCES Management Team, Regional Administration staff and municipal and industrial customers. The result is financial planning that incorporates funding for new and existing programs essential to the goals of the Council, MCES and our customers. MCES’s budget is incorporated into the Council’s Unified Budget and is approved in December of each year.
MCES’s 2007 Capital Budget. The 2007 capital budget, which consists of the project expenses for all of the active projects in the capital program, is $127 million.
Capital planning takes place at several levels. Long-range master plans have been developed for the interceptor system and treatment plants. These master plans are updated periodically to reflect the most recent demographic forecasts and impacts from local comprehensive plans, federal and state regulations and permits, and other relevant factors. These plans have been incorporated into the 2005 Water Resources Management Policy Plan. The Policy Plan also contains policies and strategies for efficiently and effectively addressing pollution from point sources and non-point sources (runoff) to achieve regional water quality goals. Facility plans evaluate alternative solutions for specific projects, recommend facilities and estimate costs and timing, and evaluate the impacts of a project.
Finally, during project implementation, projects are delivered through one of two procurement options:
Public ownership and financing: using a design-bid-build procurement.
Public ownership and financing: using a design-build procurement.
MCES’s 2007 Capital Budget ($s in millions)
Rehabilitation Costs $ 57.2 Expansion Costs 62.2 Quality Improvement Costs 7.6
TOTAL COST $127.0 Major ongoing capital projects and their associated costs are shown on page 20 of this document.
Expansion
Rehabilitation
46%
46%8% Quality
Improvement
Total Program2007–2012:$991 million

6
Interceptor Services Department (Maintenance, Operations, Metering/Alarm, Interceptor Engineering, and Fleet Management)
Metro-area homes and industries are connected to MCES’s treatment plants through an extensive network of sewer pipes. Each community in the Twin Cities metropolitan area maintains the sanitary sewer pipes from homes or industries; these sewer pipes connect to regional “interceptor” sewers. MCES’s Interceptor Services Department operates and maintains the infrastructure necessary for the collection and transport of wastewater from 104 community sewer systems to the eight MCES-operated wastewater treatment plants. The infrastructure includes approximately 600 miles of interceptors, which can be up to 12 feet in diameter; 61 lift stations, which pump the flow to keep it moving toward the treatment plants; and 190 meter stations, which measure the flow from each community and help determine each community’s share of cost.
The interceptor network is closely monitored by a sophisticated computerized telemetry system that provides continuous data and monitors the status of MCES facilities, flow meters and regulators. Data is transmitted to the Regional Maintenance Facility dispatch center in Eagan. Dispatchers staff the center 24 hours a day, 365 days a year. Interceptor Services’ staff work at and out of the Regional Maintenance Facility in Eagan and the Mounds View and Mound lift stations.
Minn. R.
INTERSTATE
35W
INTERSTATE
494INTERSTATE
35E
Burnsville
5
RegionalMaintenance
Facility
77 13
110Richfield
WestSt. Paul
Mallof Am.
A recent phase of the Northeast sewer construction project in White Bear Township and White Bear Lake used horizontal directional drilling methods to install the pipeline rather than the traditional open-trench pipe installation.

7
Treatment Services Department (Six Business Units: Metro Plant Liquids, Metro Plant Solids Management, East, Southwest, Maintenance and Security, and Support Services; and Eight Treatment Plants)
The Treatment Services Department provides overall operation and maintenance of the system’s wastewater treatment plants. About 260 million gallons of wastewater are treated daily at the eight regional plants. Treatment Services is the largest of MCES’s four departments; approximately 75 percent of the staff positions are budgeted in this department.
The department is organized in six business units. Because of its size and complexity, the Metro Plant is divided into two business units: Liquids and Solids Management. The East Business Unit includes five plants: Empire, Rosemount, Eagles Point, Hastings and St. Croix Valley. The Southwest Business Unit includes Seneca and Blue Lake. The remaining two business units —Maintenance Services and Support Services — serve all eight plants.
The Metro Plant Liquids Business Unit is responsible for two basic stages in the treatment of wastes: primary and secondary. In the primary stage, solids are allowed to settle and are removed from the wastewater. The secondary stage uses biological processes to further purify the wastewater. In the Metro Plant’s liquids process, these stages are combined into one operation.
The Metro Plant Solids Management Business Unit processes sludge produced by the Liquids Business Unit. Solid waste is created from the liquid sewage by separating as much liquid from the solids as possible, creating sludge cakes to be processed by incineration. Ash, a by-product of this process, is stored and loaded into trucks for private contractors who service the concrete industry. This business unit also produces and distributes the steam used to heat all parts of the Metro Plant.
Barely into its second year of full operation, the new Solids Management Building earned a prestigious “2006 National Environmental Achievement Award” from the National Association of Clean Water Agencies (NACWA). The award, in the operations category cited the successful planning, design, construction and operation of the facility. In addition, the Minnesota Public
PLANTS OPERATING 24/7
St. CroixValley
Hastings
EaglesPoint
Rosemount
Empire
BlueLake
Seneca
Metro
Anoka
Washington
Hennepin
Carver
Scott
Dakota
Ramsey
Liquids and Solids Management Business Units*
Southwest Business Unit
East BusinessUnit
*Maintenance and Security, and Support Services Business Units serve all 8 plants.

8
Works Association presented MCES with a “2006 Project of the Year Award” for this new state-of-the-art facility which has dramatically reduced air emissions, energy usage, and costs.
The East Business Unit and Southwest Business Unit work in various capacities (at seven plant sites listed on the previous page) to provide quality service to all communities and customers in the metro area not serviced by the Metro Plant.
The Maintenance and Security Business Unit provides service and technical guidance to all of MCES’s facilities in support of short- and long-range operating plans. Staff in this unit (electricians, machinists, painters, pipefitters, warehouse workers, security specialists, and maintenance operators) proactively maintain the assets of the division.
The Support Services Business Unit provides technical support throughout the Treatment Services Department. Staff in this unit include engineers, environmental scientists, computer system specialists and administrative support personnel.
Award-Winning Treatment Performance NACWA Awards: In early 2006 MCES was awarded several Peak Performance Awards from the National Association of Clean Water Agencies. The organization represents the nation’s 300
largest wastewater collection and treatment utilities and their more than 500 treatment plants. The Seneca Plant heads the list this year, earning a Platinum Award for achieving five consecutive years (2001–2005) of full compliance with clean water discharge permits. This is the second platinum award for the Seneca Plant which registered full compliance from 1994 through1998. Plants earning Gold Awards for full compliance during 2005 were Empire, Hastings, Metro, Rosemount and St. Croix Valley.
MPCA Awards: The Minnesota Pollution Control Agency recognized six treatment plants for outstanding operation, maintenance and management from October 2004 through September 2005. The Empire, Hastings, Metropolitan, Rosemount, St. Croix Valley and Seneca Plants earned certificates of commendation at the annual MPCA awards program in March 2006.
The following pages provide information on the treatment plants and the areas they serve. More information on business units and plants can be found on MCES’s Intranet and Internet sites.

9
Metropolitan Wastewater Treatment Plant
Built in 1938 near Pig’s Eye Lake in St. Paul, the Metro Plant was the first wastewater treatment plant in a major city located on the Mississippi River. It is the largest treatment facility in Minnesota and is among the nation’s largest, treating an average of 185 million gallons per day (mgd) of wastewater from 65 communities and 617 industries. About 75 percent of the wastewater generated in the Twin Cities metropolitan area is treated at the Metro Plant.
The Metro Plant utilizes the activated-sludge process for treating wastewater to an advanced secondary treatment level prior to discharge to the Mississippi River. A very high level of ammonia, phosphorus and other conventional pollutants are removed. Sludge is processed by thickening, chemical and/or thermal conditioning and high-pressure or centrifugal dewatering prior to incineration. Ash from incineration is transferred off-site for beneficial use. Energy recovered as steam in the waste-heat boilers is used to heat buildings, to thermally condition sludge, or to power steam turbines.
Metro Plant Statistics Located in: St. Paul, Minnesota
Type: Advanced secondary with chlorination/dechlorination
Capacity: 251 million gallons/day
Discharges to: Mississippi River
Communities served: 65
Population served: 1.8 million
Interceptors to plant: 332 miles
Mpls.
St. Paul
MississippiRiver
MinnesotaRiver Metro Plant
INTERSTATE
694INTERSTATE
94INTERSTATE
35E
INTERSTATE
494
61U.S.
Plant Capacity: From 1990 projected to 2030
0
50
100
150
200
250
300
1990 2000 2010 2020 2030
Millions of gallons per day (mgd)
Capacity Flow
0
50
100
150
200
250
300
1990 2000 2010 2020 2030
Millions of gallons per day (mgd)
Capacity Flow

10
The plant has an excellent environmental record and regularly earns state and national awards for operational excellence (refer to the award information on pages 8 and 9).
Originally designed as a primary treatment facility to treat an average flow of 134 million gallons of wastewater per day, the plant has been expanded four times and upgraded to its current advanced secondary treatment level with chlorination/dechlorination.
A major upgrade to the Metro Plant was completed in 2004 which included full biological phosphorus removal capability, state-of-the-art solids processing and air emissions control technology, energy recovery systems, and rehabilitation of the pre-treatment and primary facilities. Operation of the new Solids Management Building began in 2004. The building includes three fluid-bed incinerators, dewatering equipment, energy recovery and pollution-control systems, and a process for preparing up to 10 percent of the solids to be safely applied to agricultural land. The building processes about 220 dry tons of solids per day.
In addition, completed Metro Plant odor control projects have greatly reduced the number of complaints from citizens in the plant neighborhood.
Information on upgrades and projects at all eight of the treatment plants can be found in MCES’s Capital Improvement Plan (CIP) and MCES’s Summary Budget. These documents are available from the Council’s Data Center or on MCES’s Intranet and Internet Web sites.
Metropolitan Plant Solids Management Building
“2006 National Environmental Achievement Award” from NACWA
Additional covers installed on primary settling tanks to improve odor control.

11
Empire Wastewater Treatment Plant
Built in 1979, the Empire Plant, located in Empire Township, provides wastewater treatment for five communities in the southeast metro area. The facility serves a population of 134,000 and treats an average of 8.5 mgd. The facility is a two-stage, activated sludge plant followed by effluent filtration to provide advanced treatment and ammonia removal. Recent construction has increased the plant’s capacity from 12 mgd to 24 mgd, which will accommodate the rapidly expanding growth in the current and future service areas. The sludge from the plant is thickened, anaerobically digested and dewatered, stored onsite, and then spread on farmland. Empire Plant Statistics Located in: Empire Township Type: Advanced secondary with ultraviolet disinfection Capacity: 24 million gallons/day Discharges to: Vermillion River Communities served: 5 Population served: 134,000 Interceptors to plant: 16 miles
Recognizing that doubling the discharge of treated wastewater to the small, environmentally sensitive Vermillion River could harm the river, the Council has chosen to pump treated wastewater through a new 13-mile pipe being built from the Empire Plant to the Missisippi River in Rosemount. This pipe, along with a new interceptor to convey wastewater from the current Rosemount Plant to the Empire Plant, is scheduled for completion in 2008. At that time, MCES will close the Rosemount Plant, the smallest of eight in the system.
Hastings
Vermillion R.
Minn. R
.
St.
Cro
ix R
.
Miss. R.
61U.S.
EmpirePlant
52U.S.3
INTERSTATE
494
INTERSTATE
35E
INTERSTATE
35W
Plant Capacity: From 1990 projected to 2030 Millions of gallons per day (mgd)
048
1216202428
1990 2000 2010 2020 2030
Capacity Flow
Millions of gallons per day (mgd)
048
1216202428
1990 2000 2010 2020 2030
Capacity Flow
Included in the plant upgrade are four new clarifiers, new aeration tanks with above-ground piping, generator building, effluent pump station and ultraviolet disinfection facility.

12
Rosemount Wastewater Treatment Plant
The Rosemount Plant is MCES’s smallest facility, treating an average of 800,000 gallons per day. Built in 1973, the plant was operated in cooperation with the U.S. Environmental Protection Agency as a demonstration project using a physical/chemical treatment process. That process proved inefficient, and in 1989 the plant was rebuilt and expanded using conventional biological treatment—an aerated pond system. Secondary treatment is provided with effluent discharged to the Mississippi River. Solids production is minimized in the aerated pond process; removal of slowly accumulating sludge inventory is provided for on a periodic basis. The facility serves most of the city of Rosemount and received a Gold Award from NACWA in 2006 for full compliance with clean water discharge permits in 2006. Rosemount Plant Statistics Located in: Rosemount, Minnesota Type: Aerated ponds with UV disinfection Capacity: 1.4 million gallons/day Discharges to: Mississippi River Communities served: 1 Population served: 7,000 Interceptors to plant: 8 miles Due to growth in this service area, MCES will close the plant in 2008 and convey flow to the Empire Plant through a new interceptor. This interceptor is being built concurrently with the 13-mile outfall pipe that will convey effluent from the Empire Plant, through Rosemount to the Mississippi River. Meanwhile, interim improvements completed in 2003 have increased the plant capacity from 0.84 million gallons per day to 1.4 mgd. The plant treats an average of 1.0 mgd.
Hastings
Vermillion R.
Minn. R
.
St.
Cro
ix R
.
Miss. R
.
RosemountPlant
52U.S.3
INTERSTATE
494 61U.S.
INTERSTATE
35E
INTERSTATE
35W
Plant Capacity: From 1990 projected to 2020 Millions of gallons per day (mgd)
00.5
11.5
22.5
33.5
1990 2000 2010 2020Capacity Flow
Flow for this plant’s
area is expected to double by
2020.
See information
above.
Millions of gallons per day (mgd)
00.5
11.5
22.5
33.5
1990 2000 2010 2020Capacity Flow
Flow for this plant’s
area is expected to double by
2020.
See information
above.

13
Eagles Point Wastewater Treatment Plant
Located in Cottage Grove overlooking the Mississippi River, the Eagles Point Plant began service in September 2002, replacing the old Cottage Grove Plant that had been in operation since 1962. The new treatment plant has a capacity to treat 10 million gallons of wastewater per day. It provides primary and secondary treatment to wastewater before discharging it to the Mississippi River. Biosolids are processed and applied to farmland or transported to the Metro Plant in St. Paul for treatment.
The plant’s capacity should be sufficient to serve the growing area until approximately 2030, at which time it could be expanded to 20 million gallons per day. The plant’s liquid treatment facilities opened in the fall of 2002 and the solids treatment facilities opened in fall 2003. Ten miles of interceptors to the plant began service in 2005, which increased the flow to be treated from an average of 2.2 mgd to 4.2 mgd.
In 2006, the Eagles Point Plant earned a Gold Award from NACWA for permit compliance during 2005 (refer to awards information on page 9).
Eagles Point Plant Statistics Located in: Cottage Grove, Minnesota Type: Advanced secondary with ultraviolet disinfection Capacity: 10 million gallons/day Discharges to: Mississippi River Communities served: 2 Population served: 60,000
Interceptors to plant: 10 miles
Plant Capacity: From 1990 projected to 2030 Millions of gallons per day (mgd)
0
2
4
6
8
10
12
1990 2000 2010 2020 2030
Capacity Flow
Millions of gallons per day (mgd)
0
2
4
6
8
10
12
1990 2000 2010 2020 2030
Capacity Flow
INTERSTATE
494 61U.S.
INTERSTATE
94
INTERSTATE
35EINTERSTATE
35WHastings
Minn. R
.
St.
Cro
ix R
.
Miss. R.
Eagles PointPlant
Mpls. St. Paul

14
Hastings
Vermillion R.
Minn. R
.
St.
Cro
ix R
.
Miss. R
.
61U.S.
HastingsPlant
52U.S.3
INTERSTATE
494
INTERSTATE
35E
INTERSTATE
35W
Hastings Wastewater Treatment Plant
Located in the city of Hastings along the Mississippi River, the Hastings Plant earned a national NACWA Gold Award in 2005 for perfect compliance with clean water discharge permits (see page 9 for more award information). It serves about 20,000 residents in Hastings, treating an average of 1.6 million gallons per day before discharging to the Mississippi River.
Hastings Plant Statistics Located in: Hastings, Minnesota Type: Advanced secondary with chlorination/dechlorination Capacity: 2.9 million gallons/day Discharges to: Mississippi River Communities served: 1 Population served: 21,000 Interceptors to plant: none
The original Hastings Plant was built in 1955. The plant was expanded and renovated between 1983 and 1986 at a cost of $8.3 million; 75 percent of this amount was provided by the Federal Government and 15 percent by the State of Minnesota. Odor control for the aeration tanks was added in 1989. The Hastings Plant utilizes biological treatment technology. Biosolids are transported to the Metro Plant in St. Paul for treatment and beneficial use.
Designed to treat an average wastewater flow of 2.9 million gallons per day, the plant will reach the end of its useful life by about 2015. A new site on the eastern edge of the city has been acquired and planning has begun for building a new plant.
Plant Capacity: From 1990 projected to 2030 Millions of gallons per day (mgd)
0
2
4
6
1990 2000 2010 2020 2030
Capacity Flow
Millions of gallons per day (mgd)
0
2
4
6
1990 2000 2010 2020 2030
Capacity Flow

15
St. Croix Valley Wastewater Treatment Plant
The St. Croix Valley Plant is MCES’s only facility located on the scenic St. Croix River, a nationally protected waterway. It was also MCES’s first facility to use ultraviolet (UV) disinfection during the normal treatment process. The plant was built in 1959 and upgraded or expanded in 1970, 1973 and 1993, and currently treats an average of 3.1 million gallons per day. The plant earned a Gold Award from NACWA for permit compliance during 2005 (refer to Peak Awards information on page 9). Additionally, in 2001 the U.S. Environmental Protection Agency named the St. Croix Valley Plant the “Best Medium Advanced Facility” in its Great Lakes Region (Region 5). St. Croix Valley Plant Statistics Located in: Oak Park Heights, MN Type: Advanced secondary with ultraviolet disinfection Capacity: 5.8 million gallons/day Discharges to: St. Croix River Communities served: 3 Population served: 23,000 Interceptors to plant: 2 miles The St. Croix Valley Plant has a design capacity to treat 5.8 million gallons of wastewater per day. The plant provides primary, secondary and advanced treatment, including the removal of phosphorus from the effluent before discharging it into the St. Croix River. Biosolids are transported to the Metro Plant in St. Paul for treatment and beneficial use. The plant also utilizes extensive odor control facilities to protect neighbors from nuisance odor. Waste sludge is thickened and hauled to the Metro Plant interceptor system for final disposition. The plant provides service to approximately 23,000 people in the cities of Bayport, Stillwater and Oak Park Heights. Based on the latest flow projections, the plant will reach its design capacity about 2020.
Stillwater
St. Croix R
.
61U.S.
61U.S. INTERSTATE
494
INTERSTATE
694
INTERSTATE
694
INTERSTATE
94
Maplewood
N. St. P
aul
St. Paul
36
St. CroixValleyPlant
Plant Capacity: From 1990 projected to 2030 Millions of gallons per day (mgd)
22.5
33.5
44.5
55.5
6
1990 2000 2010 2020 2030
Capacity Flow
Millions of gallons per day (mgd)
22.5
33.5
44.5
55.5
6
1990 2000 2010 2020 2030
Capacity Flow

16
Seneca Wastewater Treatment Plant
Located on the Minnesota River in Eagan, the Seneca Plant is MCES’s second largest facility. The plant serves approximately 234,000 people in the communities of Eagan, Bloomington, Burnsville and Savage and parts of Inver Grove Heights, Edina, Lakeville and Apple Valley. Built in 1972, the plant is the third largest in the state (after the Metro Plant and a facility in Duluth). A $70 million expansion completed in 1992 increased the plant’s capacity from 24 to 39 million gallons per day. The plant treats an average of 24 mgd.
The plant regularly earns state and national awards for operational excellence. The Seneca Plant was awarded the prestigious “Excellence in Operation and Maintenance Award” from the U.S. Environmental Protection Agency in 2004 for being chosen the runner-up in the large advanced facility category for the six-state Great Lakes Region. The plant earned a Platinum Award from NACWA for five consecutive years of permit compliance during 2005 (refer to Peak Awards information, page 9). Seneca Plant Statistics Located in: Eagan, Minnesota Type: Advanced secondary with chlorination/dechlorination Capacity: 39 million gallons/day Discharges to: Minnesota River Communities served: 8 Population served: 245,000 Interceptors to plant: 46 miles
The Seneca Plant provides primary and secondary treatment to wastewater before discharging it to the Minnesota River. Dewatering and incineration are the methods used for disposal of the biosolids generated during wastewater treatment. The plant utilizes biological phosphorus removal to meet annual average compliance levels for effluent phosphorus.
Plant Capacity: From 1990 projected to 2030 Millions of gallons per day (mgd)
0
10
20
30
40
1990 2000 2010 2020 2030
Capacity Flow
Millions of gallons per day (mgd)
0
10
20
30
40
1990 2000 2010 2020 2030
Capacity Flow
Minn. R.
INTERSTATE
35W
INTERSTATE
494INTERSTATE
35E
Burnsville
5
SenecaPlant
77 13
110Richfield
WestSt. Paul
Mallof Am.

17
Blue Lake Wastewater Treatment Plant
Blue Lake, the third largest MCES plant, is the fourth largest plant in Minnesota. Located on the Minnesota River in Shakopee, the Blue Lake Plant treats an average of 28 million gallons of wastewater per day. In 1998 the plant earned a national NACWA Platinum Award for five consecutive years of perfect compliance with clean water discharge permits.
Blue Lake Plant Statistics Located in: Shakopee, Minnesota Type: Advanced secondary with chlorination/dechlorination Capacity: 38 million gallons/day Discharges to: Minnesota River Communities served: 28 Population served: 275,000 Interceptors to plant: 108 miles
The Blue Lake Plant has a design capacity to treat 38 million gallons of wastewater per day. The plant provides primary and secondary treatment to wastewater before discharging it to the Minnesota River. The plant utilizes biological phosphorus removal to meet annual average effluent phosphorus levels of 1 mg/l or less. A new thickening and dewatering facility began operation in the fall of 2000. The heat-drying facility is operated under contract by the New England Fertilizer Company (NEFCO). The heat-dried biosolids are pelletized for use as a fertilizer. Construction is occurring at the plant to provide increased process reliability and add treatment capacity to meet long-term service needs of the area.
Blue LakePlant
INTERSTATE
494
INTERSTATE
35E
INTERSTATE
35W
13101
169U.S.
St. PaulMinneapolis
Savage Burnsville
Plant Capacity: From 1990 projected to 2020 Millions of gallons per day (mgd)
0
10
20
30
40
50
1990 2000 2010 2020 2030
Capacity Flow
Millions of gallons per day (mgd)
0
10
20
30
40
50
1990 2000 2010 2020 2030
Capacity Flow

18
104 Communities Served by MCES’s Eight Treatment Plants Communities listed in italic are served by more than one plant.
METRO PLANT Andover Anoka Arden Hills Birchwood Blaine Brooklyn Center Brooklyn Park Centerville Champlin Circle Pines Columbia Heights Columbus Coon Rapids Corcoran*
Crystal Dayton* Edina Falcon Heights Forest Lake Fridley Gem Lake Golden Valley Hassan Township* Hilltop Hopkins Hugo Inver Grove Heights Lake Elmo
Landfall Lauderdale Lexington Lilydale Lino Lakes Little Canada Mahtomedi Maple Grove Maplewood Medicine Lake Medina Mendota Mendota Heights Minneapolis
Mounds View New Brighton New Hope Newport North Oaks North St. Paul Oakdale Osseo Plymouth Ramsey Richfield Robbinsdale Roseville Shoreview
South St. Paul Spring Lake Park St. Anthony St. Louis Park St. Paul St. Paul Park Vadnais Heights West St. Paul White Bear Lake White Bear Lake TwpWillernie Woodbury
EMPIRE PLANT ROSEMOUNT PLANT
EAGLES POINT PLANT
HASTINGS PLANT
Apple Valley Empire Township Farmington Lakeville Rosemount Elko/New Market*
Rosemount Cottage Grove Woodbury Lake Elmo*
Hastings
ST. CROIX VALLEY PLANT
SENECA PLANT BLUE LAKE PLANT
Bayport Oak Park Heights Stillwater
Apple Valley Bloomington Burnsville Eagan Edina Inver Grove Heights Lakeville Savage
Chanhassan Chaska Deephaven Eden Prairie Excelsior Greenfield Greenwood Hopkins Independence Laketown Twp.
Long Lake Maple Plain Medina Minnetonka Minnetonka Beach Minnestrista Mound Orono Plymouth
Prior Lake Shakopee Shorewood Spring Park St. Bonifacius Tonka Bay Victoria Waconia Wayzata
*Service is planned and construction underway.
St. CroixValley
Hastings
EaglesPointRosemount
Empire
BlueLake Seneca
Metro
Anoka
Washington
Hennepin
Carver
Scott
Dakota
Ramsey

19
Technical Services Department (Engineering Services, Drafting and Records, and Construction Services
MCES’s Technical Services Department provides services that support the Council’s mainte-nance and capital projects. Department staff may work on any number of projects including projects financed out of both MCES’s operating and capital budgets. Staff are located in one of three business sections: Engineering Services, Construction Services, and Drafting and Records.
Engineering Services provides for the long-range capital planning activities and the development, production, and administration of MCES’s Capital Improvement Program and Capital Budget. Capital planning staff also coordinate projects funded through the State Revolving Loan Program, and provide research and special studies to support department objectives and responsibilities. MCES’s 2007 capital budget is $127 million (as shown on the right). Of the $127 million, 49 percent is earmarked for expansion, 45 percent for rehabilitation and 6 percent for quality improvement. Quality improvement projects include phosphorus removal at the Blue Lake, Seneca and Empire Plants.
Engineering Services provides project management and in-house design for MCES’s wastewater treatment facilities operation and maintenance and capital improvement projects.
Drafting and Records’ basic function is to provide, support, and maintain Computer Aided Drafting and Design (CAD) within the organization. This includes development of CAD standards, policies and procedures and contract language as well as preparation and maintenance of engineering bid design documents.
Construction Services provides construction contract administration and inspection services for MCES’s operation and maintenance and capital improvement projects, and for Metro Transit’s capital projects. Staff are located at the Metro, Seneca, Empire and Blue Lake plants.
MCES’s Major Ongoing Projects ($s in millions) Est. 2007 CIPProjects Expense 2007–‘16Blue Lake Plant Improvements $ 5.0 $ 219.0Northwest Interceptor System Imp. 1.0 184.0Blue Lake System Improvements 4.0 143.9Mpls/St. Paul Interceptor Imp. 3.0 82.0Metro Space Utilization/Facilities Imp. 1.6 79.6Northeast Interceptor System Imp. 8.0 73.0Hastings Treatment Plant .5 54.0Hopkins System Improvements 1.0 39.0South St. Paul LS/FM Improvements 5.0 36.0Other Projects 98.0 576.5Totals $127.1 $1,489.0

20
Environmental Quality Assurance Department (Industrial Waste/Pollution Prevention, Analytical Services, Environmental Monitoring/Water and Air Quality, Research
and Development, Environmental Compliance, Water Resources Assessment, and Water Supply Planning) MCES’s Environmental Quality Assurance (EQA) Department provides leadership and technical services for the development and implementation of environmental plans and programs for the metropolitan area. EQA also provides technical and regulatory services to the Metropolitan Council and works with other organizations to ensure that plans and programs are cost effective and are focused on regional goals. Staff work in the administrative, or special projects area (which provides a variety of resources in customer and community relations, communications and environmental education to serve MCES’s internal and external customers) or one of the following seven sections:
The Industrial Waste/Pollution Prevention (IWPP) Section manages use of the MCES system by industrial users and other discharge sources to protect wastewater facilities, operating personnel and the environment. Major functions include administration of Industrial Discharge Permits, enforcement of regulations, monitoring, and response actions. Staff also promote pollution prevention and provide technical assistance to customers to reduce volume and pollutant loadings into the system.
The Analytical (Laboratory) Services Section provides customers with quality, timely, and cost-effective technical services. These technical services include: project development; sample
analysis; sample collection and container preparation; instrument quality assurance; test method development; data reporting; and information management.
The Environmental Monitoring/Water and Air Quality Section has two areas of business: Water Quality and Air Quality. Following the standards
in the Water Resources Policy Plan, staff monitor the water quality of regional rivers, streams, lakes, and wastewater treatment plant discharges. Water quality problems are identified, management decisions are made for improving and protecting water resources, and achievement of water quality goals are measured. The Air Quality area provides for air testing services requested by MCES. Staff evaluate point source emissions, site specific air zones, and ambient air, at and around MCES facilities.

21
Research and Development conducts research and gathers information that provides advice and assistance in making informed decisions related to current and future problems, treatment processes and methods for achieving air and water quality objectives, and the impact of agency actions on the environment.
Environmental Compliance ensures that all MCES facilities have the environmental permits and licenses necessary to operate within mandated guidelines. Staff in Environmental Compliance are responsible for submitting applications for environmental permits, negotiating permit conditions, tracking permit and regulatory requirements, and monitoring regulatory developments of federal and state environmental programs. In addition, staff provide environmental expertise to the entire MCES division by advising staff on regulatory requirements impacting projects and activities, providing technical and regulatory support for recycling and sustainability activities, and administering MCES’s Environmental Audit Program.
The Water Resources Assessment Section provides technical information for Council actions on environmental matters. It also provides assistance in developing, coordinating, reviewing and implementing these actions. Water Resources Assessment staff are involved in environmental protection and management, including: technical assistance for watershed planning; environmental review; nonpoint source pollution control research; regional water supply planning; target pollutant loads development; grant coordination; and, other natural resource studies.
The Water Supply Planning Section was created early in 2006 in response to legislation that increases MCES’s role in regional water supply planning. Initially, staff is developing a base of technical information and a regional water supply master plan, clarify the responsibilities of various levels of government and provide staff support to the Metropolitan Area Water Supply Advisory Committee.
Gallons of Wastewater Collected and Percent of Permit Compliance
50
60
70
80
90
100
110
1999 2000 2001 2002 2003 2004 2005 200650
60
70
80
90
100
110Gallons collected and treated (billions): white bar
102.6 99.4 105.8 102.4 95.2 93.6 91.8 95.6
99.8% 99.4% 99.8% 99.8% 99.9% 99.8% 99.8% 99.7%
% Permit Compliance: black bar
Wastewater totals for the calendar years were the amounts metered at each of the eight treatment plants.
22
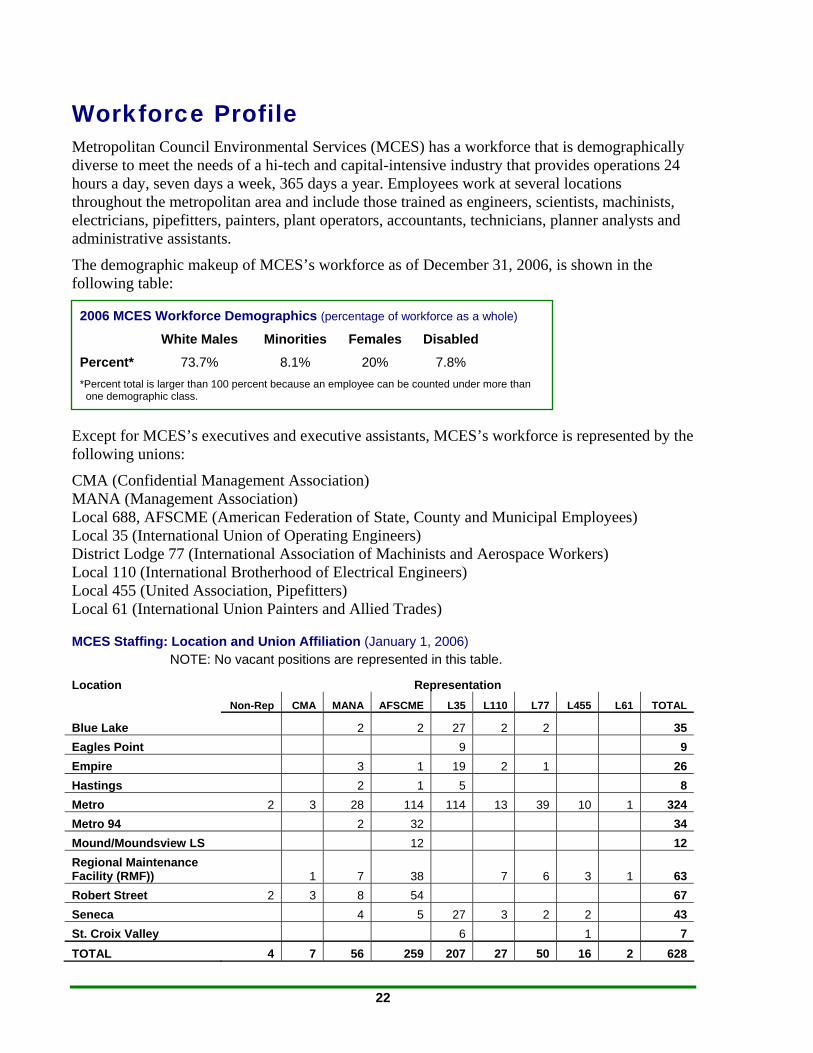
Workforce Profile Metropolitan Council Environmental Services (MCES) has a workforce that is demographically diverse to meet the needs of a hi-tech and capital-intensive industry that provides operations 24 hours a day, seven days a week, 365 days a year. Employees work at several locations throughout the metropolitan area and include those trained as engineers, scientists, machinists, electricians, pipefitters, painters, plant operators, accountants, technicians, planner analysts and administrative assistants.
The demographic makeup of MCES’s workforce as of December 31, 2006, is shown in the following table:
2006 MCES Workforce Demographics (percentage of workforce as a whole)
White Males Minorities Females Disabled
Percent* 73.7% 8.1% 20% 7.8% *Percent total is larger than 100 percent because an employee can be counted under more than one demographic class.
Except for MCES’s executives and executive assistants, MCES’s workforce is represented by the following unions:
CMA (Confidential Management Association) MANA (Management Association) Local 688, AFSCME (American Federation of State, County and Municipal Employees) Local 35 (International Union of Operating Engineers) District Lodge 77 (International Association of Machinists and Aerospace Workers) Local 110 (International Brotherhood of Electrical Engineers) Local 455 (United Association, Pipefitters) Local 61 (International Union Painters and Allied Trades)
MCES Staffing: Location and Union Affiliation (January 1, 2006) NOTE: No vacant positions are represented in this table.
Location Representation Non-Rep CMA MANA AFSCME L35 L110 L77 L455 L61 TOTAL
Blue Lake 2 2 27 2 2 35 Eagles Point 9 9 Empire 3 1 19 2 1 26 Hastings 2 1 5 8 Metro 2 3 28 114 114 13 39 10 1 324 Metro 94 2 32 34 Mound/Moundsview LS 12 12 Regional Maintenance Facility (RMF)) 1 7 38 7 6 3 1 63 Robert Street 2 3 8 54 67 Seneca 4 5 27 3 2 2 43 St. Croix Valley 6 1 7 TOTAL 4 7 56 259 207 27 50 16 2 628


Metropolitan Council Members Chair:
Peter Bell
Council Members: Roger Sherer District 1 Natalie Steffen District 9 Tony Pistilli District 2 Kris Sanda District 10 Mary H. Smith District 3 Georgeanne Hilker District 11 Julius C. (Jules) Smith District 4 Chris Georgacas District 12 Russ Susag District 5 Richard Aguilar District 13 Peggy Leppik District 6 Vacant District 14 Annette Meeks District 7 Daniel Wolter District 15 Lynette Wittsack District 8 Brian McDaniel District 16
Council Regional Administrator: Tom Weaver
The MCES Management Team is available to answer your questions and address your needs. Bill Moore, MCES General Manager (651) 602-1162 or [email protected]
Keith Buttleman, Assistant General Manager, Environmental Quality Assurance (651) 602-1015 or [email protected]
Leisa Thompson, Deputy General Manager, Treatment Services (651) 602-8101 or [email protected]
Bryce Pickart, Assistant General Manager, Technical Services (651) 602-1091 or [email protected]
Bill Moeller, Assistant General Manager, Interceptor Services (651) 602-4504 or [email protected]
Karen Neis, Director, Environmental Services Administration (651) 602-1012 or [email protected]
Jason Willett, Director, Environmental Services Finance (651) 602-1196 or [email protected]
More information on MCES can be found on the following Web site:
www.metrocouncil.org/environment/environment.htm
Metropolitan CouncilEnvironmental ServicesA Clean Water AgencyA Clean Water Agency
MCES