metrolinx benefits case - wordpress.com
TRANSCRIPT

Yonge North Subway Extension Benefits Case Analysis – Context
Background
On November 28, 2008 the Metrolinx Board approved the Regional Transportation Plan entitled The Big Move, which included a subway extension from Finch Station to Richmond Hill Centre at Highway 7 as a Top 15 priority project. The Board required a Benefits Case Analysis (BCA) be completed for the Yonge North Corridor and other priority projects prior to a project funding recommendation. The BCA process is instrumental in providing information for Metrolinx to determine the best project scope and implementation phasing for rapid transit projects in the Greater Toronto and Hamilton Area. In collaboration with Toronto and York Region, Metrolinx developed a BCA for the Yonge North Subway Extension.
The Yonge North Subway Extension is currently unfunded. The costs and timelines presented in this BCA are to be considered for high-level project appraisal purposes only. Costs, phasing and timelines are subject to detailed planning, design, and engineering work still to be completed.
Metrolinx Action and Next Steps
At the closed session of the Metrolinx Board of Directors meeting of July 13th, 2009, the Yonge North BCA was presented as an interim high-level project appraisal.
Metrolinx staff were directed to complete additional analysis in collaboration with the City of Toronto, TTC, and York Region, to more comprehensively scope the project. Additional analysis will include:
• Possible adjustments in project scope, timing or phasing;
• Consideration of the extent to which improved service levels on the parallel GO Richmond Hill rail corridor to off-load some of the demand on Yonge Street; and
• The cost impacts of the various options on the subway yards strategy, Yonge-Bloor subway station improvements; and a future Downtown Relief Line to bypass the Yonge-Bloor congestion pinchpoint.
Metrolinx recognizes the magnitude and range of development and congestion pressures along the Yonge Street corridor. York Region, the City of Toronto, and Metrolinx are collaborating on a work program underway to address these areas that require further analysis. Once the information from the additional work noted above is available, a revised BCA will be developed so the Metrolinx Board can recommend the rapid transit project scope that will deliver the best returns for taxpayer investment in the Yonge North corridor. It is anticipated that the work noted above will be complete in late 2010.

Yonge north SubwaY extenSion benefitS caSe
June 2009

Yonge North Subway Extension
Benefits Case
Interim Report
June 1st 2009
Prepared for: Prepared by:
Metrolinx 20 Bay Street, Suite 901 Toronto ON M5J 2N8
Steer Davies Gleave 1000 - 355 Burrard Street Vancouver, BC V6C 2G8 In Association with: Economic Development Research Group Metropolitan Knowledge International


Yonge North Subway Extension Benefits Case
CONTENTS
EXECUTIVE SUMMARY ..................................................................................................1
PART A PROJECT RATIONALE .................................................................................5
Introduction ............................................................................................................................................................5 Purpose of Report ...............................................................................................................................................5 Report Structure .................................................................................................................................................5
Project Rationale ...................................................................................................................................................6 Context and Need ...............................................................................................................................................6 Project Objectives ..............................................................................................................................................6
Project Overview...................................................................................................................................................7 Forecast Demand ................................................................................................................................................8 Technology Choice ..............................................................................................................................................9 Subway Issues ......................................................................................................................................................9
Status of Project ..................................................................................................................................................10
PART B OPTIONS ...................................................................................................12
Project Options ....................................................................................................................................................12
Base Case ...............................................................................................................................................................12 Option 1 – Subway Extension with 6 Stations ...............................................................................................14 Option 2 – Subway Extension with 5 Stations ...............................................................................................16 Option 3 – Bus Rapid Transit with GO Transit Enhancements on Richmond Hill Line ...........................16 Summary of Options .........................................................................................................................................18
PART C ASSESSMENT .............................................................................................20
Evaluation Framework .......................................................................................................................................20
Transportation User Benefits............................................................................................................................21 Travel Time Savings ..........................................................................................................................................21 Automobile Operating Cost Savings ...............................................................................................................21 Safety Benefits ..................................................................................................................................................22 Qualitative Transportation User Benefits .....................................................................................................22

Yonge North Subway Extension Benefits Case
Summary .............................................................................................................................................................22
Financial Account ................................................................................................................................................24 Ridership and Revenues ...................................................................................................................................24 Capital and Operating Costs............................................................................................................................24 Summary .............................................................................................................................................................25
Comparing Benefits and Costs ..........................................................................................................................27
Environmental Impacts.......................................................................................................................................28 Greenhouse Gas Emissions...............................................................................................................................28 Other Environmental Issues.............................................................................................................................28
Economic Development Impacts ......................................................................................................................30 Temporary Economic Impacts During Construction ....................................................................................30 Long-term Economic Impacts..........................................................................................................................31 Land Value Changes ..........................................................................................................................................32 Summary .............................................................................................................................................................38
Social Community Impacts.................................................................................................................................39 Land Use Impacts ..............................................................................................................................................39 Health .................................................................................................................................................................39 Accessibility .......................................................................................................................................................39
Sensitivity Analysis..............................................................................................................................................41 Discount Rate.....................................................................................................................................................41
Summary Results..................................................................................................................................................41
TABLES Table 1 Bus Routes In Yonge Street Corridor 13
Table 2 Station Locations 14
Table 3 Summary of Options 19
Table 4 Incremental Transportation User Benefits 23
Table 5 Capital and Operating Costs 25
Table 6 Incremental Costs and Revenues 26
Table 7 Comparison Benefits and Costs 27

Yonge North Subway Extension Benefits Case
Table 8 Reduction In CO2 Emissions 28
Table 9 Employment And Income Impacts During Construction 31
Table 10 Long-Term Employment and income Impacts 32
Table 11 Land Value Premium 34
Table 12 Land Value Uplift 36
Table 13 Economic Development Impacts 38
Table 14 Discount Rate Sensitivity Analysis 41
Table 15 MAE Summary 43
APPENDICES
INPUT VARIABLES AND ASSUMPTIONS

Yonge North Subway Extension Benefits Case
1
Executive Summary
In 2006 the Province of Ontario created the Greater Toronto Transportation Authority, later renamed
to Metrolinx in December 2007. The primary responsibility of the new organisation is to provide leadership in the planning, financing and development of the Greater Toronto and Hamilton Area’s
(GTHA) multi-modal transportation network and to conform to the objectives and vision set out in the Places to Grow Act, 2005.
Part of Metrolinx’ mandate and one of its first deliverables was the development of the Regional Transportation Plan, known as The Big Move, a 25-year plan for the implementation of the Province’s
MoveOntario 2020 vision of 52 new rapid transit projects in the GTHA by 2020.
As the rapid transit projects contemplated in The Big Move move closer to implementation, a Benefits Case will be prepared for each project. The purpose of the Benefits Case is to undertake a
comparative analysis of feasible options for a specific rapid transit project and present the results in such a way that it will assist decision makers to select a preferred option for implementation.
This report is about the Yonge North Subway Extension (Yonge) project which is one of the rapid
transit projects announced by the Premier as part of MoveOntario 2020 initiative and identified in the RTP. The project involves a 6.8 kilometre north – south extension on the current Yonge-
University-Spadina subway line.
In consultation with Metrolinx and the Toronto Transit Commission (TTC) and York Region three
options were identified for study in this analysis.
I Option 1: Subway Extension with 6 stations
I Option 2: Subway Extension with 5 stations
I Option 3: Bus Rapid Transit Extension with Richmond Hill GO Line service improvements
The three options were compared to the Base Case, which is defined as the existing transit network
along the Yonge corridor growing over time to accommodate increased demand. The table below summarizes the key characteristics of each of the options.
Note that extension of the subway north to Richmond Hill will have an effect on the southern section of the Yonge line, which operates near capacity south of Bloor Station. This report includes a
proportion of the costs for relieving these capacity constraints, based on the extension’s impact on ridership. It should be noted however that in order for the Yonge Subway extension project to
proceed, the necessary improvements to relieve capacity constraints at Bloor-Yonge Station may
need to be funded.

Yonge North Subway Extension Benefits Case
2
Summary of Options
Option 1 Option 2 Option 3
Year in Service 2017 2017 2013
Total Capital Costs ($m) $2,379 $2,254 $220
Additional Bloor-Yonge capacity costs required beyond Total Capital Costs
$360 $360 --
Number of stations 6 5 7
Maximum loading point demand in 20211,2 (between Finch Station and Richmond Hill)
13,400 corridor of which
8,900 on the subway
12,300 corridor of which
9,600 on the subway
11,100 corridor of which
5,000 on the BRT
Passenger Capacity Per Hour Per Direction in 2021
15,000 15,000 3,000
Unmet demand in 2021, passengers per hour, peak direction
- - 2,000
Meets Long-Term Capacity Needs Yes Yes No3
Frequency of Service in 2021 6 min4 6 min 3 min
Frequency of GO Rail Service, peak direction
30 min 30 min 20 min
Number of subway vehicles 36 30 --
Number of BRT vehicles -- -- 24
Travel Time 14 min 12 min 17 min
1 Subway demand is lower than RTP. RTP assumed headways of 1 minute. 2 2021 statistics are used because RTP results show that peak demand on route is within 15 years, with lower
loads later with the implementation of Richmond Hill Express Rail. Corridor demand refers to the combined load of the proposed Yonge St. service, GO Richmond Hill service and local buses operating on Yonge St.
3 Demand is considerably higher than BRT capacity, as modelled in this analysis, in 2021 and 2031. Comparative tables throughout this report have the Option 3 column in grey to indicate that long-term capacity needs are unmet.
4 The assumed service frequency is derived from matching supply of service with ridership demand and does not reflect, nor propose, what TTC’s ultimate operational plan and service level will be.

Yonge North Subway Extension Benefits Case
3
The results from the Multiple Account Evaluation are summarized in the table below.
Overall there is very little difference between the two subway options. The benefit-cost ratio for both options is 0.7. Option 1 has a $7 million better overall net present value at a discount rate of
5%.
The subway options provide higher service quality and reliability than the BRT. Analysis suggests BRT
would most likely experience substantial crowding in peak periods and would not provide a long term
solution in addition to not being as reliable as the subway.
The subway options have much larger positive environmental, economic, land development and
community impacts than the BRT. As shown in the table below the value of the GHG emissions is about half for the BRT compared to the subway options.
The economic impacts of the subway options are considerable, especially during construction. Some 21,800 person-years of employment are expected to be generated by Option 1 (this includes both
direct and indirect impacts). For Option 2 the estimate is 20,700 person-years of employment while
for Option 3 the estimate is 800 person-years of employment.
Subways have shown to the most effective technology in stimulating land development around
stations and the analysis shows substantial increase in development and land value provided municipal planning and zoning support the development. The incremental value of land development
is estimated at between $500 million to $1.2 billion for Option 1 with slightly lower values for Option 2. Under Option 3 not much land uplift is expected – between $32 and $65 million.
The results from the Greater Golden Horseshoe Model indicate that the demand for the BRT in 2021
greatly exceeds the maximum capacity of the technology as contemplated in this report. The BRT assumes a dedicated busway with at-grade stops, articulated vehicles and the buses would run
segregated from traffic. While the capacity of the BRT could be expanded slightly, the analysis suggests that technology may not have sufficient capacity for the long-term needs of the corridor.
This report is part of an ongoing study and planning effort by York Region, the City of Toronto, TTC,
and Metrolinx regarding the complex and integrated Yonge Subway corridor. Other studies currently underway include:
I TTC Subway Rail Yards Needs Study (underway)
I Rapid Transit Options for Downtown Toronto (underway)
I Metrolinx Richmond Hill GO rail improvements Benefits Case (underway), for Milton, Barrie, Richmond Hill and Stouffville corridors

Yonge North Subway Extension Benefits Case
4
MAE Summary
Option 1
Option 2
Option 3
Transportation User Account
Transportation User Benefits (PV $m)
1,344 1,228 541
Qualitative User Benefits
Financial Account
Costs (PV $m) (1,886)5 (1,776)5 (196)
Benefits Less Costs (PV $m) (541) (548) 345
Benefit-Cost Ratio 0.7 0.7 -6
Environmental Account
GHG Emissions (PV $m) 11.1 10.1 5.1
Qualitative Environmental Impacts
Economic Development Account
Economic Impacts During Construction
Long-term Economic Impacts
Development Potential ($m) 482 – 1,205 394 - 984 32 - 65
Social Community Account
Land Use Shaping
Health
Accessibility
5 Excludes Bloor-Yonge capacity improvements not attributable to the Yonge extension 6 Benefit-Cost ratio is not provided as the full cost of the GO Rail improvements and the disbenefits of un-
serviced demand have not been included.

Yonge North Subway Extension Benefits Case
5
Part A Project Rationale
Introduction
Purpose of Report
In 2006 the Province of Ontario created the Greater Toronto Transportation Authority, later renamed to Metrolinx in December 2007. The primary responsibility of the new organisation is to provide
leadership in the planning, financing and development of the Greater Toronto and Hamilton Area’s (GTHA) multi-modal transportation network and to conform to the objectives and vision set out in
the Places to Grow Act, 2005.
Part of Metrolinx’ mandate and one of its first deliverables was the development of the Regional Transportation Plan, known as The Big Move, a 25-year plan for the implementation of the Province’s
MoveOntario 2020 vision of 52 new rapid transit projects in the GTHA by 2020.
As the rapid transit projects contemplated in The Big Move move closer to implementation, a
Benefits Case will be prepared for each project. The purpose of the Benefits Case is to undertake a comparative analysis of feasible options for a specific rapid transit project and present the results in
such a way that it will assist decision makers to select a preferred option for implementation.
The Yonge North Subway Extension (Yonge) project was one of the rapid transit projects contemplated in MoveOntario 2020 and identified as a Top 15 project in the RTP. This project
involves a 6.8 kilometre north–south extension on the current Yonge-University-Spadina subway line.
Three different transit options were identified for the corridor. Two of these options were carried
forward for the assessment and this document presents the comparison of these options against the Base Case. The assessment of the options includes the relative strengths and weaknesses of each
option on people, the economy and the environment compared to the cost of implementing the
option. The objective of the assessment is to clearly outline the trade-offs among the criteria to enable decision makers to make an informed decision.
Report Structure
This report is structured as follows:
I Part A - Project Rationale: This section describes the policy context, the broader regional and project objectives, the characteristics of the corridor and the issues and opportunities to be addressed by the proposed project.
I Part B – Project Options: This section describes the options that are evaluated.
I Part C – Project Assessment: This section describes the evaluation methodology, the analysis and the summary results.

Yonge North Subway Extension Benefits Case
6
Project Rationale
Context and Need
The Yonge subway carries the highest volume of ridership of all transit facilities in the Greater
Toronto and Hamilton Area. The terminal station at Finch Avenue is a significant regional transportation facility providing access to the Toronto subway network for Toronto residents as well
as for the residents of York Region.
The provision of a rapid transit service along the Yonge Street corridor north from Finch Station in
Toronto to Richmond Hill Centre in York Region is one component under consideration as part of York Region’s VIVA network expansion plan and is consistent with regional policy documents, including:
I Province of Ontario’s Growth Plan for the Greater Golden Horseshoe;
I York Region’s Transportation Master Plan;
I York Region’s Official Plan and Infrastructure Master Plan updates (Vision 2026) and the Pedestrian and Cycling Master Plan; and
I Metrolinx Regional Transportation Plan - The Big Move - approved in November 2008.
Recognizing the importance of this corridor to the VIVA and Toronto Transit Commission (TTC)
networks and the potential for transit oriented land use development opportunities along the corridor in both Toronto and York Region, a proposed extension of the Yonge subway from Finch
Station to Richmond Hill Centre was put forward by York Region as a Quick Win candidate.
Extending the subway northward beyond Steeles Avenue to Richmond Hill Centre would cross the
municipal boundary between the City of Toronto and York Region and extend TTC’s services as far north as Richmond Hill Centre. In doing so, Richmond Hill Centre would become a significant
transportation hub providing convenient inter-regional connectivity for passengers consistent with
the regional policy objectives. Richmond Hill Centre would provide a multi-modal transfer facility with convenient connections to VIVA rapid bus, other York Region buses, GO Transit bus and rail
services, and the TTC subway.
Project Objectives
Both the provincial Growth Plan and York Region’s Official Plan promote more efficient, livable,
mixed-use communities integrated with higher order transit services and improved regional connectivity. The proposed Yonge North subway extension will support these goals by improving
connectivity and access between downtown Toronto and an anchor hub at Richmond Hill Centre
where York VIVA, local bus services, GO Transit commuter rail, Highway 407 transit services, express buses and the TTC subway system would merge. Specific strategies include:
I Provide convenient rapid transit access to urban growth centres;

Yonge North Subway Extension Benefits Case
7
I Improve inter-regional transit connectivity;
I Increase people-moving capacity along key transportation corridors;
I Increase transit choices for inter-regional travel;
I Improve transit rider safety and comfort; and
I Optimize use of existing transit facilities, services and corridors.
In addition to the transit service improvements that would accompany a subway extension, the extension of the subway would also serve to alleviate traffic congestion along the corridor as fewer
buses would be required to serve the corridor and current auto users would be encouraged to shift
modes and/or commuter parking destinations.
The extension also supports current land use planning objectives in both Toronto and York Region to
increase densities and improve the urban experience for those living and working along the corridor.
Project Overview York Region is one of the fastest growing areas in the GTHA region with rapid and continuing growth in population and employment. As a result of this rapid growth, land use patterns have shifted from
predominantly rural and agricultural to urban, particularly in the southern and central portions of the region along the Highway 7 and Yonge Street corridors.
Along with the rapid growth experienced in York Region, travel patterns between York Region and
Toronto have become more balanced. Transportation surveys indicate that for every 100 commuters travelling south from York Region to Toronto, there are 60-70 trips going north. If this pattern
continues, it is anticipated that traffic congestion along the corridor will impact mixed traffic transit operations in both directions. At present, the traffic along the corridor is heavily congested in the
peak hours as commuters travel south from York Region to destinations south of Steeles Avenue within Toronto.
The Yonge Street corridor between Finch and Richmond Hill Centre is characterized by a mixture of
both commercial and residential development with varying degrees of density. Densities along the southern portion of the corridor between Finch Avenue and Clark Avenue are close to 100 people per
hectare, and planning work exists for more intensive redevelopment, particularly around stations, if the subway line was extended.
The Yonge Street corridor is currently served by several bus routes, including VIVA buses that carry passengers from York Region across the municipal boundary into Toronto to a bus terminal adjacent
to Finch subway station. Despite the success of York Region’s first phase of the VIVA program,
growing traffic congestion along the Yonge Street corridor, particularly between Finch Avenue and Steeles Avenue is expected to impact VIVA and TTC’s ability to maintain its current level of service.
With this in mind, York Region envisioned improved transit services along the Yonge Street corridor

Yonge North Subway Extension Benefits Case
8
as part of their VIVANext initiative, either through the provision of bus rapidways and other transit
priority measures, or by extending the subway through the congested corridor to a new terminus at Richmond Hill Centre.
The proposed Yonge North subway extension is approximately 6.8 kilometres in length and runs from Finch station to a proposed new multi-modal transit hub at Richmond Hill Centre. Of the proposed
extension, approximately two kilometres lies within the TTC service area in the City of Toronto.
As proposed by York Region and included in The Big Move, Richmond Hill Centre would form part of a multi-modal transit hub within York Region, providing convenient passenger connections between
conventional York Region buses, York’s VIVA service, the Yonge subway extension itself and GO Transit commuter bus and rail services, Highway 407 transit services, as well as for motorists,
cyclists, and pedestrians from the vicinity of the Richmond Hill Centre- UGC area. The specific location of the terminal station is the subject of a separate planning study currently underway by
York Region.
The Yonge subway extension is a crucial component of York Region’s VIVA system. The success of VIVA will depend on how well the system connects with Toronto, where the majority of trips are
destined (for reference, the Benefits Case for VIVANext improvements assumed a subway connection to Finch station would be in place by 2017).
Forecast Demand
As mentioned above, the Yonge Street corridor between Finch Avenue and Richmond Hill Centre has the highest ridership of all transit corridors in York Region and these volumes are expected to
increase over time. The faster and more reliable the service, for example a subway, the higher the
ridership demand.
Results from the Greater Golden Horseshoe Model show that in 2021 total ridership demand in the
corridor is expected to reach a maximum in the peak hour peak direction between 11,000 passengers (assuming a bus rapid transit system) and 13,400 passengers (assuming a subway).
However, not all transit demand in the corridor will be served by the rapid transit route. Approximately 30%-35% of the demand is forecast to be served by the many local bus routes in the
corridor. Based on the results from the Greater Golden Horseshoe Model, the demand at the
maximum loading point assuming subway technology is estimated at between 8,900 and 9,600 passengers per hour per direction and for BRT technology demand will be approximately 5,000
passengers per hour per direction. The maximum loading point is located at the southern end of the route, between Finch Avenue and Steeles Avenue. The remainder of the riders are forecast to use
the GO Richmond Hill service.

Yonge North Subway Extension Benefits Case
9
Technology Choice
The technologies considered for the options were based either on an extension of the subway north
from Finch to the Richmond Hill Centre, or the extension of the BRT south from the Richmond Hill Centre to Finch.
The forecast demand in the corridor is stretching the capacity limit of a BRT7. The capacity of a BRT is approximately 2,700 per hour8, which is not sufficient to serve the forecast peak demand of 5,000
passengers by 2021.
An LRT system could have sufficient capacity, but would mean introducing a third technology for the
6.8 km route e.g. subway to Finch station, LRT to Richmond Hill Centre and then a second transfer to
the VIVA rapid bus or other bus service. The many transfers would reduce the attractiveness of the service. A new LRT option was not considered for study by the joint York Region/TTC/Metrolinx
technical team as the corridor was designated for a subway extension in The Big Move.
The BRT and GO rail option was considered here primarily to test the ability of planned GO rail
service improvements to serve the corridor. As the results show, the combination of incremental GO
rail improvements and BRT service will not meet the long-term demand projected for the corridor.
Subway Issues
While there are capacity issues in the southern sections of the Yonge subway, a future subway north
of Finch station will have more than sufficient capacity than required for the long-term, but extending the subway comes with issues that have to be addressed:
Yonge Subway Capacity The Yonge Subway line is currently operating near capacity south of Bloor in the AM peak period.
With the anticipated population growth in both Toronto and York Region and the consequent increase in transit demand the current capacity constraint experienced on the Yonge line in the southern
section is expected to worsen.
The ability to improve capacity of the Yonge Subway at Finch station has in the past been limited by
the current train control system, which can only handle the turn-around of 25 trains per hour. In
2008, the Metrolinx Quick Win package of rapid transit initiatives was announced as part of the Provincial Budget. The Yonge subway line improvements were funded as a necessary precursor to
Yonge North Subway Extension. The Quick Wins investments provided funding to the TTC for the installation of an automatic train control for the Yonge-University Spadina Line (YUS) and a one-third
7 This is based on a BRT that runs in segregated bus lanes, but not segregated intersections. The capacity of the BRT can be expanded, but would require substantial capital investment.
8 To increase this capacity requires a service frequency of less than every 2 minutes (assuming 90 passengers/vehicle) – a service frequency that is operationally very challenging to maintain with a high risk of “bunching”.

Yonge North Subway Extension Benefits Case
10
funding contribution towards the acquisition of higher-capacity subway trains - “Rocket” trains. The
automatic train control (ATC) is to be operational on the Union – Eglinton section of the YUS by 2013. The ATC will be fully installed and make the opening of the Yonge North Subway Extension possible
by late 2016.
Upon subsequent analysis, it has become apparent that there are other limiting factors in the subway
system, such as station/platform capacity at the Bloor-Yonge subway station, which are currently
being looked at by the TTC. With either the existing signal system or with the new ATO/ATC, the key bottleneck to improving Yonge Subway service levels/capacity is the current dwell time for trains in
Bloor-Yonge Station at the upper level (Bloor Station on the Yonge Subway line). In order to operate more trains through Bloor-Yonge Station with ATO/ATC it will be necessary be significantly reduce
the dwell time for trains caused by the sheer volume of passengers boarding and alighting Yonge subway trains through a single set of doors on one side of a subway train. A study in 1988 identified
the addition of a centre platform at the Yonge level and two additional side platforms at the Bloor
level that would allow train doors to open on both sides of the train. Unloading of trains would be to the centre platform simultaneous with loading of trains from the side platforms. This would
theoretically reduce station dwell times in half from current levels and would ensure that the increased service that is possible with ATO/ATC could be implemented. A further consideration is the
potential congestion relief provided by the Downtown Relief Line as proposed in the RTP but this is still under early stages of development.
The TTC is currently undertaking a study to re-examine the 1988 Bloor-Yonge station concept that is
expected to be completed by the end of 2009. However TTC very preliminary cost estimates for Bloor-Yonge capacity improvements are estimated at $450 million9. Clearly the extension of the
subway north to Richmond Hill will have effects on capacity constraints on Bloor-Yonge station and estimates by TTC suggest 20% of the increased passenger growth on the line will be caused by the
extension. We have allocated 20% of the capacity increase cost in this Benefits Case. It should be
noted that expanding the capacity of Bloor-Yonge Station is not the only solution to the current dwell time constraints at this station. Other options include subway operational strategies, network
alternatives, service improvements to commuter rail or improved surface capacity into the downtown core.
Status of Project York Region initiated the Yonge subway extension study in June 2007. The City of Toronto
participated in the early stages of the process as an observer and later in the study process became an active co-proponent of the project. Alignment alternatives and potential station locations were
generated and assessed in the first half of the year prior to their presentation to the public at an
9 TTC Report ‘Yonge Subway Extension – Additional Information Concerning Costs and Ridership/Capacity’ January 21, 2009

Yonge North Subway Extension Benefits Case
11
Open House in June. Further work was undertaken following the June Open House, to refine the
analysis of station locations at Steeles Avenue and Richmond Hill Centre and assess the crossing of the East Don River. This more in-depth analysis was presented at public workshops in August. Formal
Notice of Study commencement under the Transit Project Act was initiated in October 2008. More recently, TTC/City staff has been analyzing the ridership and capacity issues associated with the
downstream impacts of the Yonge Subway extension on the existing system as discussed previously.
This includes the capacity of Bloor-Yonge Station and the capacity of other downtown subway stations to accommodate the ridership growth to 2031 created by the Yonge Subway extension, the
Transit City initiative and general growth in TTC ridership resulting from population/employment intensification in York Region and the City of Toronto.
York Region and the City of Toronto have now completed the public consultation process of documenting the public environmental project report, which was submitted in early 2009 and
approved unconditionally on April 6th, 2009.
City of Toronto passed a council resolution on January 28, 2009 which supports the implementation of the Yonge North Subway Extension project in general, but attaches conditions that must be met
before the City is prepared to support the project. The conditions that are relevant to this Benefits Case include:
I The Spadina Extension and the ATO/ATC system on the YUS line must be in place prior to opening of the Yonge North Subway Extension;
I The costs of addressing potential capacity constraints at the Bloor-Yonge Station and North York Service Road arising from the proposed Yonge North Subway Extension are to be included as project costs (as discussed in the previous section); and
I Metrolinx be requested to prioritize the Downtown Relief Line, noting that Transit City is the first priority for the TTC and the City of Toronto.
TTC is also currently undertaking a Subway Rail Yard Needs Study to examine the strategic options
for the storage and maintenance of the subway car fleet as it grows in response to the Spadina Subway extension, the Yonge Subway extension, the vehicle fleet to accommodate ATO/ATC,
increased service levels and other planned service improvements. This information will be important
to planning a potential Yonge Street North subway extension.

Yonge North Subway Extension Benefits Case
12
Part B Options
Project Options Three potential options were identified for the purpose of this evaluation in consultation between
Metrolinx, York Region and TTC.
I Base Case
I Option 1: Subway Extension with 6 stations – extension from existing Finch subway station to Richmond Hill Centre with stations at Cummer/Drewry, Steeles, Clark, Royal Orchard, Longstaff/Longbridge and Richmond Hill Centre.
I Option 2: Subway Extension with 5 stations – extension from existing Finch subway station to Richmond Hill Centre with stations. at Cummer/Drewry, Steeles, Clark, Longstaff/Longbridge and Richmond Hill Centre.
I Option 3: Bus Rapid Transit Extension to Richmond Hill - with GO Transit enhancements on the Richmond Hill Line.
After conducting the ridership analysis, the results showed that Option 3, bus rapid transit, did not
have sufficient capacity to meet the projected ridership demand in the long-run. Although, Option 3 has been included in the MAE assessment, it is not considered a feasible option for the long-term as
examined in this assessment.
Base Case The Base Case is defined as the “do minimum” scenario. This means:
I Maintain existing bus network along the Yonge corridor, allow for growth over time to accommodate increased demand;
I A new separate bus lane between Finch and Steeles Avenues;
I Completed installation of the ATC on the subway; and
I Implementation of Option 2 of VIVANext to be implemented by 2018.
There are 24 bus routes servicing the Yonge Street corridor. The routes and the frequency of service
are listed in Table 1 below.

Yonge North Subway Extension Benefits Case
13
TABLE 1 BUS ROUTES IN YONGE STREET CORRIDOR
Route Description Type Frequency
of Service
Newmarket York Mills Coach Bus Hourly
Cummer A Bus 20 min
Cummer B Bus 20 min
Cummer Bus 10 min
Steeles East B Bus 10 min
Steeles East Express Bus 6 min
Steeles East Bus 10 min
Steeles West C Bus 15 min
Steeles West D Bus 15 min
Steeles West E Bus 10 min
Steeles West F Bus 10 min
Drewry Bus 10 min
Steeles East Bus 8-9 min
North Yonge Bus 30 min
2 Milliken Bus 7-8 min
5 Clark Bus 6 min
23 Thornhill Woods Bus 15 min
77 HWY 7/Centre PB Bus 7-8 min
8 Bathhurst Bus 10 min
91A Bayview Bus 15 min
91 Bayview Bus 10 min
Yonge C Bus 10 min
Markham Express Bus 7-8 min
Unionville Express Bus 15 min
Cornell Express Bus 15 min
Finch-Richmond Hill VIVA 3-4 min

Yonge North Subway Extension Benefits Case
Option 1 – Subway Extension with 6 Stations
This option includes an extension of the subway with 6 stations in total. This option represents York
Region’s preferred option put forward at their Open House in August of 2008. Table 2 shows the location of the stations and the approximate distance between them.
TABLE 2 STATION LOCATIONS
Station Spacing
Cummer/Drewry 0.85 km
Steeles Avenue 1.2 km
Clark Avenue 1 km
Royal Orchard 1.9 km
Langstaff/Longbridge 0.9 km
Richmond Hill Centre 1.1 km
The reasons for choosing these stations are:
I Cummer/Drewry - This station is located in the City of Toronto. The area around the station is already fairly well developed and has sufficient population and ridership to support a subway station. Several local bus routes converge in this area and would benefit from a connection to the subway. There is limited potential for intensification at this station.
I Steeles Avenue – A significant transit hub is envisioned at this location. York Region has presented options including their recommended option; an underground bus terminal sited under Steeles Avenue which would provide a terminus for more than 100 bus routes. Terminating these buses at Steeles would reduce congestion on Yonge Street. The location has strong redevelopment potential in the immediate vicinity, on the west side of Steeles, with excellent opportunities for Transit Oriented Development.
I Clark Avenue – Several local bus routes converge at Clarke and would benefit from connection to the subway. There is relatively strong development / intensification potential in the area.
I Royal Orchard – Similarly to Clark Avenue this station has local bus routes including VIVA that converge and would benefit from a connection to the subway. There are some opportunities for densification, but any development has to be done with consideration for heritage requirements.
I Longbridge/Langstaff - This station would be a significant commuter hub, and work in tandem with Richmond Hill Centre, as it is the only location available along the alignment for
14

Yonge North Subway Extension Benefits Case
15
a significant Park and Ride lot. Most of the users of the Finch P&R come from the north, and it is thought that those drivers would use a P&R at this location and thereby shorten the trip. The P&R would be located in the hydro corridor. There is also development being planned for the Langstaff Lands in Markham, located in the Northeast quadrant of the station area (a large cemetery occupies the southeast quadrant).
I Richmond Hill Centre – The proposed new terminus station would be an Anchor Hub, a significant regional multi-modal transit interchange with connections to local buses, VIVA buses, GO Transit, the subway and any future service such as the Express Rail and Highway 407 transit services.
The distance between the stations is such that each is within the 500 meter “catchment” area. The
catchment area is the distance within which there is a positive influence on ridership and land development. By selecting these six locations, the goal is to promote sustainable land development
resulting in higher density and compact communities throughout the entire corridor, which in turn would generate increased population growth and ridership.
The implementation of the Yonge North Subway extension will trigger the need for an expansion to the existing operations and maintenance facility to accommodate the expanded fleet. The ongoing
Subway Rail Yard Needs Study will be complete in early 2009 to address this issue, but for the
purpose of this assessment $178 million10 has been included as a proxy for a new operations and maintenance facility pending the results of the study.
The demand on the subway line at the maximum loading point between Finch and Steeles Avenue is estimated at 8,900 passengers per hour per direction in 2021. In order to match capacity with
demand, we have assumed that a service frequency of 6 minutes north of Finch station. This means
every fourth train arriving into Finch will continue to Richmond Hill. This will provide a capacity of up to 15,000 passengers per hour based on 6-car trains11.
The average travel speed is estimated at 32 kph resulting in a travel time of approximately 14 minutes from Finch Station to Richmond Hill Centre. Thirty-six new subway vehicles (including
spares) will be required.
It is assumed that the subway line would be entirely completed and in service by 2017. The
estimated capital cost is $2.38 billion12.
10 Based on York Region’s cost estimate as of November 25, 2008. 11 The forecast demand was modeled using 3-minute service frequency. With less frequent service the demand
will be lower and ultimately the capacity will be optimized to best meet the demand. For the purposes of the Benefits Case we have assumed that the demand will be mostly unchanged with less frequent service in order to not overstate the capital and operating costs.
12 Based on York Region’s cost estimate as of November 25, 2008 and adjusted for fewer vehicles and a proportion of the Bloor-Yonge capacity improvement costs.

Yonge North Subway Extension Benefits Case
16
Option 2 – Subway Extension with 5 Stations
This option also contemplates a subway extension, but with five stations. The elimination of a station
is driven by trying to better balance the needs of promoting the development of higher density communities, accommodating ridership demand, increasing travel speed and reducing cost. The
station removed from the evaluation is Royal Orchard due to its limited development potential as result of the heritage requirements in the area.
The demand on the subway at the maximum loading point between Steeles and Finch avenues is estimated at 9,600 passengers per hour per direction in 2021. Due to the elimination of one station,
the average speed is estimated at 36 kph with the estimated travel time from Finch Station to
Richmond Hill of approximately 12 minutes. It is assumed that 30 new subway cars including spares will be required to provide peak hour service every 6 minutes between Finch and Richmond Hill
Centre.
The subway line would be entirely completed and in-service by 2017. The estimated capital cost is
$2.25 billion13. This option assumes that a bridge will be used to cross the East Don River consistent
with the preferred crossing following the public workshops held by York Region at the end of August 2008.
Option 3 – Bus Rapid Transit with GO Transit Enhancements on Richmond Hill Line
Option 3 is based on providing bus rapid transit in a segregated right-of-way in new lanes along Yonge Street in accordance with the approved 2005 environmental assessment. The BRT would include
seven stations, slightly different to the proposed subway stops, at south of Steeles, Meadowview, Clark, John, Centre, Royal Orchard, and Richmond Hill Centre. With an assumed average speed of 30
kph, the estimated travel time would be approximately 17 minutes, but as the BRT will not have
segregated intersections, there may potentially be some delays.
The upper limit for BRT capacity is approximately 2,700 passengers (based on a 2 minute frequency
and approximately 90 passengers per articulated bus). Any headway less than 2 minutes can be challenging to achieve due to the effect on signal timings and the resulting traffic congestion on side
roads to Yonge Street.14
13 Based on York Region’s cost estimate as of November 25, 2008 and adjusted for one less station and fewer vehicles and a proportion of the Bloor-Yonge capacity improvement costs.
14 York Region suggest capacity constraints of 3,800 passengers/hour in the southbound direction near Finch station (‘Capacity of BRT and LRT for Viva Phase 2’, December 20th 2006)

Yonge North Subway Extension Benefits Case
17
The option also assumes the introduction of an all day, 20-minute headway GO Transit rail service on
the Richmond Hill line in the hope that this would relieve some of the peak direction transit demand pressure on the Yonge Corridor (particularly for trip destinations in downtown Toronto). However
results from the Greater Golden Horseshoe Model suggest that the small improvements to GO Transit rail services contemplated here will not have a significant impact on diverting ridership from the
Yonge corridor.
Further GO Rail improvements, which for the Richmond Hill service involve the potential for two-way, all-day service by 2015 and Express Rail by 2031, are slated to be evaluated in detail in a
subsequent Benefits Case. It was thought that by advancing the GO Rail improvements, improving TTC network connectivity to the Sheppard Subway at Leslie Station, and implementing planned
improvements at Union Station, the pressure on the Yonge corridor would be reduced. The results from the Greater Golden Horseshoe model suggest that the GO Rail improvements contemplated in
this assessment would have a marginal effect on ridership demand in the Yonge corridor.
The capital cost for building the segregated busway and purchasing vehicles is estimated at $220 million based on York Region estimates. This estimate does not include the capital costs for the GO
rail improvements.

Yonge North Subway Extension Benefits Case
18
Summary of Options
Table 3 provides a summary of the key characteristics of the options.

Yonge North Subway Extension Benefits Case
19
TABLE 3 SUMMARY OF OPTIONS
Option 1 Option 2 Option 3
Year in Service 2017 2017 2013
Total Capital Costs ($m) $2,379 $2,254 $220
Additional Bloor-Yonge capacity improvements costs
$360 $360 --
Number of stations 6 5 7
Maximum loading point demand in 202115,16 (between Finch Station and Richmond Hill)
13,400 corridor of which
8,900 on the subway
12,300 corridor of which
9,600 on the subway
11,100 corridor of which
5,000 on the BRT
Passenger Capacity Per Hour Per Direction in 2021
15,000 15,000 3,000
Unmet demand in 2021 - - 2,000
Meets Long-Term Capacity Needs
Yes Yes No17
Frequency of Service in 2021 6 min18 6 min 3 min
Frequency of GO rail service, peak direction
30 min 30 min 20 min
Number of subway vehicles 36 30 --
Number of BRT vehicles -- -- 24
Travel Time 14 min 12 min 17 min
15 Subway demand is lower than RTP. RTP assumed headways of 1 minute. 16 2021 statistics are used because RTP results show that peak demand on route is within 15 years, with lower
loads later with the implementation of Richmond Hill Express Rail. Corridor demand refers to the combined load of the proposed Yonge St. service, GO Richmond Hill service and local buses operating on Yonge St.
17 Demand is considerably higher than BRT capacity, as modelled in this analysis, in 2021 and 2031. Comparative tables throughout this report have the Option 3 column in grey to indicate that long-term capacity needs are unmet.
18 The assumed service frequency is derived from matching supply of service with ridership demand and does not reflect, nor propose, what TTC’s ultimate operational plan and service level will be.

Yonge North Subway Extension Benefits Case
20
Part C Assessment
Evaluation Framework The comparative analysis uses a Multiple Account Evaluation (MAE) methodology. The MAE is a
framework that provides a systematic identification and analysis of broader implications and criteria of an option. It systematically compares the impacts on costs, users, environment, economy and
community and shows the trade-offs among the often conflicting criteria.
The MAE framework includes a number of evaluation accounts that together address the most significant project performance and policy considerations for a specific project. The criteria and the
accounts can be tailored for a project. The relevant accounts for the analysis of the Yonge Subway Extension project are:
I Transportation User Benefits
I Financial Impacts
I Environmental Impacts
I Economic Impacts
I Socio-Community Impacts
It is important to note that the options defined in this report have only been developed to a level of technical detail sufficient to enable a comparative analysis for the purpose of selecting a preferred
option. Project scope, costs and service plans need to be developed in more detail for funding and
implementation.
The assessment is done by comparing each option to the Base Case and identifying any incremental
costs or benefits that are generated by each option. Hence, the results should not be interpreted as “total” values, but as the incremental impact compared to the Base Case.
Although this Benefits Case strictly compares the costs and benefits of the Yonge Subway Extension project options, it is recognized that the Yonge Subway Extension project is part of the overall
network and any changes implemented in the Yonge corridor will affect the assessment of other
projects and vice versa.
The analysis is done over a 30-year period (2009-2038). Where possible the impacts are monetized
and quantified. In order to compare the options on a “like-to-like” basis and to reflect time value of money the monetized values are discounted to today’s value at a real discount rate of 5%. These
values, and other input variables used in this analysis are shown in Appendix A.

Yonge North Subway Extension Benefits Case
21
Transportation User Benefits This account considers the incremental benefits to the transportation users as a result of
implementing the extension from Finch Station to Richmond Hill. The monetized benefits are
measured in travel time savings for both transit users and road users; automobile operating cost savings achieved by individuals as their trip times or overall automobile usage declines; and
reduction in accidents as a result of declining automobile usage.
In addition to the monetized benefits, there are qualitative user impacts which may include
passenger comfort, accessibility and reliability. In most instances they are captured in the ridership and travel time savings, but in some instances they can be isolated and identified separately if
significantly different among the options.
All transportation user benefits described below are incremental to the Base Case.
Travel Time Savings
The travel time savings were estimated using the Greater Golden Horseshoe Model, which is the best
forecasting tool available. It is a regional network model that functions best in measuring the impacts from large changes in the network. It is less reliable in measuring small changes, such as the
reduction of one subway station, as these small changes have such minor impact that they are lost in the overall network effect. Hence, the difference between Options 1 and 2 related to travel time
savings and automobile operating cost savings will have a larger than usual range of uncertainty due
to the small incremental difference between the options.
The average value of time is estimated at $13.02 per increasing by 1.6% per year in real terms. Based
on the hours saved provided by the Greater Golden Horseshoe Model the net present value of travel time savings for transit users and automobile drivers is estimated at $502 million for Option 1 and
$460 million for Option 2 for the period 2017 to 2038.
Since Option 3 is assumed to be implemented in 2013, this option experiences four more years of
benefits than Options 1 and 2. The travel time savings for Option 3 were scaled back from the
modelled results to reflect that not all benefits would be realised due to lack of capacity and inability of the BRT to meet the total forecast demand beyond 2021. The present value of the
adjusted travel time savings is estimated at $169 million.
Automobile Operating Cost Savings
Automobile operating costs savings are derived from a reduction in auto kilometres as a result of the
transit investment. The reduction in kilometres in 2021 is estimated at 142 million kilometres for
Option 1 and 129 million kilometres for Option 2 decreasing to 102 million kilometres (option 1) and 92 million kilometres (Option 2) in 2031.
Yonge North Subway Extension Benefits Case
22
Based on a base cost saving of $0.50 per kilometre in 2008, the present value of the automobile cost
savings is estimated at $765 million for Option 1 and $698 million for Option 2 over the period (2017-2038).
Similar to the adjustment made in travel time savings for Option 3, the automobile operating cost savings were scaled back to reflect that the BRT does not have capacity to meet the forecast
demand. The present value of the automobile cost savings over the period (2013- 2038) is estimated
at $336 million.
Safety Benefits
The reduction in accidents follows from the fewer kilometres driven. The savings resulting from a
reduction in accidents is calculated based an assumed value of 7 cents per kilometre in reduced road travel. The present value of safety benefits over the period is estimated at $77 million for Option 1;
$71 million for Option 2 and $36 million for Option 3.
Qualitative Transportation User Benefits
Compared to the Base Case the subway options offer much improved service for the transit users and
other transportation users in the corridor, which is reflected in the incremental time savings
generated by the two options. However the difference in service attributes between the two options is small. Option 1 offers one more station and, hence, better accessibility for residents in the vicinity
of Royal Orchard. Option 2, on the other hand, offers faster travel as the subway does not stop at Royal Orchard. Service frequency, quality and reliability are the same between the options.
Summary
Table 4 summarizes the incremental transportation user benefits associated with the Yonge Subway Extension project. The analysis shows that the project will produce substantial user benefits - the
present value of total benefits for Option 1 is estimated at $1.3 billion, approximately 10% higher
than for option 2, which is estimated at $1.2 billion. Total benefits for Option 3 is approximately 40% of Option 2 and estimated at $541 million in present value terms.

Yonge North Subway Extension Benefits Case
23
TABLE 4 INCREMENTAL TRANSPORTATION USER BENEFITS
All Values in NPV $m Option 1
Option 2
Option 3
Travel Time Savings 502 460 169
Automobile Cost Savings 765 698 336
Accident Reductions 77 71 36
Transportation User Benefits
$1,344 $1,228 $541

Yonge North Subway Extension Benefits Case
24
Financial Account This account includes the assessment of the direct incremental “cash” items, primarily costs and
revenues, from the owner’s perspective for each option over the assessment period. Costs include
incremental capital and operating costs incurred by each option compared to the Base Case. Incremental revenues, such as fare revenues, advertising, and proceeds from disposal of assets are
also shown in this account. Any savings resulting from the implementation of the options are also included.
Ridership and Revenues
Annual ridership and fare revenues have been projected using the Greater Golden Horseshoe Travel Forecasting Model19. Incremental annual fare revenues in 2031 (as compared to the Base Case) are
estimated at $10 million for Option 1, $9 million for Option 2 and $4 million for Option 3. Over the
total period (2017 to 2038) the net present value of incremental fare revenues is estimated at $74 million for Option 1 and $66 million for Option 2. Fare revenues for Option 3 over the longer
operating period (2013 to 2038) are estimated at $32 million.
Capital and Operating Costs
The capital costs include all costs associated with the construction and acquisition of the
infrastructure, revenue collection, vehicles, and maintenance centre. The estimates also include design, management & administration, insurance, environmental permitting, property and
contingencies. Interest during construction has not been included.20
The extension of the subway north to Richmond Hill will also have effects on capacity constraints on Bloor-Yonge station. TTC preliminary cost estimates for Bloor-Yonge capacity improvements are
estimated at $450 million21 and TTC estimates 20% of the increased passenger growth on the line will be caused by the extension. Therefore the capital cost assumes 20% of the Bloor-Yonge capacity
improvement cost has been included. It should be noted however that in order for the Yonge Subway extension project to proceed the necessary improvements which would relieve capacity issues at
Bloor-Yonge Station may need to be funded.
19 This model has been used for the development of the Regional Transportation Plan (RTP) and ensures
consistency with that work. The model is strategic in nature and the effect of small projects can be minimal. However the main purpose of the benefits case work is of a comparative nature and we consider the model adequate for this purpose.
20 It should be noted that the cost estimates in this report have been developed for use in the Benefits Case appraisal and should be considered indicative. The costs will be refined as the project moves through the implementation process.
21 TTC Report ‘Yonge Subway Extension – Additional Information Concerning Costs and Ridership/Capacity’ January 21, 2009

Yonge North Subway Extension Benefits Case
25
The construction period is assumed to be the same for Options 1 and 2 with start of construction in late 2009 and completion by 2017. The construction period for the BRT would start in 2010 and be
completed by the end of 2012 (3-year construction period). Table 5 shows the capital costs and operating costs associated with the options. The operating costs include the bus savings from
discontinuing some of the existing services. All values are expressed in 2008 dollars.
TABLE 5 CAPITAL AND OPERATING COSTS
All Values in 2008 $m Option 1
Option 2
Option 3
Capital Costs 2,379 2,254 22022
Additional Bloor-Yonge capacity improvement costs
360 360 --
Annual Operating Costs (2031) 11.4 9.9 4.1
Annual Bus Savings (3.6) (3.6) (3.6)
Summary
Table 6 shows the capital costs, operating costs net of bus savings and incremental fare revenues
expressed in present value for the period 2009-2038. Option 1 has the highest total cost of $1.89 billion compared to $1.78 billion for Option 2. The present value of total cost for Option 3 is
estimated at $196 million.
22 Excludes costs for GO Richmond Hill service improvements

Yonge North Subway Extension Benefits Case
26
TABLE 6 INCREMENTAL COSTS AND REVENUES
All Values in NPV $m Option 1
Option 2
Option 3
Capital Costs23 1,816 1,721 189
Operating Costs 99 85 49
Bus Savings (29) (29) (42)
Total Incremental Costs 1,886 1,776 196
Incremental Fare Revenues 74 66 32
23 Excludes Bloor-Yonge capacity improvements not attributable to the Yonge extension

Yonge North Subway Extension Benefits Case
27
Comparing Benefits and Costs In comparing the benefits and costs associated with the Yonge North Subway extension, it shows
that there are very small differences between the two subway options. The benefit-cost ratio is the
same (0.7) but Option 1 has a slightly better net present value than Option 2.
Since the BRT does not provide sufficient capacity to meet the demand in the corridor beyond
2021, the potentially very high benefit-cost ratio may be misleading in that the full cost of the GO Rail improvements and the dis-benefits of un-serviced demand have not been included.
TABLE 7 COMPARISON BENEFITS AND COSTS
All Values in NPV $m Option 1
Option 2
Option 3
Transportation User Benefits
1,344 1,228 541
Incremental Costs24 (1,886) (1,776) (196)
Net Benefit (Cost) (541) (548) 345
Benefit-Cost Ratio25 0.7 0.7 --
24 Excludes Bloor-Yonge capacity improvements not attributable to the Yonge extension 25 The benefit of increased ridership and fare revenues has been captured in travel time savings and is therefore
not included in the calculation of the benefit-cost ratio

Yonge North Subway Extension Benefits Case
28
Environmental Impacts This account examines the environmental impacts of the Yonge Subway Extension project options.
The major environmental impact with respect to urban transit projects is the ability of the project to
reduce greenhouse gas emissions from reduced automobile usage.
Greenhouse Gas Emissions
As mentioned in the Transportation User Benefits section, the projected reduction in automobile
usage drives the decrease in GHG emissions. Table 8 shows the annual reduction in GHG emissions.
The present value of the reduction in CO2 emissions over the period 2017-2038, based on an average
value of $0.01 per kilometre, is estimated at $11 million for Option 1 and $10 million for Option 2. The benefits for Option 3 are measured over the period 2013-2038 and are estimated at $5 million.
It can be argued that the relative low value society currently puts on CO2 emissions26 does not fully
reflect taking emissions reduction seriously, and hence the net present value should be higher.
TABLE 8 REDUCTION IN CO2 EMISSIONS
Option 1
Option 2
Option 3
2021 Reduction in CO2 tonnes
28,400 25,900 9,500
2031 Reduction in CO2 tonnes
20,400 18,700 6,800
NPV Value ($ m) 11.1 10.1 5.1
Other Environmental Issues
The Environmental Project Review (EPR) contemplating Option 1 was completed on February 2, 2009
and was open for public review until March 4, 2009. The environmental impact is expected to be less
for Option 2 due to fewer stations.
There will be some limited disruption to residents, businesses and traffic in the areas around the
future stations during the construction period as it is envisioned that the stations will be built using cut and cover techniques.
26 There are numerous sources on what the value of CO2 emissions should be. The values range from $10 to $100 per tonne of CO2. For the purpose of this analysis a median value of $40 per tonne was used.

Yonge North Subway Extension Benefits Case
29
The BRT option would add to GHG emissions assuming operating the service with diesel buses. The
effect overall would be fairly small, but would be higher than for the subway options. It is likely that the BRT would also require some property takings in the corridor and these issues would need to be
considered were the project to move through the implementation process.

Yonge North Subway Extension Benefits Case
30
Economic Development Impacts This account measures the economic impacts for each scenario relative to the Base Case, including
impacts from construction and economic impacts incurred from implementation of project options.
These impacts are reported in terms of GDP, the change in jobs and the change in the associated labour income, and are stated in 2008$. The results reflect how the implementation of the Yonge
Subway Extension Project will directly affect households and businesses in the regional economy and total provincial economic impacts in terms of employment, wages and GDP generated by the
construction and improvements to the transportation network.
This account also includes an assessment of the incremental impacts the options will have on land
values and development in the corridor.
Temporary Economic Impacts During Construction
The implementation of the Yonge North Subway Extension Rapid Transit Project will generate both direct and indirect economic benefits during construction. These impacts are temporary, but
substantial, and span only the period of construction.
As shown in Table 9, the project as contemplated in Options 1 and 2 will generate substantial
employment, income and addition to the GDP. Some 14,000 person-years of employment will be directly generated as a result of building the project as contemplated under Option 1. Under Option
2 the impact is slightly lower, 13,300 person-years of employment, due to lower capital costs. Some
$500 million in additional direct wages and $1.3 billion in increased GDP are other direct impacts from building the subway.
The construction of the subway will also have more wide reaching positive economic impacts as it indirectly will create economic activity for suppliers and sub-contractors. Total additional
employment (including direct and indirect effects) is estimated at 21,800 person-years of employment for Option 1 and 20,700 person-years of employment for Option 2.
The construction of the BRT has substantially less economic impact due to the much lower capital
cost and shorter construction period. The economic impacts are estimated at 800 person-years of employment; $30 million in additional wages and $75 million in added GDP.

Yonge North Subway Extension Benefits Case
31
TABLE 9 EMPLOYMENT AND INCOME IMPACTS DURING CONSTRUCTION
Direct Impacts Regional (Direct+Indirect) Impacts
Employment (person years)
Wages ($m)
GDP ($m)
Employment (person years)
Wages ($m)
GDP ($m)
Option 1 14,000 525 1,350 21,800 815 2,100
Option 2 13,300 500 1,280 20,700 775 1,990
Option 3 500 19 50 800 30 75
Long-term Economic Impacts
In the long-term there will be ongoing economic benefits as a result of the Yonge North Subway
Extension project. These benefits reflect both households’ freed up vehicle operating expenditures and transportation cost savings to area businesses. The former effect is simply a redirected
consumption demand by households away from purchases of gas, parking, automotive parts and services and into other consumer goods/services.
The latter reflects improved regional competitiveness for metro-area businesses that now have lower
costs of doing businesses including access to a larger labour market and encountering less congestion on roadways because people are choosing to use the transit system instead of driving. The impact of
the Yonge North Subway Extension project will be different for each business.
Implementation of the project will also generate social benefits that can be monetized, including
valuing time savings and emission benefits. These have already been captured above under transportation user benefits.
As shown in Table 10, the Yonge North Subway Extension project is expected to have considerably
more long term employment and income impacts for the subway option (options 1 and 2). These options result in over 130 direct and over 50 indirect jobs being generated, which result in $5m of
wages for direct impacts and $2m for indirect effects. The reduced travel time savings provided by the BRT option result in reduced employment and wage effects for both direct and indirect impacts.

Yonge North Subway Extension Benefits Case
32
TABLE 10 LONG-TERM EMPLOYMENT AND INCOME IMPACTS
Direct Annual Impacts in 2031
Direct and Indirect Annual Impacts in 2031
Employm. (Jobs)
Wages ($m)
GDP ($m)
Employm. (Jobs)
Wages ($m)
GDP ($m)
Option 1 135 5.1 13.0 187 7.0 18.1
Option 2 130 4.9 12.6 181 6.8 17.5
Option 3 44 1.7 4.3 62 2.3 6.0
Land Value Changes
Toronto’s subway system is often referred to as a poster-child for the effect of transit on land use.
High density development around subway stations along Yonge Street has characterized the area since the introduction of the subway in the 1950s.
The challenge in any economic benefit analysis is to identify economic benefits resulting from an investment that are incremental as a result of a particular investment and area. This is an important
issue as transit investments can affect land use and development in two ways.
I Land values increase because of improved accessibility to transportation. A property situated immediately beside, or within walking distance to, a transit station is now more valuable because people have transportation choices and greater access. This value is incremental in that it would not exist without the transit investment. It is typically valued by measuring such things as travel time savings resulting from the project. Other benefits, such as reduced congestion along the transit corridor, or on the road network more generally, are also incremental, because they result in the economy of the urban area working more efficiently - less congestion means less wasted time for workers and commercial traffic alike, as well as environmental benefits, safety benefits, and others as outlined in the Multiple Account Evaluation framework. The travel benefits resulting from a transit investment have already been captured in the cost-benefit analysis, which means that the development benefits have effectively already been included.
I The other type of land use impact is to spur development near transit stations. This is partly as a result of the increased convenience, noted above, and for other reasons – such as planning policy, and the transit station areas becoming desirable “nodes” that realize compound benefits – as more development occurs, the area becomes more desirable, spurring additional development. However, these benefits are generally not incremental to an urban economy – the argument being that the units that are built around transit stations would still have been built elsewhere in the urban area even if the transit investment was
Yonge North Subway Extension Benefits Case
33
not made. As such, while a station area may have tremendous development potential once transit service is introduced, the value of the development itself should not be counted as part of an economic benefit analysis, as it consists of redistributed, not additive or incremental, economic benefits.
The second point is particularly important to consider in the context of the Yonge North Subway
extension. Prior experience with the Sheppard Subway extension and the construction of the Yonge- University lines shows that there is clearly considerable increase in land development resulting from
transit investment. For example, media reports for the recent Sheppard Subway Extension indicated that more than $2 billion in new construction investment was generated by the construction of the
subway (which cost approximately $1 billion).
The challenge is to separate the value generated by the transit investment in the Yonge corridor
from the value of development that would have occurred elsewhere in the GTA. On Sheppard Avenue
there is evidence that the subway investment spurred considerable development and where the development was worth more than the cost of the project itself.
However, to accurately reflect the incremental economic benefit an assessment has to be made as to how much of the development that occurred in the Sheppard corridor would have happened
elsewhere regardless of the Sheppard subway extension, and this is impossible to do scientifically. Developer’s intentions are impossible to forecast, and allocations of future development based on
potential density increases are possible using assumptions, but cannot be grounded in any kind of
forward-looking market evaluation.
To illustrate this issue, we can look at the analysis undertaken by York Region to determine the
potential development for the five proposed subway stations in York Region. The analysis was limited to a 500 metre radius around the stations and it identified specific parcels with redevelopment
potential, assigned future densities to these parcels, and reported the total number of people and
jobs that would result from densification within the 500 metre station areas.
The analysis found very high potential densities within the 500 metre Station Impact Area (SIA) of the
stations with an increase of between 50% (Clark station in Thornhill) to 1000% (in the case of Richmond Hill Centre) over existing densities. While the build-out figures would require both very
aggressive development and very permissive planning policies, the forecast densities are comparable to the densities found in the Yonge-Eglinton and North York City Centre areas with much of the
densification occurring in a relatively short period of time.
However, it must again be reiterated that the evaluation of long-term development potential cannot be confused with evaluation of economic benefit – that while development potential is a significant
consideration in the selection of a transit route and technology, economic benefit analysis must consider only additive benefits in the calculations, which in this case means attempting to isolate the
amount of value that is created by the transit investment, and not just the amount of development that would be redistributed within greater Toronto. The analysis undertaken for this Benefits Case

Yonge North Subway Extension Benefits Case
involves comparing the land value uplift potential among the options relative to the Base Case to
demonstrate which option will have the largest impact. The land value potential is not a representation of the full or total value of increase in development potential in the corridor. That
total value can safely be concluded to be much greater than the number used in this report.
In order to provide a reasonable basis for this calculation, and as with the other land value analysis
projects, MKI developed a matrix of potential land value uplift percentages based on value impact
research from other North American urban centres as shown in Table 11. The ranges provided in the table are based on a compilation of research findings relating to land value uplift assessment around
transit stations and corridors in various countries, including Canada, the United States and the United Kingdom. The research also showed that there is a large variance in land value impacts as the studies
struggled to isolate the impacts of transit investment specifically amid the complex multitude of factors that determine land value. The ranges presented in Table 11 represent the mid-range of land
value impacts found in the reference material and shows the level of premium in land value that can
be expected for properties around the transit stations and for properties located along the right of way of the transit line.
TABLE 11 LAND VALUE PREMIUM
Technology Bus BRTLRT: at-grade
LRT: grade separated Subway GO Rail
Station impact Area (m) 100 400 500 600 800 800Premium %
Low 1% 2% 10% 15% 20% 20%High 2% 4% 25% 30% 50% 50%Low 1% 2% 10% 15% 20% 20%High 2% 4% 50% 50% 50% 50%Low 1% 1% 10% 10% 7% 7%High 2% 2% 50% 50% 15% 15%Low 0 0 1% 1% 5% 5%High 1% 2% 2% 2% 5% 5%
Technology Bus BRTLRT: at-grade
LRT: grade separated Subway GO Rail
Right of way impact Area (m) 0 0 200 200 0 300Premium %
Low 0 -5 -5High -10 -15 -15Low 0 0 0High -10 -15 -10Low 5 5 0High 10 10Low 0 0 0Hi
-10
gh 1 1(1) (1) (2) (3 )
Notes:
(2) no impact for underground subway since right of way impact area is underground.
(1) no impact for bus right of way impact areas, given that the short distance between bus stops creates situation where station impact areas are almost adjoining each other.
(3) Ref Landis et al (1994) found negative externalities from being too near commuter rail (within 300 m)
Residential
Office
Retail
Industrial
Residential
Office
Retail
Industrial
0
34

Yonge North Subway Extension Benefits Case
35
The impact of transit on land value needs to be considered in the context of both the land value uplift arising out of improvements in the transit infrastructure, as compared with the fact that there
are instances where the transit infrastructure is the enabler of development, without which there would be no development and hence no incremental value to the land. These situations include built
out urban environments, where no additional transportation capacity is possible without investment
in higher order transit; and also environments where transit investment is creating a new urban hub where there are no existing other catalysts to development.
For example, the existence of higher order transit frequently provides an argument to support increased density in planning permissions, the density in itself being a major contributor to the value
of a subject property. The various studies that inform Table 11 attempt to exclude impact that results from such increases to identify the land value uplift that could be attributed singularly to the
introduction of transit in an area.
Potential development in the area around the Yonge North Subway Extension has been extensively researched by York Region. The base data on existing development patterns compiled for this
exercise, together with the analytic assumptions have been referred to in preparing the land value analysis for this report.
Subway Station Areas As shown in Table 11, the station impact area for a subway station from a land value perspective can
extend outward to 800 metres or more. For the land value uplift calculation, we have based the analysis for the subway stations on a 500 metre SIA in order to be consistent with the prior York
analysis. In fact, extending the analysis to an 800 metre radius would result in relatively little
additional value uplift due to the proximity of the stations and overlapping SIAs. The exception to this is the Thornhill area, where the distance between Clark and Royal Orchard stations is
approximately 1.9 kilometres. However, it is worth noting that while values might increase in this area with an 800 metre SIA, heritage constraints on development are likely to strongly limit
redevelopment opportunities in the area.
BRT Station Areas Bus Rapid Transit technology is less effective than the subway in stimulating land value uplift. In addition to slower service, a BRT system is usually viewed as less permanent and is not viewed as
equally desirable from a development perspective. For this reason, research on uplift associated with BRT (albeit much less extensive than for subways) has typically found much lower land value uplift
associated with these projects, and identifies a smaller impact area for stops/stations. For the
purpose of this analysis, we have assumed a 400 metre SIA for the BRT stops/stations.

Yonge North Subway Extension Benefits Case
36
Land Value Uplift Calculation and Results For the purposes of demonstrating the land value uplift forecast for the options we have provided a
basic, high-level calculation of the potential difference in land value uplifts that would accrue at
each station impact area due to the introduction of different transit technologies. Since land value is so closely impacted by the vagaries of the market, it must be noted that the calculations are based
on assumed land values (informed by a small sample of current land values in the areas), and the distribution of land uses by Official Plan (OP) designation in the area. OP designations approximate
the current land use patterns and are a good long-term indicator of the mix and density of uses anticipated in the area. The calculation is based upon the ranges in Table 11, which covers the
broad range of impacts reflected in the research. The final numbers do not account for factors such
as potential additional planning policy measures that might drive density increases or the introduction of other land uses in the area, and are to be treated with considerable caution as there
are many, many other factors that affect the value of land.
In this calculation, we have identified the existing and/or designated land use in each of the station
impact areas identified, depending on the transit technology. The designated land use is then multiplied by an average land price per acre and the percentage impact is then applied to the
assumed land value for the subject area. The land value uplift calculations for the station areas
produce the following results.
Table 12 shows the potential incremental land value uplift associated with each option compared to
the Base Case.
TABLE 12 LAND VALUE UPLIFT
$ Million Low High
Option 1 482 1,205
Option 2 394 984
Option 3 32 65
Subway projects have been demonstrated in research to result in a wide range of value uplift, but for residential and commercial development, the range is generally between 20% and 50%. As the Yonge
corridor in this area is virtually all residential or commercial in nature, the incremental land value uplift resulting from extending the subway is estimated to be considerable.

Yonge North Subway Extension Benefits Case
37
Option 2 has somewhat lower potential land value uplift than Option 1, due to one less station. It
should be noted that due to development restrictions in the Thornhill area, the Royal Orchard station will likely experience considerable uplift – the existing properties will become more valuable - but
this may not translate into widespread redevelopment, as heritage restrictions may limit the size, scale, or feasibility of redevelopment in the area.
The land value uplift under Option 3 is positive compared to Base Case but minor in comparison with
the subway options.

Yonge North Subway Extension Benefits Case
38
Summary
Table 13 below summarizes the incremental economic development and land impacts that results
from the implementation of the Yonge North Subway extension.
TABLE 13 ECONOMIC DEVELOPMENT IMPACTS
Option 1
Option 2
Option 3
Total Impacts During Construction Period:
Employment (Person-years) GDP ($m) Income ($m)
21,800 2,100 815
20,700 1,990 775
800 30 75
Long-term Impacts in 2031:
Employment (jobs) GDP ($m) Income ($m)
187 7.0 18.1
181 6.8 17.5
62 2.3 6.0
Land value increase $m 482 -1,205 394 -984 32 - 65

Yonge North Subway Extension Benefits Case
39
Social Community Impacts This account examines each option from the community perspective with specific consideration given
to the ability of each option to enhance the quality of life within a local community. This may result
from land use changes or developments that can occur in response to the introduction of a new rapid transit line, as well as the improvements brought about by the enhanced accessibility, both locally
and regionally, offered by the new transit alternative. This account also considers the ability of each option to positively affect the overall health of the local community and its residents through
reduced auto congestion on local streets as well as the ability of transit to support a more balanced lifestyle for local residents and enhance personal safety. Visual impacts and noise are also assessed
as part of this account.
Land Use Impacts
The subway along Yonge has demonstrated how it can influence land development and densification around the stations. Compared to the Base Case it is expected that the Yonge North Subway
extension would have the same positive effect on densification between Finch and Richmond Hill as long as municipal planning and zoning guidelines support the development in the vicinity of the
subway stations.
There is not a big difference between the subway options in their ability to affect land use and
densification as Royal Orchard station, the station eliminated from Option 2, has somewhat limited
densification potential due to heritage restrictions.
The BRT will have less of an impact on accelerating development and supporting land use changes to
more dense communities in the corridor due to its perceived temporary nature.
Health
The ridership analysis shows that the subway will attract more new transit users compared to the
Base Case. Estimated new transit trips in 2031 amount to 2.2 million for Option 1 and 1.7 million for Option 2. Assuming these new trips consist of transit users who switched from the automobile to
transit, there will be a positive impact on health as people tend to walk/bike more to access transit.
The same is true for the BRT, but to a lesser extent due to fewer new transit users.
Accessibility
For the passengers transferring from local buses, the BRT would be easier and faster to access due to
its at-grade stations.
For passengers on VIVANext, a transfer to the subway is still required, but under the BRT option it
will be at Finch Station and in the subway options at Richmond Hill.

Yonge North Subway Extension Benefits Case
40
For passengers that currently drive to connect to the subway at Finch to go south in the morning, the
subway options will provide an opportunity for parking at Langstaff which may shorten the commute time as they avoid the congested roads. This opportunity does not exist with the BRT.
There is little difference between the subway options in terms of accessibility. Both options have the same service frequency and speed. However, Option 1 has somewhat higher accessibility due to
one extra station at Royal Orchard which would benefit users in this area.

Yonge North Subway Extension Benefits Case
41
Sensitivity Analysis
Discount Rate
Since the analysis is based on discounted cash flow and subject to changes as the discount rate changes, the robustness of the ranking of the options with respect to the benefit-cost ratio was
tested under two alternative discount rates – 3% and 7%. As shown in Table 14, the lower the discount rate the better the options perform.
TABLE 14 DISCOUNT RATE SENSITIVITY ANALYSIS
Discount Rate 3% 5% 7%
NPV ($m) BCR NPV ($m) BCR NPV ($m) BCR
Option 1 (182) 0.9 (541) 0.7 (736) 0.6
Option 2 (225) 0.9 (548) 0.7 (722) 0.6
Summary Results The results from the Multiple Account Evaluation are summarized in the table below.
Overall there is very little difference between the two subway options. The benefit-cost ratio for both options is 0.7. Option 1 has a $7 million better overall net present value at a discount rate of
5%.
The subway options provide higher service quality and reliability than the BRT. Analysis suggests BRT would most likely experience substantial crowding in peak periods and would not provide a long term
solution in addition to not being as reliable as the subway.
The subway options have much larger positive environmental, economic, land development and
community impacts than the BRT. As shown in the table below the value of the GHG emissions is about half for the BRT compared to the subway options. The BRT would also have a larger impact on
GHG emissions from running diesel buses and adding to traffic congestion in the corridor.
The economic impacts of the subway options are considerable, especially during construction. Some 21,800 person-years of employment are expected to be generated by Option 1 (this includes both
direct and indirect impacts). For Option 2 the estimate is 20,700 person-years of employment while for Option 3 the estimate is 800 person-years of employment.

Yonge North Subway Extension Benefits Case
42
Subways have shown to the most effective technology in stimulating land development around
stations and the analysis shows substantial increase in development and land value provided municipal planning and zoning support the development. The incremental value of land
development is estimated at between $500 million to $1.2 billion for Option 1 with slightly lower values for Option 2. Under Option 3 not much land uplift is expected – between $32 and $65
million – due to the perceived temporary nature of a bus based system in this corridor.
Note that extension of the subway north to Richmond Hill will have an effect on capacity constraints on Bloor-Yonge station. This report includes a proportion of these costs based on the extension’s
ridership effect on that section. While the majority of the capacity issues at Bloor-Yonge are related to ridership growth, for this project to proceed the necessary improvements which would relieve
capacity issues at Bloor-Yonge Station may need to be funded.
The results from the Greater Golden Horseshoe Model indicate that the demand for the BRT in 2021
greatly exceeds the maximum capacity of the technology as contemplated in this report. The BRT
assumes a dedicated busway with at-grade stops, articulated vehicles and the buses would run segregated from traffic. While the capacity of the BRT could be expanded slightly, the analysis
suggests that technology may not have sufficient capacity for the long-term needs of the corridor.
It is important to note that this report is part of an ongoing study and planning effort by York Region,
the City of Toronto, TTC, and Metrolinx regarding the complex and integrated Yonge Subway corridor. Other studies currently underway include:
I TTC Subway Rail Yards Needs Study (underway)
I Rapid Transit Options for Downtown Toronto (underway)
I Metrolinx Richmond Hill GO rail improvements Benefits Case (underway), for Milton, Barrie, Richmond Hill and Stouffville corridors
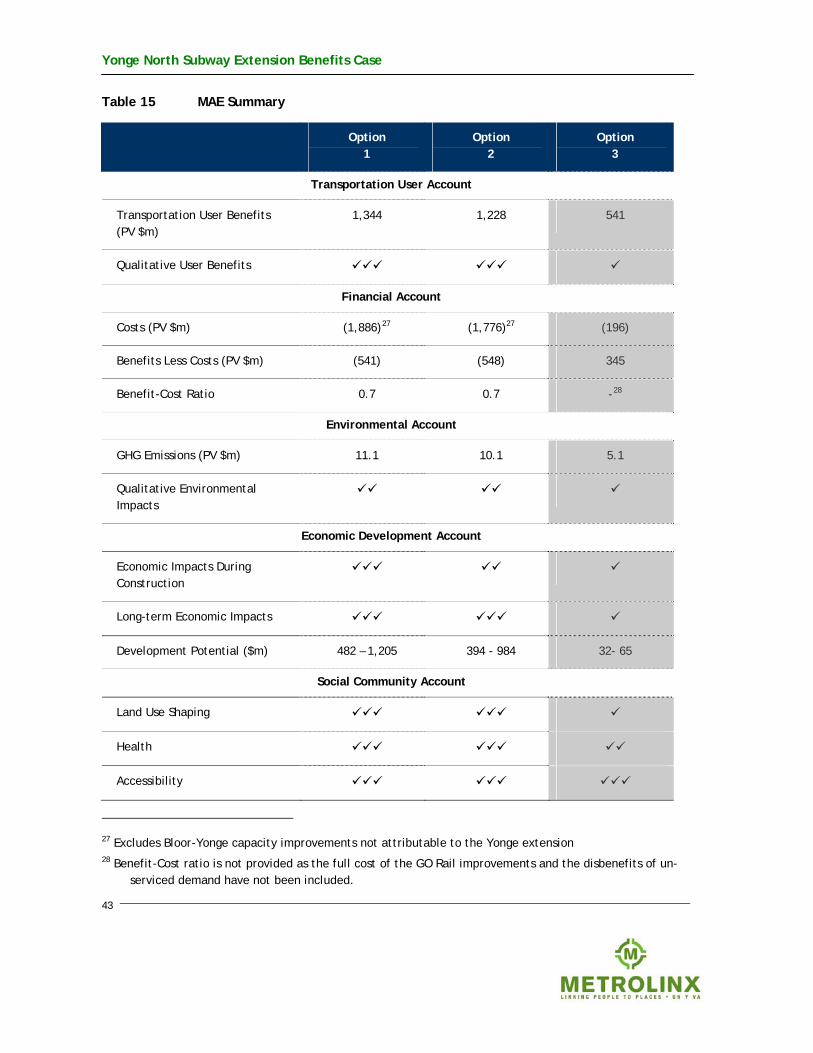
Yonge North Subway Extension Benefits Case
43
Table 15 MAE Summary
Option 1
Option 2
Option 3
Transportation User Account
Transportation User Benefits (PV $m)
1,344 1,228 541
Qualitative User Benefits
Financial Account
Costs (PV $m) (1,886)27 (1,776)27 (196)
Benefits Less Costs (PV $m) (541) (548) 345
Benefit-Cost Ratio 0.7 0.7 -28
Environmental Account
GHG Emissions (PV $m) 11.1 10.1 5.1
Qualitative Environmental Impacts
Economic Development Account
Economic Impacts During Construction
Long-term Economic Impacts
Development Potential ($m) 482 – 1,205 394 - 984 32- 65
Social Community Account
Land Use Shaping
Health
Accessibility
27 Excludes Bloor-Yonge capacity improvements not attributable to the Yonge extension 28 Benefit-Cost ratio is not provided as the full cost of the GO Rail improvements and the disbenefits of un-
serviced demand have not been included.

Yonge North Subway Extension Benefits Case
APPENDIX
A
INPUT VARIABLES AND ASSUMPTIONS

Yonge North Subway Extension Benefits Case
Factor Value Source
Discount Rate Sensitivity Analysis
5% (real terms) 3% and 7%
Province of Ontario
Value of Time Business Other Weighted Average
$35.16 (2008$) $10.82 $13.02
Transport Canada, Greater Golden Horseshoe Model
Value of Time Growth 1.64% per annum Based on GDP per capita increases, GDP/ Population estimates from www.greatertoronto.org
Average Accident Cost $0.07 per km Collision Statistics: 2004 Canadian Motor Vehicle Traffic Collision Statistics, TP3322. Vehicle Kilometers: Statistics Canada, Catalogue No. 53–223–XIE, "Canadian Vehicle Survey"
Greenhouse Gas Emissions 2006 2021 2031
2.39 kg /l or 0.23 kg per km 2.35 kg /l or 0.21 kg per km 2.35 kg /l or 0.20 kg per km
Urban Transportation Emissions Calculator, Transport Canada, Greater Golden Horseshoe Model
Average Cost of CO2
$0.01 per km
$40/tonne (median cost)
Several literature sources, Transport and Environment Canada, Greater Golden Horseshoe Model and http://envirovaluation.org/index.php/ 2007/09/06/university_of_hamburg_ forschungsstelle_n_1
Auto Operating Costs 2007 2021 2031
In 2008$ + 2.0% p.a. increase $0.60/km $0.78/km $0.95/km
Data in 2007 based on CAA calculation of average driving costs and includes operating and ownership costs (long-term costs).
Increase based on Greater Golden Horseshoe Model
Annualisation Factors: Metro / LRT / BRT Road
Peak-daily/Daily-Annual 3 / 300 10 / 300
Greater Golden Horseshoe Model

Appendix
Control Sheet
CONTROL SHEET
Project/Proposal Name Metrolinx Benefits Case
Document Title Yonge North Subway Extension Benefits Case
Client Contract/Project No.
SDG Project/Proposal No. 22010801
ISSUE HISTORY
Issue No. Date Details
1 13 March 2009 Draft
3 23 April 2009 Revised draft
5 8 May 2009 Final draft
7 1 June 2009 Final Report
REVIEW
Originator Eva Hage
Other Contributors Dan Gomez-Duran, FMR
Review by Print Eva Hage
Sign
DISTRIBUTION
Clients Metrolinx
Steer Davies Gleave: Project Team