metro boston office… · with construction freezes in boston and cambridge still in play and...
TRANSCRIPT

303 CONGRESS STREET | BOSTON, MA 02210 | 617.457.3400 | HUNNEMANRE.COM
METRO BOSTON OFFICE MARKET REPORT
FIRST QUARTER | 2020
2 | METRO BOSTON OFFICE | Q1 2020
GREATER BOSTON OFFICE MARKET OVERVIEW
Over the last eleven years, The Greater Boston Area (GBA) has exhibited the longest economic
expansion since the Post World War II Era and has emerged as an international business hub and a
world leader in technology and the life sciences. Similarly, the GBA’s office market has run parallel,
helping provide the region with the largest construction boom since the same time period which has
allowed for the adoption of a significantly more diverse industry base now more than ever before.
However, while the GBA does provide a buffer against global forces that hinder this growth through
the economic backbones of healthcare and education, the metro is still subject to the universal
headwinds brought on by unseen circumstances such the COVID-19 pandemic which is currently
sweeping the country.
Having performed steadily during this quarter, the Greater Boston office market started off 2020
similar to the past three years with a slowdown in leasing activity compared to the prior quarter.
With many year-end decisions being made last quarter to help the GBA achieve one of its largest
years in recent history as it relates to the velocity of leasing and absorption, not nearly as many
transactions were left to execute and the uncertainty surrounding the global pandemic has only
minimized decision-making further. For now, most developers, tenants, and landlords alike are
hitting the pause button on decisions that are allowed to be pushed off until more economic clarity
is found on both local and national scale. That being said, the market has not come to a halt and
many of the cylinders that are needed to ensure solid fundamentals moving forward are still firing.
Most importantly, a significant supply injection is underway to help alleviate historically high office
rents and provide tenants with an wider array of options as the GBA evolves. Just over 2 million
square feet of new supply has kicked off this quarter across the metro and while mainly concentrated
in the Urban Market, the Route 128 Market is transforming into a destination-market. Historically a
relief valve for Boston and Cambridge, Route 128 is becoming a top choice for tenants considering a
move to recently built Class A space or unique product such as Brick and Beam which has become
limited. With over 11 million square feet in the construction pipeline, over 50% is already preleased,
most of which will deliver in 2021.
Average asking rents were static this quarter with the exception of select pockets such as Watertown
and Somerville which are being squeezed by overspill from the Cambridge market and a lack of
options on the northern and southern portions of the Route 128 Market. 2019 marketed the largest
annual increase in average asking rent throughout the region over the last decade and with leasing
activity down this quarter, limited pressure has been placed on rates over the last three months.
Moreover, net absorption remained flat this quarter with significant space give-backs along Route
495 and in Boston, limiting market growth. However, between Cambridge and the Route 128
submarket, occupancy gains were enough to put the market into positive territory with just under
500,000 square feet of net absorption taking place.
Looking ahead, limited pressure on urban market rents is expected to persist in the short-term
with construction freezes in Boston and Cambridge still in play and tenants hesitant to make
immediate decisions if they are able to. Furthermore, tenant build-outs are anticipated to be less
popular through the remainder of the year with more companies expected to be agile with time-to-
occupancy projects. This is expected to bode well for landlords who have built-out spec suites and
can capture tenants in a tighter window. Conversely, tenants who are able to renew and extend their
current leases in the short term are expected to do so to defer real estate decisions at the moment.
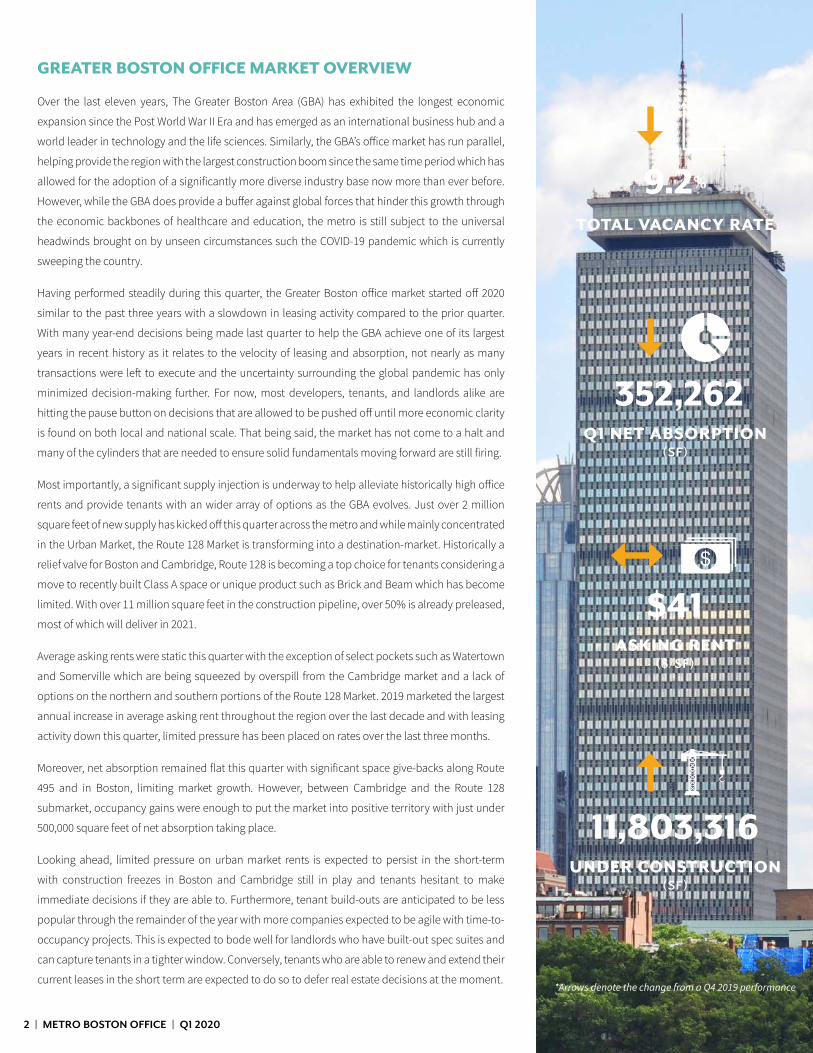
9.2%
TOTAL VACANCY RATE
352,262Q1 NET ABSORPTION
(SF)
$41 ASKING RENT
($/SF)
11,803,316UNDER CONSTRUCTION
(SF)
*Arrows denote the change from a Q4 2019 performance

3 | METRO BOSTON OFFICE | Q1 2020
BOSTON OFFICE
• While a significant portion of the active requirements in Boston have
paused, a plethora of tenants are still expected to be on the hunt for space
with companies such as the Cambridge Innovation Center, Hill Holiday,
and Eaton Vance still exploring new options with an emphasis on new
construction; which has been in play for most users looking for above
50,000 square feet since existing blocks in this size range are still limited
throughout the City.
• Asking rents have reached peak levels for 2020 considering a significant
slowdown in leasing activity is taking place. Landlords have yet to raise
asking rents in most cases as they anticipate the market uncertainty to
persist over the next quarter at minimum. With a significant amount of trades
taking place over the last five years, rents have been underwritten to climb
and while that is still very possible over the next several years, shorter term
lease renewals and extensions are in considerations to pacify uncertainty
on the short-term horizon. This will potentially allow landlords to get higher
rates, sooner rather than later, if demand levels similar to 2019 reignite.
• With negative absorption taking place in Boston this quarter, vacancy
ticket upward to 6.2% but remains well below the 10-year average of 8.5%.
While vacancy is expected to increase further this year due to recent job
losses which have mainly been concentrated in Boston, similar to past
market corrections, the expectation is that more sublease space is going
to be put back on the market than in the last few quarters.
• Already having undergone scrutiny in 2019 through investment models
made public by WeWork, coworking occupancy is expected to bounce
back if operators can weather the storm. Coworking platforms such
as WeWork, Industrious, and landlord-run flex office operations made
up a substantial amount of absorption over the last two years and
while most are struggling right now due to economic uncertainty and
the unwillingness for employees work in close quarters due to social
distancing practices, the flexible term solutions they provide may be
something users can lean on if the market corrects.
TOTAL VACANCY
QUARTERLY NET ABSORPTION
GROSS ASKING RENTS
$0
$20
$40
$60
$80
$100
$/SF
BAC
K B
AY
FIN
AN
CIA
L D
ISTR
ICT
SEA
PORT
CH
ARL
ESTO
WN
MID
TOW
N
NO
RTH
STA
TIO
N
ASKING RENT RANGE WEIGHTED AVERAGE
0%
12%
10%
8%
6%
4%
2%
2013 2014 2015 2016 2017 2018 2019 2020
0
-600
-400
-200
200
400
600
800
1,000
1,200
SQU
AR
E FE
ET(t
hous
and
s)
2013 2014 2015 2016 2017 2018 2019 2020
CLASS A CLASS B
TOTAL VACANCYRATE
Q1 NET ABSORPTION(SF)
ASKING RENT($/SF)
UNDER CONSTRUCTION(SF)
6.2% (502,334) $61 6,170,832
*Asking rent ranges denote the highest and lowest rents on gross basis

4 | METRO BOSTON OFFICE | Q1 2020
CAMBRIDGE & INNER SUBURBS OFFICE
• The office market in Cambridge remains on solid footing with the
exception of new supply which continues to play catch-up to the rest of
the submarket. With virtually no space options in Mid and East Cambridge,
tenants are being faced to look outside the market. Specifically, these
include parts of the western and northern suburbs, as well as crossing over
the Charles to Boston where an urban employee base can still be tapped
in full potential and access to the redline is maintained. Major projects at
Cambridge Crossing and in Kendall Square will bring more supply to the
market next year but much more will need to be built to counteract the lab
market which is accounting for the brunt of leasing and new supply on the
horizon. Of the 2 million square feet of office construction taking place,
almost 80% is already preleased.
• Similar to most markets, asking rents have remained in line with the
previous quarter. East Cambridge saw a slight uptick in asking rents and is
expected to draw more demand due to the unique position the submarket
is currently in from activity surrounding the life science sector. Most users
in this sector need lab space but the majority of the operations relies on
office space for administrative and sale operations. As the global dynamic
surrounding the life sciences is put under the microscope through the
COVID-19 pandemic, East Cambridge could become a ground-zero for
further therapies beyond what is just being explored by only several
companies at the moment such as Moderna. As the largest biotech hub
in the world, Cambridge is positioned to capture a large wave of demand
as collaboration between innovative companies become even more
essential and important to ramp up quickly in a short timeframe.
• Approximately 350,000 square feet of net absorption registered in Cambridge
this quarter, most of which was driven by the delivery of 222 Jacobs Street,
Philips new North American headquarter, where they are accompanied by
Thrive Early Detection and Cerevel Therapeutics. On the other side of the
equation, office space in West Cambridge continues to be affected by the
lab market with just over 300,000 square feet of space vacated in the last
twelve months in order to make way for more lab product. While some tech
companies such as Hubspot are starting to retract in size in East and Central
Cambridge to find rent relief in the GBA’s most expensive submarket.
TOTAL VACANCY
QUARTERLY NET ABSORPTION
GROSS ASKING RENTS
$50
$60
$70
$80
$90
$100
$110
$/SF
EAST
CA
MBR
IDG
E
MID
CA
MBR
IDG
E
WES
T C
AM
BRID
GE
ASKING RENT RANGE
0%
10%
8%
6%
4%
2%
2013 2014 2015 2016 2017 2018 2019 2020
0
-200
200
400
600
800
1,000
SQU
AR
E FE
ET(t
hous
and
s)
2013 2014 2015 2016 2017 2018 2019 2020
CLASS A CLASS B
TOTAL VACANCYRATE
Q1 NET ABSORPTION(SF)
ASKING RENT($/SF)
UNDER CONSTRUCTION(SF)
2.6% 353,196 $57-105 2,017,300

5 | METRO BOSTON OFFICE | Q1 2020
SUBURBAN OFFICE
• Driven primarily by an active Route 128 corridor, the suburban office
market carried the GBA posting the most positive absorption in Q1. This
absorption was mainly credited to expansions from existing tenants and
new tenants to the market, relocating to escape the high prices closer to
Boston. Most of the +/-450,000 square feet of the office space absorbed
went to several of the new construction projects along Route 128 West. The
North submarket of 128, the tightest of the submarkets, saw an additional
224,000 square feet of positive absorption through a healthy volume of
small to mid-size lease transactions. The size of those transactions was
do in most part to the dearth of large block space options for Tenant’s in
that the submarket.
• Several new construction projects totaling +/-1,000,000 square feet of Class
A space commenced this quarter throughout the suburbs with the majority
in the 128 West submarket. In addition, new construction projects with
expected delivery in Q2 2021 have broken ground in the Inner Burbs and
Quincy. Unlike much of the new construction in the CBD, many of these
new suburban projects were designed with “flexibility of use” in mind, with
the goal of attracting both office users and lab/biotech Tenants. These
new facilities are designed with larger floor plates, more floor-by-floor clear
heights to accommodate sophisticated infrastructure and on-site parking
not typically available to lab tenants. The suburbs provide lab and biotech
Tenants a dramatic cost savings in contrast to the expensive lab “hot bed”
areas of Cambridge and Watertown, priced accordingly due to their proximity
to Boston, the universities and hospitals and talent pool. Lab and biotech
users currently represent a significant amount of the active requirements in
the suburbs and have absorbed much of the new construction to date.
• With the exception of inner suburban pockets like Watertown and
Somerville, asking rents have remained motionless with Class B asking
rents ticking downward slightly. Watertown in particular is seeing the most
pressure on rents through a three-pronged market dynamic where overspill
from Cambridge, demand from the western suburbs and an encroaching
lab market is putting upward pressure on rates as tenants try to find what
value is left in a city that has almost no office space left.
TOTAL VACANCY
QUARTERLY NET ABSORPTION
GROSS ASKING RENTS
$0
$10
$20
$30
$40
$50
$/SF
INN
ER S
UBU
RBS
ROU
TE 12
8 N
ORT
H
ROU
TE 12
8 N
ORT
HW
EST
ROU
TE 12
8 W
EST
ROU
TE 12
8 SO
UTH
FRA
MIN
GH
AM
/NA
TICK
ROU
TE 4
95 N
ORT
HEA
ST
ROU
TE 4
95 N
ORT
H
ROU
TE 4
95 W
EST
ROU
TE 9
5 SO
UTH
ASKING RENT RANGE WEIGHTED AVERAGE
0%
25%
20%
15%
10%
5%
2013 2014 2015 2016 2017 2018 2019 2020
ROUTE 128 ROUTE 495
0
-800
-400
-600
-200
200
400
600
800
1,000
SQU
AR
E FE
ET(t
hous
and
s)
2013 2014 2015 2016 2017 2018 2019 2020
CLASS A CLASS B
TOTAL VACANCYRATE
Q1 NET ABSORPTION(SF)
ASKING RENT($/SF)
UNDER CONSTRUCTION(SF)
12.4% 501,400 $27 3,615,184

6 | METRO BOSTON OFFICE | Q1 2020
NOTABLE TRANSACTIONS
260 FRANKLIN STREETA BOSTON
60 STATE STREETBOSTON
1 RESSEARCH DRIVEWESTBOROUGH
4 TECHNOLOGY DRIVE PEABODY
Company Acadian Asset Management Company Pioneer Investment Company Company Park Palace Technologies Company Converge
Size 108,000 SF Size 99,000 SF Size 84,000 SF Size 77,000 SF
Submarket Financial District Submarket Financial District Submarket Route 495 West Submarket Route 128 North
ONE FINANCIAL CENTER BOSTON
125 HIGH STREETBOSTON
200 CLARENDON STREETBOSTON
25 UPTON DRIVE WILMINGTON
Company Brown Rudnick Company GID Company TA Associates Company Eckert & Ziegler Radiopharma
Size 57,000 SF Size 47,000 SF Size 47,000 SF Size 40,000 SF
Submarket Financial District Submarket Financial District Submarket Back Bay Submarket Route 128 North
10-20 CHANNEL STREET BOSTON
205 LOWELL ST WILMINGTON
275 GROVE STREETNEWTON
99 HIGH STREETBOSTON
Company United Way Company AeroVironment Company Paypal Company True Motion
Size 40,000 SF Size 40,000 SF Size 37,000 SF Size 27,000 SF
Submarket Seaport Submarket Route 128 West Submarket Route 128 West Submarket Financial District

7 | METRO BOSTON OFFICE | Q1 2020
URBAN BOSTON
STATUS ON THE HORIZON FILED CITY APPROVED READY TO GO UNDERWAY
Total 6,285,630 6,285,630 3,003,500 3,028,000 4,856,980
Available 5,861,230 5,861,230 3,003,500 2,468,000 2,405,627
Leased 0 0 0 560,000 2,451,353
% Leased 0% 0% 0% 18% 50%
DELIVERY YEAR 20' 21' 22' 23' 24'+
Total 903,000 1,923,353 1,018,627 1,012,000 11,252,130
Available 338,000 547,000 1,018,627 502,000 10,267,730
Leased 565,000 1,376,353 0 510,000 560,000
% Leased 63% 72% 0% 50% 5%
CAMBRIDGE
STATUS ON THE HORIZON FILED CITY APPROVED READY TO GO UNDERWAY
Total 400,000 400,000 150,000 985,000 3,411,023
Available 400,000 400,000 150,000 985,000 558,247
Leased 0 0 0 0 2,852,776
% Leased 0% 0% 0% 0% 84%
DELIVERY YEAR 20' 21' 22' 23' 24'+
Total 3,532,023 0 0 0 0
Available 679,247 864,000 0 150,000 400,000
Leased 2,852,776 0 0 0 0
% Leased 81% N/A N/A N/A N/A
INNER RING
STATUS ON THE HORIZON FILED CITY APPROVED READY TO GO UNDERWAY
Total 4,654,400 4,654,400 2,411,350 2,642,965 1,752,789
Available 4,654,400 4,654,400 2,231,350 2,367,965 1,301,317
Leased 0 0 0 275,000 451,472
% Leased N/A N/A 0% 10% 26%
DELIVERY YEAR 20' 21' 22' 23' 24'+
Total 1,062,433 0 0 0 0
Available 610,961 1,374,321 211,000 0 9,593,750
Leased 451,472 0 275,000 0 0
% Leased 42% N/A N/A N/A N/A
128 BELT
STATUS ON THE HORIZON FILED CITY APPROVED READY TO GO UNDERWAY
Total 1,040,000 1,040,000 962,000 1,059,000 1,081,510
Available 1,040,000 1,040,000 962,000 889,000 739,510
Leased 0 0 0 0 342,000
% Leased 0% 0% 0% 0% 32%
DELIVERY YEAR 20' 21' 22' 23' 24'+
Total 513,890 0 0 0 0
Available 171,890 647,620 0 0 3,186,000
Leased 342,000 0 0 0 0
% Leased 67% N/A N/A N/A N/A
GREATER BOSTON DEVELOPMENT PIPELINEOFFICE & LAB SPACE

8 | METRO BOSTON OFFICE | Q1 2020
OFFICE RECAP
TOTAL INVENTORY SF
UNDER CONSTRUCTION
"DIRECT VACANT"
SUBLEASE VACANT
"TOTAL VACANT SF"
"TOTAL VACANCY
RATE"
Q1 NET ABSORPTION
12-MONTH NET ABSORPTION
AVERAGE ASKING RENT
Total Market 221,560,837 11,803,316 18,210,996 2,075,533 20,286,529 9.2% 352,262 1,898,827 $41
Urban Market 100,496,295 8,188,132 4,506,865 814,667 5,321,532 5.3% (149,138) 1,345,790 N/A
Boston 74,811,544 6,170,832 4,191,542 463,180 4,654,722 6.2% (502,334) 589,234 $61
Back Bay 15,150,560 0 324,365 64,196 388,561 2.6% (45,179) 341,234 $77
Financial District 36,974,655 1,942,038 2,162,184 248,339 2,410,523 6.5% (273,683) 3,344 $62
Seaport 11,619,790 1,980,400 1,310,086 77,983 1,388,069 11.9% (20,717) 222,952 $60
Charlestown 2,487,985 109,000 83,229 6,785 90,014 3.6% (55,014) (45,485) $49
Fenway 2,027,769 275,645 34,868 16,940 51,808 2.6% (48,608) (48,608) N/A
Midtown 2,287,595 235,000 112,170 23,184 135,354 5.9% (38,030) (44,852) $56
North Station 3,040,190 1,628,749 159,400 24,259 183,659 6.0% (27,510) 144,899 $58
South Station 1,223,000 0 5,240 1,494 6,734 0.6% 6,407 15,750 N/A
Cambridge 25,684,751 2,017,300 315,323 351,487 666,810 2.6% 353,196 756,556
East 15,208,585 1,714,423 141,391 146,986 288,377 1.9% 340,706 764,758 N/A
Mid 7,572,444 302,877 67,769 46,761 114,530 1.5% 2,729 (17,211) N/A
West 2,903,722 0 106,163 157,740 263,903 9.1% 9,761 9,009 $58
Suburban Market 121,064,542 3,615,184 13,704,131 1,260,866 14,964,997 12.4% 501,400 553,037 $27
Route 128 83,833,504 3,405,184 7,068,194 901,338 7,969,532 9.5% 714,922 812,663 $32
Inner Suburbs 6,234,607 1,816,155 427,509 12,433 439,942 7.1% 99,025 103,808 $36
North 14,721,514 364,031 1,021,874 83,167 1,105,041 7.5% 109,736 121,029 $25
Northwest 15,742,255 210,700 1,136,151 76,929 1,213,080 7.7% (16,486) (22,665) $35
West 25,933,011 507,620 1,952,313 534,469 2,486,782 9.6% 448,514 492,109 $38
South 16,413,238 347,276 1,904,206 123,732 2,027,938 12.4% 78,045 101,283 $28
Framingham/Natick 4,788,879 159,402 626,141 70,608 696,749 14.5% (3,912) 17,099 $27
Route 495 37,231,038 210,000 6,635,937 359,528 6,995,465 18.8% (213,522) (259,626) $20
Northeast 7,836,084 0 1,387,436 17,438 1,404,874 17.9% (91,867) (128,225) $19
North 13,802,627 60,000 2,920,648 179,804 3,100,452 22.5% (175,228) (32,080) $20
West 11,973,397 150,000 2,038,607 162,286 2,200,893 18.4% 44,285 (115,650) $21
South 3,618,930 0 289,246 0 289,246 8.0% 9,288 16,329 $19

9 | METRO BOSTON OFFICE | Q1 2020303 CONGRESS STREET | BOSTON, MA 02210 | 617.457.3400 | HUNNEMANRE.COM
METHODOLOGY
Source: Co-Star, Hunneman. Prepared: March 2020.
Disclaimer: The above data is from sources deemed to be generally reliable, but no warranty is made as to the accuracy of the data nor its usefulness for any particular purpose.
Average Rental Rates are asking rents on direct space. Vacant space includes both direct and sublease space.
TUCKER WHITE Director of Research
978.828.5141 [email protected]
JAMES FIFTALSenior Research Analyst
HEATHER CHAPMANGraphics Manager