methylxanthine drug monitoring with wearable...
TRANSCRIPT

CommuniCation
1707442 (1 of 8) © 2018 WILEY-VCH Verlag GmbH & Co. KGaA, Weinheim
www.advmat.de
Methylxanthine Drug Monitoring with Wearable Sweat Sensors
Li-Chia Tai, Wei Gao, Minghan Chao, Mallika Bariya, Quynh P. Ngo, Ziba Shahpar, Hnin Y. Y. Nyein, Hyejin Park, Junfeng Sun, Younsu Jung, Eric Wu, Hossain M. Fahad, Der-Hsien Lien, Hiroki Ota, Gyoujin Cho, and Ali Javey*
L.-C. Tai, Dr. W. Gao, M. Chao, M. Bariya, Q. P. Ngo, Z. Shahpar, H. Y. Y. Nyein, E. Wu, Dr. H. M. Fahad, Dr. D.-H. Lien, Dr. H. Ota, Prof. A. JaveyDepartment of Electrical Engineering and Computer SciencesUniversity of CaliforniaBerkeley, CA 94720, USAE-mail: [email protected]. Tai, Dr. W. Gao, M. Chao, M. Bariya, Q. P. Ngo, Z. Shahpar, H. Y. Y. Nyein, E. Wu, Dr. H. M. Fahad, Dr. D.-H. Lien, Dr. H. Ota, Prof. A. JaveyBerkeley Sensor and Actuator CenterUniversity of CaliforniaBerkeley, CA 94720, USAL.-C. Tai, Dr. W. Gao, M. Chao, M. Bariya, Q. P. Ngo, Z. Shahpar, H. Y. Y. Nyein, E. Wu, Dr. H. M. Fahad, Dr. D.-H. Lien, Dr. H. Ota, Prof. A. JaveyMaterials Sciences DivisionLawrence Berkeley National LaboratoryBerkeley, CA 94720, USAH. Park, J. Sun, Dr. Y. Jung, Prof. G. ChoDepartment of Printed Electronics EngineeringSunchon National University255 Jungang-ro, Suncheon-si, Jeollanam-do 57922, Republic of Korea
The ORCID identification number(s) for the author(s) of this article can be found under https://doi.org/10.1002/adma.201707442.
DOI: 10.1002/adma.201707442
Drug analysis is the chemical testing of human biological samples to determine the subject’s drug history. It is commonly implemented for doping control, drug abuse testing, forensic investigation, clin-ical therapeutics, and digital health moni-toring.[1–3] Sources of biological specimens for drug analysis include blood, urine, saliva, hair, sweat, and exhaled breath.[4–10] Conventional blood analysis provides the most direct and accurate approach to track drug dosage, but it is an invasive technique with limited sample collec-tion. Recently, in situ sweat analysis is quickly becoming an attractive alternative in noninvasive diagnosis.[11,12] The dis-tinct nature of secretion, accessibility, and abundance in biomolecules make human sweat an ideal candidate for point-of-care health monitoring.[11–14]
Recent advances in wearable biosensors have made great strides in providing nonobstructive and on-site analysis of human health conditions.[14–32] A sensitive and selective approach to multiplexed sensing of sweat biomole-cules can be achieved by utilizing wearable electrochemical sen-sors.[14,19,21] Such sensors usually consist of flexible sensors for signal transduction coupled with electrical circuit components for signal conditioning and data transmission. This platform provides users with valuable physiological insight into their states of health. Previously reported wearable sweat sensors are capable of monitoring electrolytes and metabolites (sodium, potassium, glucose, lactate, etc.) for health monitoring and dis-ease diagnosis via traditional techniques such as amperometry, potentiometry, colorimetry, etc.[19–27] However, designing wear-able sweat sensors capable of retrieving information regarding drug intake, which is important for disease treatment, remains to be an obstacle. The detection of drug molecules is chal-lenging owing to their ultralow concentrations in biofluids, and it usually requires very different detection mechanisms. As an example, the differential pulse voltammetry (DPV) is commonly employed to detect drug molecules. The mechanism is based on oxidation of the target molecule at its distinct oxidation potential. The corresponding current flow is then measured with an undesirable capacitive component eliminated to allow sensitive determination of the molecule’s concentration.[33–36] The oxidation potential involved in the DPV detection can be
Drug monitoring plays crucial roles in doping control and precision medicine. It helps physicians tailor drug dosage for optimal benefits, track patients’ compliance to prescriptions, and understand the complex pharmacokinetics of drugs. Conventional drug tests rely on invasive blood draws. While urine and sweat are attractive alternative biofluids, the state-of-the-art methods require separate sample collection and processing steps and fail to provide real-time information. Here, a wearable platform equipped with an electro-chemical differential pulse voltammetry sensing module for drug monitoring is presented. A methylxanthine drug, caffeine, is selected to demonstrate the platform’s functionalities. Sweat caffeine levels are monitored under various conditions, such as drug doses and measurement time after drug intake. Elevated sweat caffeine levels upon increasing dosage and confirmable caf-feine physiological trends are observed. This work leverages a wearable sweat sensing platform toward noninvasive and continuous point-of-care drug monitoring and management.
Drug Monitoring
Adv. Mater. 2018, 1707442
© 2018 WILEY-VCH Verlag GmbH & Co. KGaA, Weinheim1707442 (2 of 8)
www.advmat.dewww.advancedsciencenews.com
relatively high, so stringent requirements on electrode stability to retain sensor integrity at high operating potential are nec-essary.[35,36] Thus, a sensible strategy to design wearable drug sensors is to combine high potential resilient electrochemical sensors and integrated circuitry devised with DPV implementa-tion. Specifically, this can be achieved by consolidating large-scale and low-cost printed carbon electrodes and printed circuit boards (PCBs).
Here, we present a wearable sweat band (s-band) for non-invasive and in situ monitoring of drug levels. In this work, caffeine is selected as an example methylxanthine drug to demonstrate the sensor’s functionalities. Caffeine is a rela-tively safe drug and widely dosed through coffee, tea, and other related commercial products. Clinically, its chronic overdose can potentially lead to health problems such as coro-nary syndromes, hypertension, and depression.[37–39] It is also an ergogenic drug restricted in official athletic competitions, which often require standard assessment of urine caffeine prior to tournaments.[40] It has been reported that urine caf-feine concentration correlates with both plasma and sweat caffeine concentrations.[41,42] Thus, monitoring sweat caffeine would effectively provide us with insight into caffeine levels. More importantly, the DPV detection technique for caffeine is fundamentally similar to those used for many other types of drugs,[33–35] so we envision that this sensor platform can be exploited toward detection of a number of other drugs. In this work, caffeine detection is successfully performed in collected human sweat samples as well as on-body to investigate the influence of caffeine dosage upon sweat caffeine levels using the s-band platform. This platform resolves the technological challenge of wearable sweat sensors for drug monitoring and
can serve as a powerful tool that paves the way for continuous and noninvasive drug monitoring.
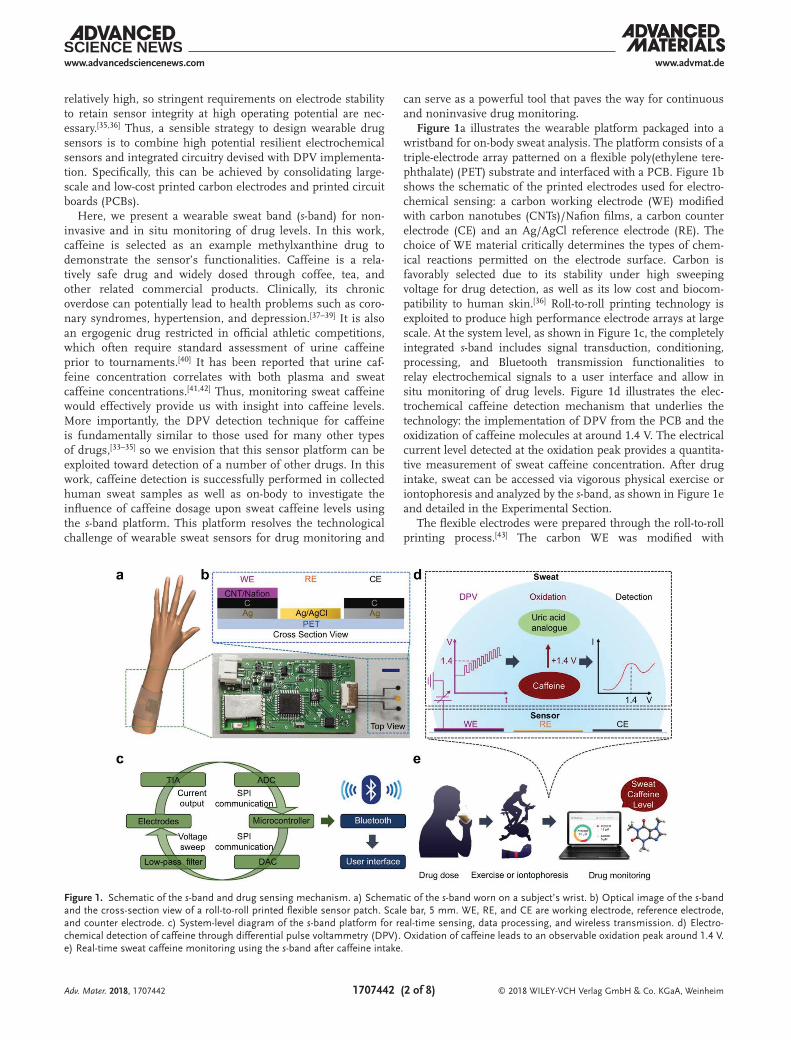
Figure 1a illustrates the wearable platform packaged into a wristband for on-body sweat analysis. The platform consists of a triple-electrode array patterned on a flexible poly(ethylene tere-phthalate) (PET) substrate and interfaced with a PCB. Figure 1b shows the schematic of the printed electrodes used for electro-chemical sensing: a carbon working electrode (WE) modified with carbon nanotubes (CNTs)/Nafion films, a carbon counter electrode (CE) and an Ag/AgCl reference electrode (RE). The choice of WE material critically determines the types of chem-ical reactions permitted on the electrode surface. Carbon is favorably selected due to its stability under high sweeping voltage for drug detection, as well as its low cost and biocom-patibility to human skin.[36] Roll-to-roll printing technology is exploited to produce high performance electrode arrays at large scale. At the system level, as shown in Figure 1c, the completely integrated s-band includes signal transduction, conditioning, processing, and Bluetooth transmission functionalities to relay electrochemical signals to a user interface and allow in situ monitoring of drug levels. Figure 1d illustrates the elec-trochemical caffeine detection mechanism that underlies the technology: the implementation of DPV from the PCB and the oxidization of caffeine molecules at around 1.4 V. The electrical current level detected at the oxidation peak provides a quantita-tive measurement of sweat caffeine concentration. After drug intake, sweat can be accessed via vigorous physical exercise or iontophoresis and analyzed by the s-band, as shown in Figure 1e and detailed in the Experimental Section.
The flexible electrodes were prepared through the roll-to-roll printing process.[43] The carbon WE was modified with
Adv. Mater. 2018, 1707442
Figure 1. Schematic of the s-band and drug sensing mechanism. a) Schematic of the s-band worn on a subject’s wrist. b) Optical image of the s-band and the cross-section view of a roll-to-roll printed flexible sensor patch. Scale bar, 5 mm. WE, RE, and CE are working electrode, reference electrode, and counter electrode. c) System-level diagram of the s-band platform for real-time sensing, data processing, and wireless transmission. d) Electro-chemical detection of caffeine through differential pulse voltammetry (DPV). Oxidation of caffeine leads to an observable oxidation peak around 1.4 V. e) Real-time sweat caffeine monitoring using the s-band after caffeine intake.

© 2018 WILEY-VCH Verlag GmbH & Co. KGaA, Weinheim1707442 (3 of 8)
www.advmat.dewww.advancedsciencenews.com
CNTs/Nafion films through drop casting (detailed in the Exper-imental Section). This step is crucial for antifouling protection of the sensing electrodes in sweat samples and improves the sensor’s detection limit.[20,44]
The caffeine sensor is characterized electrochemically using DPV in a solution containing different caffeine concen-trations. Figure 2a shows the DPV response of the sensor in 0–40 × 10−6 m caffeine solution (dissolved in 0.01 m acetate buffer to simulate human sweat).[20,21] The voltammetry range of 1.1–1.7 V is selected to cover the oxidation potential of caf-feine.[36] The current peak can be measured according to a standard technique described in Figure S1 (Supporting Infor-mation). Figure 2b shows an extracted linear relationship of the sensor’s responses to the caffeine concentrations with a high sensitivity of 110 nA mm−1.
Sweat normally contains a wide variety of chemicals that can potentially interfere with the sensors’ performance.[20–23] Hence, the selectivity of the s-band sensor is evaluated in Figure 2c to ensure the fidelity of the sensor readings under practical condi-tions. Since the s-band platform relies on oxidation reactions to detect caffeine, major sweat biomolecules that can be oxidized are chosen for the selectivity test. Specifically, urea (30 × 10−6 m), glucose (100 × 10−6 m), lactic acid (10 × 10−3 m), and ascorbic acid (10 × 10−6 m) are added to the caffeine solution with physi-ologically relevant concentrations.[14,23] In addition, pilocarpine (15 × 10−3 m), which is commonly used to induce sweat, is added in the selectivity test.[19] The results show that the change in sensor response due to potential interferents falls within 9.2%.
In order to demonstrate the functionalities of the sensor plat-form, two healthy subjects were selected for caffeine dose trials. Prior to an experiment, each subject is required to abstain from caffeine intake overnight. At the beginning of the trial, the sub-ject either consumes a single-shot or triple-shot espresso coffee (≈75 or ≈225 mg caffeine).[45] In the controlled experiment, the subject does not consume any coffee. The subject then waits for half an hour in resting mode. Afterward, the subject’s wrist is cleaned with alcohol wipe and loaded with a cholinergic agonist hydrogel to perform iontophoresis (sweat inducing technique). Following an iontophoresis procedure in a previous report,[19] a 5 min 1 mA electrical current is applied to drive sweat-inducing pilocarpine drug, entrapped in a hydrogel, into the subdermal regions for local sweat stimulation. As illustrated in Figure 3a, this process stimulates sweat glands. Once iontophoresis is
finished, the hydrogel is removed and sweating can be observed on the subject’s wrist. A commercially available Macroduct sweat collector is then sealed on the subject’s wrist to accumu-late sweat for half an hour. Hence, sweat is collected from 35 to 65 min after drug intake.
The collected sweat samples are analyzed with DPV meas-urement to determine the caffeine contents of sweat. Figure 3b and Figure S2 (Supporting Information) show that as caffeine intake increases, the collected sweat samples also contain higher caffeine levels. The functional correlation between DPV-measured caffeine concentration in sweat and caffeine intake is plotted in Figure 3c. The correlation between sweat caffeine concentration and caffeine intake is highly linear with Pear-son’s correlation coefficient of 0.98, and the slope demonstrates a sensitivity of 45 × 10−6 m g−1. This observation is consistent with the literature,[41,46,47] indicating that the s-band can accu-rately inform users about their caffeine intake.
In order to demonstrate the sensor’s ability to capture physiological trends of caffeine in human subjects, two types of ergometer-based cycling experiments were conducted. Figure 4a shows a time progression panel, indicating time of caffeine intake and exercise period of the first experiment. The subject engages in a constant-load 100 W cycling at 30 min after consuming a single-shot espresso coffee (≈75 mg caffeine). In most cases, sweat secretion and collection begin approximately 10 min after the start of the exercise. Perspiration continues throughout the exercise trial, and sweat caffeine concentration is evaluated at different points in time using the collected sweat samples. Figure 4a shows that the caffeine concentration ini-tially increases, reaches its peak value of 13 × 10−6 m around 60 min after caffeine intake, and subsequently decreases. The time corresponding to the maximum concentration falls within the expected range of 30–120 min.[48] Figure 4b–e shows the representative time-stamped plots of the pulse voltammetry results corresponding to Figure 4a.
The observed caffeine concentration trend is consistent with previously reported ex situ data.[46–49] The initial increase in caffeine levels is due to absorption of caffeine into the human circulatory system, and the subsequent decline is due to catabolism of caffeine.[47–49] In regular healthy subjects, caffeine physiological levels reach their peak values approxi-mately within two hours, and then the caffeine concentrations are projected to diminish.[48] Hence, in Figure 4f, a second
Adv. Mater. 2018, 1707442
Figure 2. Characterization of the caffeine sensor based on roll-to-roll printed CNTs/Nafion modified carbon electrodes. a) Differential pulse voltammograms (DPV) of caffeine (0–40 × 10−6 m) dissolved in a 0.01 m acetate buffer solution (pH 4.6) and b) the corresponding calibration curves. c) Interference studies of the caffeine sensor. In each subsequent DPV measurement, 30 × 10−6 m urea, 100 × 10−6 m glucose (GL), 10 × 10−3 m lactic acid (LA), 10 × 10−6 m ascorbic acid (AA), or 15 × 10−3 m pilocarpine (PC) is added to a 40 × 10−6 m caffeine (CAF) solution.

© 2018 WILEY-VCH Verlag GmbH & Co. KGaA, Weinheim1707442 (4 of 8)
www.advmat.dewww.advancedsciencenews.com
experiment is designed with the same subject cycling under identical conditions, with the exception that the cycling time starts at 120 min after caffeine intake. In this trial, the caffeine levels begin with a value of 7 × 10⁻⁶ m and show a decreasing trend almost monotonically, which is consistent with our expec-tation. The concentrations of caffeine in sweat are also lower (2–7 × 10⁻⁶ m) than those in the previous trial after reaching the peak (12–13 × 10−6 m in Figure 4d,e). These evidences indicate that the caffeine sensor can capture the metabolic behaviors of caffeine. Likewise, Figure 4g–j shows the corresponding time-stamped plots. This set of experiments demonstrates that the caffeine sensor can inform users about the dynamic pharma-cokinetics of caffeine.
An application of the caffeine sensor is shown in Figure 5a,b with a fully packaged wearable platform. The roll-to-roll printed electrodes connected with the PCB is comfortably worn on a subject’s wrist and sealed with a poly(dimethylsiloxane) (PDMS) band. The PCB is assembled using a microcontroller and programmed with a DPV sensing module and can be acti-vated at different time points during the exercise to evaluate sweat caffeine levels. The current peaks in DPV plots are con-verted to sweat caffeine concentrations using Figure 5c, which is extracted from Figure S3 (Supporting Information). The signal to noise ratio in sweat solution, computed as the current peak (40 × 10−6 m curve) divided by half of the fluctuation in the baseline reading without caffeine (0 × 10−6 m curve, 1.1–1.2 V) in Figure S3 (Supporting Information), is found to be 14.
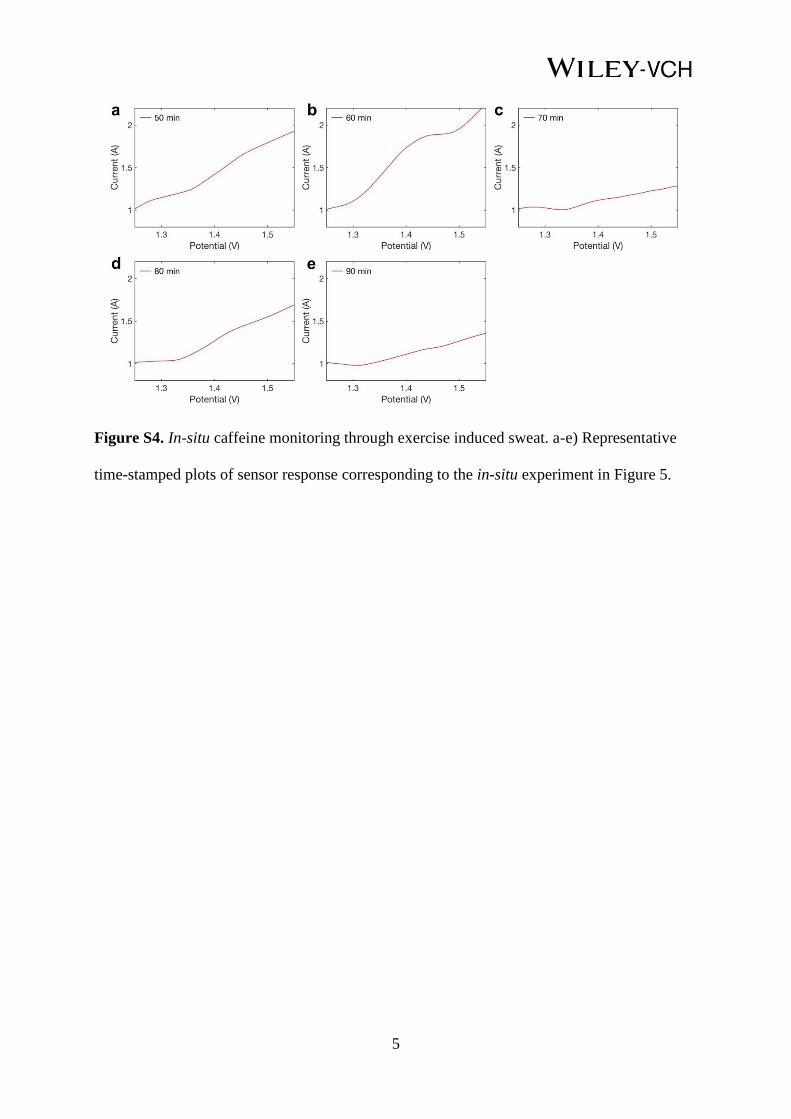
The subject performs an exercise trial in which cycling begins at 30 min after consuming a single-shot espresso coffee (≈75 mg caffeine). The result is summarized in Figure 5d with current peaks extracted from Figure S4 (Supporting Information). In
Figure 5d, the detection in sweat solution is limited by the cur-rent peak response variations between the roll-to-roll printed electrodes (Experimental Section). Upon conversion with Figure 5c, this corresponds to a detection limit of 3 × 10⁻⁶ m. In addition, we observed that sweat caffeine concentration before caffeine ingestion was consistently below the detection limit. In contrast, the sweat caffeine concentration after caffeine inges-tion could be up to 11 × 10−6 m. The sweat caffeine concentra-tion increases until its peak value of 11 × 10−6 m at 60 min after caffeine intake, and the concentration subsequently decreases. The data in this on-body experiment follows a similar pattern to the ex situ data in Figure 4, and it demonstrates that the s-band technology can potentially be applied in clinical or other prac-tical settings to offer users valuable information regarding their drug intake and metabolism.
In conclusion, we have demonstrated a skin-conforming wearable sensor capable of noninvasive, real-time, and in situ methylxanthine drug monitoring. The s-band compensates con-ventional drug monitoring techniques involving blood draws, urine collection, or sweat collection by eliminating the require-ment for separate sampling and analysis. The sweating profile measured by the s-band demonstrates its ability to inform users of their drug intake and metabolism. We also show that both iontophoresis and exercise induced sweat can serve as bases for caffeine detection. The observed caffeine levels and metabolic trends are consistent with the physiological data reported in the literature.
Importantly, our work expands the realm of wearable sweat sensors toward drug monitoring, which is essential for clinical treatment of disease beyond diagnosis. The platform equipped with amenable DPV capabilities can be easily and broadly
Adv. Mater. 2018, 1707442
Figure 3. Caffeine monitoring through iontophoresis induced sweat. a) Schematic of iontophoresis-based sweat extraction. The subject consumes 0, 75, and 225 mg caffeine, respectively. An iontophoresis current of 1 mA is applied on a subject’s wrist for 5 min. b) Sensor response in human sweat samples for all caffeine intake conditions. c) The corresponding sweat caffeine concentration observed upon different caffeine intake.

© 2018 WILEY-VCH Verlag GmbH & Co. KGaA, Weinheim1707442 (5 of 8)
www.advmat.dewww.advancedsciencenews.com
exploited to recognize a variety of drugs. Thus, the development of the drug monitoring s-band is an essential bridge for future applications in clinical pharmacology and precision medicine, such as therapeutic drug monitoring, drug abuse intervention, and other aspects of the drug-related healthcare system.
Our drug monitoring wearable platform, with other existing networks of wearable sweat sensors, can enable unprecedented
studies on pharmacokinetics to understand the interplays between drugs and wide-ranging biomolecules in the human body. In tandem with big data and artificial intelligence tech-niques, we envision that these systems of biomedical sensors can provide profound insight into the intrinsically complex and inextricably linked human physiology, pathology, and neuropsy-chology related to drugs.
Adv. Mater. 2018, 1707442
Figure 4. Caffeine monitoring through exercise induced sweat. a) Panel indicating the timeline of the first exercise trial and a summary plot of the caf-feine levels over time. The exercise begins at 30 min after caffeine intake. b–e) Representative time-stamped plots of the sensor response corresponding to the first experiment. f) Panel indicating the timeline of the second exercise trial and a summary plot of the caffeine levels over time. The exercise begins at 120 min after caffeine intake. g–j) Representative time-stamped plots of the sensor response corresponding to the second experiment.

© 2018 WILEY-VCH Verlag GmbH & Co. KGaA, Weinheim1707442 (6 of 8)
www.advmat.dewww.advancedsciencenews.com
Experimental Section
Sensor Array Fabrication and Preparation: The electrode arrays were fabricated on top of flexible PET film via roll-to-roll printing technique at Sunchon National University. Specifically, the electrodes were fabricated with roll-to-roll gravure printing on PET substrate (SKC Korea AH71D). The silver (Ag), carbon (C), and insulation layers were printed in sequence. Ag ink was acquired (Paru Solar Energy Company PG-007) and reformulated by dispersing Ag in solution (InkTec TEC-PR-041) to enhance the Ag ink’s stability. For the Ag ink, the surface tension and viscosity were improved by addition of 10% poly(vinyl butyral) in Terpineol (Sigma-Aldrich). During the printing, temperature and humidity were controlled to be 23 ± 2 °C and 35 ± 2%, respectively, to maintain the accuracy of printing to be ±20 mm. Postprinting drying of the Ag electrodes was performed by passing the electrodes through a 150 °C chamber for 5 s at 6 m min−1. The WE and RE were further processed. Carbon paste (Dozen TECH Korea DC-15) was diluted by adding diethylene glycol monoethyl ether acetate (ECA) until 350 cp viscosity was reached. Afterward, the carbon paste was printed to cover the Ag layer. The drying process was performed in 150 °C chamber for 5 s. Finally, the insulating ink was prepared by dissolving polyethylene resin (Daejung Chemicals and Metals. 20 g) in ECA (80 mL) to passivate the Ag layers. The printing speed of the insulating layer was 6 m min−1.
The electrodes were annealed at 150 °C for 1 h (MTI Corporation Vacuum Oven). The WEs and CEs were cleaned in an 8 m HNO3 solution for 10 s to remove the exposed Ag. 0.1 m FeCl3 solution (0.80 mL) was injected on top of the Ag RE for 10 s to produce a uniform Ag/AgCl film. 0.01% multiwall CNTs (0.84 mL) and 0.01% Nafion 117 (Sigma-Aldrich, 0.84 mL) were subsequently drop-cast onto the WE and annealed at room temperature till dry for 15 h.
Characterization of the Sensor: The printed electrodes were characterized electrochemically by performing DPV measurements in
0–40 × 10−6 m caffeine solutions (dissolved in 0.01 m acetate buffer solution (pH 4.6)). CHI 1230C potentiostat (CH Instruments) was used for DPV measurements (initial potential: 1.1 V; final potential: 1.7 V; increment: 4 mV; amplitude: 50 mV; pulse width: 50 ms; sample width: 15 ms; pulse period: 100 ms). The modified WE was used here with commercially available Ag/AgCl RE and platinum wire CE. The sensor’s selectivity was evaluated by addition of selected analytes (urea, glucose, lactic acid, ascorbic acid, pilocarpine) to 40 × 10−6 m of caffeine in the acetate buffer solutions. The concentrations of the analytes were decided according to their physiologically relevant concentrations. Baselines in the I–V plots of the DPV measurements were normalized such that they were aligned. DPV measurements of 40 × 10−6 m caffeine were performed once for all of the roll-to-roll printed WEs to eliminate the ones with outlying performances (selected the ones with peak current variations within 20%, which defines the error in the experiments).
Ex Situ Iontophoresis Sweat Analysis: Iontophoresis sweat extraction was performed by first placing pilocarpine hydrogel (ELITechGroup SS-023 Pilogel Discs) underneath the anode and cathode electrodes followed by applying a 1 mA DC current for 5 min to drive the pilocarpine into the subdermal regions of a subject to stimulate sweat glands (ELITechGroup Model 3700 Webster Sweat Inducer). Afterward, a commercial Macroduct collector was tightly sealed around the subject’s wrist to allow sweat collection for 30 min. The collected sweat samples were analyzed with CHI 1230C potentiostat (CH Instruments) using DPV measurements. To improve the sensitivity, accumulation of caffeine molecules at −1.2 V for 30 s was applied prior to DPV analysis. The current peaks measured with DPV were converted to sweat concentrations via calibrations, which were obtained via addition of caffeine to sweat samples similar to that in Figure S3 (Supporting Information). Other conditions were the same as those in the characterization experiments.
Adv. Mater. 2018, 1707442
Figure 5. In situ monitoring of caffeine levels using the s-band. a) Image of a subject in a cycling exercise and b) a zoom-in image of the s-band drug sensing platform packaged in a PDMS wristband. c) Calibration curve for the s-band platform in sweat samples. d) Measured sweat caffeine levels during the cycling experiment. The horizontal axis indicates the time elapsed after the subject consumes a single-shot espresso (≈75 mg caffeine); the subject begins cycling at 30 min after caffeine intake.

© 2018 WILEY-VCH Verlag GmbH & Co. KGaA, Weinheim1707442 (7 of 8)
www.advmat.dewww.advancedsciencenews.com
Adv. Mater. 2018, 1707442
Ex Situ Exercise Sweat Analysis: The subjects performed cycling exercise on a stationary ergometer (Kettler E3 Upright Exercise Bike) with 100 W power output. Once the subjects started sweating, sweat samples were collected every 5 min using centrifuge tubes from the foreheads of the subjects. After each collection, the subjects cleaned their foreheads with gauze. The evaluation of sweat samples followed the same procedure as that in the ex situ iontophoresis sweat analysis.
In Situ Exercise Sweat Analysis: The on-body analysis of the s-band was approved by the institutional review board at the University of California, Berkeley (CPHS 2016-06-8853) and subjects took part with informed consent. The s-band was packaged with a PDMS transparent band on top of the sensor and around the subject’s wrist, as shown in Figure 5b. At different time throughout the exercise trial, the s-band was activated to perform the in situ DPV measurements. The raw data was then transmitted via Bluetooth wirelessly to a user interface (CoolTerm serial-port terminal application), normalized to a common baseline current, and filtered (MATLAB Hampel and Smooth functions) for caffeine level monitoring on a computer. Curve fitting was performed and plotted as the dotted line (MATLAB Weibull function). A schematic diagram of the s-band’s circuit design is shown in Figure S5 (Supporting Information).
Signal Conditioning, Processing, and Wireless Transmission Circuit Design: The circuit diagram of the analog signal-conditioning block of the device is shown in Figure S5 (Supporting Information). The entire circuit mimicked the DPV measurements of the potentiostat instrument. At the core of the system, an Atmega328p (Atmel 8-bit) (Microchip Technology) microcontroller that could be programmed on-board by a pocket Alf and Vegard’s Reduced Instruction Set Computer (AVR-RISC) programmer from Sparkfun was used. The microcontroller communicated with a 16 bit digital-to-analog converter (DAC) DAC8552 (Texas Instrument) through Serial Peripheral Interface (SPI) protocol. The DAC set two voltages: one for WE and the other one for RE. The DPV parameters followed the same as those in the potentiostat’s settings, including initial potential, final potential, increment, amplitude, pulse width, sample width, and pulse period. The voltage for RE was low-pass filtered by the fourth order Sallen–Key topology to provide stable reference. The current from the WE was converted into voltage by low-pass transimpedance amplifiers. The voltage was then measured by a 16 bit analog-to-digital converter (ADC) LTC1864 (Linear Technology). The ADC sent the voltage data to the microcontroller through SPI protocol. The microcontroller transmitted the data to the Bluetooth transceiver using the Universal Asynchronous Receiver/Transmitter (UART) protocol. The Bluetooth then communicated with the mobile phone or computer.
Power Delivery to the DPV Board: The PCB was powered by a single rechargeable lithium-ion polymer battery with a nominal voltage of 3.7 V. The equivalent diagram is shown in Figure S5 (Supporting Information). There were three paths of power delivery. The first path required 5.0 V for the digital component of the circuit. This was achieved by using DC–DC converter to boost up the battery voltage from 3.7 to 5.3 V, and then using low-dropout voltage regulator to obtain a regulated 5.0 V voltage. The second path used the same strategy, but the voltage was used for the analog portion of the circuit. The third path used only the low-dropout voltage regulator to realize a regulated 3.3 V potential for the Bluetooth module.
Supporting InformationSupporting Information is available from the Wiley Online Library or from the author.
AcknowledgementsL.-C.T. and W.G. contributed equally to this work. This work was supported by NSF Nanomanufacturing Systems for Mobile Computing and Mobile Energy Technologies (NASCENT) Center. Some of the device fabrication was performed in the Electronic Materials (EMAT)
laboratories, funded by the Director, Office of Science, Office of Basic Energy Sciences, Material Sciences and Engineering Division of the U.S. Department of Energy under contract number DE-AC02-05CH11231. H.O. acknowledges Grant-in-Aid for Young Scientists (A) from the Japan Society for the Promotion of Science (JSPS). G.C. acknowledges supports by a grant (16163KKMFDS001) from the Ministry of Food and Drug Safety in the Republic of Korea (2016).
Conflict of InterestThe authors declare no conflict of interest.
Keywordsdrug monitoring, electrochemical sensors, flexible electronics, wearable biosensors
Received: December 20, 2017Revised: February 9, 2018
Published online:
[1] M. Pirmohamed, S. James, S. Meakin, C. Green, A. K. Scott, T. J. Walley, K. Farrar, B. K. Park, A. M. Breckenridge, Br. Med. J. 2004, 329, 15.
[2] R. R. Steiner, R. L. Larson, J. Forensic Sci. 2009, 54, 617.[3] K. Wells, R. Klap, A. Koike, C. Sherbourne, Am. J. Psychiatry 2001,
158, 2027.[4] L. F. Hofman, J. Nutr. 2001, 131, 1621S.[5] J. Friedrich, C. Seidel, R. Ebner, L. A. Kunz-Schughart, Nat. Protoc.
2009, 4, 309.[6] E. J. Cone, Y. H. Caplan, D. L. Black, T. Robert, F. Moser, J. Anal.
Toxicol. 2008, 32, 530.[7] L. P. Rivory, K. A. Slaviero, J. M. Hoskins, S. J. Clarke,
Clin. Pharmacokinet. 2001, 40, 151.[8] R. Kronstrand, I. Nyström, J. Strandberg, H. Druid, Forensic Sci. Int.
2004, 145, 183.[9] M. A. Huestis, E. J. Cone, C. J. Wong, A. Umbricht, K. L. Preston,
J. Anal. Toxicol. 2000, 24, 509.[10] H. L. Johnson, H. I. Maibach, J. Invest. Dermatol. 1971, 56, 182.[11] D. Morris, S. Coyle, Y. Wu, K. T. Lau, G. Wallace, D. Diamond,
Sens. Actuators, B 2009, 139, 231.[12] P. Kintz, A. Tracqui, P. Mangin, Y. Edel, J. Anal. Toxicol. 1996, 20,
393.[13] J. Lee, M. Pyo, S.-H. Lee, J. Kim, M. Ra, W.-Y. Kim, B. J. Park,
C. W. Lee, J.-M. Kim, Nat. Commun. 2014, 5, 3736.[14] W. Gao, S. Emaminejad, H. Y. Y. Nyein, S. Challa, K. Chen, A. Peck,
H. M. Fahad, H. Ota, H. Shiraki, D. Kiriya, D.-H. Lien, G. A. Brooks, R. W. Davis, A. Javey, Nature 2016, 529, 509.
[15] C. Wang, D. Hwang, Z. Yu, K. Takei, J. Park, T. Chen, B. Ma, A. Javey, Nat. Mater. 2013, 12, 899.
[16] K. Takei, T. Takahashi, J. C. Ho, H. Ko, A. G. Gillies, P. W. Leu, R. S. Fearing, A. Javey, Nat. Mater. 2010, 9, 821.
[17] H. Ota, K. Chen, Y. Lin, D. Kiriya, H. Shiraki, Z. Yu, T.-J. Ha, A. Javey, Nat. Commun. 2014, 5, 5032.
[18] H. Ota, M. Chao, Y. Gao, E. Wu, L.-C. Tai, K. Chen, Y. Matsuoka, K. Iwai, H. M. Fahad, W. Gao, H. Y. Y. Nyein, L. Lin, A. Javey, ACS Sens. 2017, 2, 990.
[19] S. Emaminejad, W. Gao, E. Wu, Z. A. Davies, H. Y. Y. Nyein, S. Challa, S. P. Ryan, H. M. Fahad, K. Chen, Z. Shahpar, S. Talebi, C. Milla, A. Javey, R. W. Davis, Proc. Natl. Acad. Sci. USA 2017, 114, 4625.

© 2018 WILEY-VCH Verlag GmbH & Co. KGaA, Weinheim1707442 (8 of 8)
www.advmat.dewww.advancedsciencenews.com
Adv. Mater. 2018, 1707442
[20] W. Gao, H. Y. Y. Nyein, Z. Shahpar, H. M. Fahad, K. Chen, S. Emaminejad, Y. Gao, L.-C. Tai, H. Ota, E. Wu, J. Bullock, Y. Zeng, D.-H. Lien, A. Javey, ACS Sens. 2016, 1, 866.
[21] H. Y. Y. Nyein, W. Gao, Z. Shahpar, S. Emaminejad, S. Challa, K. Chen, H. M. Fahad, L.-C. Tai, H. Ota, R. W. Davis, A. Javey, ACS Nano 2016, 10, 7216.
[22] S. Imani, A. J. Bandodkar, A. M. V. Mohan, R. Kumar, S. Yu, J. Wang, P. P. Mercier, Nat. Commun. 2016, 7, 11650.
[23] J. Kim, I. Jeerapan, S. Imani, T. N. Cho, A. Bandodkar, S. Cinti, P. P. Mercier, J. Wang, ACS Sens. 2016, 1, 1011.
[24] A. Koh, D. Kang, Y. Xue, S. Lee, R. M. Pielak, J. Kim, T. Hwang, S. Min, A. Banks, P. Bastien, M. C. Manco, L. Wang, K. R. Ammann, K.-I. Jang, P. Won, S. Han, R. Ghaffari, U. Paik, M. J. Slepian, G. Balooch, Y. Huang, J. A. Rogers, Sci. Transl. Med. 2016, 8, 366ra165.
[25] H. Lee, T. K. Choi, Y. B. Lee, H. R. Cho, R. Ghaffari, L. Wang, H. J. Choi, T. D. Chung, N. Lu, T. Hyeon, S. H. Choi, D.-H. Kim, Nat. Nanotechnol. 2016, 11, 566.
[26] A. J. Bandodkar, D. Molinnus, O. Mirza, T. Guinovart, J. R. Windmiller, G. Valdés-Ramírez, F. J. Andrade, M. J. Schöning, J. Wang, Biosens. Bioelectron. 2014, 54, 603.
[27] W. Jia, A. J. Bandodkar, G. Valdés-Ramírez, J. R. Windmiller, Z. Yang, J. Ramírez, G. Chan, J. Wang, Anal. Chem. 2013, 85, 6553.
[28] S. Xu, Y. Zhang, L. Jia, K. E. Mathewson, K.-I. Jang, J. Kim, H. Fu, X. Huang, P. Chava, R. Wang, S. Bhole, L. Wang, Y. J. Na, Y. Guan, M. Flavin, Z. Han, Y. Huang, J. A. Rogers, Science 2014, 344, 70.
[29] D. J. Lipomi, M. Vosgueritchian, B. C.-K. Tee, S. L. Hellstrom, J. A. Lee, C. H. Fox, Z. Bao, Nat. Nanotechnol. 2011, 6, 788.
[30] M. C. McAlpine, H. Ahmad, D. Wang, J. R. Heath, Nat. Mater. 2007, 6, 379.
[31] M. Kaltenbrunner, T. Sekitani, J. Reeder, T. Yokota, K. Kuribara, T. Tokuhara, M. Drack, R. Schwödiauer, I. Graz, S. Bauer-Gogonea, S. Bauer, T. Someya, Nature 2013, 499, 458.
[32] D. H. Kim, N. Lu, R. Ma, Y.-S. Kim, R.-H. Kim, S. Wang, J. Wu, S. M. Won, H. Tao, A. Islam, K. J. Yu, T.-I. Kim, R. Chowdhury, M. Ying, L. Xu, M. Li, H.-J. Chung, H. Keum, M. McCormick, P. Liu, Y.-W. Zhang, F. G. Omenetto, Y. Huang, T. Coleman, J. A. Rogers, Science 2011, 333, 838.
[33] B. Dogan-Topal, B. Uslu, S. A. Ozkan, Biosens. Bioelectron. 2009, 24, 2358.
[34] A. Erdem, H. Karadeniz, A. Caliskan, Analyst 2011, 136, 1041.[35] A. Erderm, M. Ozsoz, Anal. Chim. Acta 2001, 437, 107.[36] F. Zhao, F. Wang, W. Zhao, J. Zhou, Y. Liu, L. Zou, B. Ye, Microchim.
Acta 2011, 174, 383.[37] T. R. Hartley, W. R. Lovallo, L. Whitsett, Am. J. Cardiol. 2004, 93,
1022.[38] M. Noordzij, C. S. Uiterwaal, L. R. Arends, F. J. Kok, D. E. Grobbee,
J. M. Geleijnse, J. Hypertens. 2005, 23, 921.[39] A. Ruusunen, S. M. Lehto, T. Tolmunen, J. Mursu, G. A. Kaplan,
S. Voutilainen, Public Health Nutr. 2010, 13, 1215.[40] L. L. Spriet, Int. J. Sport Nutr. 1995, 5, S84.[41] E. M. R. Kovacs, J. H. C. H. Stegen, F. Brouns, J. Appl. Physiol. 1998,
85, 709.[42] D. J. Birkett, J. O. Miners, Br. J. Clin. Pharmacol. 1991, 31, 405.[43] W. Lee, H. Koo, J. Sun, J. Noh, K.-S. Kwon, C. Yeom, Y. Choi,
K. Chen, A. Javey, G. Cho, Sci. Rep. 2015, 5, 17707.[44] E. W. Keefer, B. R. Botterman, M. I. Romero, A. F. Rossi, G. W. Gross,
Nat. Nanotechnol. 2008, 3, 434.[45] R. R. McCusker, B. A. Goldberger, E. J. Cone, J. Anal. Toxicol. 2003,
27, 520.[46] T. E. Graham, L. L. Spriet, J. Appl. Physiol. 1995, 78, 867.[47] D. G. Bell, T. M. McLellan, J. Appl. Physiol. 2002, 93, 1227.[48] K. Collomp, F. Anselme, M. Audran, J. P. Gay, J. L. Chanal,
C. Prefaut, Eur. J. Clin. Pharmacol. 1991, 40, 279.[49] T. Tsuda, S. Noda, S. Kitagawa, T. Morishita, Biomed. Chromatogr.
2000, 14, 505.

Copyright WILEY-VCH Verlag GmbH & Co. KGaA, 69469 Weinheim, Germany, 2018.
Supporting Information
for Adv. Mater., DOI: 10.1002/adma.201707442
Methylxanthine Drug Monitoring with Wearable SweatSensors
Li-Chia Tai, Wei Gao, Minghan Chao, Mallika Bariya, QuynhP. Ngo, Ziba Shahpar, Hnin Y. Y. Nyein, Hyejin Park, JunfengSun, Younsu Jung, Eric Wu, Hossain M. Fahad, Der-HsienLien, Hiroki Ota, Gyoujin Cho, and Ali Javey*

1
Copyright WILEY-VCH Verlag GmbH & Co. KGaA, 69469 Weinheim, Germany, 2018.
Supporting Information
Title Methylxanthine drug monitoring with wearable sweat sensors
Li-Chia Tai, Wei Gao, Minghan Chao, Mallika Bariya, Quynh P. Ngo, Ziba Shahpar, Hnin Y.
Y. Nyein, Hyejin Park, Junfeng Sun, Younsu Jung, Eric Wu, Hossain M. Fahad, Der-Hsien
Lien, Hiroki Ota, Gyoujin Cho, and Ali Javey*

2
Figure S1. Measurement of the peak height from a DPV measurement. The peak height is the
length of the vertical line connecting the peak position and the tangent line to the DPV curve.

3
Figure S2. Caffeine monitoring through iontophoresis induced sweat samples (subject II). a)
Sensor response in the sweat samples for all caffeine intake conditions and b) the
corresponding sweat caffeine concentration observed upon different caffeine intake.

4
Figure S3. Calibration for the s-band platform in sweat samples. Results of the DPV
measurements in sweat samples collected from the same subject in Figure 5.
5
Figure S4. In-situ caffeine monitoring through exercise induced sweat. a-e) Representative
time-stamped plots of sensor response corresponding to the in-situ experiment in Figure 5.

6
Figure S5. Schematic of the s-band platform’s voltammetry circuit. The circuit incorporates
three terminals, which correspond to the working, reference and counter electrodes.