methods used for soil, plant, and water analysis at the soils by y. p....
TRANSCRIPT

ME THODS USED FOR SOIL , PLAN T, AND WATER ANALYSIS AT THE SOILS
LABORATORY OF THE MANI TOBA-SAS KATCHEWAN REGION
196 7 - 1970
by
Y. P . KALRA
NORTHERN FORES T RESEARCH CENTRE INFORMATION REPORT NOR- X-11
DECEMBER 197 1
CANADIAN FORES TRY SERVICE DEPARTMEN T OF THE ENVIRONMENT
5 320 - 122 S TREE T EDMON TON 70 , ALBERTA , CANADA


iii
T ABLE O F CONTENTS
INTRODUCTION ..................................... .............
METHODS FOR SOIL ANALYSIS .......... ...........................
81 .
8 2 .
83.
84.
85 .
8 6 .
8 7 .
8 8 .
89 .
810.
Sl1.
812 .
813.
814 .
815 .
816 .
S17 .
818 .
819 .
Preparation of samples for analyses
8oi1 color . .... ................ ................ .. .
Mois ture content
Bulk density
8oi1 reaction
Salt concentration
Particle-size distribution analysis
Alkaline-earth carbonates
Loss on i gnition
Organic matter .................................. .
Nitrogen ........................................ .
Phosphorus
Cation exchange , base saturation
Iron
exchangeable cations , and
Manganese . . • . • • • • • • . • • • • • . . • • . • • • • • • • • • • • • • • • . . • •
Copper
Zinc
Total elemental analysis for calcium , magnesium, sodium , potassium, and iron
Nitric acid extraction of potassium
Page 1
5
5
6
6
7
7
9
15
17
20
20
21
25
27
40
43
44
46
47
47

S20 .
S21 .
S22 .
S23 .
S24 .
iv
Extraction and measurement of soil moisture ( field capacity and permanent wilting p oint) . . . . . . . . . . . . . . . . . . . . . . . . . . . . . . . . . . .
Nitrifying capacity . . . . . . . . . . . . . . . . . . . . . . . . . . . . . .
Ash content of peat . . . . . . . . . . . . . . . . . . . . . . . . . . . . . .
Degree of decomposition of peat
Unrubbed fiber content of peat
METHODS FOR PLANT ANALYSIS
PI . Determinations on fresh needles or leaves
P2 . Pre treatment for further analyses
P3 . Root/shoot ratio
P4 . Total nitrogen
P5 . Total ash
P6 . Preparation of extract for total mineral cons ti t uen ts . . . . . . . . . . . . . . . . . . . . . . . . . . . . . . . . . . . . .
P7 . Silica
P8 . Phosphorus
P9 . Potassium and sodium . . . . . . . . . . . . . . . . . . . . . . . . . . . . .
PIO. Calcium and magnesium . . . . . . . . . . . . . . . . . . . . . . . . . . . .
Pl1 . Iron , manganese , copper , and zinc
P12 . Chloride
P13 . Total sulfur
P14 . Cation exchange capacity of roots
METHODS FOR WATER ANALYSIS
WI . Color
Page
47
49
50
50
51
52
52
52
54
54
55
55
56
56
57
57
5 7
5 8
58
5 8
59
59
W2 .
W3 .
W4 .
WS.
W6 .
W7 .
W8 .
W9 .
W10 .
Wll .
W12 .
W13 .
W14 .
W1S.
W16 .
v
Turbidity . . . . . . . . . . . . . . . . . . . . . . . . . . , . . . . . . . . . . . . .
pH
Specific conductance . . . . . . . . . . . . . . . . . . . . . . . . . . . . .
Acidity . . . . . . . . . . . . . . . . . . . . . . . . . . . . . . . . . . . . . . . . . .
Alkalinity
Hardness
Residue (total dissolved solids and loss on ignition)
Nitrogen
Orthophosphate
Calcium and magnesium
Potassium, sodium, and sodium-adsorption ratio . . . . . . . . . . . . . . . . . . . . . . . . . . . . . . . . . . .
Iron , manganese , copper , and zinc
Chloride
Sulfate
Saturation and stability with respect to calcium carbonate
ACKNOWLEDGEMENTS . . . . . . . . . . . . . . . . . . . . . . . . . . . . . . . . . . . . . . . . . . . . .
REFERENCES
Page
60
60
60
61
61
62
63
65
6 7
68
68
69
70
70
70
71
72

METHODS USED FOR SOIL , PLANT , AND WATER ANALYSIS AT THE SOILS
LABORATORY OF THE MANITOBA-S ASKATCHEWAN REGION
1967 - 1970
by
1 Y . P . Ka1ra
INTRODUCTION
At forest research centres in Canada, the analysis of soil ,
plant , and water samples , through a central laboratory , began only
in the las t four or five years . Prior to this , each researcher carried
out his own analytical work . With the establishment of the central
laboratory , most of the analyses are carried out there . However , some
analyses which are of interest to only one researcher are seldom
carried out in the central laboratory and are done in the individual ' s
laboratory •
I f the results obtained in different research laboratories
are to be strictly comparable , the techniques must be standardized ,
as the analytical details vary greatly from one procedure to another
for the s ame determination . There is also a need for standardization
of methods of reporting results because certain results may be
presented in different forms . Uniformity of terminology is also
desirable .
1 Head , Soils Laboratory , Northern Forest Research Centre , Canadian Forestry Service , Department of the Environment , Edmonton , Alberta.
- 2 -
This report presents the p roperties measured and the methods
used at the Soils Service Laboratory in the Manitoba-Saskatchewan
Region to analy ze soil , plant , and water s amples submitted by the
scientists of the region (Ka1ra and Ali , 1970) . It also contains
certain analytical methods which were not used for other researchers .
The procedures have been arranged in the order in which they
were generally carried out upon the receipt of samples . All samples
were analyzed on the basis of " selective analysis" for specific
p urposes rather than by " routine analysis" .
The selection of the method depended upon the following
factors :
1 . Purpose of the investigation .
2 . Limitations of the method .
3 . Availability of equipment .
4 . Pas t experience of the s taff with different analytical techniques .
5. Some research scientists in the past had used a particular method
or had their samples analyzed from another laboratory where a
particular method had been used . In this case the same technique
was used on their samples which enabled a valid comparison of
results obtained from year to year .
For a certain analysis , when two available methods were
similar in most respects , selection of one of the two methods was
largely a matter of preference .
Samples came from agricultural areas , she1terbe1ts , tree

- 3 -
nurseries , and forests ( forest fertili zation proj ects , forest hydrology ,
forest stand estab lishment research , and coniferous and deciduous
timber stands) . Obviously , for certain soil properties , one method
may be best for agronomic soils , but may not be as good for nursery
or forest soils . In general , availability-index methods for annual
field crops have been used for nursery soils . In most cases , no
methods have been developed for the extraction of that fraction of
soil nutrient element which is availab le to trees . However ,
determination of the total amounts o f the element may b e carried out
on all soils without significant changes irrespective of where the
samples were collected .
Methods were selected and in some cases adapted to ensure
accuracy and speed . Various techniques were standardized and modified
for a variety of analyses . Due to a large number of backlog samples
and shortage of staff and s pace in the laboratory and the fact that
the Soils Laboratory was experiencing a large increase in the number
of reques ts for different types of analyses , it was not possible in
many cases to evaluate different procedures and select the best
me thod . This report is not intended to show preferred methods .
Blank determinations were made Simultaneously with the
samp les . Calibration curves were prepared under the same conditions
prevailing for the samples and the blank determinations .
Trade , company , and model names of the instruments are
included only for the readers ' benefit and do not in any way reflect
their superiority over other instruments available on the market .

- 4 -
Although researchers generally interpreted their own
results , certain criteria used to classify grades or groupings for
a few analyses have been given in the report for the benefit of
individuals not directly involved with soils work .
This report was prepared for the colleagues of the region
to provide a ready reference for techniques used in the Soils Service
Lab oratory . It is hoped that this information will also prove useful
to others who are working at other regions . The procedures being used
at the Northern Forest Research Centre at Edmonton , formed by the
amalgamation of the Manitoba-Saskatchewan and Alberta-Territories
Regions , are essentially the same as outlined in this report although
some methods have been changed since 19 70 . More information on the
techniques mentioned will be found in comprehensive texts by APHA ( 1965) ,
Black et a1 .(1965) , Boltz (1958) , Chapman and Pratt (1961) , Jackson
(1958) , Metson (1956) , Piper (1947) , Rainwater and Thatcher (1960 ) ,
and US Salinity Laboratory Staff (1954) . Details of the atomic
absorption spectrophotometry are available in books by Ramirez-Munoz
(1968) and Slavin (1968) .

- 5 -
METHODS FOR SOIL ANALYSIS
Sl . Preparation of samples for analyses
Most of the determinations were made on air-dry sample s .
However , NH4-N , N0
3-N, and in some cases pH and some other properties ,
were determined on moist samples immediately after collection . If
these analyses could not be done soon after collection , the mois t
o samples were stored in a cold room at ca 2 c.
Large lumps of moist soil were broken and soil spread
on a sheet of brown paper to air-dry in a room free from fumes , dust ,
etc . Soils were air-dried at a temperature of ca 250 to 350C and
relative humidity of ca 20 to 60% (Jackson , 1958) . A wooden roller was
used to crush large clods . Stones and coarse gravel were removed.
After air-drying , the soil was ground to pass through a 2- rnm sieve
using a modified Rukuhia soil grinder (Day and Dixon , 1965) . Remaining
gravel and organic residue were removed . These materials were weighed
and their percentage in the total sample was determined . A 20-25 g
subsamp1e was ground in a Spex mixer/mil12
and passed through a 100-mesh
sieve .
Nearly all the determinations were carried out on the fine
earth « 2 mm) fraction . Organic matter, calcite , dolomite , total
nitrogen , etc. were estimated on subsamp1es pulverized to 100-mesh size .
For Cu , Zn , and other heavy metal determinations , soil was
2 Spex Industries , Scotch Plains , N .J .

- 6 -
ground in an agate or porcelain mortar with a pestle . All the soil
was pas sed through a nylon sieve to 2-mm size ; the coarse material
being returned to the mortar and reground. A portion of 2-mm soil
was further ground to pass 100-mesh sieve . Copper and brass utensils
were avoided.
The ground samples were stored in moisture-tight cartons .
For analysis , the required amounts of soil were taken by the quartering
method (Jackson , 1958) .
S 2 . Soil color
The soil samples were matched against standard Munsell
Soil Color Charts3
to obtain hue , value , and chroma combinations
(Munsell Color Co ., 1950; Shields et al ., 1968) . The color values
were obtained for both moist and dry samples.
S3. Mois ture content
Air-dry soil samples (> 25 g) were oven-dried overnight
at 1050C in a Precision S cientific Thelco , gravity convention oven4
,
model 17 or 27 . Results were calculated as follows :
WI Moisture factor (M.F . ) =
3 Munsell Color Co ., Baltimore , Md.
4 Precision S cientific Co ., Chicago , Ill .

- 7 -
Hygroscopic moisture (%) = ------
where WI = wt. of air-dry soil .
S 4 . Bulk density
W2
wt . of oven-dry soil .
x 100
The oven-dry weight of the sample was divided by the
volume of the undisturbed sample at field mois ture conditions (US
Salinity Laboratory Staff , 1954) . If the volume was very large , then
a subsample was oven-dried and the oven-dried weight of the entire
soil calculated .
S5 . Soil reaction
The pH was determined on a soil paste or a soil suspension .
The soil paste was prepare o as given by Doughty (1941) and the US
Salinity Laboratory Staff (1954) . Soil suspension was prepared using
a 1 : 1 (Peech � al . , 1947 ; Reed and Cummings , 1945) and 1 : 5 (Piper , 1947)
soil-to-water ratio (w/w) and 1 hr of equil ibration . Since soils
contain varying quanti ties of salts , pH measurements were also made in
-2 the presence of 10 M CaC1
2 with a soil : solution ratio of 1 : 2
(Schofield and Taylor , 1955) and in a 1 : 2 . 5 mixture of soil and 1 N
KCl (Puri and Asghar , 1938) to ob tain uniformity of results . For
organic soils , because of their water retention properties , pH was
measured in 1 : 5 soil-water suspensions or in 1 N KCl with a 1 : 1 ratio
(v/v) of moist peat to solution ( Farnham and Finney , 1965) . The

- 8 -
suspensions were stirred well j ust before i mmersing the electrodes
(Jackson , 1958) .
Soil reaction was measured potentiometrically (Bates ,
1964) on a Radiometer pH meter 22 ( type 5
P HM 22r) • The electrode
combination consisted of a Radio meter glass electrode type G202C
and the Radiometer calomel reference electrode type K40l . To minimize
contamination with KCl , the pH values were measured within 60 sec
after immersion of the electrodes in the samples .
The pH determinations were reported as pHsp ( saturated
paste) , pHw ( 1 : 1) , pHw ( 1 : 5 ) , pH-KCl (1 : 2 . 5) , and pH-CaC12
( 1 : 2 ) .
The soils were classified on the basis o f the following
nomenclature and limits , as recommended by the USDA Soil Survey Staff
(1951) :
Soil reaction class .l?B.
Extremely acid < 4 . 5
Very strongly acid 4 . 5 to 5 . 0
Strongly acid 5 . 1 to 5 . 5
Medium acid 5 . 6 to 6 . 0
Slightly acid 6 . 1 to 6 . 5
Neutral 6 . 6 to 7 . 3
Mildly alkaline 7 . 4 to 7 . 8
Moderately alkaline 7 . 9 to 8 . 4
S trongly alkaline 8 . 5 to 9 . 0
Very strongly alkaline > 9 . 0
5 Radio meter, Copenhagen , Denmark .

S6 . Salt concentration
- 9 -
Total soluble salts were determined by a conductivity
method. For this purpose electrical resistance of the suspension
(Piper , 1947) , supernatant solution (Greweling and Peach , 1965) , or
extract (Jackson , 1958; US Salinity Laboratory Staff , 1954) was
measured with a conductivity bridge (Model RC-16B2)6
. The saturation
extract and soil suspension were prepared according to the US
Salinity Laboratory Staff (1954) and Piper (1947 ) , respectively.
The 1 : 1 soil :water extraction of soluble salts was done according to
Jackson (1958) . In certain cases , 1 : 2 soil/water extraction was also
done (Merkle and Dunkle , 1944) . The results were reported as EC in
o mmhos/cm at 25 C.
Aqueous extracts of the saturation paste and the soil
sus pensions were obtained by vacuum filtration. Electrical
conductivity of the saturation paste extract was designated as ECspe .
Extracts were analyzed as quickly as possible to prevent
microbial activity. If the extracts could not be analyzed at once ,
toluene or thymol were added to minimize the influence of micro-
organisms on extract composition for storage for a short time .
A dip-type (immersion-type) conductivity cell was used
for soil suspensions and a pipet-type cell for soil extracts . The
cell had platinized platinum electrodes.
6 Indus trial Instruments , Cedar Grove , N.J.

- 10 -
Conductivity and chlorides were determined before
carrying out determination for pH , o the rwise KC1 from the electrode
would contaminate the sample and lead to high salt values .
The following salinity grading , as suggested by the
USDA Soil Survey Staff (1951) was used :
Class Salt content ( %) Conductivity of the extract (mmhos/cm)
Nonsa1ine 0 . 00 to 0 . 15 0 to 4
Weakly saline 0 . 15 to 0 . 35 4 to 8
Moderately saline 0 . 35 to 0 . 65 8 to 15
Strongly saline > 0 . 65 > 15
S6 . 1 . Qualitative tests
S6 . 1 . 1 .
S6 . 1 . 2 .
Calcium
A few drops of ca 5 % ammonium
added to the extract . The presence of a
white precipitate of CaC2
04 was noted
after warming the mixture for 10 min .
Magnesium
A few drops of ca 10% sodium
ammonium phosphate (NaNH4
HP04
'4H2
0) or
micro-cosmic salt were added to the
extract and made strongly alkaline with
NH40H . After stirring , the presence of a
flocculent precipitate was noted .

S6 . 1 . 3 .
S6 . 1 . 4 .
- 11 -
Chloride
The extract was acidified with HNO 3
and a few drops of ca 5 % AgN03 solution
added. A white curdy precipitate formed .
If presence of carbonate was also suspected ,
di1 . HN03 was added to see if it dissolved .
Insolubility of the precipitate confirmed
precipitate due to chloride . The soils
were rated depending upon the visual
estimation of turbidity and/or precipitate
of AgC1 .
Sulfate
A few drops of ca 10% BaC12
solution ,
acidified with HC1 , were added to the
extract . The presence or absence of sulfate
was indicated by the visual estimation of
turbidity and/or white precipitate of BaS04•
S6 . 2 . Quantitative tests
S6 . 2 . 1 . Calcium and magnesium
They were determined by titration with
ethylene diaminetetraacetate and by atomic
absorp tion spectrophotometry as given in
Sections S13 . 2 . 1 , S13 . 2 . 2 . 2 , and S13 . 2 . 2 . 3 .

86 . 2 . 2 .
86 . 2 . 3 .
- 12 -
8 0dium and potassium
They were estimated by flame
photometry and atomic absorption
spectrophotometry as given in 8ection
813 . 3 .
Chloride
It was determined by argentimetric
titration methods . The end point in the
titration was detected by either of the
following two techniques :
8 6 . 2 . 3 . 1 . Mohr method
The pH o f the extract was
adj us ted to ca 8 (just acid to
phenolphthalein) in a wide
mouthed porcelain crucible or a
small porcelain casserole . The
solution was then titrated with
0 . 1 N AgW0 3 solution , using a
K2
Cr04 solution (5%) as an
indicator to the first
permanent reddish-brown color .
This would be due to the
formation of slightly soluble

S6 . 2 . 4 .
- 13 -
S6 . 2 . 3 . 2 .
Sulfate
red Ag2Cr0
4 at the end point
(Kolthoff and Sandell , 1952 ;
Reitemeier , 1943) .
Potentiometric method
An Ag-AgCl electrode
was used (Bes t , 1950) . The
equivalence point was
indicated when a rapid shift
occurred in the potential of
the cell . This method could
be employed in the presence of
soil thus eliminating the need
for filtration (Jackson , 1958) .
It was determined by the turbidimetric
method using 30- to 60- mesh BaC12
crystals
(Chesnin and Yien , 1951) and preparing a
relatively s table colorless suspension . The
precipitate was kept in suspension with a
gum acacia solution . The absorbance of the
BaS04
suspension was measured , in the period
from 5 to 30 min after precipitation had
occurred , with a Bausch and Lomb Spectronic

7
S6 .2 . 5
- 14 -
20 co1 0rimeter7
( cuvettes with 1.3-cm path
lengths) using 420 nm wavelength ( Rossum
and Vi11arruz , 1961) . Since the turbidity
of BaS04 is difficult to reproduce (Willard
et a1., 1964) the prescribed conditions were
carefully observed so that each turbidity
was produced under identical conditions .
Carbonate and bicarbonate
An aliquot of the soil extract was
titrated with standard HC1 or H2
S04
, first
with phenolphthalein (CO�-) and then with
me thyl orange (HC03-
) indicators (Magistad
et a1 ., 1945) . See Section W6 .
S6.3. Estimation of exchangeab1e-sodium-percentage and
exchangeab1e-potassiumrpercentage
Sodium-adsorption and potassium-adsorption ratios
were calculated as follows (US Salinity Laboratory Staff ,
1954) :
Sodium-ad sorption-ratio
Bausch & Lomb , Roches ter , N.Y .

- 15 -
� Potassium-adsorption-ratio = ------------
I�+� 2
where all concentrations are expressed in meq/ 1 .
These ratios were used to calculate the
exchangeab1e-cation-percentages as follows (US
Salinity Laboratory Staff , 1954) :
Exchangeab1e-sodiu�percentage = 100 (-0 . 0126 + 0 . 01475 X) 1 + (-0 . 0126 + 0 . 01475 X)
Exchangeab1e-potassium-percentage = 100 (0 . 0360 + 0 . 1051 X) 1 + (0 . 0360 + 0 . 1051 X)
where X is equal to the sodium-adsorption-ratio and
potassium-adsorption-ratio , respectively .
S7 . Particle-size distribution analysis
Particle-size analysis of the fine skeleton of particles
under 2 mm was performed by the modified Bouyoucos hydrometer
sedimentation technique following H202 oxidation of organic
matter and soluble salt removal (Day , 1956 , 1965) . If a1ka1ine-
earth carbonates were present in soil and if they restricted
dispersion , they were removed by sufficient di1 . HC1 (Piper , 1947) .
Dispersion was carried out by an electric soil dispersion stirrer.
Ca1gon (sodium hexametaphosphate with sufficient Na2
C03
to give a
pH o f about 8 . 5 in a 10% solution) was the dispersing agent .

8
9
- 16 -
The total sand fraction (soil mineral particles between
5 0 � and 2 rom in dia . ) was separated from the silt and clay by
wet-sieving of dispersed soil suspension through a 300-mesh
sieve . For this purpose , the thoroughly dispersed and freshly
stirred soil suspension was allowed to stand exactly 40 sec
for each 10 cm of its depth and then decanted through the
sieve (Jackson , 1956) . Finally the sands were swirled in
distilled water , poured into one side of the sieve and washed
thoroughly (Jackson , 1956) .
A total of silt and clay and the content of clay
(mineral soil particle with dia . < 2 �) in the suspension were
calculated from the 0 and 2 hr readings of a hydrometer. The
silt (soil particles between 2 and 50 � in dia . ) content was
determined by the difference . Soil texture classes were
obtained from a textural triangle (USDA Soil Survey Staff , 1951) .
Silty sand clas s was established within the sandy loam class
(Hills , 1957) .
Sand fractionation was carried out by dry-sieving on an
oscillating American Instrument sieve shaker8
with several
sieves9
, after wet-washing the silt and clay through a 300-mesh
sieve , according to following sizes (USDA Soil Survey Staff , 1951) :
American Ins trument Co . , Silver Springs , Md.
Newark Wire Cloth Co . , Newark , N . J.

- 17 -
Sand fraction Diameter (range) rom Sieve for obtaining the fraction
Very coarse sand 2 .00 to 1 . 00 1 . 0- rom round hole
Coarse sand 1 . 00 to 0 . 50 0 . 5- rom round hole
Medium sand 0 . 50 to 0 . 25 60-m.esh screen
Fine sand 0 . 25 to 0 . 10 140- m.esh screen
Very fine sand 0 . 10 to 0 . 05 300-mesh screen
The soils were classified on the basis of the following
nomenclature and limits as recommended by the National Soil
Survey Committee of Canada (1965) :
Textural grouping
Coarse textured
Moderately coarse textured
Medium textured
Moderately fine textured
Fine textured
Very fine textured
S8 . Alkaline-earth carbonates
S8 . 1 . Qualitative
Textures
sands , loamy sands
sandy loam , fine sandy loam
very fine sandy loam , loam, silt
loam , silt
sandy clay loam , clay loam , silty
clay loam
sandy clay , silty clay , clay
(40 to 60 %)
> 60% clay

10
- 18 -
A quali tative estimate of the amount of free
lime was obtained by effervescence with ca 10 % HCl
after saturating the soil with sufficient water . The
relative effervescence was described as below
(National Soil Survey Committee of Canada , 1968) :
Very weakly effervescent - a few bubbles .
Weakly effervescent - bubbles readily observed .
Moderately effervescent - bubbles form a low foam .
Strongly effervescent - bubbles form a thick foam.
S8.2 . Quantitative
S8 . 2 .1 .
S8.2 .2 .
Neutralization method
Calcium carbonate equivalence (CCE)
of the soil was determined by acid
neutralization; digesting with 0 . 5 N HCl
and back titrating with 0 . 25 N NaOH using
phenolphthalein (1% in 60% ethanol) as an
indicator (US Salinity Laboratory Staff ,
1954) •
Manometric technique for calcite and dolomite
Calcite (CaC03
) and dolomite
(CaC03
· MgC03
) were determined manometrically
using the Burrell "wrist-action" shaker10
Burrell Corp . , Pittsburgh , Pa.

11
- 19 -
and the "differential decomposition rates
in acid" technique of Skinner et al . (1959 ) .
A Lab-Line constant temperature water bath11
was used . The CO2
evolved from the reaction
was measured at frequent intervals until the
reaction was complete. The results were
rep orted as separate percentages of calcite
and dolomite. However , in some instances they
were reported as CaC03
equivalent .
Soils having a per cent CaC03
equivalent of 2 or greater were placed in the
calcareous group .
The soils were classified on the basis
of the following nomenclature and limits as
recommended by the National Soil Survey
Committee of Canada (1965) :
Calcareous grade CaC03 equivalent ( %)
Weakly calcareous 2 to 5
Moderately calcareous 6 to 15
Strongly calcareous 16 to 25
Very strongly calcareous 26 to 40
Extremely calcareous > 40
Lab-Line Instruments , Melrose Park , Ill.

- 20 -
89. Loss on ignition
Air-dry or oven-dry soil (100-mesh) was heated slowly
in a porcelain crucible in an electric muffle furnace12 or over
o a gas burner to about 700 C for 1/2 hr. Loss in weight was
expressed as " loss on ignition" (Chapman and Pratt , 1961) .
810. Organic matter
810 .1 . "Loss on ignition" method
Approximate organic matter content was calculated
from loss on ignition results upon correcting for water
lost from clay crystals which is ca 5% of the weight of
the clay (Hanna , 1964) :
ca a.m. ( %) = "loss on ignition" ( %) - (0.05 x wt . of clay in the sample)
12
For organic soils , organic matter was determined
by loss on ignition without any correction.
810.2 . Wet oxidation with dichromate
Organic matter was estimated by the Walkley-Black
titrimetric wet oxidation method in which the heat of
dilution of conc. H2
S04
with 1 N K2
Cr2
07
was the s ale
source of heat . Ini tially , b arium diphenylamine
sulfonate ( 0.16 % aqueous solution) was used as an
Ga11enkamp & Co ., London , England.

- 21 -
indicator (Peech et al . , 1947) . Later , " ferroin"
indicator (ortho-phenanthro1ine ferrous sulfate , 0 . 025 M
solution) was found to be more convenient (Grewe1ing and
Peech , 1965 ) . Total organic matter was calculated
assuming 7 7 % recovery .
For some investigations , it was more useful to
express results as per cent organic carbon .
S11 . Nitrogen
13
Sll . l . Total nitrogen
Total nitrogen was determined by the modified
macro-Kj e1dahl technique as outlined by Jackson (1958) .
Nitrogen of the sample was converted to ammonia and was
present in H2
S04 as (NH4
)2
S04
' or more likely as NH4HS04
(Taras , 1958) . Kjeldah1 digestion flasks of hard we1l-
annealed glass with 800 ml cap acity were used .
Kelpak #113
containing K2
S04 , HgO and cus04l4
, was used
to raise the temperature of the digestion mixture and
as catalysts , respectively (Kirk , 1950) . The mercury
ammonium complex in the digest was decomposed by sodium
Matheson Scientific , East Rutherford , N . J .
14 Each packet of Kelpak #1 contains 9 . 9 g K
2S0
4,
0 . 41 g HgO , and 0 . 08 g CuS04,

15
16
- 22 -
thiosulfate (Na2
S2
03 · 5H20 ) . To minimize pollution ,
precaution was taken that exposed Hg was not allowed to
accumulate .
The source of heat for digestion was able to maintain
o the digestion mixture at a boiling point of ca 350 C .
Ammonia was distilled from an alkaline medium and
absorbed in an unstandardized boric acid solution - Winkler
modification ( Scales and Harrison , 1920) and titrated with
s tandard HCl . Alternatively , ammonia was collected in
standard H2
S04 and excess acid back titrated with standard
NaOH solution (Jackson , 1958) .
were added to prevent bumping .
15 A few Hengar granules
Known ammonium standard solutions were used for
distilling to determine the volume of distillate to be
collected for complete recovery .
The Labconco Kjeldahl unit16
was steamed out
before carrying out actual analyses till the distillate
from the distilled water was free of ammonia.
If soil nitrates were to be included in the
determination , salicylic acid modification was used
(Bremner , 1965 ; Cope , 1916) . The resulting nitro-
salicylic acid was then reduced with sodium thiosulfate
Hengar Co . , Philadelphia , Pa.
Laboratory Construction Co . , Kansas City , Mo .

- 23 -
to form the ammonium compound which was converted to
ammonium salt upon digestion ( Shuey , 1947) .
Carbon-nitrogen ratios were calculated as
follows :
� ratio = Organic C ( %)
Total N ( %)
Sll.2 . Exchangeable ammonia
The exchangeable NH4 was determined on moist samples .
It was extracted with a 10 % NaCl solution ( 1 . 7 N) , acidified
to pH 2 .5 with HCl (Peech et al., 194 7) and determined by
one of the following methods :
Sll.2 .l .
Sll.2 .2 .
Distillation method
It was distilled from a strongly
alkalized s ample as given in Section Sll.l .
This method was used when interference was
experienced in direct Nesslerization. It
was generally preferred to Nessler method
for precision and accuracy.
Nesslerization method
Upon treatment of ammonia with Nessler
reagent (alkaline HgI2
'2Kl solution) , a
reddish brown colloidal compound was formed
(Nichols and Willits , 1934) . The absorbancy

17
- 24 -
o f the solution was read7
after adding
the Nessler reagent and standing for at
least 10 min . However , if the NH4
-N
content was very low , then samples were
read 25-30 min after adding Nessler reagent .
Since the Nessler-ammonia color sys tem
absorbs light over a broad wavelength range
(400 to ca 575 nm) , optimum wavelength was
selected at the point of maximum absorption
from the absorption spectrum for the
nitrogen range under investigation .
Generally , a wavelength of 410 nm was used .
See Section W9 . l .
Sll . 3 . Nitrate nitrogen
The nitrate nitrogen content was estimated
colorimetrically with the phenoldisulfonic acid (PDA) method
(Harper , 1924) . Nitrate was extracted with 0 . 02 N C US04
solution , 0 . 007 N with respect to Ag2
S04 to prevent
chloride interference (Harper , 1924; Prince , 1945) . A
reciprocating , variable speed (60 to 260 oscillations/min )
Utility shaker17
was used . It was ensured that during
sample evaporation a neutral or slightly alkaline medium
Eberbach Corp . , Ann Arbor , Mich.

- 25 -
was present (Taras , 1950) . Samples were evaporated on a
Lindberg Hevi-duty hot p1ate18 • Temperature was
controlled such that loss of residue was avoided . The
yellow color was developed in the presence of
ca 7 N NH40H. If NH
4-N was also being determined
concurrently , then KOH solution was used in place of
NH40H to determine N03-N . The color intensity
measurements were carried out at 415 nm wavelength
using a Bausch and Lomb Spectronic 20 colorimeter7
•
S12 . Phosphorus
S12 . l. Water soluble phosphorus
Water soluble P was extracted according to
Bingham ( 1949) and determined as given in Section S12 . 2 . 2 .
S12 . 2 . Easily soluble phosphorus
S12 . 2 . L Extraction
Easily soluble P was extracted by
the following two methods :
S12 . 2 . l . l . Easily soluble P in neutral and
alkaline soils
Phosphorus was extracted by
18 Hevi-duty Heating Equipment Co . , Waterto-.m, Wis .

812 .2 .2 .
- 2 6 -
Olsen ' s method with 0 .5 M
NaHC03 solut ion adj usted to
pH 8 .5 (Olsen et a1 ., 1954) .
812.2 .1.2 . D ilute acid-fluoride extract ion
on acid soils
Adsorbed P was extracted
with 0.03 N NH4F in 0.025 N HC1 ,
Bray-P1 method (Bray and Kurtz ,
1945 ) .
De termination
Phosphate-free detergent was used
for clean ing all glassware .
812 .2 .2 .1 . Ch1orostannous-reduced
mo1ybdophosphoric blue color
method in a hydrochloric acid
system
The transmittance of the
solut ion after treatment with
molybdate in HCl and 8nCl2
was determined at 660 nrn in a
photoelectric co1or imeter7
between 4 and 20 min and the
concentration o f P determined
by reference to a standard

- 2 7 -
curve (Dickman and Bray , 1940 ;
Woods and Mellon , 1941) .
Phosphorus was determined in
the extract after removing
organic matter with activated
charcoal.
S12 .2 .2 .2. Ascorbic acid method
Phosphorus was estimated
colorimetrically as
phosphomolybdenum blue with
ascorbic acid as reducing agent
and Sb added to give a stable
Mo-P-Sb compound. After 10 min,
color intensity was measured at
882 nm by a Spectronic 20
colorimeter7
(Murphy and Riley ,
1962 ; Watanabe and Olsen , 1965) .
S13. Cation exchange , exchangeable cations , and base saturation
The quantities determined in the usual cation exchange
analysis were as follo t·ys :
Cation exchange capacity ( S13.l)
Exchangeable Ca and Mg ( S13 .2)
Exchangeable K and Na ( S13.3)
Exchangeable H ( S13.4)

- 28 -
Total exchangeable bases ( S13.5)
Percentage base saturation ( S13 .6)
S13.l . Cation exchange capacity (CEC)
It was ob tained by one or both of the following
procedures :
S13.1 .1 . Saturation with NH40Ac or Ba(OAc)
2 solution
The soil was saturated with
1 N NH40Ac adj usted to pH 7 .0. After
leaching excess NH4
0Ac from NH4
-saturated
soils in a Buchner funnel with 9 5 % ethanol ,
acidified 10% NaCl solution was used
to displace ammonium ions . The amount of
exchange ammonium was determined by
Kj eldahl distillation (Atkinson et al., 1958) ,
as given in Section Sll .l .
The NH Ok leachate was retained 4
for the determination of exchangeable cations .
Cation exchange capacity of the peat
samples was determined by saturation with
hydrogen using 0 .5 N HCl , equilibrating with
neutral 1 N Ba(OAc)2
and then titrating the
extract with s tandardized 0 .2 N NaOH to
pH 7 .0 (MacLean et al., 1964) . --
S13 . 1 . 2 .
- 29 -
Summation me thod
Exchange capacity was also
determined in some cases (distinctly acid
soils ) to be the sum of the metallic
cations (exchangeable bases) and
exchangeable hydrogen (exchange acidity) .
This method was not used for neutral ,
calcareous , or saline soils (Chapman , 1965 ) .
S13 . 2. Exchangeable calcium and magnesium
S13 . 2 . 1 . Compexometric titration me thod
The NH40Ac leachate was titrated
with 0 . 01 M disodium versenate (disodium
dihydrogen ethylenediamine tetraacetic
acid) , an organic sequestering agent which
forms unionized complexes with Ca and Mg
(Tucker and Kurtz , 1961) . Ammonium
acetate and dispersed organic matter , when
present in appreciable quantities , were
first removed from the soil extracts by
the procedure used by the US Salinity
Laboratory Staff ( 1954 ) . First the total
of Ca and Mg was obtained using Eriochrome
black T dye (F241) as an indicator (Cheng

- 30 -
and Bray , 1951) and a buffer to get a pH
of 10. 0 (Biedermann and Schwarzenbach , 1948) .
The NH4C1-NH
40H buffer o f pH 10. 0 (Cheng
and Bray , 195 1 ; Diehl et a1 . , 1950) or
odorless 2-amino-ethano1-HC1 buffer (Katz
and Navone , 1964 ; Patton and Reeder , 1956)
was used. On a separate aliquo t , Ca was
titrated with EDTA using Cal-Red as an
indicator (Patton and Reeder , 1956) , after
precipitating Mg as Mg (OH)2
by adding NaOH
solution (ca 4 N) to increase the pH to
12 (Cheng and Bray , 1951 ) . The titration
was performed i mmediately after alkali
addition. Magnetic stirrer and artificial
light were used for titrations . In these
che10metric titrations , hydroxylamine
hydrochloride was used to reduce some of
the potential interferences to less
obj ectionable lower oxidation states
( Fische r , 1962) . Potassium cyanide was
used to prevent Fe , A1 , Cu , Zn , and Mn
interferences by tying up these metals as
their cyanide complexes .
Magnesium was calculated from the
difference between the above two titrations.

513.2 . 2 .
- 31 -
Atomic absorption spectrophotometry
513 . 2 . 2 . 1 . Instrumentation and related
details
Atomic absorption
spectrophotometry was used
for the determination of Ca,
Mg , K, Na , Fe , Mn, Cu , and Zn
in soil , plant , and water
samples . A double-beam instrument ,
Perkin-Elmer Model 303 atomic
absorption
was used .
19 spectrophotometer
® Intensitron hollow
cathode lamps were employed . An
Automatic Null Recorder Readout
was also used , especially for
low concentrations .
All ins trument settings
were those recommended in the
analytical methods manual
(Perkin-Elmer Corp . , 1968) .
However , slight adjustments
in the suggested settings were
19 Perkin-Elmer Corp . , Norwalk , Conn .

- 32 -
found to give more accurate
results for certain analyses .
The burner was flushed with
water and the " zero absorption"
re-established before aspirating
each sample . At least 3
standards were prepared to
obtain a working curve . Standards
were prepared in the same solvent
as the samples. Working curve
was prepared with every batch of
samples .
Solutions were diluted to
obtain concentration range as
given by Perkin-Elmer Corp . (1968)
in their loose-leaf analytical
methods manual . To minimize the
error due to dilutions , pipets
smaller than 2 ml or volumetric
flasks smaller than 25 m1 were
not used (McBride , 1964) .
When the concentration of
the element was very low , as in
the case of Cu in foliage , scale

- 33 -
expansion was used to improve
readability of small signals
and hence improve the detection
limit (Perkin-Elmer Corp ., 196 8) .
Scale expansion and zero
suppression on the Recorder
Readout Accessory were also used .
The per cent absorption readings
were divided by the scale
expansion value and converted to
absorbance . When absorption
readings were less than 10%
(using scale expansion) then
they were plotted against
concentration without prior
conversion to optical density.
S13 .2 .2 .2 . Calcium
A dual-element hollow
cathode lamp containing Ca and
Mg was used at 15 mao Air and
acetylene flow rates were set
to get reducing (rich , slightly
yellow) flame .

- 34 -
Calcium standard stock
solution was prepared by
dissolving CaC03
in dil . HCl .
A final concentration of 1%
La was used to prevent
interferences from P and Al in
the sample (David , 1960) .
Lanthanum oxide (La2
03
) or
lanthanum chloride
used. If lanthanum oxide was
not available in a sufficiently
pure form, it was prepared by
heating lanthanum nitrate
[La(N03
)3 ·6H
20] at 700 0C for
2 1/2 hr in a muffle furnace12
(Perkin-Elmer Corp ., 1968) .
Wavelength used was 4227 R.
Slit was set to 4 (slit opening =
1 mm, sp ectral band width = 13 R).
A 10 ppm Ca solution was used to
set acetylene flow to obtain
maximum absorption.

- 35 -
813 . 2 . 2 . 3 . Magnesium
The Mg-Ca lamp was used .
Magnesium standard stock
solution was prepared by
dissolving its metal in di1 .
HC1 . A 0 . 5 ppm Mg solution
was used to adj us t the
acetylene flow to obtain
maximum absorption (reducing
flame) . After proper dilution
and La addition to remove the
potential interference due to
A1 and P , Mg was determined at
2852 � line and slit 5 (slit
opening = 3 mm, spectral band
width = 20 �).
813 . 2 . 2 . 4 . Calcareous soils
Due to the dissolution of
some of the Ca and Mg from
CaC03
( calcite) and CaC03
·MgC03
( dolomite) , 1 N NH40Ac solution
could not be used for extracting
exchangeable Ca and Mg . Instead

S13 . 2 . 2 . 5 .
- 36 -
a 0 . 2 N B aC12
-triethano1amine of
pH 8 . 1 was used as extracting
solution (Meh1ich , 1945; Peech
et a1 . , 1947) . Exchange able Ca
and Mg in calcareous soils were
also extracted by 1 N N aOAc , pH 8 . 2
(Bower, 1955 ; Bower et a1 . , 1952) .
Correction for water soluble s alts
A correction for water soluble
Ca, Mg , Na, Mn , K , Fe , and Zn for
an accurate determination of
exchange able quantities of these
cations was essential since the
forest floor contains a substanti al
portion of these cations in water
soluble form . Exchange able ions
were found by difference between
extract able and water soluble ions .
However , when analyzing for soil
fertility investigations , water
soluble ions were not determined
sep arately .

20
- 37 -
S13 . 3 . Exchangeab le potassium and sodium
In nons aline soils , no correction was needed for
the amounts of water-soluble K and Na. For correction
in the saline s oils , the amount of water-soluble K or Na
in a saturation extract (or similar water extract) of the
soil was subtracted from the total extracted by
1 N NH4
0Ac (Prat t , 1965) .
Exchangeab le K and Na were determined after
extraction with 1 N NH40Ac , pH 7 . 0 ( Scho11enberger and
Simon , 1945) by either of the following two methods :
S13 . 3 . 1 .
S13 . 3 . 2 .
Flame photometric analysis
Organic matter was destroyed by
RN03
oxidation . A Beckman model DU flame
20 emission spectrophotometer was used with
an oxygen-acetylene flame . Lithium was
used as an internal standard (Rich , 1965 ) .
Potassium was determined at 7670 R
wavelength and Na at 5885 R (Dean , 1960) .
Atomic absorption spectrophotometry
S13 . 3 . 2 . 1. Potassium
Standard stock solution was
Beckman Instruments , Inc . , Fullerton , Calif .

S13 . 3 . 2 . 2 .
- 38 -
prepared by dissolving KCl in
water . An oxidizing (lean , blue)
flame was used . The final
dilution in standards and samples
contained 1000 ppm added Na to
minimize ionization interference .
Potassium was determined at
7665 R wavelength and slit setting
at 4 (slit opening = 1 . 0 rom,
spectral band width = 13 R). The
single element lamp was operated
at 25 mao See also Section
S13 . 2 . 2 . l .
Sodium
Standard stock solution was
prepared by dissolving NaCl in
water . An oxidizing flame was
used. The final dilution in
standards and samples contained
1000 ppm added K to substantially
overcome ionization interferences .
Sodium was determined at 5890 R
wavelength and slit setting of 4
as in the case of K. The single
element lamp was operated at 15 ma o

- 3 9 -
See also Section S13 . 2 . 2 . l.
S13 . 4 . Exchangeab le hydrogen (exchange acidity)
S13 . 4 . l .
S13 . 4 . 2 .
S13 . 4 . 3 .
Barium acetate extraction
Exchangeab le H was determined
using a 1 N Ba (OAc)2
extracting solution
of pH 8 . 1 , adjusted with Ba(OH)2
' and back
titrating with 0 . 05 N NaOH solution
(Mehlich , 1945; Parker , 1929 ) .
Ammonium acetate extraction
Exchangeable H was determined by
the change in the pH of a 1 N NH40Ac
solution of pH 7 . 0 ( Schollenberger and
Simon , 1945) .
Barium chloride - triethanolamine extraction
The soil was leached with a solution
consisting of 0 . 5 N BaC12
and 0 . 055 N
triethanolamine adj usted with HCl or
triethanolamine to pH 8 ± 0 . 02
(Greweling and Peech , 1965 ; Peech , 1965) .
An aliquot of the extract was titrated
with 0 . 1 N HCl using a mixed indicator
(bromocresol green-methyl red) to a pink
end point (pH 5 . 1) .

- 40 -
S13 . 5 . Total exchangeable bases (TEB )
Total exchangeable bases (the alkali and
alkaline earth metals , principally Ca, Mg , Na , and K)
were determined by the procedure of Bray and Willhite
(1929 ) ; appropriate corrections being made for
calcium , magnesium, or sodium carbonates and
b icarbonates , and nitrates . No correction was needed
for chlorides and sulfates .
S13. 6 . Percentage base saturation ( % BS) or exchange status
S14 . Iron
For certain investigations the results were
more useful if expressed as exchange status . Per
cent base saturation values were calculated from the
sum of exchangeable Ca , Mg , Na , and K and the C EC
values as follo ws :
% BS T EB (meg %)
x 100 =
CEC (me g %)
= Exch. (Ca+Mg+Na+K) x 100 Exch . (Ca+Mg+Na+K+H)
S14 . 1 . Extraction
S14 . 1 . 1 . Ammonium acetate extraction
Water soluble and exchange Fe in

- 41 -
h ighly acid or water-logged soils were
extracted with 1 N NH4
0Ac , pH 7 . 0 solut ion .
814 . 1 . 2 . Readily soluble iron
Readily-soluble Fe was extracted
by the follo wing t wo methods on 100-mesh
soil :
814 . 1 . 2 . 1 . Dithionite - citrate - b icarbonate
814 . 1 . 2 . 2 .
method for removal of free iron
oxides from so il (Mehra and
Jackson , 1960)
This method employs sodium
reduct ion , NaHC03
as a buffe r , and
sod ium citrate (Na3C6
H5
07 · 2H
20) as
a che1ating agent for Fe2+
and
3+ Fe (Jackson , 1956) .
Acid-ammonium o xalate extraction
method of McKeague and Day (1966)
80 i1s were shaken in darkness
with 0 . 2 M acid if ied ammon ium
After centrifug ing the extract was
analyzed . An International

- 42 -
centrifuge2 l
, Model MAME, was
used.
S14 . 2 . Determination
Aliquots of the extracts from S14 . l . 2 were
digested with HN03
and H2
S04
to destroy organic matter
before Fe determination .
S14 . 2 . 1 .
'814 . 2 . 2 .
Colorimetric method
O-phenanthroline (C12H
SN
2 · H20) ,
also kno wn as 1 ,10-phenanthroline , was
used . Iron was determined colorimetrically
as the orthophenanthroline orange-red
ferrous complex (Caldwell and Adams , 1946 ;
Fortune and Mellon , 193 5) . The absorbance
was measured7
in 1 . 3-cm cells at a
wavelength of 50S or 5 10 nm and varied in
the range 4S0 to 520 nm on the basis of
the absorption spectrum (AOAC , 1960 ;
Sandell , 1959 ) .
Atomic absorption spectropho tometry
S tandards were prepared from a
stock solution prepared by dissolving
21 I . 1 B M nte rnat �ona Equipment Co . , oston , ass .

SIS. Manganese
S15 . l . Extract ion
- 43 -
metal in 0 . 2 N RN03
• A mult i-element
hollo w cathode lamp contain ing Fe , Mn ,
Cu , and Zn was used at a current of 25 ma o
Iron was determined in an oxidiz ing
flame at 2483 R wavelength and slit setting
3 (slit opening = 0 . 3 rom, spectral band
width = 2 R).
Water-soluble and exchangeable Mn were extracted
with 1 N NH40Ac , pH 7 . 0 solut ion.
S15 . 2 . Determination
S15 . 2 . l . Colorimetric permanganate technique
Manganese was determined
colorimetrically with periodate as the
oxidiz ing agent , to form permanganate
(Cooper , 1953 ; Kolthoff and Sandell ,
1952 ; Mehl ig , 19 39) . A wavelength of
7 525 or 545 nm was employed , generally
5 25 nm . A transmittancy curve was
prepared to obtain the optimum wavelength.
The wavelength g iving the least
transmittancy and h ighest ab sorbance was

S16 . Copper
S15 . 2 . 2 .
S16 . 1 . Extraction
- 44 -
used (Sandell , 1959) . Prior to color
development , chloride and other reducing
substances such as organic matter were
removed by H2
S04
, HN03
, and H3
P04 , as
given by APHA (19 65) . Potassium or Na
salt of the periodate employed to
develop the permanganate color was
potassium meta-periodate (KI04
) or
sodium para-periodate (Na3H
2I0
6) , i . e . ,
trisodium periodate [para] . Potassium
permanganate ( KMn04
) was used to
prepare standards .
Atomic absorption spectroscopic method
A multi-element hollow cathode
lamp containing 4 metals (Fe , Mn , Cu , and
Zn) was operated at 25 ma o Manganese was
determined in oxidizing flame at 2798 �
wavelength and slit setting 4 (slit
opening = 1 rom, spectral b and width = 7 �).
See also Section S13 . 2 . 2 . 1 .
Chemical indices of availability of soil Cu were

- 45 -
measure d by the followin g methods:
816 . 1 . 1 .
816 . 1 . 2 .
Versenate and citrate extraction
Extraction with a versenate and
citrate mixture containing 20 g
ammonium citrate [ (NH4
)2HC
6H
50
7] and
5 g Na2
EDTA in 100 m1 water (Cheng and
Bray , 1953) .
Versenate extraction
816 . 1 . 2 . 1 . Versenate , 1% solution
816 . 1 . 2 . 2 .
816 . 2 . Determination
Extraction with 1% solution
of Na2EDTA after shaking for 2 hr
(Allan , 1961a) .
Versenate , pH 4 solution
Extraction with 1% Na2
EDTA
(adj uste d to pH 4 . 0 with HC1)
after shakin g for 10 min (Cheng
and Bray , 195 3) . This extraction
proce dure was use d for aci d soils
only.
Copper in the extract was determine d by atomic
absorption spectrophotometer. A multi-element lamp
containin g the Cu-Fe-Mn-Zn combination was used. The

S17 . Zinc
- 46 -
Cu resonance line at 3247 R was employe d. Slit setting
of 4 ( slit o penin g = 1 mm, spectral ban d width = 7 R)
was used. The determination was carrie d out using an
oxi dizin g flame . A standard made by dissolving metal
in dil . RN03 was use d to prepare a calibration curve .
See also Section S13 . 2 . 2 . l .
S17 . l . Extraction
The following t wo metho ds were use d for extraction
of Zn as an availability index :
S17 . l . l .
S17 . l. 2 .
S17 . 2 . Determination
Hydrochloric acid extraction
Zinc was extracted with 0 . 1 N HCl
according to Nelson et al . (1959 ) .
Versenate extraction
A 1% solution of di so dium EDTA
(ca 0 . 027M) was also use d (Perkin-Elmer
Corp. , 196 8) .
The Zn content of the extracts was determined
by an atomic absorption spectro phometer . Standar ds were
pre pare d from a stock solution prepare d by dissolving
metal in dil . HCl . Zinc was determine d in an o Xi dizing

- 4 7 -
flame at 2 138 X wavelength and slit setting at 4
( slit opening = 1 mm, spectral band width = 7 X) using
a Fe-Mn-Cu-Zn lamp . See also Section S13 . 2 . 2 . l.
S18 . Total elemental analysis for calcium, magnesium2 sodium 2
potassium, and iron
The total element analysis was carried out on extracts
prepare d according to Pawluk (1967) . The element s were
determined as given in previous sections.
S19 . Nitric acid extraction of potassium
In some forest soils, index of availab le potassium was
obtained by extraction with boilin g N HN03 (Leaf , 195 8 ; Rouse
and Bertr amson , 1950) . A 10-g soil sample was boiled for 10 min
in 50 m1 N HN03
, coo le d, filtere d, made up to volume and the
K determine d as given in Section S13 . 3 .
S20 . Extraction and measurement of soil moisture (fiel d capacity and
permanent wilting point)
S20 . l. Fiel d capacity
S20 . l . l . 1/3-atmo sphere water tension (Wl / 3
)
Laboratory estimate of the amount
of water hel d by the soil at field capacity

S20. l . 2 .
- 48 -
or 1/3 atm tension was obtaine d by a
22 l5-bar Ceramic Plate Extractor with
I-bar bubbling pressure plates (Richards,
1949 ; Richards an d Weaver , 1944) .
Soil column wetting procedure
Field capacity was also
determine d by wettin g the soil column
until the wetting front reached ca 10 cm
from the bottom of the column. The
samples were collecte d 24 hr after wetting.
S2 0. 2 . Permanent wilting point (W15
)
Laboratory e stimate of the amount of water hel d
by the soil a t the permanent wilting point o r l5-atm
percentage (FAP) was determine d by the l5-bar Ceramic
Plate Extractor with l5-bar bubbling pre ssure plates
(Richards, 1947 , 1965 ; Richards and Weave r , 1944) .
S2 0. 3 . Moisture content after equilibration at other tensions
The 0-1 atm range determinations were carrie d
out with the I-bar ceramic plate cells and the 1-15 atm
range determinations with the l5-bar ceramic plate cells
in the l5-bar Ceramic Plate Extractor.
22 Soil Moisture Equipment Corp . , Santa Barbara , Calif .
- 49 -
820 . 4 . Oven- dryin g of equilibrate d samples
Moisture contents in samples after equilibration
at different tensions were determine d gravimetrically
after the soil samp les were oven- dried4
overni ght at
1050C . The results were expresse d as percentage of the
oven- drie d weigh t .
820 . 5 . Available water ( W A
)
The available water storage capacity of the soil
was obtained by subtractin g the moisture held at 15-atm
tension from 1/3- atm moisture content . This is assumed
to be available water .
820 . 6 . Calculation of results on volume basis
Moisture weight percentages were converted to a
volume basis by multiplication with core bulk density .
821 . Nitrif ying capacity
The appraisal of the activity of nitrifying bacteria was
done by incubating soil at 28°C for 2 weeks (Wilde and Voigt ,
1959) and then determining the N03
-N content by the PDA
colorimetric method as given in Section 811 . 3 . For incubation ,
water was added to brin g the moisture to 0 . 7 or 0 . 8 of fie1d-
moisture capacity which was kept constant by the t wice weekly
additions of water and weekly mixing of soil to provide
aeration during the incubation perio d (Jackson , 195 8) .
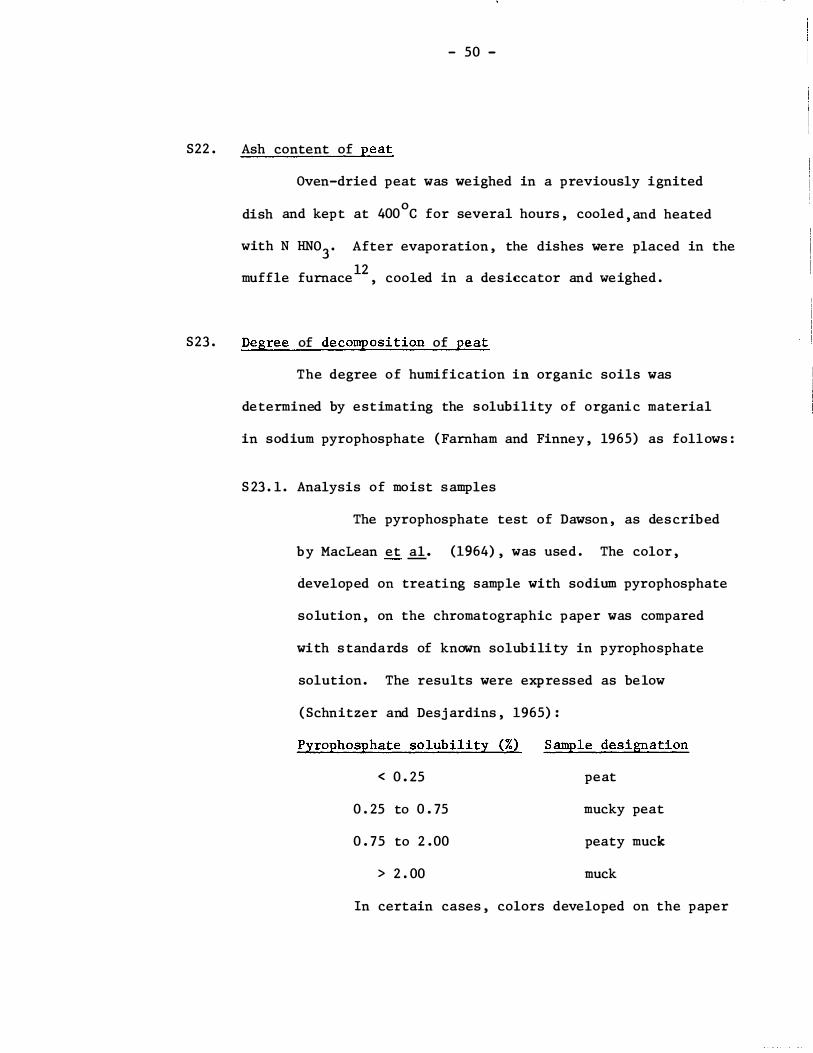
S22 . Ash content of peat
- 50 -
Oven-drie d peat was weighed in a previously i gnited
o dish and kept at 400 C for several hours , coole d, an d heated
with N HN03 • After evaporation , the dishes were placed in the
12 muffle furnace , cooled in a desiccator an d weighed .
S23 . Degree of decomposition of peat
The degree of humification in organic soils was
determined by estimating the solubility of organic material
in sodium pyrophosphate (Farnham and Finney , 1965) as follows :
S23 . l . Analysis of moist samples
The pyrophosphate test of Dawson , as described
by MacLean et al e (1964) , was use d. The color ,
developed on treating sample with so dium pyrophosphate
solution , on the chromatographic paper was compared
with s tandards of known solubility in pyrophosphate
solution. The results were expressed as below
( Schnitzer and Desj ardins , 1965) :
Pyrophosphate solubility ( %) Sample designation
< 0 . 25 peat
0 . 25 to 0 . 75 mucky peat
0 . 75 to 2 . 00 peaty muck
> 2 . 00 muck
In certain cases , colors developed on the paper

- 51 -
were compare d with Munsell color chart s3
•
S23 . 2 . Analysis of air- dry sample s
Samples were shaken with a so dium pyrophosphate
solution , 0. 025 M Na4
P2
07 · 10 H2
0, an d the absorbance of
7 the filtrate was measured at 550 nm in a spectrophotometer
(Kai1a , 1956 ; Schnitzer and Desj ar dins, 1965 ) . The
absorbance readings were multiplied by 100 to give
cardinal numbers (Schnitzer and Desj ardins, 1965) .
S24 . Unrubbe d fiber content o f peat
These determinations were carrie d out for classification
of organic soils. The moist sample was allowe d to stand
overnight with 1 % ca1gon solution in a sample to solution ratio
of 1 : 20 ( w/v) and poured over a 100-mesh screen , then washe d
once with 2% HC1 to dissolve carbonates, if any. The wei ght
of the fiber (�0. 15 mm) was determine d after oven- drying4
at
1050C .

- 52 -
METHODS FOR PLANT ANALYSIS
Pl . Determinations on fre sh nee dles or leaves
Pl . l . Fresh weight o f 100 nee dles ( leaves)
o Cold storage at ca 4 C (maximum 2 weeks) , if
necessary.
P l . 2 . Oven- dry wei ght o f 100 needle s (leaves)
P2 . Pretreatment for further analyse s
P2 . l . Se gregation into dif ferent parts
Corresponding parts from a fe w plant samples
were composite d.
P2 . 2 . Cleaning of samples
Leave s were cleanse d with a damp linen rag or
gentle brushing with a stiff-bristle d brush (Ward an d
Johnston , 1962) . Washing plant tissues with water was
avoi de d , although roots were washe d free of soil or
sand (Ward and Johnston , 1962 ) .
P2 . 3 . Removing of nee dles (leaves) from branchlets
S cale-like leaves (e . g . , Chamaecyparis and Thuja)
were not removed from twigs - the two being analyze d

- 5 3 -
together. Short nee dles (e . g . , Picea and T suga) were
analyzed entirely. Long needles (e . g . , P inus and some
Abies spp . ) were broken into ca 10 rom len gths prior to
subsampling for weighing.
P2 . 4 . Air- dryin g
Leaves and all other plant material (bark , branches,
root s, etc . ) were cut into small pieces. Before drying ,
pine needles and leaves were remove d from the twigs;
spruce needles were left to dry on the twigs. Contamination
by dust was avoide d e specially when Fe , Mn , Cu , an d Zn were
to be determine d. In some species (e . g . , Pinus sylvestris L. )
the nee dle base was remove d.
P2 . 5 . Oven- drying
4 The samples were put in an oven and dried overnight
at 70o
C .
P2 . 6 . Grinding
The samples were ground with an Interme diate Mo del
Wiley Mil123
, with stainless steel contact points, to pass
through a 40-mesh sieve . The mill was thoroughly cleanse d
between grinding individual samples. These sample s were
use d for the determinations of N , P , K , Ca, Mg , Na , etc.
For the determination of Fe , Mn , Cu , and Zn the samples
23 . Arthur H . Thomas Co . , Scientific Apparatus, Philadelphia , Pa.

- 5 4 -
were ground in an agate or porcelain mortar to avoid
metallic contamination.
P2 . 7 . Storage
Ground samples were transferred to ti ghtly
cappe d glass j ars, labelled clearly , and stored for
further analysis.
P2 . 8 . Subsampling
For anlysis the material was sub sampled by
quartering (Jackson , 1958) .
P3 . Root / shoot ratio
For the determination of root/ shoot ratio , as in sand
culture experiments, the see dlings were washe d free of san d,
separate d into shoots and roots, drie d4
at 70o
e , and weighed.
For analysi s , the roots and shoots were combined i f seedling
ti ssue concentration was to be determine d; otherwise they
were analyze d separately.
P4 . Total nitrogen
Total nitro gen was determined using the Kjeldahl di gestion
metho d follo we d by steam distillation (Jackson , 195 8) . See
Section Sll . l .

P5 . Total ash
- 55 -
Determination of the total ash content was done by ashing
o 12 at ca 525 C in a muffle furnace , as outlined by Jackson (1958) .
P6 . Preparation of extract for total mineral constituents
A representative sample of the plant material was dry
ashed . The samples were ashed in a silica crucible overnight
o 12 at 450 C in a muffle furnace • Usually , a l-g subsample was
used . For certain analyses such as Cu , a 5 g sample was
ashed in a silica dish . Alternately , plant samples were also
ashed at 5500C for 2 hr or longer (Chapman and Pratt , 1961)
until the tissue was burnt to a greyish-white ash . Ashing for
o P and S was generally carried out at 450 C . However , when
o 550 C was used , ashing was carried out in an excess of Mg (N0
3)
2
to prevent loss by volatilization (Chapman and Pratt , 1961) .
In that case , plant sample was charred in a muffle furnace
o for 2 hr at 300 C . Two milliliters o f 5 0 % Mg (N0
3)2
solution
were added and the solution evaporated over a steam bath before
o ashing at 550 C .
Ash was dissolved in 1 N HCl (10 ml 1 N HCl/g sample) ,
warmed , filtered , and the solution diluted to volume (Chapman
and Pratt , 1961) .
For Cl determination , ashing was done in a basic medium.
Piper ' s method (1947) using CaO was employed . Ash was taken up

- 56 -
o In certain cases , samples were ashed at 450 C
after wetting with 6% calcium acetate [Ca(CH3
COO)2
o H2
oJ
solution and extracted with hot water o
For ashing , the temperature in the muffle furnace
was gradually raised to the required temperature .
Certain samples for total P w.ere wet-ashed with
HN03-H
2S0
4-HCl0
4(lO : 1 : 4) ternary acid mixture according to
the procedure outlined by Jackson (1958) . The suggested
predigestion with HN03
was omitted .
P7 . Silica
Silica was determined gravimetrically by treating the
ash with 1 : 1 HCl after digesting for ca 30 min on a water bath
(Piper , 1947 ) .
P8 . Phosphorus
The de termination of total P content was made
colorimetrically by the vanadomolybdate procedure based on
the yellow color of the unreduced vanadomolybdophosphoric
heteropoly complex in HN03
medium (Barton , 1948 : Kitson and
Mellon , 1944) . The color intensity was determined by the
Spectronic 20 colorimeter7
; generally a light maximum at
470 nm (Jackson , 1958) was employed . All the glassware was
washed with phosphate-free detergent .

P9 . Potassium and sodium
- 5 7 -
Total K and Na in the He1 extract were determined flame
photometrically and by atomic absorption spectrophotometry as
given in Section S13 . 3 .
If only K or Na was to b e determined , ashing was not
done . Ins tead , these elements were extracted from the samples
with 1 N NH4
0Ac , pH 7 . 0 (Chapman and Pratt , 1961) . If they
were to be determined by flame photometry , then NH4
0Ac
solution containing 2 50 ppm LiN03 was used and a ratio of
1 : 500 for sample to solution was employed .
P10 . Calcium and magnesium
These cations were determined in the extract by the
conventional versenate methods . See Section S 13 . 2 . 1 .
For determination by atomic absorption spectrophotometry ,
the Ca standards also contained MgC12• Similarly , Mg
standards contained CaC12
to allow for mutual interference .
See Sections S13. 2 . 2 . 1 , 813 . 2 . 2 . 2 , and S13 . 2 . 2 . 3 .
P11 . Iron , manganese , copper , and zinc
Iron , Mn , Cu , and Zn in the filtrate were determined
by procedures given in Sections S14 . 2 , S 15 . 2 , 816 . 2 , and S17 . 2 ,
respectively (Buchanan and Muraoka , 1964 ) .

P12 . Chloride
- 5 8 -
Total chloride was determined in the HN03 extract of the
ash or on a water extract (1 :50 sample to water ratio ) .
Determination was done according to the Mohr method by titrating
with AgN03
solution , using K2
Cr04 indicator , until the firs t
las ting appearance of the colored precipitate . See Section
S6 . 2 . 3 . l .
P13 . Total sulfur
Total sulfur was estimated by the BaS04
turbidimetric
method using BaC12
( Chesnin and Yien , 1951) . See Section
S6 . 2 .4 .
P14 . Cation exchange capacity of roots
The root cation exchange capacity was determined by
the method reported by Crooke (1964) which employs acid
washing followed by titration of the root-KCl suspension
with standard 0 . 01 N KOH solution to restore the pH to 7 . 0 .
- 59 -
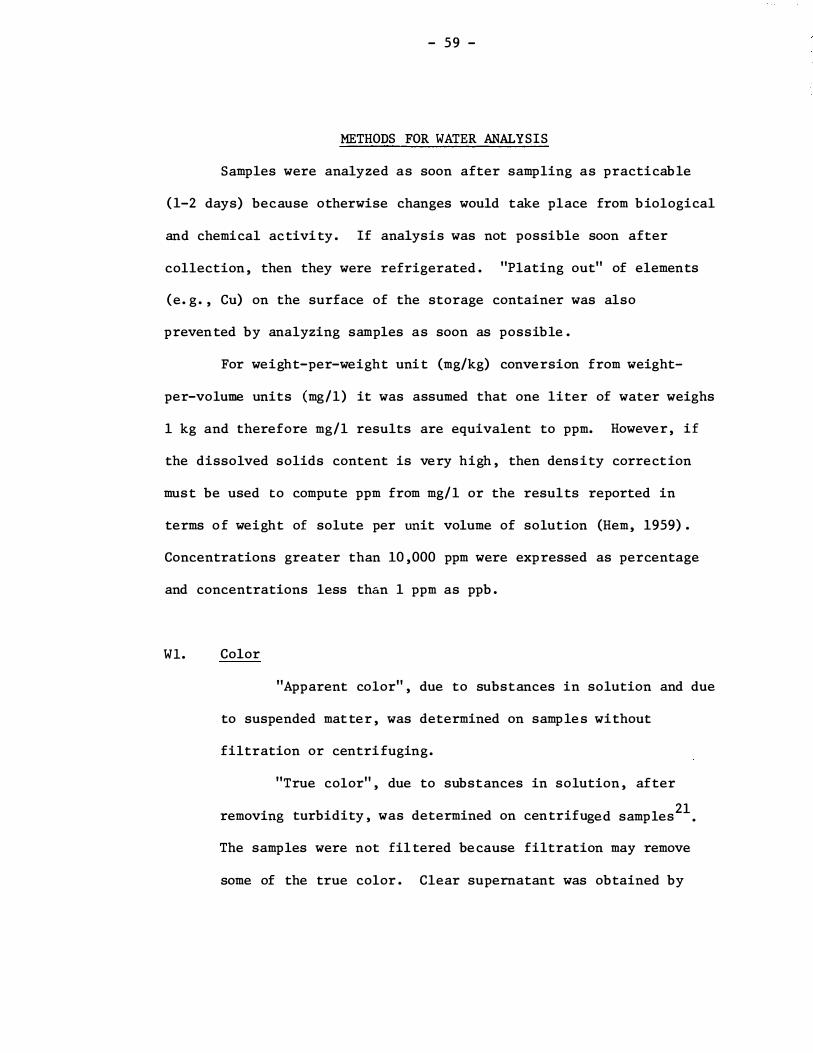
METHODS FOR WATER ANALYSIS
Samples were analyzed as soon after sampling as practicable
(1-2 days) because otherwise changes would take place from biological
and chemical activity . If analysis was not possible soon after
collection , then they were refrigerated . "Plating out" of elements
(e. g . , Cu) on the surface of the storage container was also
prevented by analyzing samples as soon as possible .
For weight-per-weight unit (mg/kg) conversion from weight
per-volume units (mg/1) it was assumed that one liter of water weighs
1 kg and therefore mg/1 results are equivalent to ppm. However , if
the dissolved solids content is very high , then density correction
must be used to compute ppm from mg/1 or the results reported in
terms o f weight of solute per unit volume of solution (Hem, 1959) .
Concentrations greater than 10 ,000 ppm were expressed as percentage
and concentrations less than 1 ppm as ppb .
WI. Color
"Apparent color" , due to substances in solution and due
to suspended matter , was determined on samples without
filtration or centrifuging.
"True color" , due to substances in solution , after
removing turbidity , was determined on centrifuged samp1es21.
The samples were not fil tered because filtration may remove
some of the true color . Clear supernatant was obtained by

- 60 -
centrifuging for lS-60 min , depending on the nature of
turbidity , radius of the centrifuge , and the speed of the
motor. If centrifuging was not sufficient to remove all the
turbidity , then the method o f Lamar (1949) was used .
A SOO-unit stock solution (APHA, 1965) was prepared
by dis solving platinum (ic) potassium chloride (PtK2
C16
) and
crystalline cobaltous chloride ( CoC12 · 6H
20 ) in HCl and
diluting to the required volume . Standards were prepared
in 0-70 color unit range . The sample was compared agains t
these standards in Nessler tubes .
Since color value of water is extremely dependent on
the acidity of the sample , when reporting color, pH was also
reported .
W2 . Turbidity
Turbidity was determined on a vigorously shaken sample .
A visual comparison was made .
W3 . �
The pH , representing the instantaneous hydrogen ion
activity , was determined electrometrically with a glass
S electode . See Section SS .
w4 . Specific conductance
It was determined by the use ' of a conductivity bridge6
/

- 61 -
as given in Section S6 . The results were reported as probos/cm
at 250C .
W5 . Acidity
Acidity , expressing the total reserve or buffering
capacity of the samp le , was determined by 0 . 02 N NaOH titration
(APHA , 1965 ; Johns ton , 19 16) . Methyl orange acidity (pH 4 . 5) ,
phenolphthalein acidity (pH 8 . 3) and phenolphthalein acidity
at the boiling temperature (total acidity) were determined on
separate aliquots and expressed as ppm CaC03 • Free availab le
residual chlorine , which would otherwise affect the indicator
color response , was removed by adding a drop of 0 . 1 N sodium
thiosulfate solution before titration .
W6 . Alkalinity
Alkalinity , expressing the total reserve or the buffering
cap acity of the sample, was determined by titration of the
dissolved carbonate and bicarbonate in wate r , as given by
Dye (1958) and Thomas and Lynch (1960) . First co; was
determined by titrating with 0 . 02 N H2
S04
to the bicarbonate
equivalence point (pH 8 . 3) using phenolphthalein indicator
U% in 60% ethanol) . Then HCO; (natural and from CO;) was
titrated to the carbonic acid equivalence point (pH 4 . 5)
using methyl orange (0 . 1% in water) . I f hydroxide alkalinity
- 62 -
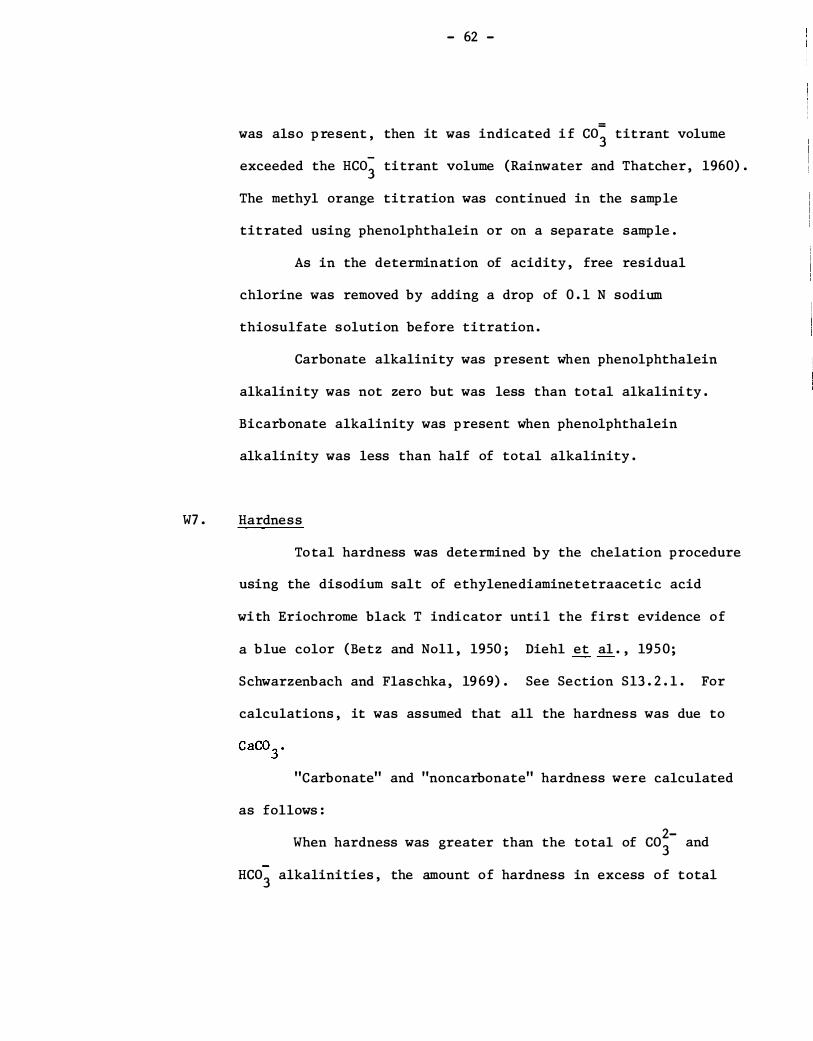
=
was also p resent , then it was indicated i f C03
titrant volume
exceeded the HCO; titrant volume (Rainwater and Thatcher , 1960) .
The methyl orange titration was continued in the sample
titrated using phenolphthalein or on a separate sample .
As in the determination of acidity , free residual
chlorine was removed by adding a drop of 0 . 1 N sodium
thiosulfate solution before titration .
Carbonate alkalinity was present when phenolphthalein
alkalinity was not zero but was less than total alkalinity .
Bicarbonate alkalinity was present when phenolphthalein
alkalinity was less than half of total alkalinity .
W7 • Hardness
Total hardness was determined by the chelation procedure
using the disodium salt of ethylenediaminetetraacetic acid
with Eriochrome black T indicator until the first evidence of
a blue color (Betz and Noll , 1950 ; Diehl et al . , 195 0 ;
Schwarzenbach and Flaschka , 19 69) . See Section S13 . 2 . l . For
calculations , it was assumed that all the hardness was due to
"Carbonate" and "noncarbonate" hardness were calculated
as follows :
2-When hardness was greater than the total of C0
3 and
HC03 alkalinities , the amount of hardness in excess of total

- 6 3 -
alkalinity was noncarbonate (permanent) hardness and the
remainder was carbonate (temporary) hardness .
ws . Residue (total dissolved solids and loss on ignition)
Resistant-glass bottles or polyethylene bottles were
used for storing samp les for residue determination .
The p rocedures given by APHA (196S) were used . For
residue determination , the sample was evaporated in a weighed
silica or porcelain dish on a s team bath and dried to a
constant weight in an oven4
maintained at 10So
C . For the
determination of fixed residue, samp1es from residue
determination were then ignited at SOOOC in a muffle furnace12 •
For filtrable residue , acid-washed , ash1ess , hard-finish
filter p apers were required . For nonfi1trab1e residue , the
filter paper was dried at 10So
C before filtering the sample .
The drying temperature was also reported with the results of
residues .
WS . 1 . Total residue
A total of filtrable and nonfi1trab1e residues
was obtained by evaporating the s amp le and drying4
at
10So
C .
WS . 2 . Filtrable residue
Determination of the dissolved matter or
filtrab le residue was done by evaporating the filtered
WB . 3 .
WB . 4 .
. . � . .
- 64 -
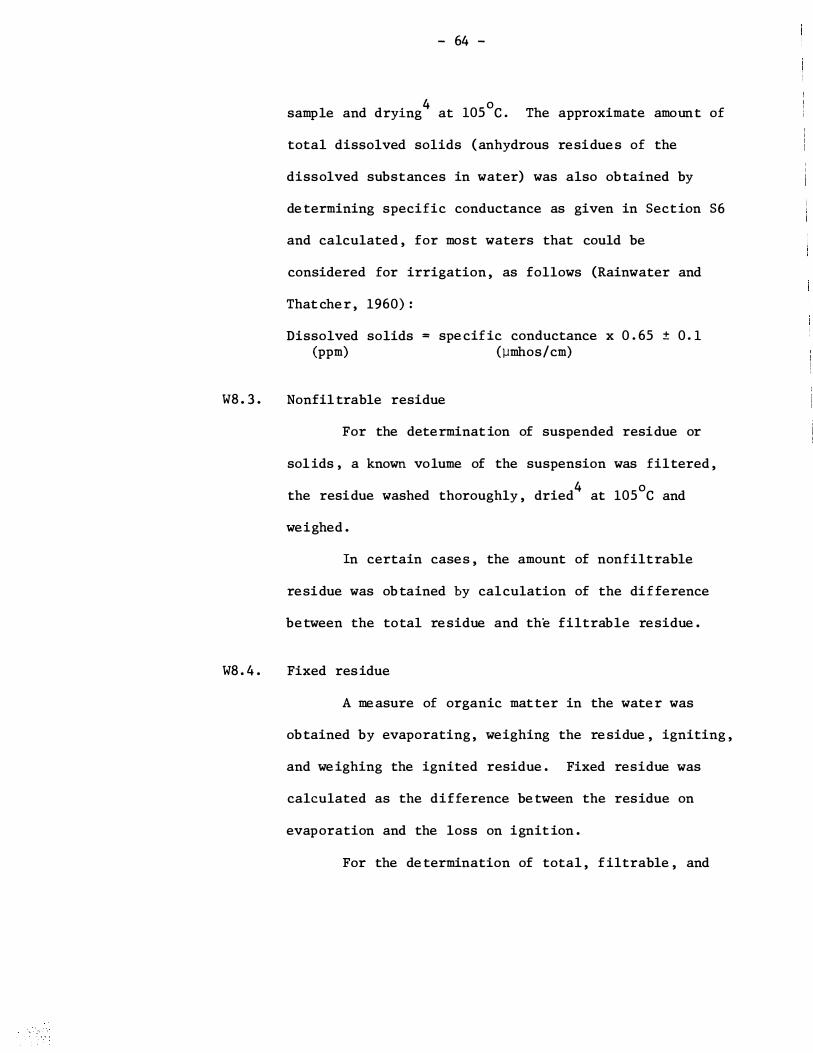
d d . 4
1050 sample an ry1ng at C . The approximate amount of
total dissolved solids (anhydrous residues of the
dissolved substances in water) was also obtained by
de termining specific conductance as given in Section S6
and calculated , for most waters that could be
considered for irrigation , as follows (Rainwater and
That cher , 1960) :
Dissolved solids (ppm)
= spe cific conductance x 0 . 65 ± 0 . 1 (�mhos/cm)
Nonfil trable residue
For the determination of suspended residue or
solids , a known volume of the suspension was filtered ,
the residue washed thoroughly , dried4
at 1050C and
weighed .
In certain cases , the amount of nonfiltrable
residue was ob tained by calculation of the difference
between the total residue and the filtrable residue .
Fixed residue
A measure of organic matter in the water was
obtained by evaporating , weighing the residue , igniting ,
and weighing the ignited residue . Fixed residue was
calculated as the difference be tween the residue on
evaporation and the loss on ignition .
For the de termination of total , filtrable , and

- 65 -
nonfi1trab 1e fixed residues , the residues from WB. 1 ,
WB. 2 , and WB . 3 , respectively were ignited12
for 1 hr
o at 550 C and weighed .
W9 . Nitrogen
If analysis o f fresh water sample for ammonia, nitrate ,
and organic nitrogen was not p ossible then the sample was
o stored at 4 C after adding O . B m1 conc. H
2S0
4 / 1 sample . This
acid preservation prevented the changes in the levels of
different forms of nitrogen that could have occurred due to
biological activity . The sample acidity was neutralized with
NaOH solution immediately before carrying out determinations
(APHA, 1965) .
W9 . 1 . Ammonia
Ammonia nitrogen , that includes nitrogen in the form of
NH3
and NH4
+, was determined by the co1or
7 produced by
the reaction of ammonium ions with mercuric potassium
iodide or Nessler reagent (Ko1thoff and Sandell , 1952) .
The absorption spectrum varied as the intensity of the
color varied with a change in the concentration of
ammonia. A wavelength range of 400 to 500 nm was used ,
depending on the concentration of ammonia and the
resulting color from the Nessler-ammonia reaction . At
low ammonia concentrations , a yellow color was produced

- 66 -
and wavelength from the region 400 to 425 nm was
selected . At high ammonia levels , a reddish brown
color was produced and the wavelength was selected
in the 450 to 500 nm range . See Section Sll . 2 . 2 .
Distillation from a strongly alkalized sample
in the Kj eldahl apparatus followed by titration was
used for waters containing substances such as Ca, Mg ,
Fe , and sulfide that interfere with the Nessler
reaction (Rainwater and Thatcher , 1960) .
W9 . 2 . Nitrate
W9 . 2 . l .
W9 . 2 . 2 .
Colorimetric method
The PDA colorimetric method
(Section Sll . 3) was used for waters
containing less than 30 ppm N03
or
less than 5000 ppm Cl (Rainwater and
Thatcher , 1960) . Nitrate was
determined colorimetrically7
with
nitrophenolsulfonic acid (Harper , 192 4 ;
Taras , 1950) after extracting nitrate
from the sample according to Jackson
(1958) .
Reduction method
This method was used for waters

W9 . 3 . Organic
- 6 7 -
containing more than 30 ppm N03
or more
than 5000 ppm C1 (Rainwater and Thatcher ,
1960) . Nitrate N was reduced by NH4
-N
using Devarda' s alloy (Cu 50 , A1 45 , Zn 5)
and a total of this NH3
and that already
in the water was determined by a Kje1dah1
procedure .
Organically bound nitrogen , contributed by such
biological components as amino acids , polypeptides , and
proteins , was determined by the macro-Kje1dah1 method
(Morgan et a1 . , 1 957) . See Section Sll . l .
The amount of "organic nitrogen" was ob tained by
sub tracting "ammonium-nitrogen" from the " total Kj e1dah1
nitrogen' i .
W10 . Orthophosphate
Only dissolved phosphates , phosphates in ortho form
(H2
PO� , HPO� , and PO�) , were determined . The "water soluble"
and "loosely bound" P in runoff waters was obtained in the
clear solution after flocculation of the soil with NaC1
solution (Jackson , 1958) . Then the P extractab le at pH 3
was determined by extracting with 0 .002 N H2
S04 buffered with
(NH4)2
S04
(Truog, 1930) . The P content was determined by the

- 68 -
phosphomo1ybdate method using SnC12
as the reducing agent
as given in Section S12 . 2 . 2 . 1 (Dickman and Bray , 1940 ;
Woods and Mellon , 1941) or an ascorbic acid reductant as
given in Section S12 . 2 . 2 . 2 (Murphy and Riley , 1962 ;
Watanabe and Olsen , 1965) . When the P concentration was
high , the phosphovanadomo1ybdate method (Barton , 1948 ;
Jackson , 195 8 ; Kitson and Mellon , 1944) , as given in
Section P8 , was used . The transmittance of the solution
after color development was determined in a photoelectric
1 . 7
co orl.meter •
W11 . Calcium and magnesium
These cations were determined by Na2
EDTA titration
(Katz and Navone , 1964) as given in Section S13 . 2 . 1 . They
were also determined by atomic absorption spectrophotometry
(David , 1960 ; Fishman , 1966) in a solution containing
1% La (w/v) used to inhib it chemical interferences due to
phosphate , AI , and Si (Platte and Marcy , 1965) . See Sections
S13 . 2 . 2 . 1 , S13 . 2 . 2 . 2 , and S13 . 2 . 2 . 3 . Care was taken to
redissolve any CaC03
that may have precipitated on s tanding
during storage (APHA, 1965) .
Wl2 . Potassium, sodium, and sodium-adsorption ratio
S amples for K and Na determinations were s tored in

- 69 -
polyethylene bottles .
Potassium and Na were determined (Fishman , 1965) on
filtered samples as given in Section S13 . 3 . Sodium-adsorption
ratio , which served as an index of the sodium hazard of
irrigation water , was calculated as given in Section S6 . 3 .
W13 . Iron , manganese , copper , and zinc
These metals were determined on filtered samples .
They were determined by atomic absorption spectroscopy
(S14 . 2 . 2 , S15 . 2 . 2 , S16 . 2 , and S17 . 2 , respectively) by
directly aspirating the aqueous solution into flame . For the
determination of Fe and Mn , S i interference was overcome by
the addition of Ca to give a final concentration of 50 ppm Ca
(Platte and Marcy , 1965) . A multi-element hollow cathode
lamp containing the Cu-Fe-Mn-Zn combination was set at 15 ma
for the analyses .
These metals , when present in low concentrations , were
comp1exed with a che1ating agent , the chelate extracted into
an organic solvent and the organic phase aspirated into the
flame (Perkin-Elmer Corp . , 1968) . Thus , they were determined
by atomic absorption spectrophotometry after extraction with
ammonium pyro11idine dithiocarbamate (APDC) -methy1 isobutyl
ketone (MIBK) (Allan , 1961b ; Brooks et a1 . , 1967a ,b ; Ma1issa
"
and Schoffmann , 1955 ; Mulford , 1966) .

- 70 -
W14 . Chloride
Chloride was determined by the Mohr method o f titrating
with standard AgN03 solution using K2
Cr04
as an indicator .
See Section S 6 . 2 . 3 . l . The s amples were titrated in the pH range
7-10 adjusted with H2
S04 or NaOH solution (APHA , 1965) .
W15 . Sulfate
Sulfate was determined by a turbidimetric method by
measuring the absorbance of a suspension containing BaS04
crystals of uniform size ; care being taken to form a
suspension having a reproducible optical absorbance (Rossum
and Villarruz , 1961) . See Section S6 . 2 . 4 .
W16 . Saturation and stability with respect to calcium carbonate
W16 . l . Langelier' s Saturation Index
It was calculated as follows (Langelier , 1936 ;
Larson and Buswell , 1942) :
Saturation Index = "pH actual" - "pH saturated"
where "pH actual" is the actual pH of a sample of
water and "pH saturated" is the calculated pH the
water sample must have, with no change in total
alkalinity and Ca content 3t the same temperature ,
when j ust saturated with CaC03
•
- 7 1 -
W16 . 2 . Ryznar ' s Stability Index
It was calculated as follows (Ryznar , 1944) :
Stability Index = 2 "pH saturated" - "pH actual" .
ACKNOWLEDGEMENTS
Gratitude is expressed to Dr . I . K. Edwards and Mr . M.W. Ali
for their numerous help ful suggestions during the preparation of the
report . The manuscript was critically reviewed by Dr . W . B . G. Denyer
and Mr . S . C . Zoltai and edited by Mr. R. J . Drake .

- 72 -
REFERENCES
1 . Allan , J . E . 1961a. The determination of copper by atomic
ab sorption spectrophotometry . Spectrochim. Acta
17 : 459-466 .
2 . Allan , J . E . 1961b . The use of organic solvents in atomic
absorption spectrophotometry . Spectrochim. Acta
17 : 46 7-4 7 3 .
3 . AOAC . 1960 . Official methods of analysis . W . Horwitz (ed . ) .
9 th ed . Assoc . Off. Agr . Chemists , Washington , D . C .
832 p .
4 . APHA. 1965 . Standard me thods for the examination of water and
wastewater . M. J . Taras , A . E . Greenberg , R. D . Hoak ,
and M. C . Rand (eds . ) . 12th ed . Am. Publ . Health
Asso c . , New York. 769 p .
5 . Atkinson , H . J . , G. R. Giles , A. J . MacLean , and J . R. Wright . 195 8 .
Chemical methods o f soil analysis . Contrib . No . 169
( rev. ) . Chern. Div. , S ci . Serv. , CDA, Ottawa , Ont .
9 0 p .
6 . Barton , C . J . 1948 . Photometric analysis o f phosphate rock .
Anal . Chern. 20 : 1068-1073 .
7 . Bates , R. G . 1964 . Dete rmination o f pH : theory and practice .
John Wiley , New York. 4 35 p .
8 . Bes t , R. J . 195 0 . A rapid and accurate electrotitrimetric method
for determining the chloride content of soils , water and

- 73 -
plant materials . Trans . 4th Intern . Congr . Soil
Sci . 3 : 162-164 .
9 . Betz , J . D . and C . A. Noll . 1950 . Total-hardness determination
by direct colorimetric titration. J . Am. Wat . Wks .
Assoc . 42 : 49-56 .
10 . Biedermann , W. and G . Schwarzenbach . 1948 . Die Komp1exometrische
Titration der Erda1katien und einiger andere Meta11e
mit Eriochromschwarz T . Chimia ( Switz . ) 2 : 56-5 8 .
11 . Bingham, F . T . 1949 . Soil test for phosphate . Calif . Agr .
3 : 11 , 14 .
12 . Black , C . A. , D . D . Evans , J . L . White , L . E . Ensminger , F . E . Clark ,
and R. C . Dinauer (eds . ) . 1965 . Methods of soil
analysis . Am. Soc . Agron . Monogr . No . 9 , Madison ,
Wis . 1572 p . (in 2 parts) .
13 . Boltz , D . F . (ed . ) . 1958 . Colorime tric determination of nonmetals .
Interscience , New York . 372 p .
14 . Bower , C . A . 1955 . Determination of exchangeable magnesium in
soils containing dolomite . Soil Sci . Soc . Am. Proc .
19 : 40-42 .
15 . Bower, C . A. , R. F . Reitemeier , and M. Fireman . 1952 . Exchangeab le
cation analysis of saline and alkali soils . Soil Sci .
73 : 251-261 .
16 . Bray , R . H . and L . T . Kurtz . 1945 . Determination of total , organic ,
and available forms o f phosphorus in soils . Soil S ci .
59 : 39-45 .

- 74 -
17 . Bray , R. H . and F . M. Willhite . 1929 . Determination of total
replaceable bases in soils . Ind . Eng. Chem. Anal .
Ed . 1 : 144 .
18 . Bremner, J . M. 1965 . Total nitrogen . p . 1149-1178 . In
C . A. Black et al . (eds . ) . Methods of soil analysis .
Am. Soc . Agron . Monogr . No . 9 , Madison , Wis .
19 . Brooks , R . R . , B . J . Presley , and I . R. Kaplan . 1967a . Determination
of copper in saline waters by atomic absorption
spectrophotometry combined with APDC-MIBK extraction .
Anal . Chim. Acta 38 : 321-326 .
20 . Brooks , R. R. , B . J . Presley , and I . R. Kaplan . 196 7b . APDC-MIBK
extraction system for the determination of trace
elements in saline waters by atomic-absorption
spectrophotometry . Talanta 14 : 809-816 .
21 . Buchanan , J . R. and T . T . Muraoka . 1964 . Determination of zinc
and manganese in tree leaves by atomic absorption
spectroscopy . At . Ab s . News l . 3 : 79-83 .
22 . Caldwell , D . H. and R. B . Adams . 1946 . Colorimetric determination
of iron in water with o-phenanthroline . J . Am. Wat .
Wks . Assoc . 38 : 727-730 .
2 3 . Chapman , H .D . 1965 . Cation-exchange capacity . p . 891-901 . In
C . A. Black et al . (eds . ) . Methods of soil analysis . Am.
Soc . Agron . Monogr . No . 9 , Madison , Wis .
24 . Chapman , H . D . and P . F . Pratt . 1961 . Methods of analysiS for soils ,
plants , and waters . Univ. of Cali f . , Div. Agr . Sci . ,
Berkeley , Calif . 309 p .

- 75 -
25 . Cheng , K. L . and R .H . Bray . 1951 . Determination of calcium and
magnesium in soil and plant material . Soil Sci .
72 : 449-458 .
26 . Cheng , K . L . and R. H . Bray . 1953 . Two specific methods for
determining copper in soil and in plant material .
Anal . Chern. 25 : 655-659 .
2 7 . Chesnin , L . and C . H . Yien . 195 1 . Turbidimetric determination of
available sulfates . Soil S ci . Soc . Am. Pro c . (1950)
15 : 149-151 .
28 . Coope r , M . D . 195 3 . Periodate method for manganese and e ffect o f
band width . Anal . Chern. 25 : 4 11-416 .
29 . Cope , W . C . 1916 . Kjeldahl modification for determination of
nitrogen in nitro substitution compounds . J . Ind . Eng .
Chern. 8 : 592-59 3 .
30 . Crooke , W . M. 1964 . The measurement of the cation-exchange
capacity of plant roots . Pl . Soil 2 1 : 43-49 .
31 . David , D . J . 1960 . The determination of exchangeable sodium ,
potassium , calcium and magnesium in soils by atomic-
absorption spectrophotometry . Analyst 85 : 495-503 .
32 . Day , P . R. 195 6 . Report of the committee on physical analyses ,
1954-1955 , Soil S cience Society of America . Soil S ci .
Soc . Am . Proc. 20 : 167-169 .
33 . Day , P . R. 1965 . Particle fractionation and particle-size analysis .
p . 545-567 . In C . A. Black et al . (eds . ) . Methods of

- 76 -
soil analysi s . Am. Soc . Agron Monogr . No . 9 ,
Madison , Wis .
34 . Day , R. J . and G . H . Dixon . 1965 . Modified Rukuhia soil grinder .
Fores t Research Branch , Can . Dep t . o f For . , Calgary ,
Alta. 65-A-4 . 5 p .
35 . Dean , J . A . 1960 . Flame photometry . McGraw-Hill , New York .
354 p .
36 . Dickman , S . R. and R. H . Bray . 1940 . Colorimetric determination of
phosphate . Ind . Eng. Chem. Anal . Ed . 12 : 665-668 .
37 . Diehl , H . , C . A. Goetz , and C . C . Hach . 1950 . The versenate
titration for total hardness . J . Am . Wat . Wks . Assoc.
42 : 40-48 .
38 . Doughty , J . L . 1941 . The advantages of a soil paste for routine
pH determination . S ci . Agri c . 22 : 135-138 .
39 . Dye , J . F . 1958 . Correlation of the two principal methods of
calculating the three kinds of alkalinity. J . Am. Wat .
Wks . Assoc. 50 : 800-820 .
40 . Farnham, R. S . and H. R. Finney . 1965 . Classification and
properties of organic soils . Advan . Agron . 17 : 115-162 .
4 1 . Fischer , R. B . 1962 . A b asic course in the theory and practice of
quantitative chemical analysis . 2nd ed . W. B . Saunders ,
Philadelphia , Pa . 501 p .
42 . Fishman , M. J . 1965 . Atomic-absorption methods for analysis of
natural waters . Paper presented to the 4th National

- 77 -
Meeting of the Society for Applied Spectroscopy ,
Denver , Colo . , Aug . 30 - Sep t . 3 .
43 . Fishman , M. J . 1966 . The use of atomic absorption for analysis of
natural waters . At . Abs . News1 . 5 : 102-106 .
44 . Fortune , W. B . and M . G . Mellon . 1938 . Determination of iron with
o-phenanthro1ine : A spectrophotometric s tudy . Ind .
Eng . Chem. Anal . Ed . 10 : 60-64 .
45 . Grewe1ing, T . and M. Peech . 1965 . Chemical soil tes ts .
Cornell Univ. N . Y . Agr . Exp . Sta. Bull . 960 (rev. ) .
47 p .
46 . Hanna , W . J . 1964 . Methods for chemical analysis o f soils .
p . 474-502 . In F . E . Bear (ed . ) . Chemistry of the Soil .
2nd ed . Reinhold , New York .
47 . Harper , H . J . 1924. The accurate determination of nitrates in
soils . Ind. Eng . Chem. 16 : 180-183 .
48 . Hem, J . D . 1959 . Study and interpretation of the chemical
characteristics of natural water . u . S . Geo . Survey
Water-Supply Paper 147 3 , Washington , D . C . 2 69 p .
49 . Hills , G . A. 1957 . Field methods for investigating site . Ont o
Dep t . of Lands and Forests . S ite Res . Manua1 4 (rev . ) ,
Toronto , Ont . 119 p .
5 0 . Jackson , M. L . 1956 . Soil chemical analysis - advanced course .
Pub . by the Author . Dept . of Soils , Univ. o f Wis . ,
Madison , Wis . 991 p .

- 78 -
5 1 . Jackson , M. L . 1958 . Soil chemical analysis . Prentice-Hall ,
Englewood Cliffs , N . J . 498 p .
5 2 . Johns ton , J . 1916 . The determination of carbonic acid, combined
and free in solution , particularly in natural waters .
J . Am. Chem. Soc . 38 : 94 7-975 .
53 . Kaila , A . 195 6 . Determination of the degree of humification
in peat samples . Maatalous t . Aikakausk . (J . Sci .
Agr . So c . Finland) 28 : 18-35 .
54 . Kalra , Y . P . and M .W . Ali . 197 0 . Operation of the Service
Laboratory at the Mani toba-Saskatchewan Region .
Can . For . Serv . , Dept . Fisher . and For . , Int . Rept .
A-39 . 5 2 p .
55 . Katz , H . and R. Navone . 1964 . Method for simultaneous
determination of calcium and magnesium . J . Am. Wat .
Wks . Assoc . 56 : 121-12 3 .
56 . Kirk , P . L . 1950 . Kjeldahl method for total nitrogen . Anal .
Chem. 22 : 354-358 .
57 . Kitson , R. E . and M. G . Mellon . 1944 . Colorimetric determination
of phosphorus as mo1ybdivanado-phosphoric acid . Ind . Eng .
Chem. Anal . Ed . 16 : 379-383 .
58 . Ko1thoff , I .M. and E . B . Sandell . 1952 . Textbook of quantitative
inorganic analysis . 3rd ed . MacMillan , New York .
759 p .
59 . Lamar , W . L . 1949 . Determination o f color of turbid waters .

- 79 -
Anal . Chem. 21 : 726-727 .
60 . Langelier , W. F . 1936 . The analytical control of anti-corrosion
water treatment . J . Am. Wat . Wks . Assoc.
2 8 : 1500-1521 .
61 . Larson , T . E . and A. M. Buswell . 194 2 . Calcium carbonate
saturation index and alkalinity interpretations .
J . Am. Wat . Wks . Assoc . 34 : 1667-1684 .
62 . Leaf , A. L . 1958 . Determination of available potassium in
soils of fores t plantations . Soil S ci . Soc. Am. Pro c .
22 : 458-459 .
63 . MacLean , A . J . , R .L . Halstead , A . R. Mack , and J . J . Jasmin . 1964 .
Comparison of procedures for es timating exchange
properties and availability of phosphorus and potassium
in some eastern Canadian organic soils . Can . J . Soil
Sci . 44 : 66-75 .
64 . Magis tad , D . C . , R. F . Reitemeier , and L . V. Wilcox. 1945 .
Determination of soluble salts in soils . Soil Sci .
59 : 65-75 .
65 . Malissa, H . and E . Sch�ffmann . "
1955 . Uber die verwendung von
substituierten Dithiocarbamaten in der Mikroanalyse .
III . Mikrochimica Acta (Wien) 1 : 187-202 .
66 . McBride , C . H . 1964 . Determination o f minor nutrients in
fertilizers by atomic absorption spectrophotometry .
At . Ab s . Newsl . 3 : 144-159 .

- 80 -
6 7 . McKeague , J . A. and J . H . Day . 1966 . Dithionite- and oxa1ate-
extractable Fe and A1 as aids in differentiating
various classes of soils . Can . J . Soil Sci .
46 : 13-22 .
68. Meh1ich , A. 1945 . Effect of type of soil colloid on cation-
absorption capacity and on exchangeable hydrogen and
calcium as measured by different methods . Soil Sci .
60 :289-304 .
69 . Meh1ig, J . P . 1939 . Colorimetric determination of manganese
with periodate - a spectrophotometric study. Ind . Eng .
Chem. Anal . Ed . 11 : 2 74-2 7 7 .
70 . Mehra , o . P . and M. L . Jackson . 1960 . Iron oxide removal from ,
soils and clays by dithionite-citrate system buffered
with sodium bicarbonate . In Clays and Clay Minerals ,
Proc . 7th Conf. 5 : 317-327 . Nat 1 . Acad . Sci . Nat1 . Res .
Council Publ .
7 1 . Merkle , F . G . and E . C . Dunkle . 1944 . Soluble salt content of
greenhouse soils as a diagnos tic aid . J . Am. Soc .
Agron . 36 : 10-19 .
72 . Metson , A. J . 195 6 . Methods o f chemical analysis for soil
survey samples . New Zealand D . S . I . R. Soil Bureau ,
Bull . 12 . 208 p .
73 . MOrgan , G . B . , J . B . Lackey , and F . W. Gi1creas . 195 7 .
Quantitative determination of organic nitrogen in
water , sewage , and industrial waters . Anal. Chem.
29 : 833-835 .

- 81 -
7 4 . Mulford , C . E . 1966 . Solvent extraction techniques for atomic
75 . Munsell
76 . Murphy ,
absorption spectroscopy . At . Abs . Newsl . 5 : 88-90 .
Color Co . 1950 . Munsell soil color charts , special form
J .
for use by soil s cien tis ts , geologists and
archaeologists . Baltimore , Md . Loose Leaf . n . p .
and J . P . Riley . 1962 . A modified single solution
method for the determination of phosphate in natural
waters . Anal . Chim. Acta 27 : 31-36 .
77 . National Soil Survey Committee of Canada . 1965 . Report on the
sixth meeting . Held at Laval Univ . , Quebec , P . Q .
Oct . 18-22 . 132 p .
7 8 . National Soil Survey Committee o f Canada. 1968 . Proceedings of
the seventh meeting . Held at Univ . of Alberta ,
Edmonton , Alta. Apr . 22-26 . 216 p .
79 . Nelson , J . L . , L . C . Boawn , and F . G . Viets , Jr . 1959 . A method
for assessing zinc status of soils using acid
extractab le zinc and "titratable alkalinity" values .
Soil S ci . 88 : 275-2 83 .
80 . Nichols , M. L . and C . O . Willits . 1934 . Reactions o f Nessler ' s
solution . J . Am. Chern. Soc . 56 : 769-774 .
81 . Olsen , S . R. , C . V . Cole , F . S . Watanabe , and L . A. Dean . 195 4 .
Es timation of available phosphorus in soils by
extraction with sodium bicarbonate . USDA Circ . 9 39 ,
Washington , D . C . 19 p .

- 82 -
82 . Parker , F . W. 1929 . The de termination of exchangeable
hydrogen in soils . J . Am. Soc . Agron . 21 : 1030-1039 .
83 . Patton , J . and W. Reeder . 1956 . New indicator for titration
of calcium with (e thylene-dinitrilo) tetraacetate .
Anal . Chem. 28 : 1026-1028 .
84 . Pawluk , S . 1967 . Soil analyses by atomic absorption
spectrophotometry . At . Abs . Newsl . 6 : 53-5 6 .
85 . Pee ch , M . 1965 . Exchange acidity . p . 905-913 . In
C . A. Black et al . (eds . ) . Methods of soil analysis .
Am. Soc . Agron . Monogr . No . 9 , Madison , Wis .
86 . Peech , M. , L . T . Alexander , L . A. Dean , and J . F . Reed . 1947 .
Methods o f soil analysis for soil-fertility
investigations . USDA circ . 757 , Washington , D . C .
25 p .
8 7 . Perkin-Elme r Corp . 1968 . Analytical methods for atomic
abs orption spectrophotometry . Perkin-Elmer Corp . ,
Norwalk , Conn . Loose Leaf . n . p .
88 . Piper , C . S . 194 7 . Soil and plant analysis . Interscience ,
New York . 368 p .
89 . Platte , J . A. and V. M. Marcy . 1965 . Atomic absorption
spectrophotometry as a tool for the water chemist .
At . Ab s . Newsl . 4 : 289-292 .
9 0 . Pratt , P . F . 1965 . Potassium. p . 1023-1030 . In C .A . Black
et al . (eds . ) . Methods of soil analysis . Am. Soc .

- 83 -
Agron . Monogr . No . 9 , Madison , Wis .
9 1 . Prince , A.L . 1945 . Determination of total ni trogen , ammonia,
nitrates , and nitrites in soils . Soil S ci .
59 : 47-52 .
92 . Puri , A.N . and A. G . Asghar . 1938 . Influence of salts and
soil-water ratio on pH value of soils . Soil Sci .
46 : 249-257 .
9 3 . Rainwater , F . H . and L . L . Thatcher . 1960 . Methods for collection
and analysis of water sample s . u . S . Geo . Survey
Water-Supply Paper 1454 , Washington , D . C . 301 p .
94 . Ram1rez-Munoz , J . 196 8 . Atomic-absorption spectroscopy and
analysis by atomic-absorption flame photometry .
Elsevier, Amsterdam. 493 p .
95 . Reed , J . F . and R. W. Cummings . 1945 . Soil reaction--glass
electrode and colorimetric methods for determining
pH values of soils . Soil S ci . 59 : 9 7-104 .
9 6 . Reitemeier , R. F . 1943 . Semimicroana1ysis of saline soil
solutions . Ind. Eng. Chem. Anal . Ed . 15 : 393-402 .
97 . Rich , C . l . 1965 . Elemental analysis by flame photometry .
p . 849-865 . In C . A. Black et a1. (eds . ) . Methods
of soil analysis . Am. Soc . Agron . Monogr . No . 9 ,
Madison , Wis .
9 8 . Richards , L . A. 1947 . Pressure-membrane apparatus--construction
and use . Agr . Eng . 2 8 : 451-454 , 460 .

- 84 -
99 . Richards , L . A. 1949 . Methods for mounting porous plates
used in soil moisture measurement s . Agron . J .
41 : 4 89-490 .
100 . Richards , L . A. 1965 . Physical condition o f water in soil .
p . 128-l52 . In C . A. Black et al . (eds . ) . Methods
of soil analysis . Am . Soc . Agron . Monogr . No . 9 ,
Madison , Wis .
101 . Richards , L . A. and L . R. Weaver . 194 4 . Mois zure retention by
some irrigated soils as related to soil-moisture
tension . J . Agr . Res . 69 : 215-235 .
102 . Rossum, J . R. and P . A. Villarruz . 1961 . Suggested method for
turbidimetric determination of sulfate in water .
J . Am . Wat . Wks . Assoc. 5 3 : 873-876 .
103 . Rouse , R. D . and B . R. Bertramson . 195 0 . Potassium availability
in several Indiana soils : its nature and methods of
evaluation . Soil Sci . Soc . Am. Proc . (1949 )
14 : 113-12 3 .
104 . Ryznar , J . W. 1944 . A new index for determining amount of
calcium carbonate scale formed by a water . J. Am.
Wat . WkS . Assoc. 36 : 472-486 .
105 . Sandell , E . B . 1959 . Colorimetric determination o f traces of
me tals . 3rd ed . Interscience , New York . 1032 p .
106 . Scales , F . M. and A . P . Harrison . 1920 . Boric acid modification of
the Kjeldahl method for crop and soil analysis . J . Ind .

- 85 -
Eng . Chem. 12 : 350-352 .
107 . Schnitzer , M. and J . G . Desj ardins . 1965 . Carboxyl and phenolic
hydroxyl groups in some organic soils and their
relation to the degree of humification . Can . J . Soil
S ci . 45 : 257-264 .
108 . Schofield , R. K. and A .W . Taylor. 1955 . The measurement of soil
pH . Soil S ci . Soc. Am. Proc . 19 : 164-167 .
109 . Schollenberger , C . J . and R .H . Simon . 1945 . Determination of
exchange capacity and exchangeable bases in soil-
ammonium acetate method . Soil Sci . 59 : 13-24 .
110 . Schwarzenbach , G . and H . Flaschka. 1969 . Complexometric
titrations . 2nd ed . Barnes & Noble , New York. 490 p .
111 . Shields , J . A. , E . A. Paul , R. J . St . Arnaud , and W. K. Head .
1968 . Spectrophotometric measurement of soil color
and i ts relationship to moisture and organic matter .
Can . J . Soil S ci . 48 : 271-280 .
112 . Shuey , P . M. 194 7 . Loss of nitrate nitrogen caused by chlorides .
Ind . Eng. Chem. Anal . Ed . 19 : 882-883 .
113 . Skinner , S . I .M. , R. L . Hals tead , and J . E . Brydon . 1959 .
Quantitative manometric determination of calcite and
dolomite in soils and limestones . Can . J . Soil S ci .
39 : 197-204 .
114 . Slavin , W. 1968 . Atomic absorption spectroscopy . lnterscience ,
New York. 307 p .
115 . Taras , M. J . 1950 . Phenoldisulfonic acid method of determining
- 86 -
nitrate in water : photometric study. Anal . Chem.
22 : 1020-1022 .
116 . Taras , M. J . 1958 . Nitrogen . p . 75-160 . In D . F . Boltz (ed . ) .
Colorimetric determination of nonmetals . Interscience ,
New York .
117 . Thomas , J . F . J . and J . J . Lynch . 1960 . Determination of carbonate
alkalinity in natural waters . J . Am . Wat . Wks . Assoc .
52 : 259-268 .
118 . Truo g , E . 1930 . The determination of the readily available
phosphorus of soils . J . Am . Soc . Agron . 22 : 874-882 .
119 . Tucker , B . B . and L . T . Kurtz . 1961 . Calcium and magnesium
determinations by EDTA titrations . Soil Sci . Soc . Am.
Proc . 25 : 27-29 .
120 . USDA Soil Survey Staff . 195 1 . Soil Survey Manual . USDA Hdbk.
No . 18 , Washington , D . C . 503 p .
121 . US Salinity Laboratory Staff . 1954 . L . A . Richards (ed. ) .
Diagnosis and improvement of saline and alkali soils .
USDA Agr . Handb . 60 , Washington , D . C . 160 p .
122 . Ward , G .M . and F . B . Johns ton . 1962 . Chemical methods of
plant analysis . Publ . 1064 . Res . Bran . , CDA , Ottawa ,
Ont . 59 p .
123 . Watanabe , F . S . and S . R. Olsen . 1965 . Test o f an ascorbic acid
method for determining phosphorus in water and NaHC03
extracts from soil . Soil S ci . Soc . Am. Pro c .
29 : 6 7 7-678 .
- 87 -
124 . Wilde , S . A . and G . K. Voigt . 1959 . Analysis o f soils and
plants for foresters and horticulturists . 2nd rev .
e d . J . W . Edwards , Ann Arbor , Mich . 124 p .
125 . Willard , H . H . , L . L . Merritt , Jr. , and J . A . Dean . 1964 .
Ins trumental methods of analysis . 3rd ed . D . Van
Nos trand , Toronto , Ont o 626 p .
126 . Woods , J . T . and M. G . Mellon . 194 1 . The molybdenum blue reaction
-- a spectrophotometric study . Ind . Eng . Chem. Anal .
Ed . 13 : 760-764 .