methods of estimating apparent density of and
TRANSCRIPT

Reprinted from S o r ~ SCIENCE vol. 70. No. 5 . Nwember, In50
METHODS OF ESTIMATING APPARENT DENSITY OF DISCRETE SOIL GRAINS AND AGGREGATES1
W. S. CHEPIL
U. S. Department of Agriculture
In an ilttempt to estimate the relative erodibility of soils by wind, a need arose for a mcthod of determining the apparent density of the various fractions that are moved by the wind. A pcrusal of the available lit.erat,rrre failed to indicate any method that could bc used for (,his purpose. Sevcral methods have been rea- ommended for measuring the bulk density, or volunle weight, of the undisturbed soil bed (2, 3, 4, 7). Likewise, detailed information is available on how best to de~ermine the apparent dcnsity of discrctc soil clods or Iargc nggrcgatcs (5, (j).
None of the methods examined, ho\~ever, are applicable for determining thc ap- parent density of small particles such as those eroded by wind or by water. The sine of fraction eroded by wind is usually appreciably smaller than 2 mm. in diameter. The erodibility of these fractions is markedly affected by their apparent density. Four methods were, therefore, studied for estimating the apparent dcn- sity of small soil particles or aggregates. A description of these methods together with a discussion of the relative merits of each is included herein.
SAMPLING SOILS FOR ANALYSIS OF APl'ARENT DENSITY
To disturb the structure as little as possible, the soils to b ~ , tested in the labora- tory were taken from the field only when in a reasonahly dry condihn. A square- cornered spade was pushed under a soil layer of desired thickness. The soil was placed in a shallow tray and brought to thc laboratory for thorough air-drying. After drying, the soils were separated into various size-fractions by dry-sieving on a fiet, of rotary sieves.
PROCEDURE AND APPARATUS
The bulk density method
To messurc the apparent density of grains or discrete aggregates in each tioil fraction, a test tube of about 50-ml. capacity and an automatic tapping device were used (fig. 1). The test tube was approximately 6 inches h i ~ h . One end of a paper sleeve 2 inches long and with inside diameter equal to the outside diameter of the test tube was fitted around tho upper end of the test tube. Soil grains of a given diameter were poured in until the level of the bed was 0.5 to 1 inch above the top of the test tube. Thc test tube was then tapped on the tapping device until the weight of its contents, excluding the contents of the sleeve, was con- stant. The time required to reach the constant weight varied with the siae of the
' Contribution No. 420, department of agronomy, Kansas Agricultural Experiment Station, Msnhattnn, Kansas, and the Soil Conservat,ion Service, U. S . Department of Agriculture. Cooperative investigations in t l ~ e rnechnriics of wind erosion.
351

APPARENT DENSITY OF SOIL !?ARTICLES 353
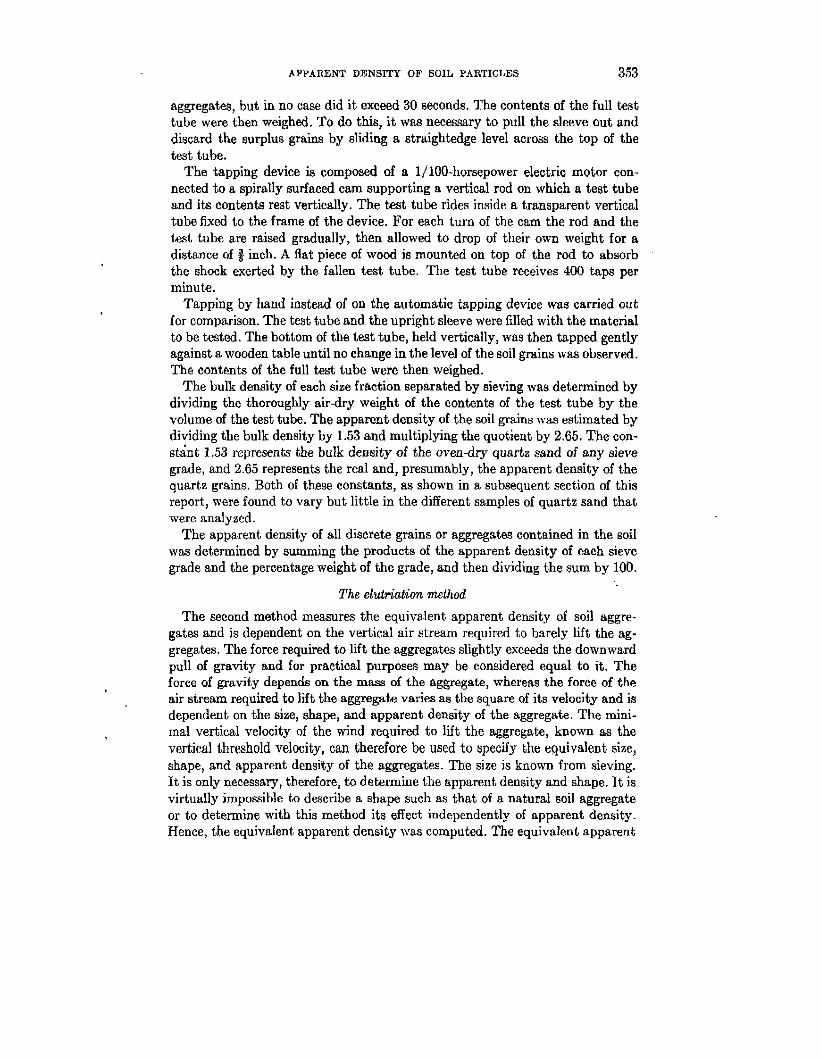
aggregates, but in no case did i t exceed 30 seconds. The contents of the full test tube were then weighed. To do this, i t was necessary to pull the sleeve out and discard the surplus grains by sliding a straightedge level across the top of the test tube.
The tapping device is composed of a 1/100-horsepower electric motor con- nected to a spirally surfaced cam supporting a vertical rod on which a test tube nnd its contents rest vertically. The test tube rides inside a transparent vertical tube fixed to the frame of the device. For each turn of the cam the rod and the test tube are raised gradually, then allowed to drop of their own weight for a distance of ) inch. A flat piece of wood is mounted on top of the rod to absorb the shock exerted by the fallen test tube. The test tube receives 400 taps per minute.
Tapping by hand instead of on the automatic tapping device was carried out for comparison. The test tube and the upright sleeve were filled with the material to he tested. The bottom of the test tube, held vertically, was then tapped gently against a wooden table until no change in the level of the soil grains was observed. The contents of the full test tube were then weighed.
The bulk density of each size fraction separated by sieving was determined by dividing the thoroughly airdry weight of the contents of the test tube by the volume of the test tube. The apparent density of the soil grains mas estimated by dividing the bulk density by 1.53 and multiplying the quotient by 2.65. The con- st int 1.53 represents the bulk density of the ovendry quarts sand of any sieve grade, and 2.65 represents the real and, presumably, the apparent density of the quartz grains. Both of these constants, as shown in a subsequent section of this report, were found to vary but little in the different samples of quartz sand that were analyzed.
The apparent density of all discrete grains or aggregates contained in the soil was determined by summing the products of the apparent density of each sieve grade and the percentage weight of the grade, and then dividing the sum by 100.
The elutriation method
The second method measures the equivalent apparent density of soil aggre- gates and is dependent on the vertical air stream required to barely lift the ag- gregates. The force required to lift the aggregates slightly exceeds the downward pull of gravity and for practical purposes may he considered equal to it. The force of gravity depends on the mass of the aggregate, whereas the force of the air stream required to lift the aggregate varies as the square of its velocity and is dependent on the size, shape, and apparent density of the aggregate. The mini- mal vertical velocity of the wind required to lit the aggregate, known as the vertical threshold velocity, can therefore be used to specify the equivalent size, shape, and apparent density of the aggregates. The sire is known from sieving. I t is only necessary, therefore, to determine the apparent density and shape. It is virtually impossible to describe a shape such as that of a natural soil aggregate or to determine with this method its effect independently of apparent density. Hence, the equivalent apparent density was computed. The equivalent apparent

density may be defined as the apparent density of an imaginary soil aggregate which has the same diameter as the actual soil aggregate but which has a shape similar to standard dune sand grains. Quartz sand and pebbles of uniform shape and density for grains ranging up to 6.4 mm. in diameter were used as a standard in measuring the equivalent apparent density of the soil aggregates.
Since the force required to lift the soil aggregate varies as the square of the vertical wind velocity, i t follows that the equivalent apparent density of the ag-
1
gregate lifted by wind is equal to (2) X 2.65, where V, is the average vertical
velocity of the air stream required to lift the soil aggregate and V 2 is the average vertical velocity of the air stream required to lift the quartz sand grain of 2.65 density and of the same size (sieve grade) as the soil aggregate. Slight differences between the shape of the soil aggregates and the sand grains were observed, and the effects of these differences, if any, presumably were reflected in the equivalent apparent density of the soil aggregates.
The apparatus used in this method consisted of a 3-inch diameter vertical duct connected to a blower run by an electric motor(fig. 2). Near the upper end of the duct various thicknesses of cloth filter, depending on the velocity of the wind re- quired, were used. A few inches above the cloth filters a 300-mesh sieve was in- serted, and on this sieve rested the grains of aggregates for which the lifting veloc- ity was to be determined. Further control of the wind was obtained by varying the cross-sectional area of an air inlet opening. The pressure exerted against the cloth filters when the blpwer was on ranged from 1 to 10 inches of water. The pressure exerted against the sieve was equivalent to 0.2 to 4.5 inches of water. A sufficient pressure head mas exerted against the sieve to produce a uniform veloc- ity throughout the whole cross-sectional area in the duet immediately above the sieve where the soil grains were.
The horizalal threshold velocity method
The third method is based on the horizontal air stream required to initiate the movement of soil aggregates placed in a level bed of uniform thickness. A hori- zontal duct 4 feet long and 4 inches square was connected to a blower as in method 2. Cloth filters of varying degrees of porosity were used on the windward end of the duct to facilitate the control of stream velocity and especially to produce a uniform velocity throughout the whole cross-sectional area of the duct immedi- ately to the lee of the filter. Further control of the air velocity was faeilitated by adjusting the air intake opening to the blower. Air velocity was measured a t a 2- inch height near the leeward end of the duct.
A velocity required to initiate the movement of the grains, known as the hori- zontal threshold velocity, 11~1.3 determined for beds of sand grains and of soil ag- gregates. For exposure to the wind, the soil or sand sample was placed in a shal- low, rectangular trough and the sample was smoothed with a straightedge level with the top of the trough. The equivalent apparent density of the soil aggregates, PI, was computed from the average threshold velocities in accordance with the
expression p, = (:y X 2.65. where "1 is the average threshold velocity of the

APPARENT DENSITY OB SOIL PARTICLES 355
soil aggregates and ut is the average threshold velocity of the quartz grains of 2.65 density. The average threshold velocity was determined by averaging the velocity required to move only the most erodiblegrains with theminimal velocity required to produce a continuous movement of all grains contained in the sample. The former velocity is known as the minimal threshold velocity, the latter m the maximal threshold velocity. The difference between the minimal and the maxi- mal threshold velocities for the small grains was virtually nil. The difference in- creased directly with the size of the grain, however, reaching a maximum of 5 miles per hour for quartz grains approaching 2 mm. in diameter.
TABLE I Real density d quarlr aaad and gravel as determined b y the standard pycnometer method
1.19-2.0 2.0-6.4 2.61
Average.. . . . . . . . . . . . . . . . . . . . . . . . 2.65 2.66 2.63
The individual grain weight method
At least 1,000 quartz sand grains and an equal number of soil grains or aggre- gates from each sieve grade were counted and weighed. The apparent density of the soil aggregates was then computed. The apparent density is equal to 2.65
3 where W, iis the weight of a number of soil grainsand W 2 is the weight of an Wz equal number of the same-sized quartz sand grains of 2.65 apparent density.
ANALYTICAL RESULTS
The erodibility of soil particles or aggregates is dependent on their mass. The mass of the aggregates is in turn dependent on their size, shape, and apparent density. The apparent density is dependent on the volume of the pores within the aggregates and on the real density of the soil material of which the aggregates are composed. Both the real density and the volume of the pores within the soil aggregates vary appreciably in diierent soils. The real density of quartz grains, on the other hand, varies little and is generally accepted as 2.65.
The real density of the quartz grains (table 1) was found to be about the same for all grain sizes, a t least up to 6.4 mm. in diameter, and varied little from the

356 W. 6. CHEPIL
generally accepted value of 2.65. The apparent density for the larger grains as determined by the method of Russell and Belcerek (5) likewise varied little from the average value of 2.65. The value of apparent density in six replicated deter- minations ranged from 2.57 to 2.68, giving an average value of 2.63, which was identical with the average value of the real density of these grains. The volume of the pores, a t least within larger grains of quartz sand and gravel, was evidently nil, or almost nil.
The bulk density of quartz sand was likewise found to be almost the same for any size of grain and was about the same in the different samples analyzed (table 2). This serves as further proof of the relative absence of pores within quartz grains. The bulk density of quartz sand of any sieve grade was about 1.53. The constancy of the bulk density of quartz sand seems to indicate that the shape
Hulk density o
'"7".
<0.1 0.1 -0.15 0.154.25 0.25-0.42 0.424.59 0.54-0.84 0.84-1.19 1.19-2.0 2.0 -6.4
Average. . . . . . . . . . . . . . . . . .
TABLE 2 7uartz sand and grouel ol uarious sieve aradea
Ottawa land
. I I - -
* Series A is based on a samole of sand
I I
:om ncsr Great Bend. B 1
1.53 - .. and - lls,
C from St. George, Kansas. Ottawa sand is based an two samples obtainable commercially, the A.S.T.M. standard graded sand and the A.S.T.M. 20- to 30-mesh standard sand.
of the grains and the volume of the interstices between the grains are constant for any uniform size of grains of which a bed is composed.
Because of these virtually constant physical characteristics, quartz sand and pebbles were taken as a convenient standard in determining indirectly the ap- parent densit.y of discrete soil grains or aggregates. In method 1 this was done by dividing the bulk density of a bed of soil aggregates by 1.53 and multiplying the quotient by 2.65. The constant 1.53 is the bulk density of quartz grains of any sieve grade, and 2.65 is the real and apparent density of the grains. In method 1 it was assumed that the volume of the interstices between the soil aggregates and between quartz grains of the same size was the same. The constancy in the bulk density of quartz sand and pebbles left no doubt that the volume of the inter- stices between quartz grains remained the same irrespective of the size of the

APPARENT DENSITY OF SOIL PARTICLES 357
grains of which the bed was composed. Whether the volume of the interstices be- tween the soil aggregates remained constant, as with quartz grains, could not be determined directly.
In methods 2 and 3 the equivalent apparent density of the soil aggregates was determined from the relative vertical and horizontal threshold air velocities re- quired to move quartz grains and to move soil aggregates. The shape of the ag- gregates on some soils differed somewhat from the shape of the quartz grains- the latter being less angular than the former. The variation in shape probably had
TABLE 3
Comparison of bulk density determined with the aulomatic lapping device and by the hand method
I B- llN81m
Silt loam
1.32 1.32 1.25 1.25 1.05 1.05 1.01 1.02 0.97 0.97 0.97 0.98 0.95 0.95 0.90 0.90
D U Y I ~ P OF G U ~ S
9,"".
some effect on the velocity of the air required to move the aggregates. This varia- tion would, therefore, be reflected in the value of the equivalent apparent density of the aggregates.
COMPARATIVE MERITS O F EACH METHOD
Quartz sand and uebblea
Tapwd on upping device
'Im I I 6 0 m
The automatic bpping device and tapping by hand in method 1 gave virtually the same values of bulk density of grain beds (table 3). About 30 seconds on the tapping device or 20 taps by hand against a wooden table were required to bring to a constant weight a given volume of the bed of any size of grain. No preceptible breakdown of soil aggregates was observed during the tapping process.
Tapped by hand
I O W I Z O k I Y e

358 W. B. CHEPIL
The apparent density of aggregates of three widely different soil classes is in- dicated in table 4 for method 1. The equivalent apparent density is shown in :.
TABLE 4 gregales determined from bull density'
I Apparent densily o j soii
WUv. 8Am *ND
Bulk density
u A p p a r e n t density of grain or aggregate is equal to - X 2.65, where o is the bulk
1.53 density of a bed of aggregates.
TABLE 5 Equiualent apparent density of soil aggregates
Equivalent V I a wrent &,w --
m.p.h.
0.36 0.98 1.41 1.72 2.74 1.77 4.44 1.57 6.82 1.75 8.60 1.64
12.14 1.96 13.70 1.46 21.19 1.55
Equivalent VI a parent
L i t y -- m.9.h.
0.47 1.43
Equivalent apparent density is equal to - X 2.65, where Vr i~ thevertical air vel- (3' ocity requiretl to l i f t the soil aggregate8 and V , is the vertical air velocity required to lift quarts sand grains of the same size as the soil aggregates.
table 5 for method 2, and in table 6 for method 3. Table 7 gives a summary of the results of methods 1, 2, and 3.
Method 4 was found quite unsatisfactory. Consequently, data obtained with this method are not presented. The counting of fine grains necessary for this
APPARENT DENSITY OF SOIL PARTICLES 359
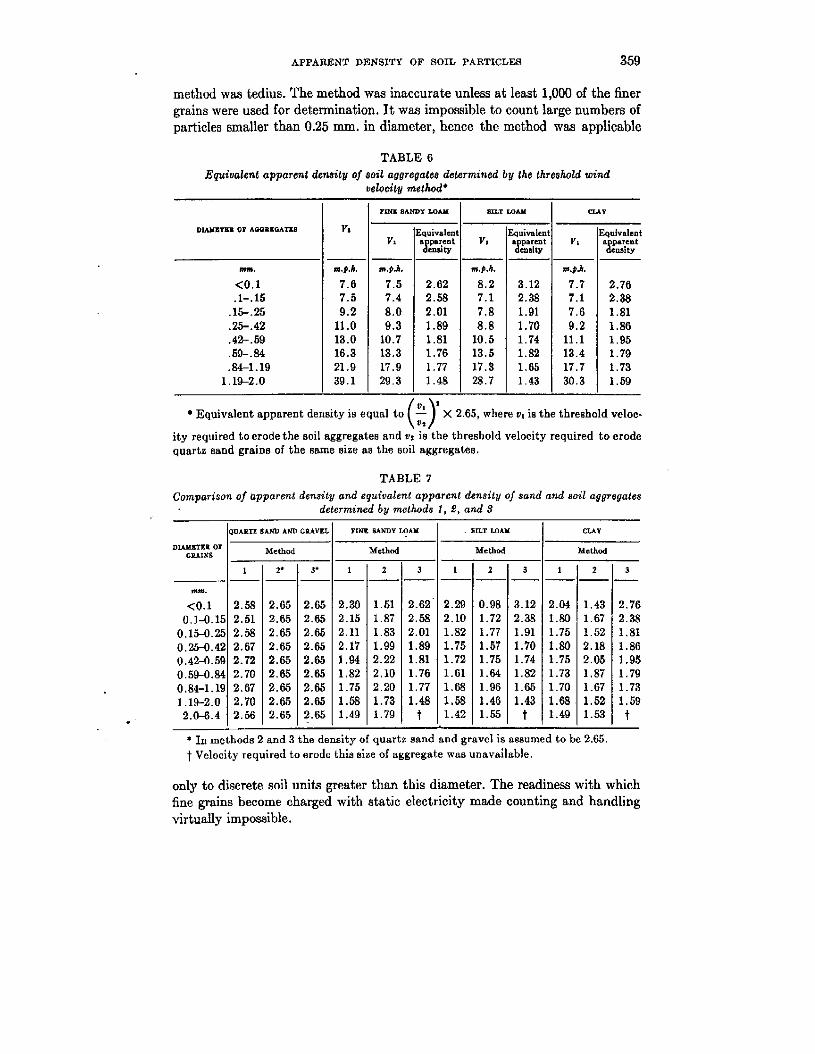
method was tedius. The method was inaccurate unless at least 1,000 of the finer grains were used for determination. It was impossible to count large numbers of particles smaller than 0.25 mm. in diameter, hence the method was applicable
TABLE 6 Epiualcnt apparent density of soil aggregates determined b y the threshold wind
velocity method'
I I
!) X 2.65, where v , is the thre~hold veloc-
s the threshold velocity required to erode rggregatea.
Equivalent apparent density is equal to
ity required toerode the soil aggregates and vz i quartz sand grains of the same sire as the soil r
TABLE 7
Comparison of apparent density nnd equivalent api delermined by molhoda
rent den8ily of sand and soil aggregates
d - * In methods 2 and 3 the density of quartz sand and grsvel is assumed to t Velocity required to erode this size of aggregate was unavailsble.
only to discrete soil units greater than this diameter. The readiness with which fine grains become charged with static electricity made counting and handling virtually impossible.
360 W. 8. CHEPIL
The values for the apparent density obtained by method 1 and for the equiva- lent apparent density obtained by methods 2 and 3 differed, on the whole, very little for various aggregate sizes above 0.1 mm. in diameter (table 7). Two pos- sible conclusions may be drawn as t~ why the agreement was good: first, that the differences, if any, between the shape of the aggregates and the shape of the standard quartz grains had no appreciable effect on the velocities of the air stream required to erode the aggregates; and second, that the effects of the differences in the shape of the aggregates were of the same magnitude and ran in the same direc- tion for all sizes of aggregates and all soils used. The latter condition, as a ease of coincidence, &pears to be rather unlikely.
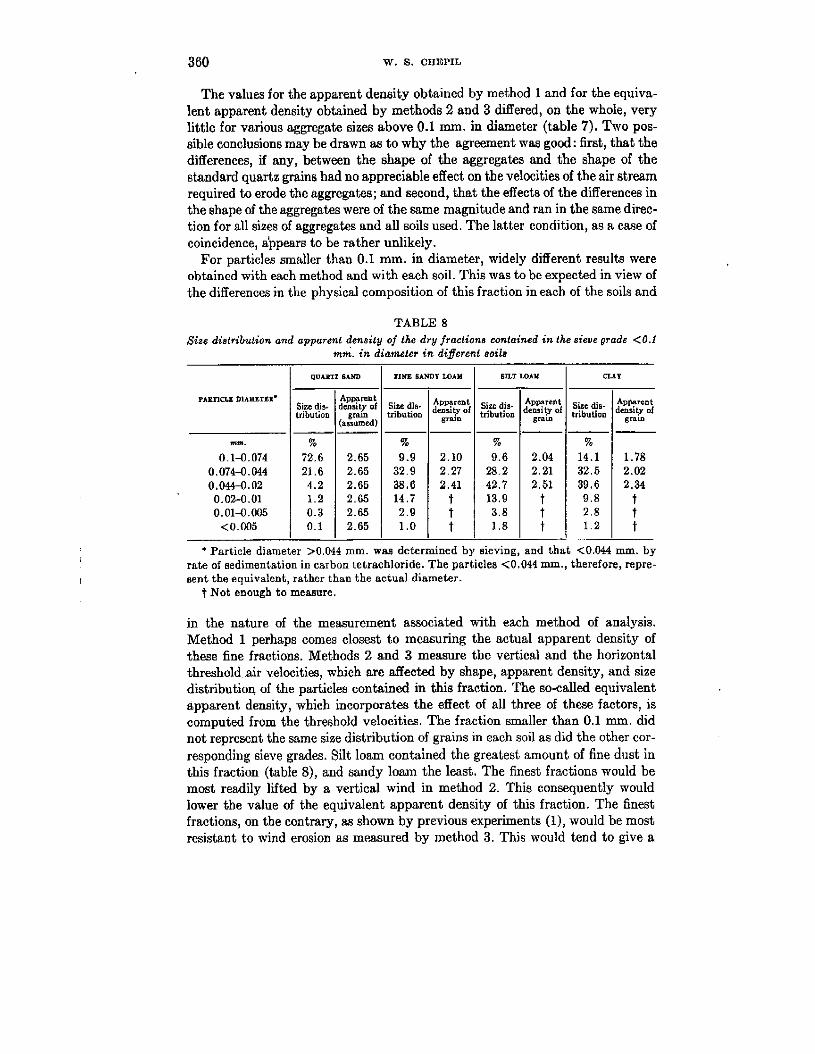
For particles smaller than 0.1 mm. in diameter, widely different results were obtained with each method and with each soil. This was to be expected in view of the differences in the physical composition of this fraction ineach of the soils and
TABLE 8 Size distribution and apparent denaity of the dry fracliana contained i n the sieve grade <0.1
m&. i n diameter i n different soils
Lpprcnt cnsily of Sire dis- grun tribution
l~umrd) -- %
2.65 9.9 2.65 32.9 2.65 38.6 2.65 14.7 2.65 2 .9 2.65 1.0
*Particle diameter >0.044 mm. was determined by sieving, and that <0.044 mm. by rate of sedimentation in carbon tetrachloride. The particles <0.044 mm., therefore, repre- sent the equivalent, rather than the aotual diameter.
t Not enough to memure.
in the nature of the measurement associated with each method of analysis. Method 1 perhaps comes closest to measuring the actual apparent density of these fine fractions. Methods 2 and 3 measure the vertical and the horizontal threshold air velocities, which are aflected by shape, apparent density, and size distributioq of the particles contained in this fraction. The so-called equivalent apparent density, which incorporates the effect of all three of these factors, is computed from the threshold velocities. The fraction smaller than 0.1 mm. did not represent the same sire distribution of grains in each soil as did the other cor- responding sieve grades. Silt loam contained the greatest amount of fine dust in this fraction (table 8), and sandy loam the least. The finest fractions would be most readily lifted by a vertical wind in method 2. This consequently would lower the value of the equivalent apparent density of this fraction. The h e s t fractions, on the contrary, as shown by previous experiments (I), would be most resistant to wind erosion as measured by method 3. This would tend to give a
APPARENT DENSITY OF SOIL PARTICLES 361
high value for the equivalent apparent density of this fraction. The results ac- tually did run in this fashion. Thus, the silt loam fraction containing the greatest amount of fine dust showed the lowest equivalent apparent density by method 2 and the highest by method 3. On the other hand, the sandy loam fraction which contained the least amount of fine dust showed the highest corresponding value by method 3. All of the values obtained by methods 2 and 3 for fraction ama11er than 0.1 mm. were either higher or lower than the corresponding apparent densi- ties determined by method 1. Method 1 was the only method which appeared to be reasonably applicable to the whole range of size of fractions. Methods 2 and 3 were only applicable to sieve grades greater than 0.1 mm. in diameter. It is be- lieved that all three methods would have given virtually the same values of equivalent apparent density had the size distribution in the finest sieve grade been the same in all cases compared.
Apart from the results with the smallest fractions, methods 1 and 3 agreed more closely than 1 and 2, or 2 and 3. Method 2 was apparently less accurate than the others, as judged by somewhat erratic values that were obtained. These ap- parent inaccuracies appear to be inherent in the method itself. A relatively large range of air velocity required to lift the lightest and the heaviest grains of any given fraction is mainly responsible for the inconsistency of the method. With method 3 no such wide range of velocity is encountered. For small grains of about 0.1 mm. in diameter in method 3 there is, in fact, but a single value of velocity that, corresponds to the minimal and the maximal threshold for these grains. For the largest and the heaviest grains, the difference between the minimal and the maximal threshold did not exceed 5 miles per hour on a 40-mile-per-hour wind. The threshold velocities vary more or less directly with the average size, density, and shape of all of the component particles. On the other hand, in method 2, the velocity required to lift a given particle is fixed, irrespective of the size, shape, or amount of other particles contained in the mixture.
In method 1 i t was assumed that the volume of the interstices between the soil aggregates or grains and between the standard quartz grains of the same sieve grade is the same. The values of apparent density obtained by methods 2 and 3 are not dependent on the variations in the volume of the interstices between the individual units. Yet the apparent density obtained by all three methods for aggregate sizes greater than 0.1 mm. came out virtually the same. These results prove that the assumption, a t least within the range of soils studied, is true.
.Each of t e three methods indicated that the apparent density and the equiva- lent appare kt- density dedreased with an increase in the size of the aggregates. This seems to indicate that the larger aggregates were more porous than the . ' smaller ones. All three methods also indicate that fine sandy loam had the highest apparent density of all its aggregates' above 0.1 mm., clay the intermediate, and silt loam the lowest.
CONCLUSIONS
Of the three methods of estimating the apparent density of soil grains or aggre- gates smaller than 6 ram. in diameter, method 1 appears to be the most desirable for the following reasons:

362 W. S. CHEPIL
1. Measurements can be made quickly and simply. 2. The values obtained by this method are very consistent and apparently accurate. 3. The method is not subject t o peraonal judgment or personal dilferences in handling
if the automatic tapping device is used. 4. It is the only method examined that appears to be applicable for measuriug the ap-
parent density of the aieve grade smaller than 0.1 mm. in diameter.
In connection with erodibility studies, method 3 might be preferable to the other methods because it estimates the equivalent apparent density from direct measurement of actual erodibility. Method 2, on the other hand, is not baaed on measurement of actual erodibility. To estimate the equivalent apparent density reasonably accurately by method 2 or 3, the size of grains in quartz sand and in the soil samples that are being compared must be the same. I n the sieve grade smaller than 0.1 mm. the size distribution was not the same in the samples ex- amined, and, consequently, the estimated value of the equivalent apparent den- sity was a t wide variance with the actualvalue.
SUMMARY
Three methods of estimating the apparent density of erodible soil fractions were developed and compared: I-the bulk density method; 2-the elutdation method; 3-the horizontal threshold velocity method.
Method 1 is the simplest and appears to be the only one of the three applicable to measuring the actual apparent density of any sire of fraction separated by sieving.
Methods 2 and 3'measure the equivalent apparent density of discrete soil units. For sieve grades above 0.1 mm. in diameter all three methods gave virtually the same values. It was thus indicated that the noticeable variation in the shape of the discrete soil units had little, if any, effect on the threshold air velocities and on the value of the equivalent apparent density obtained therefrom. Method 2 was least consistent.
For the sieve grade below 0.1 mm. in diameter the three methods gave widely variable results. This was to be expected because the size distribution of the par- ticles in this g r d e was not the same in all of the soils compared.
Method 4, based on weighing a definite number of quartz sand and soil grains, was tried and found impractical.
REFERENCES
(1) C ~ P I I . , W. 6. 1945 Dynamics of wind erosion: 11. Soil Sci. 60: 377411. (2) C O I ~ . T. S. 1936 Soil samplers. Soil Sci. 42: 129-142. (3) CURRY, A. S . 1931 A comparison of methods for determining the volume weight of
soils. Jour. Agr. Rea. 42: 765772. (4) LVTZ, J. F. 1947 Appratus for collecting undisturbed soil samples. Soil Sci. 64:
399401. (5) RUBBELL, E. W., AND BELCEREK, 17. 1944 The determination of the volume and air
space of soil clods. Jour. Agr. Sci. 34: 123-132. (6) SIDERI, D. I. 1936 Determination of volume weight af soils. Trans. Inlernall. Sot.
Soil Sci. 5 : 266273. (7) VEIHIEYER, F. J. 1929 An improved soil sampl~ng tube. Sod Sci. 27: 147.