articles techniques for estimating the size of low-density
TRANSCRIPT
Articles
Techniques for Estimating the Size of Low-DensityGopher Tortoise PopulationsJonathan M. Stober,* Rocio Prieto-Gonzalez, Lora L. Smith, Tiago A. Marques, Len Thomas
J.M. StoberJoseph W. Jones Ecological Research Center, 3988 Jones Center Drive, Newton, Georgia 39870
R. Prieto-GonzalezCentre for Research into Ecological and Environmental Modelling, University of St. Andrews, St. Andrews KY16 9LZ,United Kingdom
L.L. SmithJoseph W. Jones Ecological Research Center, 3988 Jones Center Drive, Newton, Georgia 39870
T.A. MarquesCentre for Research into Ecological and Environmental Modelling, University of St. Andrews, St. Andrews KY16 9LZ,United Kingdom; Centro de Estatıstica e Aplicacoes da Universidade de Lisboa, Portugal
L. ThomasCentre for Research into Ecological and Environmental Modelling, University of St. Andrews, St. Andrews KY16 9LZ,United Kingdom
Abstract
Gopher tortoises (Gopherus polyphemus) are candidates for range-wide listing as threatened under the U.S. EndangeredSpecies Act. Reliable population estimates are important to inform policy and management for recovery of the species.Line transect distance sampling has been adopted as the preferred method to estimate population size. However, whentortoise density is low, it can be challenging to obtain enough tortoise observations to reliably estimate the probability ofdetection, a vital component of the method. We suggest a modification to the method based on counting usabletortoise burrows (more abundant than tortoises) and separately accounting for the proportion of burrows occupied bytortoises. The increased sample size of burrows can outweigh the additional uncertainty induced by the need to accountfor the proportion of burrows occupied. We demonstrate the method using surveys conducted within a 13,118-haportion of the Gopher Tortoise Habitat Management Unit at Fort Gordon Army Installation, Georgia. We used asystematic random design to obtain more precise estimates, using a newly developed systematic variance estimator.Individual transects had a spatially efficient design (pseudocircuits), which greatly improved sampling efficiency on thislarge site. Estimated burrow density was 0.091 6 0.011 burrows/ha (CV ¼ 12.6%, 95% CI ¼ 0.071–0.116), with 25% ofburrows occupied by a tortoise (CV¼ 14.4%), yielding a tortoise density of 0.023 6 0.004 tortoise/ha (CV¼ 19.0%, 95% CI¼ 0.016–0.033) and a population estimate of 297 tortoises (95% CI¼ 210–433). These techniques are applicable to otherstudies and species. Surveying burrows or nests, rather than animals, can produce more reliable estimates when it leadsto a significantly larger sample of detections and when the occupancy status can reliably be ascertained. Systematic linetransect survey designs give better precision and are practical to implement and analyze.
Keywords: abundance; burrows; cluster size analysis; line transect distance sampling; gopher tortoise; populationdensity; systematic sampling
Received: January 18, 2017; Accepted: May 26, 2017; Published Online Early: June 2017; Published: December 2017
Citation: Stober JM, Prieto-Gonzalez R, Smith LL, Marques TA, Thomas L. 2017. Techniques for estimating the size oflow-density gopher tortoise populations. Journal of Fish and Wildlife Management 8(2):377–386; e1944-687X. doi:10.3996/012017-JFWM-005
Copyright: All material appearing in the Journal of Fish and Wildlife Management is in the public domain and may bereproduced or copied without permission unless specifically noted with the copyright symbol &. Citation of thesource, as given above, is requested.
Journal of Fish and Wildlife Management | www.fwspubs.org December 2017 | Volume 8 | Issue 2 | 377
The findings and conclusions in this article are those of the author(s) and do not necessarily represent the views of theU.S. Fish and Wildlife Service.
Present address: 45 Highway 281, Shoal Creek Ranger District, Talladega National Forest, Heflin, Alabama 36264
* Corresponding author: [email protected]
Introduction
Gopher tortoise (Gopherus polyphemus) populationestimates are an important metric for managers,researchers, and policy makers because the easternpopulation is a candidate species (the U.S. Fish andWildlife Service [USFWS] has determined that proposedlisting regulation is warranted but precluded by otherhigher-priority listing activities) for listing as threatenedunder the U.S. Endangered Species Act (U.S. EndangeredSpecies Act [ESA] 1973, as amended; USFWS 1987, 2011).Line transect distance sampling (LTDS; Buckland et al.2001, 2015) has become a standard technique toestimate gopher tortoise abundance as it has provento be an efficient method relative to plot-based total-count surveys, or burrow counts with unverified occu-pancy conversion factors (Nomani et al. 2008; Smith et al.2009; USFWS 2012). A key strength of distance samplingis that not all animals have to be detected; instead,observed distances to detections are used to fit adetection function, which describes how probability ofdetection declines with increasing distance from thetransect line. By accounting for imperfect detection,LTDS generates an unbiased estimate of abundance ifmodel assumptions are met. At least 60–80 observationsare recommended to model the detection functionreliably (Buckland et al. 2001). Gopher tortoises can occurin naturally low densities in suboptimal habitat (Brei-ninger et al. 1994; Castellon et al. 2012; Legleu 2012) ormay persist at low densities because of past exploitationfor food or inadequate habitat management (Hermannet al. 2002). Surveys of low-density populations requireconsiderable effort in terms of total transect length, andsmall sample size can reduce precision (Smith et al. 2009;Castellon et al. 2015). In these circumstances, there is aneed for new approaches for LTDS surveys. This isparticularly true for tortoise populations on large tractsof habitat because of the important role these may playin the overall recovery of the species, whereby thesepopulations may harbor genetic diversity or serve aspotential mitigation sites (Smith et al. 2009; Castellon etal. 2012).
Gopher tortoises spend the majority of their time inburrows below ground, complicating detection andrequiring use of cameras to scope burrows during LTDSsurveys (Smith 1995; Eubanks et al. 2003). The primarysearch objects during surveys are burrows, which usuallyharbor a single tortoise. Gopher tortoises maintainmultiple burrows within their home range, and only aportion of these are occupied by a tortoise. Occupiedand unoccupied burrows cannot be differentiated on thebasis of external appearance (Smith et al. 2005; Smith et
al 2006), so burrows are searched with a camera todetermine if a tortoise is present. In standard LTDSsurveys, tortoise observations (including any tortoises atthe surface) are used to calculate population estimates(Smith et al. 2009). Burrow cameras can provide areasonably accurate assessment of occupancy, althoughin some instances burrows are occluded by roots ordebris, make sharp turns, or are temporarily flooded,such that the occupancy cannot be determined withcertainty (Smith et al. 2005; Castellon et al. 2015).However, with appropriate equipment and trainedobservers, this source of error is generally small (,5%;e.g., Smith et al. 2009; Stober and Smith 2010).
One approach to increase tortoise detections is toincrease survey effort by sampling additional transects orrepeatedly sample the same transects (e.g., Buckland etal. 2001; Stober and Smith 2010). However, the effortrequired to obtain a sufficient sample size for low-densitytortoise populations on large tracts of habitat can beconsiderable (Smith et al. 2009). To increase detectionsduring gopher tortoise surveys, three observers are oftenused, with one observer on the center line and twoadditional observers searching from the center lineoutward (Buckland et al. 2001, Chapter 7; Stober andSmith 2010). This increases the effective strip width,yielding more detections than single observers, increas-ing sample size without increasing transect length.
Gopher tortoises are patchily distributed across thelandscape, so between-transect variation in encounterrate (numbers seen per unit line length) is responsible fora large component in the overall variance in populationabundance. Stratification is one solution to increaseprecision in such circumstances (Buckland et al. 2001;Thompson 2002), but stratification may not be possiblewhen patchiness occurs at small spatial scales. Anothersolution is to use a systematic random survey design(Buckland et al. 2001; Thompson 2002; Strindberg et al.2004). Standard variance estimators assume completelyrandom transect placement and therefore overestimatevariance when transects are located in a systematicmanner (Thompson 2002; Strindberg et al. 2004).However, a previously developed systematic varianceestimator (Fewster et al. 2009) aims to address this.
Here, we demonstrate a technique to increasesampling efficiency and provide more accurate popula-tion estimates by changing the focus of the analysis fromtortoises to the much more abundant tortoise burrows.We then adjust for the proportion of burrows occupiedusing the standard analytical software Distance (Thomaset al. 2010). Since burrows are indeed the primary searchobjects in tortoise surveys, with tortoise presence orabsence being confirmed with a burrow camera, no
Low-Density Gopher Tortoise Populations J.M. Stober et al.
Journal of Fish and Wildlife Management | www.fwspubs.org December 2017 | Volume 8 | Issue 2 | 378

change to field methods is required. Fitting the detectionfunction to all usable burrows rather than tortoisesmakes it much easier to reach adequate sample sizes,and has the potential to produce a more preciseestimate of detection probability. Estimating the pro-portion of burrows occupied introduces an additionalvariance component into the estimate of tortoisedensity. The same idea has been recently used in othertaxa where nest or burrows are easier to survey thananimals (Bonnet-Lebrun et al. 2016; Buxton et al. 2016;Rexer-Huber et al. 2016). We examined the trade-off inprecision using a real-world survey of a large, lowtortoise density site and tested the prediction that, ingeneral, modeling detectability of burrows rather thantortoises will produce more reliable results. In addition,we demonstrate use of the new systematic varianceestimator (Fewster et al. 2009). Finally, we introduce theconcept of sampling pseudocircuit transects to increasefield sampling efficiency in tortoise surveys. A tutorial isprovided for these methods online (Text S1) to aid inusing these methods.
Study siteThe study took place at Fort Gordon, a 22,500-ha U.S.
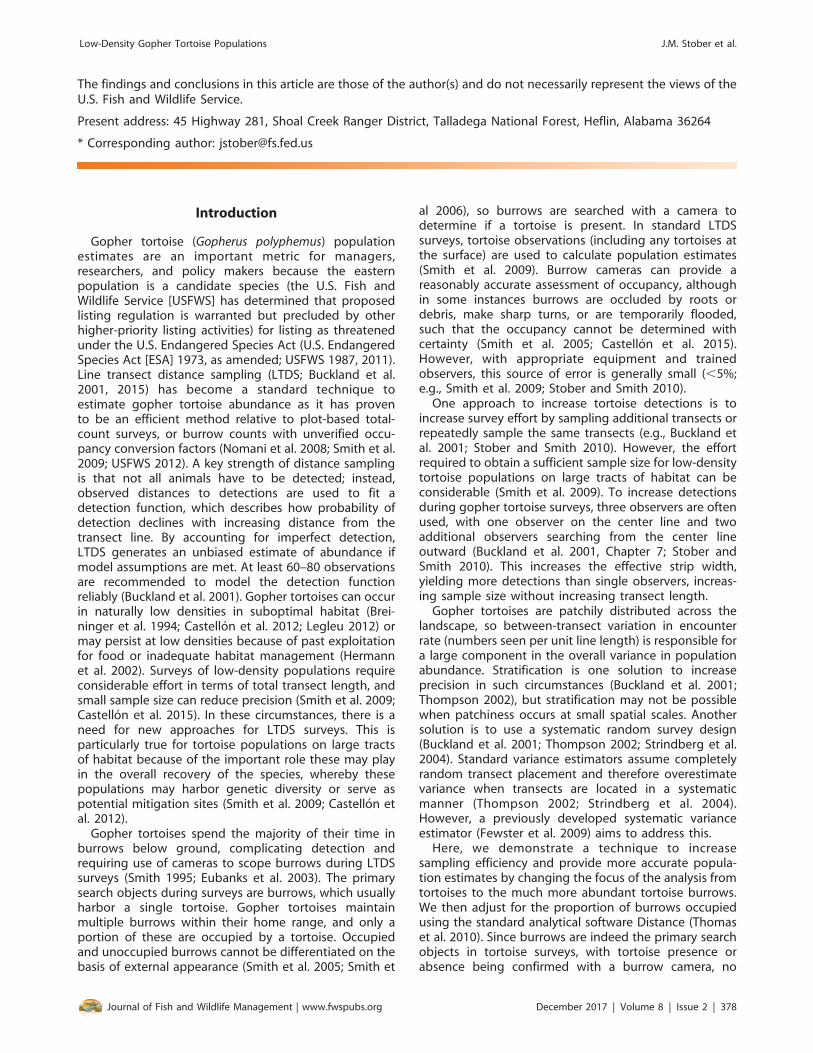
Army facility located at the transition between thePiedmont and the Upper Coastal Plain physiographiczones of Georgia, near the northern limit of the gophertortoise’s range. The region has deep sandy rolling ridgeson Troup, Lakeland, Lucy, Dothan, and Orangeburg soils.The vegetation is a mixture of off-site pine planted inabandoned agricultural fields and xeric upland sandhillscomposed of longleaf pine (Pinus palustris), turkey oak(Quercus laevis), bluejack oak (Quercus incana), and apyrophytic herbaceous understory. Activities at theinstallation include small arms training, and there is a5,260-ha artillery impact area where access is restricted.Natural resource management at Fort Gordon is focusedon timber management programs with frequent pre-scribed fire and restoration of longleaf pine (INRMPP FortGordon 2008). The Department of Defense requireddelineation of a habitat management unit for the gophertortoise and a population estimate for the habitatmanagement unit (INRMPP Fort Gordon 2008, Figure 1).
Methods
Survey design, pilot surveys, and data collectionThe 13,118-ha sample region was delineated with
geographic information system (GIS) data layers of thehabitat management unit, soil survey, and topographicmaps. Developed areas and impact areas were excludedfrom the survey. The Natural Resource Branch providedGIS data layers of past surveys of tortoise burrows, whichwere considered incomplete. Three pilot surveys wereimplemented, starting in December 2009, to determinetortoise encounter rate and estimate the amount ofsurvey effort required for generating a precise popula-tion estimate (i.e., reaching the recommended number ofobservations and with a desired level of precision;
Buckland et al. 2001, Chapter 7). All surveys wereconducted with a crew of three observers (Smith et al.2009; Stober and Smith 2010) and burrows .12 cm inwidth were searched for tortoises with a burrow camerascope (Sandpiper Technologies, Manteca, CA; 5-m cablelength with an additional 5-m extension).
In the first pilot survey (December 28, 2009–January 1,2010), transects were of variable length and orientationand were located arbitrarily in a range of suitablehabitats across the entire sample region. We surveyed18 transects from 300 to 2,100 m in length for a total of14.4 km of transect and detected three tortoises, yieldingan encounter rate of 0.2 tortoises/km (0.27 burrows/km),implying that it would be difficult to obtain an adequatesample size to produce a reliable population estimateusing tortoise observations. We then undertook a secondmore extensive pilot survey (January 4–15, 2010), with 59transects that were 300 to 1,000 m long and distributedsystematically across the sample region; total length 45km. This yielded four tortoises in 12 burrows (0.09tortoises/km; 0.27 burrows/km). On the basis of thisencounter rate, to achieve a coefficient of variation (CV)of 20%, the projected full survey effort (Buckland et al.2001, Chapter 7) was 842 km. The low numbers ofdetections in the first and second pilot surveys led us toquestion whether tortoises still occurred in areas wherethey had been documented in the past. Therefore, weconducted a third (January 18–22, 2010), ‘‘targeted’’ pilotsurvey, with 19 km of transects in areas where clusters ofburrows had been found in historic surveys. Weobserved 19 tortoises in 66 burrows (1.0 tortoise/km,3.47 burrows/km). Although the targeted pilot surveyyielded a much higher tortoise encounter rate than ourinitial pilot surveys, it was not representative of theencounter rate across the sample region, and burrowoccupancy was extremely low (0.29 tortoises/burrow).Because burrows were much more abundant thantortoises, we elected to model the detection functionof burrows. This increased the sample size, and wasexpected to provide more reliable abundance estimates.Last, because burrow encounter rates were vastlydifferent in the first and third pilot surveys (0.27 and3.47 burrows/km, respectively), indicating a patchyburrow distribution, we used a systematic design. Asystematic design provided even coverage of the studyarea to capture the spatial heterogeneity of burrows,which we expected would improve precision for theencounter rate over that of a random design (Bucklandet al. 2001).
We placed systematic east–west-oriented transectsacross the sample region using Hawth’s tools (Beyer2004, version 3.26) and Xtools Pro (Data East 2008,version 9.1) in ArcGIS (ESRI 2008, version 9.3.1). Eachtransect consisted of a pair of parallel 500-m segmentsthat were 50 m apart, creating a ‘‘pseudocircuit’’ design.Circuits are a recommended design, allowing observersto end up where they started, increasing efficiency(Buckland et al. 2001, Chapter 7); the 50-m spacing
Low-Density Gopher Tortoise Populations J.M. Stober et al.
Journal of Fish and Wildlife Management | www.fwspubs.org December 2017 | Volume 8 | Issue 2 | 379
minimized the possibility that objects detected on onesegment would be detected on the other. We use theterm pseudocircuit because the 50-m lines between theend of one segment and the beginning of the next werenot surveyed. Transects were separated by 500 m east towest and 300 m north to south (Figure 1), creating anoffset grid that was randomly placed across the sampleregion to provide a systematic coverage of the entirearea. One portion of the sample region (7,210 ha) wassurveyed from January to March 2010 by Jones Centerstaff and the remaining 5,908 ha of habitat weresurveyed from March to September 2011 by Fort GordonNatural Resource staff.
For field surveys, a Trimble Nomadt field computerwith global positioning system (GPS) was used to recordtransect start and end points and navigate transects(Stober and Smith 2010). The GPS (2010: HemisphereCrescent A100 Smart Antenna, CSI Wireless, Calgary,Alberta; 2011: Magellan N17) units had real-time datacorrection and were accurate to within 1 m. The surveycrew included three observers, one navigating the
transect centerline, using an ArcPadt project on theGPS that included a shape file of the transects. Thecenterline observer searched the line and area close tothe line for burrows, and the two additional observerssearched from the centerline outward, partially overlap-ping their effort with the observer on the centerline(Stober and Smith 2010; i.e., observers concentrated theirsearch effort on and near the transect). This ensures ashoulder in the detection function (Figure 2), increasingthe robustness of a distance sampling analysis (Andersonet al. 2001; Buckland et al. 2001). Burrow locations weretaken using the GPS. Burrow occupancy was determinedby scoping with a burrow camera. Scoping results andother data were recorded electronically in the GPS usingArcPad.
Since occupied and unoccupied tortoise burrows areindistinguishable on the basis of external appearance(Smith et al. 2009), scoping provided an objectivecriterion for determining whether or not a tortoise waspresent, and whether unoccupied burrows were ‘‘us-able.’’ We created the category of usable burrows to
Figure 1. Gopher tortoise (Gopherus polyphemus) population survey using line transect distance sampling methodology during2010 and 2011 at the Fort Gordon Army Installation, Georgia. Tortoise habitat management unit with sample region, impact areas,556 pseudocircuit transects surveyed, burrows, and tortoises used in analyses. The shaded area of the inset map (top, left) placesthe range of the gopher tortoise into the context of the southeastern United States with the study site in black at its northern limit.
Low-Density Gopher Tortoise Populations J.M. Stober et al.
Journal of Fish and Wildlife Management | www.fwspubs.org December 2017 | Volume 8 | Issue 2 | 380
differentiate these unoccupied burrows from burrowsthat were detectable during surveys but ‘‘unusable.’’Unusable burrows were those that were collapsed ,1 minside the entrance or were found upon scoping to havebeen constructed by nine-banded armadillo (Dasypusnovemcinctus; i.e., were oval, ,1.5 m in length, andcontained a bed of litter and pine straw; Eisenberg andKinlaw 1999). We attempted to scope all usable burrows.12 cm in width, the smallest width that couldaccommodate our camera. Burrow width is correlatedwith age-dependent tortoise length. Tortoises ,12 cm inlength are considered juveniles (Landers et al. 1982). Byexcluding burrows ,12 cm wide, our abundanceestimate was for the subadult and adult tortoisepopulation. After scoping, usable burrows were catego-rized as 1) occupied: tortoise observed; 2) unoccupied:no tortoise observed; or 3) undetermined: unable todetermine tortoise presence with certainty.
Data analysisTotal transect length was calculated using Hawth’s
tools and Xtools Pro in ArcGIS. Perpendicular distancesfrom the transect to the burrows were determined inArcGIS using the NEAR function (Stober and Smith 2010).Transects lengths, perpendicular distances to usableburrows, and burrow occupancy (see below) data wereimported into the software Distance (version 6.0, release2; Thomas et al. 2010) for analysis. We truncatedobservations at 24 m to increase analytical robustness(Buckland et al. 2001, pp. 103–108). Distance softwarewas used to derive density and abundance estimates,along with the corresponding CVs and 95% confidenceintervals (CIs); further details of model development and
analyses are provided online (Text S1). Distance samplingrelies on the following assumptions (Buckland et al. 2001,Chapter 2): transects are randomly located (a systematicgrid randomly located is preferable); objects on thetransect line are detected with certainty; objects do notmove; distance measurements are exact; detections aremade independently. All of these hold to goodapproximation in our survey.
The proposed approach is simply a reparametrizationof the standard LTDS approach, and hence should beasymptotically unbiased provided the usual assumptionsof distance sampling hold. The only additional assump-tion is that an unbiased estimate of the proportion ofoccupied burrow is available, which, as we described, isreasonable to expect given the methods considered.Using burrows or tortoises provides unbiased estimates,with the burrow analysis more reliable given the largersample size, which increases precision but not at theexpense of accuracy. We address in the Discussion theimplications of the different assumptions, which underour setting hold to a reasonable extent.
The key aspect of our approach was the use ofburrows instead of tortoises as the objects of analyses.We converted burrow density to tortoise density byincluding an additional multiplier: the proportion ofoccupied burrows. This was achieved in Distance bycoding burrow occupancy as if it were group size (alsocalled ‘‘cluster size’’—i.e., the number of animalsdetected in a group): coding occupied burrows as acluster size of 1, unoccupied as 0, and those where wecould not determine occupancy as �1 for missing data.Mean cluster size, a quantity estimated by the software,then corresponded to the proportion of occupied
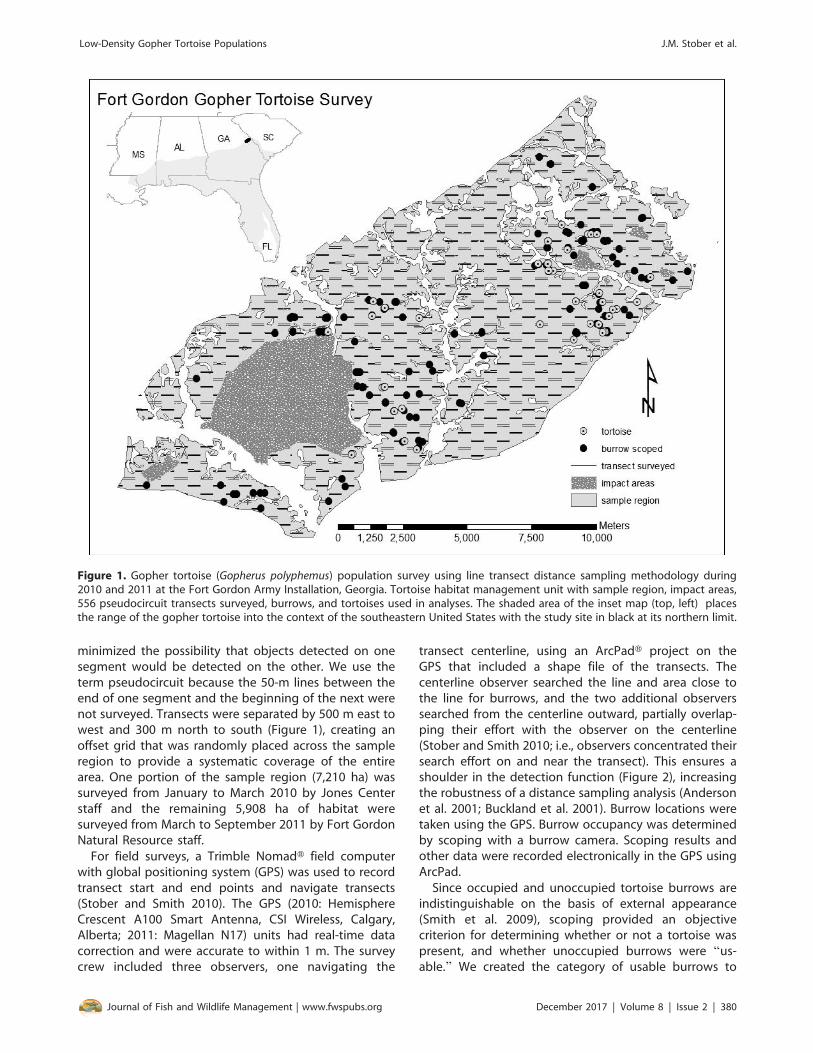
Figure 2. Chosen detection functions in two alternative analyses of a line transect distance sampling survey of gopher tortoise(Gopherus polyphemus) at Fort Gordon Army Installation, Georgia during 2010 and 2011. In the left plot, analysis is of n ¼ 157burrows; in the right plot, it is of n¼ 37 tortoises. Dashed lines show fitted detection functions, whereas histograms show detectiondistances, scaled so that the area under the histograms matches that of the detection functions.
Low-Density Gopher Tortoise Populations J.M. Stober et al.
Journal of Fish and Wildlife Management | www.fwspubs.org December 2017 | Volume 8 | Issue 2 | 381
burrows, and was the quantity required to convertburrow density to tortoise density. Assumptions of ourmethod were that 1) detectability of occupied burrowswas the same as unoccupied (but usable) burrows, and2) occupancy rate was the same for burrows where wecould determine occupancy as those where we couldnot. These assumptions were readily met in this study—something we return to in the Discussion. For compar-ison with the standard approach to LTDS, we alsoimplemented an analysis based on occupied burrowsalone. To model the detection function we consideredthe key function and series adjustment term combina-tions recommended by Buckland et al. (2001, p.47;Tables 1 and 2). The model selected for inference wasthat with lowest Akaike information criterion (AIC,Burnham and Anderson 2002); goodness of fit of theselected model was evaluated using quantile–quantileplots, Kolmogorov–Smirnov, and Cramer-von Mises tests(Buckland et al. 2015). In our analyses, the variance in theestimate of tortoise density resulted from the combina-tion of three variance components: 1) encounter rate ofburrows, 2) detectability of burrows, and 3) burrowoccupancy by tortoises (see Text S1 for the relevantformulae). For line transects the encounter rate typicallydominates the overall variance. Although systematicdesigns minimize this variance compared with com-pletely random designs, the variance is hard to estimatefor a systematic design because the transect placementsare not independent and hence they do not form truereplicates. Traditionally, systematic designs are analyzedas if they are completely random. Fewster et al. (2009)showed that this tends to overestimate the true variance,and suggested better approaches based on approximat-ing the systematic design by a stratified design whereadjacent pairs of transects are treated as being in smallpseudostrata. Here, we used the recommended system-atic design estimator O2 (Fewster et al. 2009); in our case,pairing was done diagonally, since the survey design wasbased on a diagonal grid. We paired transects in both thenortheast and northwest directions (Text S1), and tookthe average to obtain a final encounter rate variance. Toillustrate the benefits of using the new systematic designestimator, we also computed variance using the tradi-tional estimator, which assumes a completely randomdesign (R2, Fewster et al. 2009).
Results
In 2010–2011, 556 pseudocircuits (1300 transectsegments) were surveyed, totaling 428.8 km (Figure 1).We detected and scoped 163 usable burrows. Of these, 6were .24 m from the transect and were not included inthe analyses. In the 157 remaining burrows we observed37 tortoises. We were unable to confirm whether atortoise was present in 9 of the 157 burrows (5.7%).Burrow occupancy excluding the undetermined burrowswas 0.25 6 0.04 (SE) tortoises/burrow. Only one tortoisewas observed above ground during the survey.
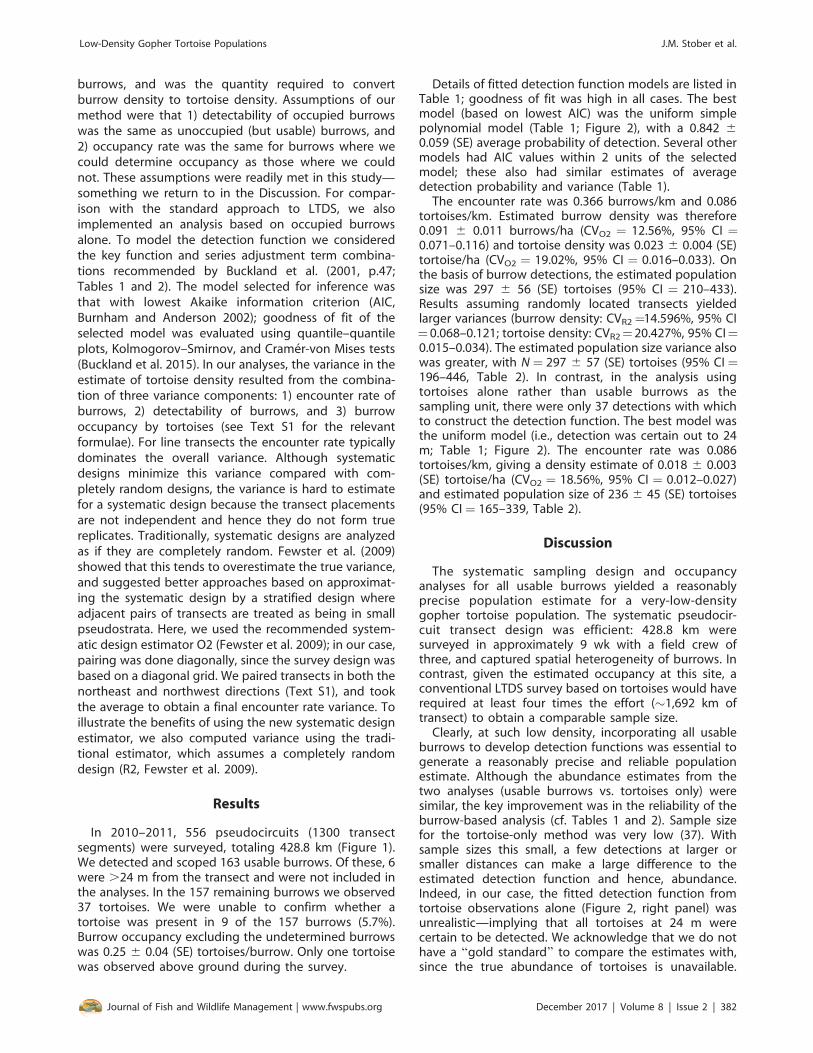
Details of fitted detection function models are listed inTable 1; goodness of fit was high in all cases. The bestmodel (based on lowest AIC) was the uniform simplepolynomial model (Table 1; Figure 2), with a 0.842 60.059 (SE) average probability of detection. Several othermodels had AIC values within 2 units of the selectedmodel; these also had similar estimates of averagedetection probability and variance (Table 1).
The encounter rate was 0.366 burrows/km and 0.086tortoises/km. Estimated burrow density was therefore0.091 6 0.011 burrows/ha (CVO2 ¼ 12.56%, 95% CI ¼0.071–0.116) and tortoise density was 0.023 6 0.004 (SE)tortoise/ha (CVO2 ¼ 19.02%, 95% CI ¼ 0.016–0.033). Onthe basis of burrow detections, the estimated populationsize was 297 6 56 (SE) tortoises (95% CI ¼ 210–433).Results assuming randomly located transects yieldedlarger variances (burrow density: CVR2¼14.596%, 95% CI¼0.068–0.121; tortoise density: CVR2¼20.427%, 95% CI¼0.015–0.034). The estimated population size variance alsowas greater, with N ¼ 297 6 57 (SE) tortoises (95% CI¼196–446, Table 2). In contrast, in the analysis usingtortoises alone rather than usable burrows as thesampling unit, there were only 37 detections with whichto construct the detection function. The best model wasthe uniform model (i.e., detection was certain out to 24m; Table 1; Figure 2). The encounter rate was 0.086tortoises/km, giving a density estimate of 0.018 6 0.003(SE) tortoise/ha (CVO2 ¼ 18.56%, 95% CI ¼ 0.012–0.027)and estimated population size of 236 6 45 (SE) tortoises(95% CI ¼ 165–339, Table 2).
Discussion
The systematic sampling design and occupancyanalyses for all usable burrows yielded a reasonablyprecise population estimate for a very-low-densitygopher tortoise population. The systematic pseudocir-cuit transect design was efficient: 428.8 km weresurveyed in approximately 9 wk with a field crew ofthree, and captured spatial heterogeneity of burrows. Incontrast, given the estimated occupancy at this site, aconventional LTDS survey based on tortoises would haverequired at least four times the effort (~1,692 km oftransect) to obtain a comparable sample size.
Clearly, at such low density, incorporating all usableburrows to develop detection functions was essential togenerate a reasonably precise and reliable populationestimate. Although the abundance estimates from thetwo analyses (usable burrows vs. tortoises only) weresimilar, the key improvement was in the reliability of theburrow-based analysis (cf. Tables 1 and 2). Sample sizefor the tortoise-only method was very low (37). Withsample sizes this small, a few detections at larger orsmaller distances can make a large difference to theestimated detection function and hence, abundance.Indeed, in our case, the fitted detection function fromtortoise observations alone (Figure 2, right panel) wasunrealistic—implying that all tortoises at 24 m werecertain to be detected. We acknowledge that we do nothave a ‘‘gold standard’’ to compare the estimates with,since the true abundance of tortoises is unavailable.
Low-Density Gopher Tortoise Populations J.M. Stober et al.
Journal of Fish and Wildlife Management | www.fwspubs.org December 2017 | Volume 8 | Issue 2 | 382
However, if all assumptions of the method are met, theburrow occupancy method will be more reliable becausethe larger sample size leads to more reliable detectionfunction modeling. Additionally, in our study thevariance introduced by estimating burrow occupancywas more than compensated for by the additionalsample size of detections, meaning that the twoestimates had very similar estimates of variance (CV19.0% for burrow occupancy; 18.6% for tortoises). Theestimate using tortoise detection alone would have hada higher variance if the unrealistic uniform detectionfunction had not been selected (Table 2). Finally, thesemethodological changes did not require additional datacollection in the field and all the analyses could beimplemented using Distance software.
One important assumption of our approach was thatoccupied and unoccupied (but usable) burrows wereequally detectable (i.e., the same detection function).This seems reasonable a priori, given that we could notdistinguish between these without a burrow camera.However, occupied burrows could be more detectablebecause of recent tortoise digging activity, particularlybetween late spring and early fall, when tortoises aremost active (McRae et al. 1981). We tested thisassumption by extending the detection function analysisto include occupancy status as a covariate in addition todistance, and using AIC to determine if this extendedmodel was supported by the data (i.e., multiple covariatedistance sampling—see Marques et al. 2007). Thedistance-only model had a lower AIC, indicating that an
effect of occupancy on detectability was not supportedby the data.
Strictly speaking, the method also assumes that theoccupancy rate is the same for burrows with determinedand undetermined occupancy status. This is a mildassumption, and even less important in surveys such asours where the number of undetermined burrows issmall. We recommend that all surveys report the numberof burrows where occupancy could not be determinedalong with the survey results. If field conditions precludethe ability to effectively scope burrows (e.g., as inCastellon et al. 2015), the method may not beappropriate.
Finally, because our study took place over 2 y, we alsoassumed that occupancy did not differ between years. Itis unlikely that occupancy would change over this shortperiod of time (Smith 1995; Eubanks et al. 2003).However, if occupancy had differed across years, wecould have stratified by the different portions of thestudy area covered in the different years.
As our study demonstrated, a systematic samplingapproach in LTDS can increase precision of populationestimates. Fewster et al. (2009) found that the random-line variance estimators can perform poorly for system-atic surveys, especially when object density followsstrong trends in a particular direction, which was thecase in our study. The difference between random vs.systematic variance estimates comes from the encounterrate component (Figure 3). Stratified design techniquesare capable of better representing the true underlyingvariability of the estimators. Therefore, encounter rate
Table 2. Details of the selected model for inference for gopher tortoise (Gopherus polyphemus) population estimates at Fort Gordon,Georgia using program Distance (ver. 6.0 release 2). Analyses were implemented with data collected during 2010 and 2011 usingline transect distance sampling (Buckland et al. 2001) for 157 ‘‘usable’’ burrows and 37 tortoise observations, with truncation at 24m. R2 is the default variance estimate used in Distance software and O2 is the variance estimate that accounts for the systematicsample design.
Analysis Model Sample size
Detection probability Tortoise abundance
P CV N CVR2 CVO2 95% CIO2
Usable burrows þ occupancy Uniform simple polynomial 157 0.84 0.07 297 20.43 19.02 210–433
Only tortoise Uniform 37 1 0.00 236 21.24 18.56 165–339
Table 1. Overall model comparisons for line transect distance sampling (Buckland et al. 2001) for gopher tortoises (Gopheruspolyphemus) performed during 2010 and 2011 at Fort Gordon, Georgia using program Distance (ver. 6.0 release 2). Analyses wereimplemented for 157 ‘‘usable’’ burrows and 37 tortoise observations, with data truncation at 24 m. Coefficient of variation (CV) forthe probability of detection shown in parentheses after point estimate.
Model, key function þadjustment terms (order)
Detection probability,
P (CV)
Delta Akaike information
criterion
Goodness of fit Cramer-von Mises
cosine weighting, P value
Usable burrows þ occupancy
Uniform þ simple polynomial (1)* 0.84 (0.07) 0 0.6
Half-normal 0.84 (0.08) 0.16 0.6
Uniform þ cos (1) 0.82 (0.09) 0.78 0.6
Hazard rate 0.93 (0.04) 1.61 0.4
Only tortoise
Uniforma 1 (0.00) 0 0.9
Half-normal 0.94 (0.19) 1.87 0.8
Hazard rate 0.93 (0.13) 3.36 0.7
a Selected model.
Low-Density Gopher Tortoise Populations J.M. Stober et al.
Journal of Fish and Wildlife Management | www.fwspubs.org December 2017 | Volume 8 | Issue 2 | 383

variance estimators for systematic designs give lowervariance compared with estimators for random designs.The difference in this case was not large, becauseencounter rate accounted for only ~30% of the overallvariance, with burrow occupancy playing a much largerrole (~56%). In populations with higher burrow occu-pancy and higher density, the encounter rate wouldlikely be a larger component of overall variance, andhence the effect of using a systematic encounter rateestimator would be greater. In cases such as this study,where there is more than one possible pairing oftransects to form the strata used for variance estimation,we recommend using the average of variance estimatesfrom the different possible pairings.
Although we created our sample design using ArcGIS,Distance software can create grid-based designs. Dis-tance can create waypoint coordinates of transect endpoints that can be transformed into systematic paralleltransects that can then be exported to a handheld GPSunit for sampling. Program Distance also has a spatialmodeling analysis tool that can potentially model habitatpreferences and provide more precise estimates (Milleret al. 2013). Because of the limited sample size we didnot attempt to use strata in our study. However, inpopulations where sample size is sufficient, land-usehistory or habitat characteristics can be used in an apriori or poststratified design to provide habitat-specificpopulation estimates.
For low-density gopher tortoise populations, werecommend the methods used in this survey: performinga thorough pilot survey, categorizing all usable burrowsas occupied, unoccupied, or undetermined, and using asystematic design with pseudocircuit transects. If base-line population estimates are derived with thesemethods, resampling the same transects within thesame sampling region in 5–10 y should detect trends inthe tortoise population per USFWS (2012) recommenda-tions. Along with these methods, a power analysis couldbe used to derive a resampling interval appropriate todetect the desired magnitude of change. We haverecommended a relatively long resampling intervalbecause the population was extremely small andchanges are likely to occur very slowly. Tortoises havea low annual reproductive potential (an average of six toseven eggs per female every 1–2 y), with high mortalityof eggs and young (Iverson 1980; Landers et al. 1980,1982, Epperson and Heise 2003; Smith et al. 2013).Therefore, recruitment of new individuals into thepopulation is slow.
The methods presented here may be suitable for otherspecies such as red-cockaded woodpeckers (Leuconoto-picus borealis), which excavate nest cavities in largepines; puffins (Fratercula arctica), which nest in burrows(Harris and Murray 1981); or gopher frogs (Lithobatescapito), which often inhabit gopher tortoise burrows(Blihovde 2006). Rexer-Huber et al. (2016) derivedpopulation estimates for the white-chinned petrel(Procellaria aequinoctialis) by surveying the numerousnesting burrows and were able to stratify by habitattypes using a stratified random sampling design. Asimilar approach could be used with tortoise populations(i.e., stratifying by habitat characteristics, such as nativeand disturbed ground cover), provided burrow densitieswere sufficient. Adapting the methods presented forspecies that include more than one object of interest perdetection (e.g., number of parasites in detected hosts,number of eggs per detected/nest), rather than a binaryoutcome, seems like a natural extension.
Supplemental Material
Please note: The Journal of Fish and Wildlife Managementis not responsible for the content or functionality of anysupplemental material. Queries should be directed to thecorresponding author for the article.
Text S1. Step by step outline of executing the linetransect distance analysis for gopher tortoises (Gopheruspolyphemus) at Fort Gordon, Georgia using programDistance (ver. 6.0 release 2) during 2010 and 2011. Theauthors have included the data set as an example in thesoftware program Distance.
Found at DOI: http://dx.doi.org/10.3996/012017-JFWM-005.S1 (9866 KB DOCX).
Reference S1. Integrated Natural Resources Manage-ment Plan, U.S. Army Garrison, Fort Gordon, Georgia.Baton Rouge, Louisiana: Gulf South Research Corpora-tion. September 2008.
Figure 3. Encounter rate variance estimators for the standardand systematic analyses of line transect distance sampling ofthe gopher tortoise (Gopherus polyphemus) population during2010 and 2011 at the Fort Gordon Army Installation, Georgia.The top bar is the default variance estimate used by Distancesoftware (R2) calculated assuming that the placement oftransects is random. Middle and bottom bars are poststratifiedestimators with an overlapping strata approach (O2) in bothnortheast (NE) and northwest (NW) directions, and the star isthe average of the O2 estimates.
Low-Density Gopher Tortoise Populations J.M. Stober et al.
Journal of Fish and Wildlife Management | www.fwspubs.org December 2017 | Volume 8 | Issue 2 | 384
Found at DOI: http://dx.doi.org/10.3996/012017-JFWM-005.S2 (13431 KB PDF).
Reference S2. Legleu C. 2012. Modeling gophertortoise (Gopherus polyphemus) habitat in a fire-depen-dent ecosystem in north Florida. Master’s thesis. BatonRouge: Louisiana State University.
Found at DOI: http://dx.doi.org/10.3996/012017-JFWM-005.S3 (2243 KB PDF).
Reference S3. U.S. Fish and Wildlife Service. 2012.Candidate conservation agreement for the gophertortoise (Gopherus polyphemus) eastern population.
Found at DOI: http://dx.doi.org/10.3996/012017-JFWM-005.S4 (2347 KB PDF); also available at http://www.fws.gov/southeast/candidateconservation/pdf/CCA_GopherTortoise_revisedDec2012_final.pdf.
Acknowledgments
This work was made possible in cooperation with TheNature Conservancy Chattahoochee Fall Line officecontract number GAFO-110509-1 and the support of W.Harrison. Field, technical, and additional support wereprovided by the Natural Resource Branch at Fort Gordonincluding: S. Camp, R. Drumm, P. Grimes, S. Partridge, M.Juhan, C. House, C. Holt, and C. Morris and the J.W. JonesEcological Research Center: E. Schlimm, J. Howze, C.Aiello, and M. Cook. We also thank the anonymousAssociate Editor and three anonymous reviewers whosubstantially improved the manuscript. T.A.M. thankspartial support by CEAUL (funded by Fundacao para aCiencia e a Tecnologia, Portugal, through the projectUID/MAT/00006/2013).
Any use of trade, product, website, or firm names inthis publication is for descriptive purposes only and doesnot imply endorsement by the U.S. Government.
References
Anderson DR, Burnham KP, Lubow BC, Thomas L, CornPS, Medica PA, Marlow RW. 2001. Field trials of linetransect methods applied to estimation of deserttortoise abundance. Journal of Wildlife Management65:583–597.
Beyer HL. 2004. Hawth’s analysis tools for ArcGIS.Available: http://www.spatialecology.com/htools(May 2017).
Blihovde WB. 2006. Terrestrial movements and uplandhabitat use of gopher frogs in central Florida.Southeastern Naturalist 5:265–276.
Bonnet-Lebrun A, Calabrese S, Rocamora L, Lopez-Sepulcre A. 2016. Estimating the abundance ofburrow-nesting species through the statistical analysisof combined playback and visual surveys. Journal ofAvian Biology 47:642–649.
Breininger DR, Schmalzer PA, Hinkle CR. 1994. Gophertortoise (Gopherus polyphemus) densities in coastal
scrub and slash pine flatwoods in Florida. Journal ofHerpetology 28:60–65.
Buckland ST, Anderson DR, Burnham KP, Laake JL,Borchers DL, Thomas L. 2001. Introduction to distancesampling: estimating abundance of biological popu-lations. Oxford, UK: Oxford University Press.
Buckland ST, Rexstad EA, Marques TA, Oedekoven CS.2015. Distance sampling: methods and applications.Cham, Switzerland: Springer International Publishing.
Burnham KP, Anderson DR. 2002. Model selection andmulti inference: a practical information-theoreticapproach. 2nd edition. New York: Springer-Verlag.
Buxton RT, Gormley AM, Jones CJ, Lyver PO. 2016.Monitoring burrowing Petrel populations: a samplingscheme for the management of an island keystonespecies. Journal of Wildlife Management 80:149–161.
Castellon TD, Rothermel BB, Nomani SZ. 2012. Gophertortoise (Gopherus polyphemus) burrow densities inscrub and flatwoods habitats of peninsular Florida.Chelonian Conservation and Biology 11:153–161.
Castellon TD, Rothermel BB, Nomani SZ. 2015. Acomparison of line-transect distance sampling meth-ods for estimating gopher tortoise population densi-ties. Wildlife Society Bulletin 39:804–812.
Data East 2008. Xtools: Release 9.1 Novosibirsk, Russia.Available: http://www.xtoolspro.com/ (May 2017).
Eisenberg JF, Kinlaw A. 1999. Introduction to the SpecialIssue: ecological significance of open burrow systems.Journal of Arid Environments 41:123–125.
[ESRI] Environmental Systems Research Instititute. 2008.ArcGIS Desktop: Release 9.3.1. Redlands, California:Environmental Systems Research Institute.
Epperson DM, Heise CD. 2003. Nesting and hatchlingecology of gopher tortoises (Gopherus polyphemus) insouthern Mississippi. Journal of Herpetology 37:315–324.
Eubanks JO, Michener WK, Guyer C. 2003. Patterns ofmovement and burrow use in a population of gophertortoises (Gopherus polyphemus). Herpetologica59:311–321.
Fewster RM, Buckland ST, Burnham KP, Borchers DL, JuppPE, Laake JL, Thomas L. 2009. Estimating theencounter rate variance in distance sampling. Biomet-rics 65:225–236.
Harris MP, Murray S. 1981. Monitoring of Puffin numbersat Scottish colonies. Bird Study 28:15–20.
Hermann SM, Guyer C, Waddle JH, Nelms MG. 2002.Sampling on private property to evaluate populationstatus and effects of land use practices on the gophertortoise, Gopherus polyphemus. Biological Conserva-tion 108:289–298.
Integrated Natural Resources Management Plan U.S.Army Garrison, Fort Gordon, Georgia. Baton Rouge,Louisiana: Gulf South Research Corporation. Septem-ber 2008. (See Supplemental Material, Reference S1).
Iverson JB. 1980. The reproductive biology of Gopheruspolyphemus (Chelonia: Testudinidae). American Mid-land Naturalist 103:353–359.
Low-Density Gopher Tortoise Populations J.M. Stober et al.
Journal of Fish and Wildlife Management | www.fwspubs.org December 2017 | Volume 8 | Issue 2 | 385
Landers JL, Garner JA, McRae WA. 1980. Reproduction ofgopher tortoises (Gopherus polyphemus) in southwest-ern Georgia. Herpetologica 36:353–361.
Landers JL, McRae WA, Garner JA. 1982. Growth andmaturity of the gopher tortoise in southwesternGeorgia. Bulletin of the Florida State Museum,Biological Sciences 27:81–110.
Legleu C. 2012. Modeling gopher tortoise (Gopheruspolyphemus) habitat in a fire-dependent ecosystem innorth Florida. Master’s thesis. Baton Rouge: LouisianaState University (See Supplemental Material, ReferenceS2).
Marques TA, Thomas L, Fancy SG, Buckland ST. 2007.Improving estimates of bird density using multiplecovariate distance sampling. Auk 127:1229–1243.
McRae WA, Landers JL, Garner JA. 1981. Movementpatterns and home range of the gopher tortoise.American Midland Naturalist 106:165–179.
Miller DL, Burt ML, Rexstad EA, Thomas L. 2013. Spatialmodels for distance sampling data: recent develop-ments and future directions. Methods in Ecology andEvolution 4:1001–1010.
Nomani SZ, Carthy RR, Oli MK. 2008. Comparison ofmethods for estimating abundance of gopher tortois-es. Applied Herpetology 5:13–31.
Rexer-Huber K, Parker GC, Sagar PM, Thompson DR.2016. White-chinner petrel population estimate, Dis-appointment Island (Auckland Islands). Polar Biology40:2031–2040.
Smith LL. 1995. Nesting ecology, female home range andactivity and population size-class structure of thegopher tortoise, Gopherus polyphemus, on the Kather-ine Ordway Preserve, Putnam County. Florida Museumof Natural History 4:97–126.
Smith LL, Linehan JM, Stober JM, Elliot MJ, Jensen JB.2009. An evaluation of distance sampling for large-scale gopher tortoise surveys in Georgia, U.S.A.Applied Herpetology 6:355–368.
Smith LL, Steen DA, Conner LM, Rutledge JR. 2013.Effects of predator exclusion on nest and hatchlingsurvival in the gopher tortoise. Journal of WildlifeManagement 77:352–358.
Smith LL, Tuberville TD, Seigel RA. 2006. Workshop onthe ecology, status, and management of the gopher
tortoise (Gopherus polyphemus). Joseph W. JonesEcological Research Center, 16–17 January 2003: finalresults and recommendations. Chelonian Conserva-tion and Biology 5:326–330.
Smith RB, Tuberville TD, Chambers AL, Herpich KM,Berish JE. 2005. Gopher tortoise burrow surveys:external characteristics, burrow cameras, and truth.Applied Herpetology 2:161–170.
Stober JM, Smith LL. 2010. Estimating abundance ofsmall gopher tortoise populations: total counts versusline transect distance sampling. Journal of WildlifeManagement 74:1595–1600.
Strindberg S, Buckland ST, Thomas L. 2004. Design ofdistance sampling surveys and geographic informa-tion systems. Pages 190–228 in Buckland ST, AndersonDR, Burnham KP, Laake JL, Borchers DL, Thomas L,editors. Advanced distance sampling. Oxford, UK:Oxford University Press.
Thomas L, Buckland ST, Rexstad EA, Laake JL, StrindbergS, Hedley SL, Bishop JRB, Marques TA, Burnham KP.2010. Distance software: design and analysis ofdistance sampling surveys for estimating populationsize. Journal of Applied Ecology 47:5–14.
Thompson S. 2002. Sampling. 2nd edition. New York:Wiley.
[ESA] U.S. Endangered Species Act of 1973, as amended,Pub. L. No. 93-205, 87 Stat. 884 (Dec. 28, 1973).Available: http://www.fws.gov/endangered/esa-library/pdf/ESAall.pdf.
U.S. Fish and Wildlife Service. 2011. 12-month finding ona petition to list the gopher tortoise as threatened inthe eastern portion of its range. Federal Register76:14445130–14445162.
U.S. Fish and Wildlife Service. 1987. Endangered andthreatened wildlife and plants; determination ofthreatened status for the Gopher Tortoise Recoveryplan. Federal Register 52:12925376–25380.
U.S. Fish and Wildlife Service. 2012. Candidate conserva-tion agreement for the Gopher Tortoise (Gopheruspolyphemus) eastern population. (see SupplementalMaterial, Reference S3), also available at http://www.fws.gov/southeast/candidateconservation/pdf/CCA_GopherTortoise_revisedDec2012_final.pdf (May 2017).
Low-Density Gopher Tortoise Populations J.M. Stober et al.
Journal of Fish and Wildlife Management | www.fwspubs.org December 2017 | Volume 8 | Issue 2 | 386