methods and models of the hanford internal dosimetry ... · this manual is maintained by the...
TRANSCRIPT

PNNL-15614
Methods and Models of the Hanford Internal Dosimetry Program PNNL-MA-860 E. H. Carbaugh D. E. Bihl J. A. MacLellan January 1, 2003 Prepared for the U.S. Department of Energy under Contract DE-AC06-76RL01830

DISCLAIMER
This report was prepared as an account of work sponsored by an agency of the United States Government. Neither the United States Government nor any agency thereof, nor Battelle Memorial Institute, nor any of their employees, makes any warranty, express or implied, or assumes any legal liability or responsibility for the accuracy, completeness, or usefulness of any information, apparatus, product, or process disclosed, or represents that its use would not infringe privately owned rights. Reference herein to any specific commercial product, process, or service by trade name, trademark, manufacturer, or otherwise does not necessarily constitute or imply its endorsement, recommendation, or favoring by the United States Government or any agency thereof, or Battelle Memorial Institute. The views and opinions of authors expressed herein do not necessarily state or reflect those of the United States Government or any agency thereof.
PACIFIC NORTHWEST NATIONAL LABORATORY operated by BATTELLE
for the UNITED STATES DEPARTMENT OF ENERGY
under Contract DE-AC06-76RL01830
Printed in the United States of America
Available to DOE and DOE contractors from the Office of Scientific and Technical Information,
P.O. Box 62, Oak Ridge, TN 37831-0062; ph: (865) 576-8401 fax: (865) 576-5728
email: [email protected]
Available to the public from the National Technical Information Service, U.S. Department of Commerce, 5285 Port Royal Rd., Springfield, VA 22161
ph: (800) 553-6847 fax: (703) 605-6900
email: [email protected] online ordering: http://www.ntis.gov/ordering.htm
This document was printed on recycled paper. (8/00)

PNNL-MA-860
Radiation and Health Technology
Methods and Models of the Hanford Internal Dosimetry Program, PNNL-MA-860
Approved for Use and Application by:
Pacific Northwest National Laboratory Richland, Washington 99352

Preface This manual provides the scientific and technical foundations for bioassay program design and interpretation, and for the assessment of occupational intakes and internal doses. The Hanford Internal Dosimetry Project Manual (PNNL-MA-552)(a) applies these foundations to define the recommended worker bioassay monitoring programs and internal dose assessment efforts at the Hanford Site. According to the DOE Internal Dosimetry Program Guide (DOE G 441.1-3, 03-17-99), a technical basis document should record the approach to evaluating internal doses from bioassay data, and where appropriate, from workplace monitoring data. It should also describe the physical and chemical characteristics of radioactive materials encountered in the workplace; methods for calculating internal doses and dose equivalents and the methods for documenting those calculations; dose evaluation quality assurance; recording and reporting practices for internal dosimetry; selection of workers for monitoring; and establishment of the type and frequency of measurements to be used. Furthermore, statistical methods for evaluating bioassay data, identifying bioassay results above environmental background values, using appropriate blanks, and analyzing trends should be described. This manual describes the basic methods and biokinetic models used for bioassay program design, interpretation, and internal dose assessment. These methods and models are combined with good practices and professional judgment to give the operational recommendations for routine and special bioassay monitoring contained in the Hanford Internal Dosimetry Project Manual (PNNL-MA-552). The actual selection of workers for monitoring and the characterization of the physical, chemical, and radiological properties of contaminants in the many Hanford facilities are the domain of the individual Hanford contractors. The recommendations in this manual are provided as guidance, not requirements, to personnel responsible for designing and operating bioassay monitoring programs and evaluating bioassay results. Commitments by contractors to use these recommendations may be found in the contractor radiation protection plans. This manual is on a 3-year revision schedule, however individual sections are revised as necessary, and upon revision, commence their own 3-year revision cycle. This manual is maintained by the Hanford Internal Dosimetry Program, operated by the Pacific Northwest National Laboratory’s (PNNL’s) Radiation and Health Technology group. The contact person for questions or comments regarding the content of this manual is Eugene H. Carbaugh at 376-6632. Available email address: [email protected]
(a) Pacific Northwest National Laboratory (PNNL). Hanford Internal Dosimetry Project Manual. PNNL-MA-552, Richland, Washington. (Internal manual.) Available URL: http://www.pnl.gov/eshs/pub/pnnl552.html
Issued: January 31, 2003 PNNL-MA-860 Preface Page iii

Acronyms and Abbreviations ACGIH American Conference on Governmental Industrial Hygienists ALI annual limit on intake AMAD activity median aerodynamic diameter ANSI American National Standards Institute BEIR Biological Effects of Ionizing Radiation CEDE committed effective dose equivalent CINDY code for internal dosimetry CF commercial fuel CFR Code of Federal Regulations CL contract limit DAC derived air concentration DCL derived compliance level DCF dose conversion factor D&D decontamination and decommissioning DIL derived investigation level DL decision level DOE U.S. Department of Energy DRL dose reporting level DSL derived screening level DTPA diethylene triamine pentaacetic acid DU depleted uranium EDF Emergency Decontamination Facility EDTA ethylene diamine tetraacetic acid EPA U.S. Environmental Protection Agency FAO Food and Agriculture Organization FFTF Fast Flux Test Facility GI gastrointestinal HEHF Hanford Environmental Health Foundation HIDP Hanford Internal Dosimetry Program HPS Health Physics Society HTO tritiated water vapor or liquid IAEA International Atomic Energy Agency ICPMS inductively coupled plasma mass spectrometry
Issued: January 31, 2003 PNNL-MA-860 Acronyms Supersedes: September 30, 2000 Page v

ICRP International Commission on Radiological Protection IL investigation level IRF intake retention function IVRRF In Vivo Radioassay and Research Facility Lc critical level of detection Ld detection level LLD lower limit of detection MDA minimum detectable activity or amount MDD minimum detectable dose MDI minimum detectable intake MKIV Mark IV MPBB maximum permissible body burden NBS National Bureau of Standards NCRP National Council on Radiation Protection and Measurements NIOSH National Institute for Occupational Safety and Health NU natural uranium NWVP Nuclear Waste Vitrification Project OBT organically bound tritium ORNL Oak Ridge National Laboratory OSHA Occupational Safety and Health Administration PC personal computer PEL permissible exposure limit PFP Plutonium Finishing Plant PHS Public Health Services PNL Pacific Northwest Laboratory PNNL Pacific Northwest National Laboratory PUREX Plutonium-Uranium Extraction Plant (or process) RU recycled uranium SEE specific effective energy SI small intestine SL screening level STC special tritium compound STEL short-term exposure limit TLV threshold limit valve TPU total propagated uncertainty UNSCEAR United Nations Scientific Committee on the Effects of Atomic Radiation
PNNL-MA-860 Acronyms Issued: January 31, 2003 Page vi Supersedes: September 30, 2000

USTUR United States Transuranium and Uranium Registries UO3 Uranium Oxide (Plant) VL verification level WESF Waste Encapsulation and Storage Facility WHO World Health Organization
Issued: January 31, 2003 PNNL-MA-860 Acronyms Supersedes: September 30, 2000 Page vii

Contents Preface .............................................................................................................................................. iii Acronyms and Abbreviations ............................................................................................................ v 1.0 Introduction................................................................................................................................. 1.1 1.1 Document Description ....................................................................................................... 1.1 1.2 Document History.............................................................................................................. 1.2 1.3 References ......................................................................................................................... 1.4 2.0 General Methods for Internal Dosimetry .................................................................................... 2.1 2.1 Radiation Quality and Tissue Weighting Factors .............................................................. 2.1 2.2 Biokinetic Models.............................................................................................................. 2.2 2.3 Bioassay Measurements .................................................................................................... 2.3 2.4 Internal Dosimetry Assessments........................................................................................ 2.3 2.5 Organs or Tissues of Concern............................................................................................ 2.4 2.6 Particle Size ....................................................................................................................... 2.6 2.7 Assumed Date of Intake .................................................................................................... 2.7 2.8 Intake Pattern..................................................................................................................... 2.8 2.9 Interpretation of Bioassay Program Capability ................................................................. 2.8 2.10 Normalizing Bioassay Data ............................................................................................... 2.8 2.11 Fitting Bioassay Data to Biokinetic Models ...................................................................... 2.10 2.12 Reference Levels and Derived Reference Levels .............................................................. 2.10 2.13 Fundamental Relationships................................................................................................ 2.11 2.14 References ......................................................................................................................... 2.14
Issued: January 31, 2003 PNNL-MA-860 Contents Supersedes: September 30, 2000 Page ix

3.0 Special Topics............................................................................................................................. 3.1 4.0 Tritium ...................................................................................................................................... 4.1 4.1 Sources and Environmental Levels of Tritium .................................................................... 4.1 4.2 Chemical Forms of Tritium ................................................................................................. 4.2 4.3 Internal Dosimetry for Tritiated Water ................................................................................ 4.2 4.3.1 Dose Calculation for an Acute Exposure to HTO...................................................... 4.5 4.3.2 Dose Calculation for a Chronic Exposure to HTO .................................................... 4.8 4.3.3 HTO Dosimetry Based on Multiple Sample Results ................................................. 4.8 4.3.4 Bioassay for Intakes of Tritiated Water ..................................................................... 4.9 4.3.5 Derived Reference Levels for HTO Bioassay............................................................ 4.9 4.3.6 Bioassay Measurements Capability for Acute HTO Exposures ................................ 4.9 4.3.7 Bioassay Measurement Capability for Chronic HTO Exposures .............................. 4.12 4.3.8 Optimum Bioassay Sampling Intervals for HTO Exposures ..................................... 4.13 4.3.9 Special Monitoring for HTO...................................................................................... 4.13 4.4 Internal Dose Assessment Protocols for HTO ..................................................................... 4.14 4.4.1 Dose Assessment for a Single Acute Exposure ......................................................... 4.15 4.4.2 Dose Assessment for Chronic Exposure.................................................................... 4.15 4.4.3 Dose Assessment for Periodic Samples ..................................................................... 4.15 4.5 Management of Internal Contamination Cases.................................................................... 4.16 4.6 Tritium Monitoring Program for the 400 Area .................................................................... 4.16 4.7 Organically Bound Tritium.................................................................................................. 4.18 4.8 Tritiated Particulate Aerosols .............................................................................................. 4.19
PNNL-MA-860 Contents Issued: January 31, 2003 Page x Supersedes: September 30, 2000

4.9 References............................................................................................................................ 4.20 5.0 Cesium ...................................................................................................................................... 5.1 5.1 Sources and Characteristics of Radiocesium ....................................................................... 5.1 5.2 Environmental Levels of 137Cs............................................................................................. 5.2 5.3 Biokinetic Behavior of Radiocesium................................................................................... 5.4 5.4 Internal Dosimetry for Radiocesium.................................................................................... 5.4 5.4.1 Fundamental Principles Method ................................................................................ 5.6 5.4.2 Intake-Based Dosimetry Using the ICRP System and the CINDY Computer Code ............................................................................................ 5.7 5.4.3 Comparison of Dosimetric Factors ............................................................................ 5.10 5.5 Bioassay for Radiocesium.................................................................................................... 5.10 5.5.1 Bioassay Method........................................................................................................ 5.10 5.5.2 In Vivo Measurements ............................................................................................... 5.12 5.5.3 Excreta Analysis ........................................................................................................ 5.12 5.5.4 Routine Bioassay Monitoring Protocol...................................................................... 5.12 5.5.5 Bioassay Measurements Following an Acute Intake ................................................. 5.16 5.6 Assessment of Internal Dose Equivalent ............................................................................. 5.17 5.7 Management of Internal Contamination Cases.................................................................... 5.17 5.8 References............................................................................................................................ 5.18 6.0 Strontium ................................................................................................................................... 6.1 6.1 Sources and Characteristics of Strontium at Hanford ........................................................ 6.1 6.2 Environmental Levels of 90Sr .............................................................................................. 6.3 6.3 Biokinetic Behavior of Radiostrontium............................................................................... 6.3
Issued: January 31, 2003 PNNL-MA-860 Contents Supersedes: September 30, 2000 Page xi

6.3.1 Inhalation Class.......................................................................................................... 6.3 6.3.2 Uptake to Blood ......................................................................................................... 6.4 6.3.3 Internal Distribution and Retention............................................................................ 6.4 6.3.4 Excretion of Strontium............................................................................................... 6.5 6.4 Internal Dosimetry Factors for Radiostrontium .................................................................. 6.7 6.5 Bioassay for Radiostrontium............................................................................................... 6.8 6.5.1 Excreta Bioassay Techniques for 90Sr........................................................................ 6.8 6.5.2 In Vivo Measurement of 90Sr ..................................................................................... 6.12 6.5.3 Recommended Periodic Bioassay Monitoring Protocol ............................................ 6.12 6.5.4 Special Monitoring for Suspected Exposures ............................................................ 6.14 6.6 Assessment of Internal Dose Equivalent............................................................................. 6.15 6.7 Management of Internal Contamination Cases ................................................................... 6.16 6.7.1 Diagnostic Procedures ............................................................................................... 6.16 6.7.2 Therapeutic Actions ................................................................................................... 6.17 6.7.3 Long-Term Bioassay Follow-Up Monitoring After an Intake................................... 6.17 6.8 Historical 90Sr Internal Dosimetry Practices at Hanford ..................................................... 6.17 6.9 References ........................................................................................................................... 6.18 7.0 Uranium ................................................................................................................................... 7.1 7.1 Sources and Characteristics................................................................................................. 7.1 7.1.1 Sources....................................................................................................................... 7.1 7.1.2 Isotopic Composition ................................................................................................. 7.2 7.1.3 Environmental Background ....................................................................................... 7.6
PNNL-MA-860 Contents Issued: January 31, 2003 Page xii Supersedes: September 30, 2000

7.2 Biokinetic Behavior............................................................................................................. 7.10 7.2.1 Transportability Class ................................................................................................ 7.10
7.2.2 Gastrointestinal Update to Blood (ƒ1 Factor)............................................................. 7.11 7.2.3 Distribution, Retention, and Excretion ...................................................................... 7.12
7.2.4 Chemical Toxicity...................................................................................................... 7.20
7.3 Internal Dosimetry Factors.................................................................................................. 7.22
7.3.1 Intake Retention and Excretion Fractions.................................................................. 7.22
7.3.2 Dose Coefficients....................................................................................................... 7.23 7.3.3 Comparison of Published Dosimetry Factors ............................................................ 7.28
7.3.4 Derived Reference Levels.......................................................................................... 7.28
7.4 Bioassay Monitoring ........................................................................................................... 7.28
7.4.1 Urine Sampling and Analysis .................................................................................... 7.38
7.4.2 In Vivo Measurements ............................................................................................... 7.40
7.4.3 Fecal Sample Measurements...................................................................................... 7.46
7.4.4 Routine Bioassay Monitoring Program...................................................................... 7.47
7.4.5 Special Monitoring for Suspected Intakes ................................................................. 7.50
7.5 Assessment of Internal Dose .............................................................................................. 7.51
7.5.1 Acute Intake Assessment ........................................................................................... 7.53 7.5.2 Chronic Intake Assessment........................................................................................ 7.53
7.5.3 Assessment of Kidney Burden and Potential Chemical Toxicity .............................. 7.55 7.6 Management of Internal Contamination Cases.................................................................... 7.56 7.7 References............................................................................................................................ 7.56
Issued: January 31, 2003 PNNL-MA-860 Contents Supersedes: September 30, 2000 Page xiii

8.0 Plutonium ................................................................................................................................... 8.1 8.1 Sources and Characteristics ................................................................................................. 8.2 8.1.1 Sources of Plutonium................................................................................................. 8.2 8.1.2 Isotope Decay Data .................................................................................................... 8.3 8.1.3 Reference Isotope Mixtures ....................................................................................... 8.4 8.2 Biokinetic Behavior ............................................................................................................. 8.11 8.2.1 Transportability Class ................................................................................................ 8.11 8.2.2 Gastrointestinal Uptake to Blood (f1 Factor).............................................................. 8.14 8.2.3 Distribution and Retention in Systemic Organs and Tissues ..................................... 8.15 8.2.4 Urinary Excretion....................................................................................................... 8.16 8.2.5 Fecal Excretion .......................................................................................................... 8.17 8.3 Internal Dosimetry Factors .................................................................................................. 8.17 8.3.1 Intake Retention and Excretion Fractions.................................................................. 8.18 8.3.2 Dose Coefficients....................................................................................................... 8.18 8.3.3 Cumulative Dose Equivalents.................................................................................... 8.25 8.3.4 Comparison of Published Dosimetry Factors ............................................................ 8.26 8.3.5 Derived Reference Levels.......................................................................................... 8.26 8.4 Bioassay Monitoring............................................................................................................ 8.29 8.4.1 General Techniques and Applicability....................................................................... 8.29 8.4.2 Urine Sampling and Analysis .................................................................................... 8.30 8.4.3 Fecal Sampling and Analysis..................................................................................... 8.32 8.4.4 In Vivo Measurements ............................................................................................... 8.33
PNNL-MA-860 Contents Issued: January 31, 2003 Page xiv Supersedes: September 30, 2000

8.4.5 Bioassay Monitoring Capability ................................................................................ 8.35 8.4.6 Recommended Bioassay Monitoring Program .......................................................... 8.74 8.4.7 Special Bioassay Monitoring ..................................................................................... 8.74 8.4.8 Bioassay Monitoring Capability for Workers with Known Plutonium Depositions ................................................................................................................ 8.75 8.5 Assessment of Internal Dose................................................................................................ 8.76 8.5.1 Intake Assessment...................................................................................................... 8.76 8.5.2 Deposition Assessment .............................................................................................. 8.77 8.5.3 Applications of Fecal Data......................................................................................... 8.78 8.5.4 Applications of Urine Data ........................................................................................ 8.78 8.5.5 Applications of In Vivo Data ..................................................................................... 8.79 8.5.6 Assessing Organ and Effective Dose Equivalents ..................................................... 8.80 8.6 Management of Internal Contamination Cases.................................................................... 8.81 8.6.1 Diagnostic Procedures ............................................................................................... 8.81 8.6.2 Therapeutic Actions ................................................................................................... 8.82 8.6.3 Long-Term Monitoring of Internal Depositions ........................................................ 8.83 8.7 References............................................................................................................................ 8.84 9.0 Americium ................................................................................................................................. 9.1 9.1 Sources and Characteristics................................................................................................. 9.1 9.2 Biokinetic Behavior............................................................................................................. 9.2 9.2.1 Transportability Class ................................................................................................ 9.3 9.2.2 Gastrointestinal Uptake to Blood (f1 Factor).............................................................. 9.3 9.2.3 Distribution and Retention in Systemic Organs and Tissues ..................................... 9.3
Issued: January 31, 2003 PNNL-MA-860 Contents Supersedes: September 30, 2000 Page xv

9.2.4 Urinary Excretion....................................................................................................... 9.6 9.2.5 Fecal Excretion .......................................................................................................... 9.7 9.3 Internal Dosimetry Factors.................................................................................................. 9.7 9.3.1 Intake Retention and Excretion Fractions.................................................................. 9.8 9.3.2 Dose Coefficients ................................................................................................. 9.8 9.3.3 Comparison of Published Dosimetry Factors ....................................................... 9.8 9.3.4 Derived Reference Levels .................................................................................... 9.13 9.4 Bioassay for Americium .................................................................................................. 9.13 9.4.1 Excreta Bioassay Techniques for Americium ...................................................... 9.13 9.4.2 In Vivo Bioassay Techniques for Americium ...................................................... 9.18 9.4.3 Recommended Periodic Bioassay Monitoring Protocol....................................... 9.22 9.4.4 Special Monitoring for Suspected Intakes............................................................ 9.22 9.4.5 Bioassay Monitoring Capability for Workers with Known Americium Depositions ........................................................................................................... 9.22 9.5 Assessment of Internal Dose............................................................................................ 9.23 9.5.1 Intake Assessment ................................................................................................ 9.23 9.5.2 Deposition Assessment......................................................................................... 9.23 9.5.3 Assessing Organ and Effective Dose Equivalents................................................ 9.24 9.6 Management of Internal Contamination Cases ................................................................ 9.25 9.6.1 Diagnostic Procedures .......................................................................................... 9.25 9.6.2 Therapeutic Actions.............................................................................................. 9.26 9.6.3 Long-Term Monitoring of Internal Depositions................................................... 9.27 9.7 References........................................................................................................................ 9.27
PNNL-MA-860 Contents Issued: January 31, 2003 Page xvi Supersedes: September 30, 2000

10.0 Other Transuranic Elements..................................................................................................... 10.1 10.1 Neptunium........................................................................................................................ 10.1 10.1.1 Sources and Characteristics .................................................................................. 10.1 10.1.2 Biokinetic Behavior.............................................................................................. 10.1 10.1.3 Internal Dosimetry Factors ................................................................................... 10.4 10.1.4 Derived Reference Levels .................................................................................... 10.5 10.1.5 Bioassay for 237Np ................................................................................................ 10.10 10.1.6 Assessment of Internal Dose ................................................................................ 10.19 10.1.7 Management of Internal Contamination Cases..................................................... 10.20 10.1.8 References ............................................................................................................ 10.23 11.0 Cobalt-60 and Corrosion Products ........................................................................................... 11.1 11.1 Sources and Characteristics of Corrosion Product Radionuclides ................................... 11.1 11.2 Biokinetic Behavior of Corrosion Product Radionuclides............................................... 11.2 11.2.1 Transportability Class........................................................................................... 11.2 11.2.2 Gastrointestinal Uptake to Blood (f1 Factor) ........................................................ 11.3 11.2.3 Biokinetic Models................................................................................................. 11.3 11.3 Internal Dosimetry Factors for Corrosion Products ......................................................... 11.5 11.3.1 Whole Body Retention for Corrosion Products.................................................... 11.5 11.3.2 Dose Coefficients ................................................................................................. 11.5 11.3.3 Comparison of Published Dosimetry Factors ....................................................... 11.7 11.3.4 Derived Reference Levels .................................................................................... 11.7 11.4 Bioassay for Corrosion Products...................................................................................... 11.8
Issued: January 31, 2003 PNNL-MA-860 Contents Supersedes: September 30, 2000 Page xvii

11.4.1 Bioassay Methods and Capabilities ...................................................................... 11.8 11.4.2 Routine Bioassay Monitoring Protocol ................................................................ 11.12 11.4.3 Special Monitoring for Suspected Intakes............................................................ 11.13 11.5 Assessment of Internal Dose............................................................................................ 11.13 11.6 Management of Internal Contamination Cases ................................................................ 11.14 11.7 References........................................................................................................................ 11.15 12.0 Iodine ....................................................................................................................................... 12.1 12.1 Sources and Characteristics of Radioiodine..................................................................... 12.1 12.2 Biokinetic Behavior ......................................................................................................... 12.2 12.2.1 Transportability Class........................................................................................... 12.2 12.2.2 Gastrointestinal Uptake to Blood (f1 Factor) ........................................................ 12.2 12.2.3 Biokinetic Model .................................................................................................. 12.2 12.3 Internal Dosimetry Factors for Radioiodines................................................................... 12.3 12.3.1 Retention and Excretion of Radioiodine............................................................... 12.3 12.3.2 Dose Coefficients ................................................................................................. 12.7 12.3.3 Comparison of Published Dosimetry Factors ....................................................... 12.7 12.3.4 Derived Reference Levels .................................................................................... 12.7 12.4 Bioassay for Radioiodines ............................................................................................... 12.12 12.4.1 Bioassay Methods and Capabilities ...................................................................... 12.12 12.4.2 Routine Bioassay Monitoring Protocol ................................................................ 12.14 12.4.3 Special Monitoring for Suspected Intakes............................................................ 12.15 12.5 Assessment of Internal Dose............................................................................................ 12.15
PNNL-MA-860 Contents Issued: January 31, 2003 Page xviii Supersedes: September 30, 2000

12.6 Management of Internal Contamination Cases ................................................................ 12.16 12.7 References........................................................................................................................ 12.17 13.0 Europium ................................................................................................................................. 13.1 13.1 Sources and Characteristics ............................................................................................. 13.1 13.2 Biokinetic Behavior of Europium .................................................................................... 13.2 13.2.1 Transportability Class........................................................................................... 13.2 13.2.2 Gastrointestinal Uptake to Blood (f1 Factor) ........................................................ 13.2 13.2.3 Biokinetic Model .................................................................................................. 13.2 13.3 Internal Dosimetry Factors for Europium........................................................................ 13.3 13.3.1 Retention of Europium ......................................................................................... 13.3 13.3.2 Dose Coefficients ................................................................................................. 13.3 13.3.3 Comparison of Published Dosimetry Factors ....................................................... 13.6 13.3.4 Derived Reference Levels .................................................................................... 13.6 13.4 Bioassay for Europium..................................................................................................... 13.7 13.4.1 Bioassay Methods and Capabilities ...................................................................... 13.7 13.4.2 Routine Bioassay Monitoring Protocol ................................................................ 13.11 13.4.3 Special Bioassay for Suspected Intakes................................................................ 13.15 13.5 Assessment of Internal Dose............................................................................................ 13.16 13.6 Management of Internal Contamination Cases ................................................................ 13.17 13.7 References........................................................................................................................ 13.17 Appendix A - Glossary ...................................................................................................................... A.1 Appendix B- Statistical Methods ....................................................................................................... B.1
Issued: January 31, 2003 PNNL-MA-860 Contents Supersedes: September 30, 2000 Page xix

Appendix C - Biokinetic Models ....................................................................................................... C.1 Appendix D - Computer Codes.......................................................................................................... D.1 Appendix E - Mixtures and Tracer Radionuclides............................................................................. E.1
PNNL-MA-860 Contents Issued: January 31, 2003 Page xx Supersedes: September 30, 2000

Figures 4.1 Tritium Bioassay Monitoring Program Detection Capability for Analytical Sensitivity of 20 dpm/ml using the ICRP 30 Retention Model................................................ 4.11 4.2 Excretion of Tritium Following Multiple Intakes Based on the ICRP 30 Model and Assuming 1-µCi Intake per Interval .................................................................................. 4.14 4.3 Tritium Urine Concentration in Occupationally Unexposed FFTF Workers........................... 4.17 6.1 90Sr Urine Excretion Following an Acute Inhalation Intake .................................................... 6.7 7.1 Urinary Extraction of Uranium in Unexposed Hanford Workers ............................................ 7.8 7.2 Uranium Lung Retention.......................................................................................................... 7.13 7.3 Uranium Urinary Excretion...................................................................................................... 7.15 7.4 Uranium Fecal Excretion ......................................................................................................... 7.17 7.5 Kidney Retention of Uranium.................................................................................................. 7.19 7.6 Daily Variability in Instantaneous Urinary Excretion from Chronic Inhalation of 1 mg/workday of Class D Uranium.......................................................................................... 7.38 7.7 Minimum Detectable Dose for Recycled Uranium Based on 0.18 µg/d Net Urine Excretion 7.42 7.8 Minimum Detectable Dose for Recycled Uranium Based on 1.5 nCi 234Th in Chest .............. 7.44 7.9 Minimum Detectable Dose for Recycled Uranium Based on 0.09 nCi 235U in Chest Count... 7.46 7.10 Minimum Detectable Dose for Recycled Uranium Based on 2-µg/d Net Fecal Excretion...... 7.48 8.1 239+240Pu/241Am Activity Ratio for Hanford Reference Plutonium Mixtures............................ 8.9 8.2 Total Alpha/241Am Activity Ratio for Hanford Reference Plutonium Mixtures...................... 8.10 8.3 Total Alpha/239+240Pu Activity Ratio for Hanford Reference Plutonium Mixtures .................. 8.10 8.4 241Am/Total Alpha Activity Ratio for Hanford Reference Plutonium Mixtures...................... 8.11 8.5 239Pu Lung Retention................................................................................................................ 8.19 8.6 239Pu Urinary Excretion............................................................................................................ 8.20 8.7 239Pu Fecal Excretion................................................................................................................ 8.21 8.8 Feces-to-Urine Excretion Ratios for 239Pu Intakes ................................................................... 8.22 8.9 Minimum Detectable Committed Effective Doses for 10-Year Aged Weapons-Grade Plutonium Based on Detection of 0.02 dpm/d 239Pu in Urine .................................................. 8.37 8.10 Minimum Detectable Committed Effective Doses for 20-Year Aged Weapons-Grade Plutonium Based on Detection of 0.02 dpm/d 239Pu in Urine .................................................. 8.38 8.11 Minimum Detectable Committed Effective Doses for 40-Year Aged Weapons-Grade Plutonium Based on Detection of 0.02 dpm/d 239Pu in Urine .................................................. 8.39 8.12 Minimum Detectable Committed Effective Doses for 10-Year Aged Fuel-Grade Plutonium Based on Detection of 0.02 dpm/d 239Pu in Urine .................................................. 8.40 8.13 Minimum Detectable Committed Effective Doses for 20-Year Aged Fuel-Grade Plutonium Based on Detection of 0.02 dpm/d 239Pu in Urine .................................................. 8.41 8.14 Minimum Detectable Committed Effective Doses for 40-Year Aged Fuel-Grade Plutonium Based on Detection of 0.02 dpm/d 239Pu in Urine .................................................. 8.42
Issued: January 31, 2003 PNNL-MA-860 Contents Supersedes: September 30, 2000 Page xxi

8.15 Minimum Detectable Bone Surface Dose for 10-Year Aged Weapons-Grade Plutonium Based on Detection of 0.02 dpm/d 239Pu in Urine.................................................... 8.43 8.16 Minimum Detectable Bone Surface Dose for 20-Year Aged Weapons-Grade Plutonium Based on Detection of 0.02 dpm/d 239Pu in Urine.................................................... 8.44 8.17 Minimum Detectable Bone Surface Dose for 40-Year Aged Weapons-Grade Plutonium Based on Detection of 0.02 dpm/d 239Pu in Urine.................................................... 8.45 8.18 Minimum Detectable Bone Surface Dose for 10-Year Aged Fuel-Grade Plutonium Based on Detection of 0.02 dpm/d 239Pu in Urine ..................................................................... 8.46 8.19 Minimum Detectable Bone Surface Dose for 20-Year Aged Fuel-Grade Plutonium Based on Detection of 0.02 dpm/d 239Pu in Urine ..................................................................... 8.47 8.20 Minimum Detectable Bone Surface Dose for 40-Year Aged Fuel-Grade Plutonium Based on Detection of 0.02 dpm/d 239Pu in Urine ..................................................................... 8.48 8.21 Minimum Detectable Committed Effective Doses for 10-Year Aged Weapons-Grade Plutonium Based on Detection of 0.2 nCi 241Am in the Lungs.................................................. 8.49 8.22 Minimum Detectable Committed Effective Doses for 20-Year Aged Weapons-Grade Plutonium Based on Detection of 0.2 nCi 241Am in the Lungs.................................................. 8.50 8.23 Minimum Detectable Committed Effective Doses for 40-Year Aged Weapons-Grade Plutonium Based on Detection of 0.2 nCi 241Am in the Lungs.................................................. 8.51 8.24 Minimum Detectable Committed Effective Doses for 10-Year Aged Fuel-Grade Plutonium Based on Detection of 0.2 nCi 241Am in the Lungs.................................................. 8.52 8.25 Minimum Detectable Committed Effective Doses for 20-Year Aged Fuel-Grade Plutonium Based on Detection of 0.2 nCi 241Am in the Lungs.................................................. 8.53 8.26 Minimum Detectable Committed Effective Doses for 40-Year Aged Fuel-Grade Plutonium Based on Detection of 0.2 nCi 241Am in the Lungs.................................................. 8.54 8.27 Minimum Detectable Bone Surface Doses for 10-Year Aged Weapons-Grade Plutonium Based on Detection of 0.2 nCi 241Am in the Lungs ................................................................... 8.55 8.28 Minimum Detectable Bone Surface Doses for 20-Year Aged Weapons-Grade Plutonium Based on Detection of 0.2 nCi 241Am in the Lungs ................................................................... 8.56 8.29 Minimum Detectable Bone Surface Doses for 40-Year Aged Weapons-Grade Plutonium Based on Detection of 0.2 nCi 241Am in the Lungs ................................................................... 8.57 8.30 Minimum Detectable Bone Surface Doses for 10-Year Aged Fuel-Grade Plutonium Based on Detection of 0.2 nCi 241Am in the Lungs ................................................................... 8.58 8.31 Minimum Detectable Bone Surface Doses for 20-Year Aged Fuel-Grade Plutonium Based on Detection of 0.2 nCi 241Am in the Lungs ................................................................... 8.59 8.32 Minimum Detectable Bone Surface Doses for 40-Year Aged Fuel-Grade Plutonium Based on Detection of 0.2 nCi 241Am in the Lungs ................................................................... 8.60 8.33 Minimum Detectable Committed Effective Doses for 10-Year Aged Weapons-Grade Plutonium Based on Detection of 0.2 dpm/d 239Pu in Feces...................................................... 8.62 8.34 Minimum Detectable Committed Effective Doses for 20-Year Aged Weapons-Grade Plutonium Based on Detection of 0.2 dpm/d 239Pu in Feces...................................................... 8.63 8.35 Minimum Detectable Committed Effective Doses for 40-Year Aged Weapons-Grade Plutonium Based on Detection of 0.2 dpm/d 239Pu in Feces...................................................... 8.64 8.36 Minimum Detectable Committed Effective Doses for 10-Year Aged Fuel-Grade Plutonium Based on Detection of 0.2 dpm/d 239Pu in Feces...................................................... 8.65
PNNL-MA-860 Contents Issued: January 31, 2003 Page xxii Supersedes: September 30, 2000

8.37 Minimum Detectable Committed Effective Doses for 20-Year Aged Fuel-Grade Plutonium Based on Detection of 0.2 dpm/d 239Pu in Feces...................................................... 8.66 8.38 Minimum Detectable Committed Effective Doses for 40-Year Aged Fuel-Grade Plutonium Based on Detection of 0.2 dpm/d 239Pu in Feces...................................................... 8.67 8.39 Minimum Detectable Bone Surface Doses for 10-Year Aged Weapons-Grade Plutonium Based on Detection of 0.2 dpm/d 239Pu in Feces...................................................... 8.68 8.40 Minimum Detectable Bone Surface Doses for 20-Year Aged Weapons-Grade Plutonium Plutonium Based on Detection of 0.2 dpm/d 239Pu in Feces...................................................... 8.69 8.41 Minimum Detectable Bone Surface Doses for 40-Year Aged Weapons-Grade Plutonium Plutonium Based on Detection of 0.2 dpm/d 239Pu in Feces...................................................... 8.70 8.42 Minimum Detectable Bone Surface Doses for 10-Year Aged Fuel-Grade Plutonium Plutonium Based on Detection of 0.2 dpm/d 239Pu in Feces...................................................... 8.71 8.43 Minimum Detectable Bone Surface Doses for 20-Year Aged Fuel-Grade Plutonium Plutonium Based on Detection of 0.2 dpm/d 239Pu in Feces .................................................... 8.72 8.44 Minimum Detectable Bone Surface Doses for 40-Year Aged Fuel-Grade Plutonium Plutonium Based on Detection of 0.2 dpm/d 239Pu in Feces .................................................... 8.73 9.1 Liver Retention for Americium - Model Comparison.............................................................. 9.6 9.2 241Am Lung Retention .............................................................................................................. 9.9 9.3 241Am Urine Excretion Fractions ............................................................................................. 9.10 9.4 241Am Fecal Excretion Fractions.............................................................................................. 9.11 9.5 Minimum Detectable Committed Effective Dose Equivalent for 241Am Based on Detection of 0.02 dpm/d 241Am in Urine.................................................................................. 9.16 9.6 Minimum Detectable Bone Surfaces Dose Equivalent for 241Am Based on Detection of 0.02 dpm/d 241Am in Urine.................................................................................. 9.17 9.7 Minimum Detectable Committed Effective Doses for 241Am Based on Detection of 0.8 dpm/d 241Am in Feces......................................................................................................... 9.19 9.8 Minimum Detectable Committed Bone Surface Doses for 241Am Based on Detection of 0.8 dpm/d 241Am in Feces......................................................................................................... 9.20 9.9 Minimum Detectable Committed Doses for 241Am Based on Detection of 0.2 nCi 241Am in the Lung .................................................................................................................... 9.21 10.1 237Np Lung Retention ............................................................................................................... 10.6 10.2 237Np Urine Excretion Fractions............................................................................................... 10.7 10.3 237Np Fecal Excretion Fractions ............................................................................................... 10.8 10.4 Minimum Detectable Committed Effective Doses for 237Np Based on Detection of 0.02 dpm/d in Urine ................................................................................................................. 10.13 10.5 Minimum Detectable Committed Bone Surface Doses for 237Np Based on Detection of 0.02 dpm/d in Urine ................................................................................................................. 10.14 10.6 Minimum Detectable Committed Effective Doses for 237Np Based on Detection of 0.1 dpm/d in Feces ................................................................................................................... 10.16 10.7 Minimum Detectable Committed Bone Surface Doses for 237Np Based on Detection of 0.1 dpm/d in Feces ................................................................................................................... 10.17
Issued: January 31, 2003 PNNL-MA-860 Contents Supersedes: September 30, 2000 Page xxiii

Tables 2.1 Comparison of Radiation Quality Factors ................................................................................. 2.1 2.2 Comparison of Organ/Tissue Weighting Factors ...................................................................... 2.2 4.1 Hanford Tritiated Water Dosimetry Factors .............................................................................. 4.3 4.2 Comparison of Tritium Dose Factors ........................................................................................ 4.7 4.3 Single Acute Intake Derived Reference Levels for Tritium Urine Excretion............................ 4.10 4.4 Multiple Acute Intake Derived Reference Levels for Tritium Urine Excretion ........................ 4.10 4.5 Minimum Detectable Intakes and Doses for Acute Tritium Intake Based on the ICRP 30 Retention Model and Analytical Sensitivity of 20 dpm/ml in Body Water .......... 4.11 4.6 Minimum Detectable Intakes and Doses for Acute Tritium Intakes, Assuming the
ICRP 56 Two-Component Body Water Retention Model and an Analytical Sensitivity of 20 dpm/ml in Body Water ................................................................................... 4.12
5.1 Summary of 137Cs Hanford Dosimetric Data ............................................................................. 5.1 5.2 137Cs Whole Body Retention Fractions...................................................................................... 5.5 5.3 137Cs Urine Excretion Fractions................................................................................................. 5.5 5.4 137Cs Feces Excretion Fractions................................................................................................. 5.5 5.5 137Cs Whole Body Reference Levels for 1-µm-AMAD Class D Inhalation.............................. 5.8 5.6 137Cs Whole Body Reference Levels for 5-µm-AMAD Class D Inhalation.............................. 5.8 5.7 137Cs Urine Excretion Reference Levels for 1-µm-AMAD Particles ........................................ 5.9 5.8 137Cs Urine Excretion Reference Levels for 5-µm-AMAD Particles ........................................ 5.9 5.9 Comparison of 137Cs Dosimetric Factors ................................................................................... 5.11 5.10 Minimum Detectable Intakes and Doses (HE, 50) for 1-µm-AMAD Inhalation Using the NaI Detector System.................................................................................................................. 5.13 5.11 Minimum Detectable Intakes and Doses (HE, 50) for 5-µm-AMAD Inhalation Using the NaI Detector System.................................................................................................................. 5.13 5.12 Minimum Detectable Intakes and Doses (HE, 50) for 1-µm-AMAD Inhalation Using the Coaxial Germanium Detector System ....................................................................................... 5.14 5.13 Minimum Detectable Intakes and Doses (HE, 50) for 5-µm-AMAD Inhalation Using the Coaxial Germanium Detector System ....................................................................................... 5.14 5.14 Minimum Detectable Intakes and Doses (HE, 50) for 1-µm-AMAD Inhalation Using Urinalysis Gamma Spectrometry............................................................................................... 5.15 5.15 Minimum Detectable Intakes and Doses (HE, 50) for 5-µm-AMAD Inhalation Using Urinalysis Gamma Spectrometry............................................................................................... 5.15 6.1 Summary of 90Sr Hanford Dosimetric Data............................................................................... 6.1 6.2 90Sr Fission Product Yields........................................................................................................ 6.2 6.3 Decay Data for Strontium Isotopes............................................................................................ 6.2 6.4 90Sr Urine Excretion Fractions................................................................................................... 6.6 6.5 90Sr Fecal Excretion Fractions ................................................................................................... 6.6
Issued: January 31, 2003 PNNL-MA-860 Contents Supersedes: September 30, 2000 Page xxv

6.6 Hanford 90Sr Dose Coefficients for Significant Organs............................................................. 6.8 6.7 Comparison of Dosimetric Factors for Soluble 90Sr .................................................................. 6.9 6.8 90Sr Urine Excretion Reference Levels for Class D Inhalation of 1-µm-AMAD Particles ....... 6.10 6.9 90Sr Urine Excretion Reference Levels for Class D Inhalation of 5-µm-AMAD Particles ....... 6.10 6.10 90Sr Urine Excretion Reference Levels for Class Y Inhalation of 1-µm-AMAD Particles ....... 6.11 6.11 90Sr Urine Excretion Reference Levels for Class Y Inhalation of 5-µm-AMAD Particles ....... 6.11 6.12 Hanford Bioassay Program Capability for 90Sr in Urine for Class D Inhalation ....................... 6.13 6.13 Hanford Bioassay Program Capability for 90Sr in Urine for Class Y Inhalation ....................... 6.13 6.14 Hanford Bioassay Program Capability for 90Sr in Urine for Transportable Injection and Soluble Ingestion Intakes .................................................................................................... 6.14 7.1 Types and Enrichment of Uranium Expected in Hanford Facilities .......................................... 7.3 7.2 Uranium Decay Data ................................................................................................................. 7.3 7.3 Radiological Characteristics of Uranium Mixtures ................................................................... 7.4 7.4 Impurities in Recycled Uranium at Hanford.............................................................................. 7.5 7.5 Environmental Levels of Uranium............................................................................................. 7.6 7.6 Inhalation Class, Lung Absorption Type, and f1 Factors for Occupational Exposure to Uranium Compounds............................................................................................................. 7.11 7.7 Lung Retention Fractions Following Uranium Inhalation......................................................... 7.13 7.8 Urine Excretion Fractions Following Uranium Intake .............................................................. 7.14 7.9 Fecal Excretion Fractions Following Intake of Uranium........................................................... 7.16 7.10 Kidney Retention Fractions Following Uranium Intake............................................................ 7.18 7.11 Committed Dose Coefficients for Acute Intakes of 238U ........................................................... 7.24 7.12 Committed Dose Coefficients for Acute Intakes of 236U ........................................................... 7.24 7.13 Committed Dose Coefficients for Acute Intakes of 235U ........................................................... 7.25 7.14 Committed Dose Coefficients for Acute Intakes of 234U ........................................................... 7.25 7.15 Dose Coefficients for Recycled Uranium Constituents ............................................................. 7.26 7.16 Committed Dose Coefficients for Acute Intakes of Uranium Mixtures .................................... 7.27 7.17 Comparison of Selected Published Dosimetry Factors for 238U ................................................ 7.29 7.18 Urine Excretion Reference Levels and Derived Reference Levels for Class D Inhalation of Recycled Uranium ................................................................................................................. 7.30 7.19 Urine Excretion Reference Levels and Derived Reference Levels for Class W Inhalation of Recycled Uranium ................................................................................................................. 7.31 7.20 Urine Excretion Reference Levels and Derived Reference Levels for Class Y Inhalation of Recycled Uranium ................................................................................................................. 7.32 7.21 Urine Excretion Reference Levels and Derived Reference Levels for Ingestion of Recycled Uranium ..................................................................................................................... 7.33 7.22 Chest Count Reference Levels and 234Th Derived Reference Levels for Class W Inhalation of Recycled Uranium ................................................................................................................. 7.34 7.23 Chest Count Reference Levels and 234Th Derived Reference Levels for Class Y Inhalation of Recycled Uranium ................................................................................................................. 7.35 7.24 Chest Count Reference Levels and 235U Derived Reference Levels for Class W Inhalation of Recycled Uranium ................................................................................................................. 7.36
PNNL-MA-860 Contents Issued: January 31, 2003 Page xxvi Supersedes: September 30, 2000

7.25 Chest Count Reference Levels and 235U Derived Reference Levels for Class Y Inhalation of Recycled Uranium ................................................................................................................. 7.37 7.26 Natural Uranium Background Levels for Hanford Bioassay Urinalysis ................................... 7.40 7.27 Minimum Detectable Intakes of Uranium Based on 0.18 mg/d in Urine .................................. 7.41 7.28 Minimum Detectable Committed Effective Dose Equivalents for Recycled Uranium Based on 0.18 mg/d in Urine ................................................................................................................ 7.42 7.29 Minimum Detectable Intakes of Recycled Uranium Based on 1.5 nCi 234Th in Chest Count...................................................................................... 7.43 7.30 Minimum Detectable Committed Effective Dose Equivalents for Recycled Uranium Based on 1.5 nCi 234Th in Chest Count...................................................................................... 7.44 7.31 Minimum Detectable Intakes of Recycled Uranium Based on 0.09 nCi 235U in Chest Count ................................................................................... 7.45 7.32 Minimum Detectable Committed Effective Dose Equivalents for Recycled Uranium Based on 0.09 nCi 235U in Chest Count ..................................................................................... 7.45 7.33 Minimum Detectable Intakes of Uranium Based on 2 mg/d in Feces ....................................... 7.47 7.34 Minimum Detectable Committed Effective Dose Equivalents for Recycled Uranium Based on 2-mg/d in Feces ........................................................................................................... 7.48 8.1 Plutonium and Americium Decay Data ..................................................................................... 8.3 8.2 Reference Hanford Plutonium Mixtures Prior to Aging............................................................ 8.5 8.3 Activity Composition of Hanford Reference Weapons-Grade Plutonium Mixture................... 8.6 8.4 Activity Composition of Hanford Reference Fuel-Grade Plutonium Mixture .......................... 8.7 8.5 Activity Composition of Hanford Reference Commercial Power-Grade Plutonium Mixture... 8.8 8.6 Lung Retention for 1-µm and 5-µm-AMAD Particles Plutonium Inhalation Intake................. 8.19 8.7 239Pu Urine Excretion Fractions for Instantaneous Uptake, Inhalation, and Ingestion Intakes.. 8.20 8.8 239Pu Fecal Excretion Fractions for Instantaneous Uptake, Inhalation, and Ingestion Intakes .. 8.21 8.9 Fecal-to-Urine Ratios for 239Pu Intakes...................................................................................... 8.22 8.10 Committed Dose Coefficients for Acute Intakes of 238Pu ......................................................... 8.23 8.11 Committed Dose Coefficients for Acute Intakes of 239Pu and/or 240Pu ..................................... 8.23 8.12 Committed Dose Coefficients for Acute Intakes of 241Pu ......................................................... 8.24 8.13 Committed Dose Coefficients for Acute Intakes of 241Am in a Plutonium Matrix ................... 8.24 8.14 Committed Dose Coefficients for Acute Intakes of Weapon-Grade Plutonium........................ 8.26 8.15 Committed Dose Coefficients for Acute Intakes of Hanford Fuel-Grade Plutonium Mixtures 8.27 8.16 Cumulative Effective Dose Equivalent for 239Pu Intakes........................................................... 8.27 8.17 Comparison of Selected Published Dosimetry Factors for 239Pu ............................................... 8.28 8.18 Detection Limits for Routine Hanford Analyses of Plutonium in Urine ................................... 8.31 8.19 Minimum Detectable Intakes of 239Pu Based on Detection of 0.02 dpm/d in Urine.................. 8.36 8.20 Minimum Detectable Committed Effective Dose Equivalent for 10-Year Aged Weapons-Grade Plutonium Based on Detection of 0.02 dpm/d 239Pu in Urine ......................... 8.37 8.21 Minimum Detectable Committed Effective Dose Equivalent for 20-Year Aged Weapons-Grade Plutonium Based on Detection of 0.02 dpm/d 239Pu in Urine ......................... 8.38 8.22 Minimum Detectable Committed Effective Dose Equivalent for 40-Year Aged Weapons-Grade Plutonium Based on Detection of 0.02 dpm/d 239Pu in Urine ......................... 8.39
Issued: January 31, 2003 PNNL-MA-860 Contents Supersedes: September 30, 2000 Page xxvii

8.23 Minimum Detectable Committed Effective Dose Equivalent for 10-Year Aged Fuel-Grade Plutonium Based on Detection of 0.02 dpm/d 239Pu in Urine................................. 8.40 8.24 Minimum Detectable Committed Effective Dose Equivalent for 20-Year Aged Fuel-Grade Plutonium Based on Detection of 0.02 dpm/d 239Pu in Urine................................. 8.41 8.25 Minimum Detectable Committed Effective Dose Equivalent for 40-Year Aged Fuel-Grade Plutonium Based on Detection of 0.02 dpm/d 239Pu in Urine................................. 8.42 8.26 Minimum Detectable Committed Bone Surfaces Dose Equivalent for 10-Year Aged Weapons-Grade Plutonium Based on Detection of 0.02 dpm/d 239Pu in Urine ............... 8.43 8.27 Minimum Detectable Committed Bone Surfaces Dose Equivalent for 20-Year Aged Weapons-Grade Plutonium Based on Detection of 0.02 dpm/d 239Pu in Urine ............... 8.44 8.28 Minimum Detectable Committed Bone Surfaces Dose Equivalent for 40-Year Aged Weapons-Grade Plutonium Based on Detection of 0.02 dpm/d 239Pu in Urine ............... 8.45 8.29 Minimum Detectable Committed Bone Surfaces Dose Equivalent for 10-Year Aged Fuel-Grade Plutonium Based on Detection of 0.02 dpm/d 239Pu in Urine ....................... 8.46 8.30 Minimum Detectable Committed Bone Surfaces Dose Equivalent for 20-Year Aged Fuel-Grade Plutonium Based on Detection of 0.02 dpm/d 239Pu in Urine ....................... 8.47 8.31 Minimum Detectable Committed Bone Surfaces Dose Equivalent for 40-Year Aged Fuel-Grade Plutonium Based on Detection of 0.02 dpm/d 239Pu in Urine ....................... 8.48 8.32 Minimum Detectable Committed Effective Dose Equivalent for 10-Year Aged Weapons-Grade Plutonium Based on Detection of 0.2 nCi 241Am in the Lungs....................... 8.49 8.33 Minimum Detectable Committed Effective Dose Equivalent for 20-Year Aged Weapons-Grade Plutonium Based on Detection of 0.2 nCi 241Am in the Lungs....................... 8.50 8.34 Minimum Detectable Committed Effective Dose Equivalent for 40-Year Aged Weapons-Grade Plutonium Based on Detection of 0.2 nCi 241Am in the Lungs....................... 8.51 8.35 Minimum Detectable Committed Effective Dose Equivalent for 10-Year Aged Fuel-Grade Plutonium Based on Detection of 0.2 nCi 241Am in the Lungs............................... 8.52 8.36 Minimum Detectable Committed Effective Dose Equivalent for 20-Year Aged Fuel-Grade Plutonium Based on Detection of 0.2 nCi 241Am in the Lungs............................... 8.53 8.37 Minimum Detectable Committed Effective Dose Equivalent for 40-Year Aged Fuel-Grade Plutonium Based on Detection of 0.2 nCi 241Am in the Lungs............................... 8.54 8.38 Minimum Detectable Committed Bone Surface Doses for 10-Year Aged Weapons-Grade Plutonium Based on Detection of 0.2 nCi 241Am in the Lungs.................................................. 8.55 8.39 Minimum Detectable Committed Bone Surface Doses for 20-Year Aged Weapons-Grade Plutonium Based on Detection of 0.2 nCi 241Am in the Lungs.................................................. 8.56 8.40 Minimum Detectable Committed Bone Surface Doses for 40-Year Aged Weapons-Grade Plutonium Based on Detection of 0.2 nCi 241Am in the Lungs.................................................. 8.57 8.41 Minimum Detectable Committed Bone Surface Dose Equivalent for 10-Year Aged Fuel-Grade Plutonium Based on Detection of 0.2 nCi 241Am in the Lungs ..................... 8.58 8.42 Minimum Detectable Committed Bone Surface Dose Equivalent for 20-Year Aged Fuel-Grade Plutonium Based on Detection of 0.2 nCi 241Am in the Lungs .................... 8.59 8.43 Minimum Detectable Committed Bone Surface Dose Equivalent for 40-Year Aged Fuel-Grade Plutonium Based on Detection of 0.2 nCi 241Am in the Lungs .................... 8.60 8.44 Minimum Detectable Intakes (nCi) of 239Pu Based on Detection of 0.2 dpm/d in Feces .......... 8.61
PNNL-MA-860 Contents Issued: January 31, 2003 Page xxviii Supersedes: September 30, 2000

8.45 Minimum Detectable Committed Effective Dose Equivalent for 10-Year Aged Weapons-Grade Plutonium Based on Detection of 0.2 dpm/d 239Pu in Feces ........................... 8.62 8.46 Minimum Detectable Committed Effective Dose Equivalent for 20-Year Aged Weapons-Grade Plutonium Based on Detection of 0.2 dpm/d 239Pu in Feces ........................... 8.63 8.47 Minimum Detectable Committed Effective Dose Equivalent for 40-Year Aged Weapons-Grade Plutonium Based on Detection of 0.2 dpm/d 239Pu in Feces ........................... 8.64 8.48 Minimum Detectable Committed Effective Dose Equivalent for 10-Year Aged Fuel-Grade Plutonium Based on Detection of 0.2 dpm/d 239Pu in Feces................................... 8.65 8.49 Minimum Detectable Committed Effective Dose Equivalent for 20-Year Aged Fuel-Grade Plutonium Based on Detection of 0.2 dpm/d 239Pu in Feces................................... 8.66 8.50 Minimum Detectable Committed Effective Dose Equivalent for 40-Year Aged Fuel-Grade Plutonium Based on Detection of 0.2 dpm/d 239Pu in Feces................................... 8.67 8.51 Minimum Detectable Committed Bone Surface Dose Equivalent for 10-Year Aged Weapons-Grade Plutonium Based on Detection of 0.2 dpm/d 239Pu in Feces ........................... 8.68 8.52 Minimum Detectable Committed Bone Surface Dose Equivalent for 20-Year Aged Weapons-Grade Plutonium Based on Detection of 0.2 dpm/d 239Pu in Feces ........................... 8.69 8.53 Minimum Detectable Committed Bone Surface Dose Equivalent for 40-Year Aged Weapons-Grade Plutonium Based on Detection of 0.2 dpm/d 239Pu in Feces ................. 8.70 8.54 Minimum Detectable Committed Bone Surface Dose Equivalent for 10-Year Aged Fuel-Grade Plutonium Based on Detection of 0.2 dpm/d 239Pu in Feces ......................... 8.71 8.55 Minimum Detectable Committed Bone Surface Dose Equivalent for 20-Year Aged Fuel-Grade Plutonium Based on Detection of 0.2 dpm/d 239Pu in Feces ......................... 8.72 8.56 Minimum Detectable Committed Bone Surface Dose Equivalent for 40-Year Aged Fuel-Grade Plutonium Based on Detection of 0.2 dpm/d 239Pu in Feces ........................ 8.73 9.1 Radiological Decay Data for Americium .................................................................................. 9.2 9.2 Lung Retention Fractions for Class W Inhalation of 241Am ...................................................... 9.9 9.3 Urine Excretion Fractions for 241Am Intakes ............................................................................. 9.10 9.4 Fecal Excretion Fractions for 241Am Intakes ............................................................................. 9.11 9.5 Committed Dose Coefficients for Acute Intakes of 241Am........................................................ 9.12 9.6 Comparison of Dosimetric Factors for 241Am............................................................................ 9.12 9.7 241Am Reference Levels and Urine Excretion Derived Reference Levels for Class W Inhalation..................................................................................................................... 9.14 9.8 241Am Reference Levels and Chest Count Derived Reference Levels for Class W Inhalation..................................................................................................................... 9.14 9.9 Minimum Detectable Intakes for 241Am Based on Detection of 0.02 dpm/d 241Am in Urine ........................................................................................................................... 9.15 9.10 Minimum Detectable Committed Effective Dose Equivalent for 241Am Based on Detection of 0.02 dpm/d 241Am in Urine.................................................................... 9.16 9.11 Minimum Detectable Bone Surfaces Dose Equivalent for 241Am Based on Detection of 0.02 dpm/d 241Am in Urine.................................................................... 9.17 9.12 Minimum Detectable Intakes for 241Am Based on Detection of 0.8 dpm/d 241Am in Feces ........................................................................................................................... 9.18
Issued: January 31, 2003 PNNL-MA-860 Contents Supersedes: September 30, 2000 Page xxix

9.13 Minimum Detectable Committed Effective Dose Equivalent for 241Am Based on Detection of 0.8 dpm/d 241Am in Feces...................................................................... 9.19 9.14 Minimum Detectable Committed Bone Surface Dose Equivalents for 241Am Based on Detection of 0.8 dpm/d 241Am in Feces...................................................................... 9.20 9.15 Minimum Detectable Intakes and Committed Doses for Class W Inhalation of 241Am Based on Detection of 0.2 nCi 241Am by Chest Counting............................................... 9.21 10.1 Radiological Decay Data for Neptunium ............................................................................... 10.2 10.2 Lung Retention Fractions for Class W Inhalation of 237Np .................................................... 10.6 10.3 Urine Excretion Fractions for 237Np Intakes........................................................................... 10.7 10.4 Fecal Excretion Fractions for 237Np Intakes ........................................................................... 10.8 10.5 Committed Dose Coefficients for Acute Intakes of 237Np...................................................... 10.9 10.6 Comparison of Dosimetric Factors for 237Np ......................................................................... 10.9 10.7 237Np Urine Excretion Reference Levels and Derived Reference Levels for Class W Inhalation ................................................................................................................. 10.10 10.8 237Np Chest Count Reference Levels and Derived Reference Levels for Class W Inhalation................................................................................................................................ 10.11 10.9 Minimum Detectable Intakes for 237Np Based on Detection of 0.02 dpm/d 237Np in Urine................................................................................................................................... 10.12 10.10 Minimum Detectable Committed Effective Dose Equivalent for 237Np Based on Detection of 0.02 dpm/d 237Np in Urine ................................................................. 10.13 10.11 Minimum Detectable Committed Bone Surfaces Dose Equivalent for 237Np Based on Detection of 0.02 dpm/d 237Np in Urine ................................................................. 10.14 10.12 Minimum Detectable Intakes for 237Np Based on Detection of 0.1 dpm/d 237Np in Feces................................................................................................................................... 10.15 10.13 Minimum Detectable Committed Effective Dose Equivalent for 237Np Based on Detection of 0.1 dpm/d 237Np in Feces ................................................................... 10.16 10.14 Minimum Detectable Committed Bone Surface Dose Equivalents for 237Np Based on Detection of 0.1 dpm/d 237Np in Feces ................................................................... 10.17 10.15 Activity and Mass Ratios for Plutonium and 237Np Mixtures Resulting in 237Np Contributing 25% of the Total Committed Effective Dose Equivalent.................................. 10.19 11.1 Radiological Data for Common Corrosion Products.............................................................. 11.1 11.2 Lung Absorption and GI Uptake Factors for Corrosion Product Elements............................ 11.3 11.3 Whole Body Retention for 60Co ............................................................................................. 11.6 11.4 Whole Body Retention for 54Mn............................................................................................. 11.6 11.5 Whole Body Retention for 59Fe .............................................................................................. 11.7 11.6 Dose Coefficients (he,50) for Corrosion Products (rem/nCi) ................................................... 11.7 11.7 Comparison of Dosimetric Factors for 60Co ........................................................................... 11.8 11.8 60Co Whole Body Reference Levels for 1-µm-AMAD Class Y Inhalation ........................... 11.9 11.9 60Co Whole Body Reference Levels for 5-µm-AMAD Class Y Inhalation ........................... 11.9 11.10 60Co Whole Body Reference Levels for Ingestion (f1 = 0.05) ............................................... 11.10 11.11 60Co Minimum Detectable Intakes and Doses (HE,50) for 1-µm-AMAD Class Y Inhalation .................................................................................................................. 11.11
PNNL-MA-860 Contents Issued: January 31, 2003 Page xxx Supersedes: September 30, 2000

11.12 60Co Minimum Detectable Intakes and Doses (HE,50) for 5-µm-AMAD Class Y Inhalation .................................................................................................................. 11.11 11.13 60Co Minimum Detectable Intakes and Doses (HE,50) for Ingestion ....................................... 11.12 12.1 Radiological Data for Radioiodines ....................................................................................... 12.1 12.2 Retention and Excretion for 131I.............................................................................................. 12.4 12.3 Retention and Excretion for 129I.............................................................................................. 12.5 12.4 Retention and Excretion for 125I.............................................................................................. 12.6 12.5 Committed Dose Coefficients for Radioiodines (rem/nCi) .................................................... 12.7 12.6 Comparison of Dosimetric Factors for Soluble 131I................................................................ 12.8 12.7 Reference Levels and Derived Reference Levels for 131I ....................................................... 12.9 12.8 Reference Levels and Derived Reference Levels for 129I ....................................................... 12.10 12.9 Reference Levels and Derived Reference Levels for 125I ....................................................... 12.11 12.10 131I Minimum Detectable Intakes and Doses (HE,50 and Thyroid Ht,50) for 5-µm-AMAD Class D Inhalation .................................................................................................................. 12.13 12.11 129I and 125I Minimum Detectable Intakes and Doses (HE,50 and Thyroid Ht,50) for 5-µm-AMAD Class D Inhalation ..................................................................................... 12.14 13.1 Radiological Data for Hanford Europiums............................................................................. 13.1 13.2 Fractional Retention of Inhalation Class W Europium........................................................... 13.4 13.3 Fractional Retention of Ingested Europium............................................................................ 13.5 13.4 Committed Dose Coefficients for Europium (rem/nCi acute intake) ..................................... 13.5 13.5 Comparison of Dosimetric Factors for 154Eu.......................................................................... 13.6 13.6 Reference Levels and Derived Reference Levels for 152Eu .................................................... 13.8 13.7 Reference Levels and Derived Reference Levels for 154Eu .................................................... 13.9 13.8 Reference Levels and Derived Reference Levels for 155Eu .................................................... 13.10 13.9 Hanford In Vivo Measurement Detection Capability for 152Eu, 154Eu, and 155Eu, nCi........... 13.11 13.10 154Eu Minimum Detectable Intakes and Doses (HE,50) for 0.5-µm-AMAD Class W Inhalation ................................................................................................................. 13.12 13.11 154Eu Minimum Detectable Intakes and Doses (HE,50) for 5-µm-AMAD Class W Inhalation ................................................................................................................. 13.12 13.12 154Eu Minimum Detectable Intakes and Doses (HE,50) for Ingestion ...................................... 13.13 13.13 152Eu Minimum Detectable Intakes and Doses (HE,50) for 0.5-µm-AMAD Class W Inhalation ................................................................................................................. 13.13 13.14 152Eu Minimum Detectable Intakes and Doses (HE,50) for 5-µm-AMAD Class W Inhalation ................................................................................................................. 13.14 13.15 152Eu Minimum Detectable Intakes and Doses (HE,50) for Ingestion ...................................... 13.14
Issued: January 31, 2003 PNNL-MA-860 Contents Supersedes: September 30, 2000 Page xxxi

1.0 Introduction
The Hanford Internal Dosimetry Program (HIDP) provides internal dosimetry support services for operations at the Hanford Site. The HIDP is staffed and managed by the Radiation and Health Technology group, within the Pacific Northwest National Laboratory (PNNL). Operations supported by the HIDP include research and development, the decontamination and decommissioning of facilities formerly used to produce and purify plutonium, and waste management activities. Radioelements of particular interest are plutonium, uranium, americium, and tritium and the fission and activation product radionuclides 137Cs, 90Sr, and 60Co. This manual describes the technical basis for the design of the routine bioassay monitoring program and for assessment of internal dose. The purposes of the manual are to
• provide assurance that the HIDP derives from a sound
technical base • promote the consistency and continuity of routine program
activities • provide a historical record
• serve as a technical reference for radiation protection personnel
• aid in identifying and planning for future needs.
The internal dosimetry philosophy documented in this manual is based on the concepts of dose equivalent and effective dose equivalent described in publications 26 and 30 of the International Commission on Radiological Protection (ICRP 1977; 1979). The committed dose equivalents (doses integrated over a period of 50 years following intake) are the basis for evaluating compliance with regard to the 10 CFR 835.202 dose limits of 5 rem/y for effective dose equivalent and 50 rem/y for single organs and tissues.
1.1 Document Description
This manual establishes the science underlying internal dosimetry as practiced by the HIDP. The general methods chapter describes the fundamental principles used for internal dose calculations, and subsequent chapters deal with specific radioelements or a related group of radionuclides. The appendixes (beginning with a glossary
Issued: January 31, 2003 PNNL-MA-860 Chapter 1.0 Page 1.1

in Appendix A) provide information that is general to all of the chapters. Radionuclides not specifically mentioned are rarely encountered at levels of dosimetric concern at Hanford. The basis for dosimetry for additional radionuclides will be added to this manual as the need arises. A “special topics” chapter provides for a documented record of technical issues that do not fit under other specific chapters, or that will subsequently be incorporated into other chapters upon major revisions of chapters. The recommendations for specific bioassay programs and capabilities of such programs for demonstrating compliance with regulations are presented in the companion Hanford Internal Dosimetry Project Manual (PNL-MA-552).(a)
The tables, figures, and appendixes included in this manual (PNNL-MA-860) reflect the most current information at the time of the revision of this manual; information may be changed without the change being reflected in this manual prior to the next scheduled revision.
1.2 Document History
The first version of this manual was the Technical Basis for Internal Dosimetry at Hanford, issued in April 1989 as a technical document (PNL-6866; Sula et al. 1989). During its first 2 years of publication, the document found a wide audience throughout the U.S. Department of Energy (DOE), its contractors, and other organizations involved in internal dosimetry. It not only served well as the intended reference for data, but also became a template for other sites in developing their own technical basis documents. The “Technical Basis” was always intended to be a “living” document, responsive to the needs of the HIDP. The first revision of the document (Sula et al. 1991) was prompted by the desire to have additional information readily available for routine use in dose assessment and bioassay program design. Also, changes were made in the presentation of information to make the document easier to use. Throughout the next 8 years, no revisions were made to the document proper, although some updates and additions were made by supplemental letter reports addressing specific issues. The document itself remained unchanged due to program priorities and the fact that the essence of the material in the document was still current.
(a) Pacific Northwest National Laboratory. 1997. Hanford Internal Dosimetry Project Manual.
PNNL-MA-552, Richland, Washington. (Internal manual.) Available URL: http://www.pnl.gov/eshs/pub/pnnl552.html
PNNL-MA-860 Chapter 1.0 Issued: January 31, 2003 Page 1.2

In January 2000, the Hanford technical basis changed its format from a document to a manual. Although the content and layout remained similar to previous versions, the manual format was adopted to allow future changes to be accomplished without republishing the entire document. The name change to Methods and Models of the Hanford Internal Dosimetry Program was made to more accurately reflect the manual’s purpose and content, and avoid confusion that one document constitutes the entire “technical basis.” Shut down and cleanup of Hanford facilities have continued since the last revision. Plutonium production and fuel reprocessing have ceased, and facilities are in the midst of decontamination and decommissioning. Relatively short-lived fission and activation products have decayed to the point where the need for their dosimetry is substantially reduced, and the additional time since the end of reprocessing has changed the expected isotopic ratios in reference plutonium mixtures. As new missions are added or existing site programs modified, further modification of this manual may be required. The HIDP seeks to implement technically appropriate and cost-effective methods and tools to carry out its functions. Recent recommendations from the ICRP include a new lung model, improved biokinetic models for radionuclides in the body, new recommendations for organs of concern and revised organ dose weighting factors. Many of those recommendations are gaining acceptance, however the tools to implement them are limited. The HIDP will continue to evaluate new models and tools for internal dosimetry, as they become available and incorporate cost-effective improvements that are consistent with regulatory and contractual requirements. This manual incorporates some of the newer biokinetic models. Regulatory requirements of 10 CFR 835 and contractual requirements for the Hanford Radiological Health and Safety Document (DOE 2001) preclude the adoption of recent ICRP recommendations for organ dose weighting factors (ICRP 1990) and effective dose coefficients based on those factors.
Issued: January 31, 2003 PNNL-MA-860 Chapter 1.0 Page 1.3

1.3 References
10 CFR 835. 1999. U.S. Department of Energy, “Occupational Radiation Protection.” U.S. Code of Federal Regulations. International Commission on Radiological Protection (ICRP). 1977. “Recommendations of the International Commission on Radiological Protection.” (ICRP publication 26). Annals of the ICRP, 1:3, Pergamon Press, New York. International Commission on Radiological Protection (ICRP). 1979. “Limits for intakes on radionuclides by workers.” (ICRP publication 30, part 1). Annals of the ICRP, 2:3-4, Pergamon Press, New York. International Commission on Radiological Protection (ICRP). 1990. “1990 recommendations of the International Commission on Radiological Protection.” (ICRP publication 60). Annals of the ICRP, 21:1-3, Pergamon Press, New York. Sula, M. J., E. H. Carbaugh, and D. E. Bihl. 1989. Technical Basis for Internal Dosimetry at Hanford. PNL-6866, Pacific Northwest Laboratory, Richland, Washington. Sula, M. J., E. H. Carbaugh, and D. E. Bihl. 1991. Technical Basis for Internal Dosimetry at Hanford. PNL-6866, Rev. 1, Pacific Northwest Laboratory, Richland, Washington. U.S. Department of Energy (DOE). 2001. Hanford Radiological Health and Safety Document. DOE/RL-2002-12. Richland, WA.
PNNL-MA-860 Chapter 1.0 Issued: January 31, 2003 Page 1.4

2.0 General Methods for Internal Dosimetry
The HIDP uses the fundamental concepts described by the ICRP for calculations of intake, deposition, and dose. The basic concepts and techniques are those described in ICRP 30, Part 1 and its supplement (1979a and b), including specific effective energy (SEE) factors, Reference Man parameters, annual limit on intake (ALI), and derived air concentration (DAC), with radiation quality factors and organ/tissue weighting factors as mandated by 10 CFR 835. The biokinetic models used to describe distribution, retention, and excretion for various radionuclides are described in the pertinent chapters of this manual. Generally, preference is given to well-documented and peer-reviewed models; particularly those published by the ICRP. This chapter summarizes the calculational methods and factors most commonly used for intake assessment and internal dosimetry. In some cases, discussion is included concerning scientific recommendations that are currently incompatible with regulatory requirements. Such discussion is intended to provide guidance for alternate assessments appropriate for purposes other than regulatory compliance. This chapter also describes the various reference levels and derived reference levels used by the HIDP.
2.1 Radiation Quality and Tissue Weighting Factors The quality factors and tissue weighting factors of 10 CFR 835 are used for routine calculations. Generally, these factors have been incorporated into the computer codes and dose coefficients used in the calculations. These factors are consistent with those also found in 10 CFR 20 and ICRP 30 (1979a). Some significant differences in tissue weighting factors are found in the recommendations of ICRP 60 (1990), however these newer values are not consistent with 10 CFR 835, and thus are not used for compliance dose calculations. Table 2.1 provides a comparison of the radiation quality factors pertinent to the HIDP, and Table 2.2 compares the tissue weighting factors.
Table 2.1. Comparison of Radiation Quality Factors
Radiation 10 CFR 835 10 CFR 20 ICRP 30 ICRP 60 Alpha 20 20 20 20 Proton 10 10 10 5 Beta 1 1 1 1
Gamma, X 1 1 1 1
Issued: January 31, 2003 PNNL-MA-860 Chapter 2.0 Page 2.1

Table 2.2. Comparison of Organ/Tissue Weighting Factors
Tissue or Organ 10 CFR 835 10 CFR 20 ICRP 30 ICRP 60
Gonads 0.25 0.25 0.25 0.20 Breasts 0.15 0.15 0.15 0.05 Red Bone Marrow 0.12 0.12 0.12 0.12 Lungs 0.12 0.12 0.12 0.12 Thyroid 0.03 0.03 0.03 0.05 Bone Surfaces 0.03 0.03 0.03 0.01 Colon - - - 0.12 Stomach - - - 0.12 Bladder - - - 0.05 Liver - - - 0.05 Esophagus - - - 0.05 Skin - - - 0.01 Remainder 0.06 for
each of 5 other organs with highest dose
0.06 for each of 5 other organs with highest dose
0.06 for each of 5 other organs with highest dose
0.05 total, with maximum of 0.025 to any single tissue
2.2 Biokinetic Models
Biokinetic models are used to describe the deposition and movement of material throughout the body. The ICRP 30 models for the respiratory tract, gastrointestinal (GI) tract, and metabolic distribution are used for most assessments (ICRP 1979a, b; 1980; 1981a, b; 1982a, b; 1988b). Specific metabolic retention and excretion models for various elements are described in the corresponding chapters of this manual. If adjustments are made to the parameter values of these models, those adjustments are explained in the documentation associated with the assessment. Intake retention functions (IRFs) combine various biokinetic models to provide an expression of the amount of a radionuclide retained in a compartment of the body (or excreted by a particular pathway) as a fractional value of the amount of the intake. Values of the functions at various times post intake are tabulated in this manual for intake circumstances of greatest interest to the HIDP. Other common sources of IRF values that may be used include the computer code CINDY (code for internal dosimetry; Strenge et al. 1992), ICRP 54 (1988a), NUREG 4884 (Lessard et al. 1987), and peer-reviewed literature or hand calculations.
PNNL-MA-860 Chapter 2.0 Issued: January 31, 2003 Page 2.2

The CINDY computer code is the preferred code used for internal dosimetry by the HIDP. This code incorporates the ICRP 30 lung and GI tract models, along with the metabolic distribution models to give bioassay projections, intake assessments based on bioassay data, and estimates of dose equivalent. Committed dose coefficients, hT,50 and hE,50, sometimes referred to as dose conversion factors, are the factors that express the committed tissue or effective dose equivalent, respectively, for a unit intake. They are derived based on a specified set of conditions. The dose coefficients tabulated in this manual are for circumstances most commonly encountered at Hanford. Typically, these are transport-able injection (instant uptake) and inhalation of class D, W, or Y materials, assuming a 1-:m or 5-µm activity median aerodynamic diameter (AMAD) particle size. Other tabulations of dose coefficients that might be useful include Federal Guidance Report No. 11 (EPA 1988), ICRP 30 supplements, and the newer ICRP publications, as summarized in publications 68, 72, and 78 (ICRP 1994b; 1996; 1997). In addition, coefficients for differing conditions can be calculated using the CINDY computer code.
2.3 Bioassay Measurements Bioassay is defined as the direct measurement of radioactivity in the body or the indirect measurement of radioactivity in the body by analyzing material excreted or otherwise removed from the body. Direct measurements are commonly called in vivo measurements, and use detector systems such as whole body counters, lung counters, and wound counters. Indirect measurements are called in vitro measurements, and involve the laboratory analysis of material excreted or removed from the body. In vitro measurements may include urine, feces, tissue samples, blood, or sputum. As a practical matter, most in vitro bioassays are made using urine or feces, and these measurements are generically referred to at Hanford as excreta bioassay.
2.4 Internal Dosimetry Assessments The HIDP uses intake assessment as the principal means for most dose evaluation, with internal doses calculated based on estimated intake. The intake is estimated using available data, preferably bioassay measurements, but exposure time to air concentrations may also be used. The 50-year committed effective dose equivalent (CEDE) and any appropriate 50-year committed organ or tissue dose equivalents are calculated based on the intake. In some cases (notably, tritium), dose may be directly calculated from bioassay
Issued: January 31, 2003 PNNL-MA-860 Chapter 2.0 Page 2.3

measurements, with intake subsequently estimated based on the assessed dose. The 50-year committed dose equivalents, assigned to the year of intake, are used as the basis for compliance monitoring. The concept of deposition assessment was often used by the HIDP through 1993, particularly for the assessment of plutonium, and is described here primarily for historical reference to archived evaluations. Rather than calculating an intake, this method used bioassay data to estimate the amount of material initially deposited in the intake compartments of interest. For example, instead of calculating a total inhalation intake, the bioassay data would be used to estimate the quantity initially retained in long-term compartments of the lung. In addition, a “presystemic deposition” was estimated to be the amount initially deposited in a compartment that would eventually translocate to the systemic circulation. (The term “presystemic deposition” was coined for use in the Technical Basis for Internal Dosimetry at Hanford [Sula et al. 1989]. Prior to that document the term “deposition” had been used, often very imprecisely.) Clearance rates were estimated for both non-systemic and presystemic depositions. Compliance with regulatory requirements was demonstrated either by calculating annual (not committed) dose equivalents to critical organs for comparison with the radiation protection standards in effect at the time, or, prior to 1989, by comparing the presystemic deposition with the maximum permissible body burden (MPBB). Tabulations of MPBBs in ICRP 2 (1959) or earlier National Bureau of Standards (NBS) handbooks (NBS 1953; 1959) were used as the radiation protection standards. In 1989, the ICRP 26 (1977) system was implemented for calculating effective dose equivalent using tissue weighting factors applied to organ and tissue dose equivalents, and calculated annual doses (not committed doses) were used as the basis for compliance. With the 1994 implementation of the DOE Radiological Control Manual (DOE 1994), compliance monitoring became based on assigning the committed dose equivalent to the year of intake.
2.5 Organs or Tissues of Concern
The DOE has established limiting values for occupational exposure to radiation in 10 CFR 835.202. These values include a limit on dose to individual organs or tissues to prevent deleterious nonstochastic effects, and a limit on the effective dose equivalent based on the risk of stochastic effects. Requirements for recording committed dose equivalents to organs and tissues of concern as well as the committed effective dose equivalent are given in 10 CFR 835.702(c)(4). However, neither the rule nor its implementation guide (DOE 1999) specifically defines “organs and tissues of concern.” Practices for recording doses to “organs and tissues of concern” are defined in the
PNNL-MA-860 Chapter 2.0 Issued: January 31, 2003 Page 2.4

Hanford Internal Dosimetry Program Manual (PNNL-MA-552).(a) In cases involving relatively small effective dose equivalents, there may be no single organ that meets the recording criteria, whereas for a very significant exposure, several organs may qualify. Candidate organs and tissues used by the HIDP are those identified by ICRP 30 (1979a) and the tissue weighting factors of 10 CFR 835, however the element-specific chapters of this manual (PNNL-MA-860) narrow those candidates to the appropriate organs and tissues. As noted below, doses received by localized tissues are not included in either the assessment of effective dose equivalent or in the assessment of dose equivalent to organs and tissues of concern. Intakes of radionuclides via wounds may result in the irradiation of local tissues at the wound site, as well as regional lymph nodes that drain the wound region. Because of their small mass, the absorbed dose to the regional lymph nodes may greatly exceed that to other tissues. Evidence from studies of experimental animals suggests that the lymph nodes are not primary sites for development of radiation-induced malignant disease (Nenot and Stather 1979). For this reason, there has been no attempt by either the ICRP (1979a) or the Biological Effects of Ionizing Radiation (BEIR) Committee (National Research Council 1988) to derive stochastic risk estimates for lymphatic tissue. Similarly, the irradiation of local tissues at the wound site is not considered to carry significant risk of carcinogenesis. Concentrated activity in such localized sources can be expected to result in relatively high doses and cell death or tissue fibrosis (e.g., scar tissue) within a limited area, but unless this area comprises more than a minor fraction of the organ/tissue, there will likely be no observable nonstochastic effect at any dose. Assessment of organ or tissue dose equivalent from highly localized sources, made by averaging the energy deposited in the organ over the organ mass, is not a relevant measure for comparison with the limiting values for assessed dose based on nonstochastic effects. Furthermore, in most situations, it is not possible to determine the actual mass of affected tissue for computing the absorbed dose. Because the absorbed dose is highly nonuniform over the tissue and only a limited number of cells within the organ/tissue are affected, the use of dose equivalent for assessing this localized exposure is not valid.
(a) Pacific Northwest National Laboratory. 1997. Hanford Internal Dosimetry Project Manual.
PNNL-MA-552, Richland, Washington. (Internal manual.) Available URL: http://www.pnl.gov/eshs/pub/pnnl552.html
Issued: January 31, 2003 PNNL-MA-860 Chapter 2.0 Page 2.5

For these situations, the HIDP will estimate the quantity of radionuclide(s) locally deposited and the projected retention half-time. These estimates become part of the individual’s radiation protection record, but are not used for determining compliance with either the stochastic or nonstochastic limits. This approach is analogous to the approach described in 10 CFR 835.205(b)(3) for irradiation of limited areas of the skin.
2.6 Particle Size The ICRP 30 (1979a) lung model recommended a default particle size of 1-µm AMAD, and that recommendation was used by the HIDP for most applications through the 1980s and 1990s. The ICRP 66 lung model (ICRP 1994a) provided two particle size recommendations for radiological protection purposes, in the absence of more specific information. For occupational exposure circumstances, a reference AMAD of 5 µm was recommended, and a 1-µm AMAD was recommended for exposures in the general environment. Dorrian and Bailey (1995) reported on a survey of 52 publications addressing radioactive aerosol particle size distributions in the workplace. Reported values ranged from 0.12 µm to 25 µm, and were well fitted by a lognormal distribution with a median value of 4.4 µm. They noted that nuclear power and nuclear fuel handling facilities gave median values of about 4 µm. Uranium mills gave a median value of 6.8 µm, with AMADs frequently above 10 µm. High temperature and arc saw cutting operations generated submicron particles. They concluded that a 5-µm AMAD was a realistic default value for occupational exposure to unknown aerosols, and considered that value a better choice than the 1-µm value of ICRP 30. They also cautioned that, where possible, particle sizes should be measured for individual work practices to provide realistic parameters for dose assessment, because the 5-µm value of the ICRP 66 lung model was chosen to be deliberately realistic rather than conservative. Kelso and Wraight (1996) reported on 50 AMAD measurements associated with reactor fuel reprocessing in several buildings at Sellafield. They found a mean value of 3.7-µm AMAD over the six buildings examined, with results consistently larger than the 1-µm value. They also concluded that the use of 5 µm as a default particle size was reasonable as a realistic rather than conservative assumption for occupational aerosols.
PNNL-MA-860 Chapter 2.0 Issued: January 31, 2003 Page 2.6

Heid and Jech (1972) reported that measurements in the majority of Hanford incidents indicated a mean particle size of 4-µm for plutonium oxide particles. Palmer, Perkins, and Stuart (1964) reported submicron particle sizes for radon in mines. These two reports provide some older historical data in support of the ICRP 66 lung model recommendations. This technical basis work for the HIDP addresses both 1-µm and 5-µm AMAD particle sizes. This is done as a point of reference for the environmental and occupational radiation protection recommendations of ICRP 66, and as a cross-over to mark the change from the 1-µm default of ICRP 30 to the 5-µm default of ICRP 66 for occupational radiation protection. It is the intent of the HIDP to follow the particle size recommendations of ICRP 66 and assume occupational exposure to radioactive aerosols of a 5-µm particle size, unless exposure information suggests otherwise.
2.7 Assumed Date of Intake
The actual intake time or period, when that time is known, is used for assessment of intake and dose. When the actual intake time or period is not known, it is necessary to identify the probable intake date(s). This may be done by considering available evidence, such as air monitoring results, contamination surveys, operating periods, and previous bioassay measurement results. After the intake time is narrowed to a probable time period, it is assumed that an acute intake occurred at the midpoint of that period. This approach is consistent with recommendations of the ICRP (1988a; 1997) and the National Council on Radiation Protection and Measurements (NCRP 1987). If the evidence suggests that a chronic intake is more reasonable, it is assumed that the chronic intake occurred uniformly throughout the probable exposure period. For describing the capability of a bioassay program (i.e., the minimum detectable intake or dose associated with a bioassay measurement protocol), the intake is assumed to be at a worst-case date (i.e., the minimum IRF value for the interval is used). Typically, that date is the longest elapsed time between measurements.
Issued: January 31, 2003 PNNL-MA-860 Chapter 2.0 Page 2.7

2.8 Intake Pattern Occupational intakes in a well-engineered and -operated facility usually occur as acute inhalations due to unplanned or unanticipated events. Thus, acute inhalations are used for most bioassay program designs and as default intake patterns for assessment of high routine bioassay samples. Exceptions to this may include tritium exposures, which can be expected to occur as acute or chronic uptake events combining both inhalation and absorption. Historically at Hanford, there has also been planned chronic exposure to uncontained uranium in several facilities, however the work associated with such patterns is now quite rare. Very low-level chronic exposure, below the sensitivity of normal air sampling and bioassay monitoring may be present for areas of uncontained radioactivity.
2.9 Interpretation of Bioassay Program Capability Bioassay program capability (i.e., sensitivity) is described by the minimum detectable intake (MDI) and its associated minimum detectable dose (MDD), based on an assumed bioassay measurement equal to the minimum detectable activity or amount (MDA) and an assumed time between measurements. Occasionally it is desirable to make a statement based on an actual bioassay measurement, showing no detectable result, as to what might be the potentially undetected dose associated with the measurement. When a bioassay measurement has been made with a result showing no detection, the MDA value, rather than the critical level for detection (Lc) should be used as a basis for determining a potentially undetected dose. The MDA and critical level for detection concepts are discussed in Appendix B of this manual.
2.10 Normalizing Bioassay Data Indirect bioassay data may be normalized differently based on the sampling protocol. Generally, Hanford urine data are automatically normalized to a total 24-hour excretion by use of the standard “simulated 24-hour” sampling protocol of collecting all urine voided between 30 minutes before retiring at night and 30 minutes after rising in the morning for two consecutive nights (NCRP 1987). This protocol was originated at Hanford in the mid-1940s, based on unpublished work by J. W. Healy.(a) Medley, Kathren, and Miller (1994) identified a potential bias of up to a factor of 2 for this protocol.
(a) Personal correspondence, J. W. Healy to E. H. Carbaugh.
PNNL-MA-860 Chapter 2.0 Issued: January 31, 2003 Page 2.8

If the sample is collected properly, a total or simulated 24-hour urine sample result is used as is; no further normalization is done. A proper 12-hour sample result is normalized by doubling the result. If it is suspected that a sample has not been provided according to instructions, several approaches are considered for normalization. A sample that is supposed to contain 24-hour excretion may not be analyzed if the volume is less than 500 ml because the volume is too small to represent a true 24-hour collection, and the worker may be asked to provide another sample. Alternatively, the result may be 1) normalized to 24-hour excretion based on information from the provider, 2) ignored, or 3) normalized by volume to 24-hour excretion. To normalize by volume, 1400 ml for males and 1000 ml for females (from Reference Man [ICRP 1974]) should be used for 24-hour excretion unless the person-specific daily excretion rate is known. Normalization by creatinine or specific gravity has been suggested (NCRP 1987; NIOSH 1974; Anderson et al. 1995; Karpas et al. 1998; Duke 1998). However, various studies suggest that normalization by these methods does not provide any improved confidence in the result over normalization by time or volume (Jackson 1966; Kim 1995; Boeniger, Lowry, and Rosenberg 1993; and Graul and Stanley 1982). The best way to ascertain if the sample represents 24-hour excretion may be to simply ask the worker providing the sample. (Harris 2000) The one exception to the above discussion concerns the analysis for tritium in urine. Because tritium is usually considered to be in equilibrium with body water, dosimetry can be accomplished using urine concentration rather than a daily excretion rate. The fecal excretion for Reference Man (ICRP 1974) for adults ranges from 60 to 500 g/day, with a recommended average of 135 g/day for an adult male and 110 g/day for an adult female. Note that these values represent excretion “per day,” not excretion “per bowel movement.” When a single bowel movement is collected, it is generally interpreted as representing excretion for one day. If the sample is greater than 60 g, no normalization is used. If the sample is less than 60 g, normalizing to 135 g for males and 110 g for females may be appropriate. If total accumulated fecal excretion over a time period was requested and there is no apparent reason to suspect that total excretion was not provided, then all sample results should be used as they are, without regard for the mass of individual samples. If excretions were missed during the time period, then normalization of the total mass to the
Issued: January 31, 2003 PNNL-MA-860 Chapter 2.0 Page 2.9

total mass expected based on the reference values given above should be used.
2.11 Fitting Bioassay Data to Biokinetic Models The assessment of intakes or internal dose requires fitting bioassay data to an appropriate biokinetic model to assess the integrated retention function (i.e., the cumulative activity or the number of radionuclide transformations over the time period of interest). Normally the HIDP uses the CINDY computer code (Strenge et al. 1992) to make these assessments. Curve-fitting routines within the code are addressed in Appendix D. Although curve fitting for a given type of bioassay (e.g., a set of urine samples from one person) can be refined by rigorous mathematics, often excretion and retention curves for a single intake of an individual do not lead to compatible intake estimates. In such cases, the dosimetrist must exercise considerable judgment in estimating the true intake.
2.12 Reference Levels and Derived Reference Levels A reference level is a predetermined value of a quantity that triggers a specified course of action when exceeded or expected to be exceeded. Reference levels at Hanford are expressed as dose-based or intake-based. Derived reference levels are the measurement values for particular bioassay or air sampling results that correspond to a more general reference level under specifically defined circum-stances. The reference and derived reference levels used in this document are the following: • screening level (SL)—The level below which a bioassay
measurement need not be considered for investigation of intake and assignment of dose. The Hanford SL is based on a committed effective dose equivalent of 10 mrem.
• derived screening level (DSL)—The value of a bioassay
measurement or airborne exposure estimate corresponding to a committed effective dose equivalent of 10 mrem for the referenced conditions or an estimated normal environmental levels.
• verification level (VL)—The level above which an attempt
should be made to confirm the intake as real (i.e., special follow-up measurements should be made to a high routine measurement). The Hanford VL is 100-mrem committed effective dose equivalent.
PNNL-MA-860 Chapter 2.0 Issued: January 31, 2003 Page 2.10
• investigation level (IL)—The level above which a bioassay or air monitoring result shall be investigated, to the extent reasonable, to determine actual conditions and parameters for dose evalua-tion. An investigation may involve special measurements, work history review, determination of material form, and modification of biokinetic parameters. The Hanford IL is 100-mrem committed effective dose equivalent. In practice, Hanford does not discriminate between the VL and the IL.
• derived investigation level (DIL)—The bioassay measurement or
airborne exposure measurement corresponding to a committed effective dose equivalent of 100 mrem for the referenced conditions.
• derived compliance level (DCL)—The bioassay measurement
level corresponding to the 10 CFR 835 dose limit, i.e., 5-rem committed effective dose equivalent or 50-rem committed organ/tissue dose equivalent.
Values of DCLs, DILs, and DSLs are tabulated in the various chapters of this document.
2.13 Fundamental Relationships The first principles equation for dose equivalent rate to an organ or tissue is described as
(2.1) ( ) s10
T ASTSEE10x6.1H ×←×= −•
where = dose equivalent rate in the target organ or tissue (T) from radioactive transformations in a source organ or tissue, in units of sieverts per second (Sv/s),
TH•
)ST(SEE ← = specific effective energy deposited in the target organ or tissue from a radionuclide transformation in a source organ or tissue in units of MeV per gram – transformation (MeV/g-trans), and
As = radioactivity present in the source organ or tissue in becquerels (Bq).
Integrating Equation (2.1) with respect to retention time gives the following dose equivalent:
(2.2) dt)t(RA)ST(SEE106.1H 0s10
T ∫×←××= −
where = dose equivalent in sieverts (Sv), TH R(t) = retention function in the source organ or tissue, and
Issued: January 31, 2003 PNNL-MA-860 Chapter 2.0 Page 2.11

dt)t(RAs ∫ = total number of transformations in the source organ over the time interval of interest. This latter term is also known as cumulative activity. For most internal dosimetry calculations, the integral is solved for t = 50 years (or 1.58 x 10⁹ seconds). ICRP 30 nomenclature identifies this term as . sU
In conventional health physics units, Equation (2.2) is expressed as (2.3) dt)t(RA)ST(SEE2.51H 0sT ∫×←×= where = rems, TH = microcuries (µCi), and sA t = the time interval in days. A few fundamental relationships are repetitively used for most internal dosimetry calculations. Some of these relationships are described conceptually in the following equations. Because these are intended to be conceptual relationships, no units or unit conversion factors are shown. It is understood that consistency in units will be addressed by the specific application of the relationship. Bioassay Result = Intake × Intake Retention (or Excretion) Fraction )t(IRFI)t(M ×= (2.4) Intake Estimate from a Single Bioassay Measurement
)t(IRF
)t(MI = (2.5)
Intake Estimate from Air Concentration Data
actorFrotectionPespiratoryR
DurationExposureRateBreathingCI air ××= (2.6)
Calculation of Airborne Exposure (DAC-hours)
)hours(ExposureofDurationDACC
hoursDACn
1i i
i,air ×=− ∑=
(2.7)
PNNL-MA-860 Chapter 2.0 Issued: January 31, 2003 Page 2.12

Annual Limit on Intake, the most limiting from Dose Limit and Dose Coefficient
50,T50,E h
rem50or,h
rem5tCoefficienDose
LimitDoseALI == (2.8)
Intake Estimate from Airborne Exposure (DAC-hours) and Annual Limit on Intake
hoursDAChoursDAC2000
ALII −×−
= (2.9)
Committed Effective Dose Equivalent based on Intake and Dose Coefficient 50,E50,E hIH ×= (2.10)
Committed Organ/Tissue Dose Equivalent based on Intake and Dose Coefficient 50,T50,T hIH ×= (2.11)
Committed Dose from DAC-hours
hoursDAC2000
rem5hoursDACH 50,E −×−= (2.12)
(for stochastically based DACs)
hoursDAC2000
rem50hoursDACH 50,T −×−= (2.13)
(for deterministically based DACs) Minimum Detectable Intake (MDI)
)t(IRF
MDAMDI = (2.14)
Minimum Detectable Dose (MDD) 50,TorEhMDIMDD ×= (2.15)
Issued: January 31, 2003 PNNL-MA-860 Chapter 2.0 Page 2.13

2.14 References 10 CFR 20. 1999. U.S. Nuclear Regulatory Commission. “Standards for Protection Against Radiation.” U.S. Code of Federal Regulations. 10 CFR 835. 1999. U.S. Department of Energy. “Occupational Radiation Protection.” U.S. Code of Federal Regulations. Anderson, J., B. Kahn, R. Rosson, E. Kim, and T. R. La Bone. 1995. “Use of creatinine measurement to confirm the time interval of a urine sample.” Rad. Prot. Management, 12(5):51-65. Boeniger, M. F., L. K. Lowry, and J. Rosenberg. 1993. “Interpretation of urine results used to assess chemical exposure with emphasis on creatinine adjustments: A review.” Am. Ind. Hyg. Assoc. J. 54(10):615-627. Duke, K. 1998. “Use of the urinary excretion of creatinine in plutonium in urine bioassay.” Rad. Prot. Dosim. 79(1-4):125-128. Dorrian, M. D., and M. R. Bailey. 1995. “Particle size distributions of radioactive aerosols measured in workplaces.” Rad. Prot. Dosim. 60(2):119-133. Graul, R. J. and R. L. Stanley. 1982. “Specific gravity adjustment of urine analysis results.” Am. Ind. Hyg. Assoc. J. 43(11):863. Harris, Shelley A., James T. Purdham, Raul N. Covey, and Andrea M. Sass-Kortask. 2000. “An evaluation of 24-hour urinary creatinine excretion for use in identification of incomplete urine collections and adjustment of absorbed dose of pesticides.” Am. Ind. Hyg. Assoc. J.61:649-657. Heid, K. R., and J. J. Jech. 1972. “Prompt handling of cases involving accidental exposure to plutonium.” In Health Physics Operational Monitoring, Vol. 3, Proceedings of the Third Annual Health Physics Society Midyear Symposium, January, 29-31, 1969, C. A. Willis and J. S. Handloser, eds., Gordon and Breach Science Publishers, New York. International Commission on Radiological Protection (ICRP). 1959. Report of Committee II on permissible dose for internal radiation. ICRP publication 2, Pergamon Press, New York. International Commission on Radiological Protection (ICRP). 1974. Report of the task group on Reference Man. ICRP publication 23, Pergamom Press, New York.
PNNL-MA-860 Chapter 2.0 Issued: January 31, 2003 Page 2.14

International Commission on Radiological Protection (ICRP). 1977. “Recommendations of the International Commission on Radiological Protection.” (ICRP publication 26.) Annals of the ICRP, 1:3, Pergamon Press, New York. International Commission on Radiological Protection (ICRP). 1979a. “Limits for intakes of radionuclides by workers.” (ICRP publication 30, part 1.) Annals of the ICRP, 2:3-4, Pergamon Press, New York. International Commission on Radiological Protection (ICRP). 1979b. “Limits for intakes of radionuclides by workers.” (ICRP publication 30, supplement to part 1.) Annals of the ICRP, 3:1-4, Pergamon Press, New York. International Commission on Radiological Protection (ICRP). 1980. “Limits for intakes of radionuclides by workers.” (ICRP publication 30, part 2.) Annals of the ICRP, 4:3-4, Pergamon Press, New York. International Commission on Radiological Protection (ICRP). 1981a. “Limits for intakes of radionuclides by workers.” (ICRP publication 30, part 3.) Annals of the ICRP, 6:2-3, Pergamon Press, New York. International Commission on Radiological Protection (ICRP). 1981b. “Limits for intakes of radionuclides by workers.” (ICRP publication 30, supplement to part 2.) Annals of the ICRP, 5:1-6, Pergamon Press, New York. International Commission on Radiological Protection (ICRP). 1982a. “Limits for intakes of radionuclides by workers.” (ICRP publication 30, supplement A to part 3.) Annals of the ICRP, 7:1-3, Pergamon Press, New York. International Commission on Radiological Protection (ICRP). 1982b. “Limits for intakes of radionuclides by workers.” (ICRP publication 30, supplement B to part 3, including addendum to the supplements of parts 1 and 2.) Annals of the ICRP, 8:1-3, Pergamon Press, New York. International Commission on Radiological Protection (ICRP). 1988a. “Individual monitoring for intakes of radionuclides by workers: Design and interpretation.” (ICRP publication 54.) Annals of the ICRP, 19:1-3, Pergamon Press, New York. International Commission on Radiological Protection (ICRP). 1988b. “Limits for intakes of radionuclides by workers: An addendum.” (ICRP publication 30, part 4.) Annals of the ICRP, 19:4, Pergamon Press, New York.
Issued: January 31, 2003 PNNL-MA-860 Chapter 2.0 Page 2.15

International Commission on Radiological Protection (ICRP). 1990. “1990 recommendations of the International Commission on Radiological Protection.” (ICRP publication 60.) Annals of the ICRP, 21:1-3, Pergamon Press, New York. International Commission on Radiological Protection (ICRP). 1994a. “Human respiratory tract model for radiological protection.” (ICRP publication 66.) Annals of the ICRP, 24:1-3, Pergamon Press, New York. International Commission on Radiological Protection (ICRP). 1994b. “Dose coefficients for intakes of radionuclides by workers.” (ICRP publication 68.) Annals of the ICRP, 24:4, Pergamon Press, New York. International Commission on Radiological Protection (ICRP). 1996. “Age-dependent doses to members of the public from intakes of radionuclides: Part 5 compilation of ingestion and inhalation dose coefficients.” (ICRP publication 72.) Annals of the ICRP, 26:1, Pergamon Press, New York. International Commission on Radiological Protection (ICRP). 1997. “Individual monitoring for internal exposure of workers.” (ICRP publication 78.) Annals of the ICRP, 27:3-4, Pergamon Press, New York. Jackson, S. (1966). “Creatinine in urine as an index of urinary excretion rate.” Health Phys. 12:843. Karpas, Z., A. Lorber, E. Elish, P. Marcus, Y. Roiz, R. Marko, R. Kol, D. Brikner, and L. Halicz. 1998. “Uranium in urine-normalization to creatinine.” Health Phys. 74(1):86-90. Kelso, S. M., and J. C. Wraight. 1996. “The measurement of aerosol size distributions (AMAD) in buildings on BNFL’s Sellafield Site.” Rad. Prot. Dosim. 63(2):1127-131. Kim, E. M. 1995. Determination of Time Interval of Urine Sample by Measuring Creatinine in Urine. ESH-HPT-95007, Westinghouse Savannah River Company, Savannah River Site, Aiken, South Carolina. Lessard, E. T., X. Yihua, K. W. Skrable, G. E. Chabot, C. S. French, T. R. La Bone, J. R. Johnson, D. R. Fisher, R. Belanger, and J. L. Lipsztein. 1987. Interpretation of Bioassay Measurements. NUREG/CR-4884, U.S. Nuclear Regulatory Commission, Washington, D.C.
PNNL-MA-860 Chapter 2.0 Issued: January 31, 2003 Page 2.16

Medley, D. W., R. L. Kathren, and A. G. Miller. 1994. “Diurnal urinary volume and uranium output in uranium workers and unexposed controls.” Health Phys. 67(2):122-130. National Bureau of Standards (NBS). 1953. Maximum Permissible Amounts of Radioisotopes in the Human Body and Maximum Permissible Concentrations in Air and Water. Handbook 52, U.S. Department of Commerce, Washington, D.C. National Bureau of Standards (NBS). 1959. Maximum Permissible Body Burdens and Maximum Permissible Concentrations of Radionuclides in Air and Water for Occupational Exposure. Handbook 69, U.S. Department of Commerce, Washington, D.C. National Council on Radiation Protection and Measurements (NCRP). 1987. Use of Bioassay Procedures for Assessment of Internal Radionuclide Deposition. NCRP Report No. 87, Bethesda, Maryland. National Institute for Occupational Safety and Health (NIOSH). 1974. Criteria for a Recommended Standard - Occupational Exposure to Benzene. HEW publication (NIOSH) 74-137, U.S. Government Printing Office, Washington, D.C. National Research Council. 1988. Health Risks of Radon and Other Internally Deposited Alpha-Emitters. BEIR IV, National Academy Press, Washington, D.C. Nenot, J. E., and J. W. Stather. 1979. The Toxicity of Plutonium, Americium, and Curium. Commission of the European Communities, Pergamon Press, Oxford, England. Palmer, H. E., R. W. Perkins, and B. O. Stuart. 1964. “The distribution and deposition of radon daughters attached to dust particles in the respiratory system of humans exposed to uranium mine atmospheres.” Health Phys. 10:1129-1135. Strenge, D. L., R. A. Kennedy, M. J. Sula, and J. R. Johnson. 1992. Code for Internal Dosimetry (CINDY Version 1.2), Part 1: Conceptual Representation. PNL-7493 Pt. 1, Rev. 1, Pacific Northwest National Laboratory, Richland, Washington. U.S. Department of Energy (DOE). 1994. Radiological Control Manual. DOE/EH-0256T, Rev. 1, Washington, D.C.
Issued: January 31, 2003 PNNL-MA-860 Chapter 2.0 Page 2.17

U.S. Department of Energy (DOE). 1999. Internal Dosimetry Program Guide for Use with Title 10, Code of Federal Regulations, Part 835, Occupational Rad. Prot. DOE G 441.1-3, Washington, D.C. U.S. Environmental Protection Agency (EPA). 1988. Limiting Values of Radionuclide Intake and Air Concentration and Dose Conversion Factors for Inhalation, Submersion, and Ingestion. Federal Guidance Report No. 11, EPA-520/1-88-020, Washington, D.C.
PNNL-MA-860 Chapter 2.0 Issued: January 31, 2003 Page 2.18

Issued: January 31, 2000 PNNL-MA-860 Chapter 3.0Page 3.1
3.0 Special Topics
This chapter provides a subject area for technical basis discussions ofspecial issues that arise and do not fit neatly in other chapters orappendices of this manual. These topics may be of short-termapplication, limited scope, or simultaneously deal with multiplechapters of this manual. This chapter will include sequentiallynumbered sections as topics are issued.

Issued: January 31, 2000 PNNL-MA-860 Chapter 4.0Page 4.1
4.0 Tritium
This chapter provides information on the sources and biokinetics oftritium and summarizes the technical basis used for the internaldosimetry of tritium (3H) at Hanford. This chapter is not intended tobe an all-encompassing technical basis for any type of tritiumexposure, but rather to provide the approach to be used for routinelyencountered exposures at Hanford. A detailed review of tritiummetabolism and dosimetry was published by Hill and Johnson(1993). There is broad consensus on the internal dosimetry fortritiated water vapor. However, organic forms and stable tritiumparticulates (notably metal tritides) are currently undergoingsubstantial technical evaluation within the DOE complex and thedosimetry for such materials is subject to change with emergingknowledge. Therefore, this chapter addresses such special forms oftritium in only a cursory manner at this time. Internal dosimetry staffshould be contacted for concerns about these materials.
4.1 Sources and Environmental Levels of Tritium
Tritium exists as part of the natural background of environmentalradiation (NCRP 1979a) originating from cosmic ray interactions.It is also a man-made nuclide that has been widely dispersed in theenvironment from nuclear weapons tests, nuclear power programs,and radioisotope applications.
Tritium work at Hanford has included tritium production, researchassociated with tritium production, the decontamination anddecommissioning (D&D) of former tritium production facilities andlaboratories associated with such facilities, radioluminescent lightsdeveloped by PNNL, and as a tracer or labeling compound forbiological research projects. Tritium waste is also received atHanford from other sites. Predominant forms of tritium have beentritium oxide (tritiated water), tritium gas, and at least one projectinvolving stable metal tritides (notably, zirconium tritide).
Tritium in the human body can be routinely detected at levels wellbelow those of any dosimetric concern. Therefore, in addition to itsuse for dosimetry, tritium bioassay can be readily used as a work-place monitoring technique supplemental to air sampling orcontamination surveys.
It can be assumed that the tritium concentration of the body water ofnonoccupationally exposed persons should be reasonably close tothat of their drinking water. The EPA has reported that backgroundtritium concentrations in U.S. drinking water range from 100 to

PNNL-MA-860 Chapter 4.0 Issued: January 31, 2000Page 4.2
400 pCi/l (EPA 1985), which corresponds to about 0.2 to 1 dpm/ml.In addition, the EPA has promulgated a limit for tritium in drinkingwater of 20 nCi/l, based on 4 mrem/yr (EPA 1976), although anupward revision of this limit seems technically justifiable (Moghissiand Cothern 1986).
Tritium has been widely distributed in the public domain as a sourceof luminosity for various “glow-in-the-dark” applications, such asthe faces of watches, clocks, instruments, and exit signs. Breakageor other loss of containment in such devices could result in tritiumlevels in urine being substantially above background withoutoccupational exposure. Normal diffusion of tritium through watchcases can account for detectable urinary excretion of tritium.Brunner et al. (1996) reported urine concentrations of 197 to1133 Bq/l (12 to 68 dpm/ml) in 108 persons wearing plastic casewatches containing tritium.
4.2 Chemical Forms of Tritium
Tritium occurs in several chemical forms that significantly affect theinternal dosimetry associated with it. These forms include tritiumgas (which is an external dose hazard posing little internal dosimetryimpact, and thus is not addressed here), tritiated water vapor or liquid(HTO), and special tritium compounds including organically boundtritium and stable metal particulates. Tritiated water is the typicalform encountered at Hanford, and routine Hanford dosimetry isbased on this form. Organically bound tritium may be associatedwith things such as contaminated oils or experiments using tritium asa tracer. Stable metal particulates are often linked to metal tritidesassociated with tritium storage devices or tritium rust (tritiated ironoxide). Limited activities involving stable metal tritides have beenidentified by PNNL. The internal dosimetry for organically boundtritium and stable metal particulates is undergoing substantial reviewwithin the DOE complex, and this technical basis document will beaugmented as needed to address new guidance. Organically boundtritium and stable metal particulates of tritium can deliversubstantially more dose per unit intake than tritiated water.
Internal dosimetry for each of the three tritium forms of greatestconcern is discussed in the following sections.
4.3 Internal Dosimetry for Tritiated Water
Determining the dose from tritium exposures involves calculating thedose to soft tissue from tritium that is assumed to be uniformlydistributed throughout the body water. The body waterconcentration can be determined by first sampling the body fluids

Issued: January 31, 2000 PNNL-MA-860 Chapter 4.0Page 4.3
(typically urine), then by directly measuring tritium using liquidscintillation techniques. For acute exposure situations, the initialbody water concentration can be estimated from the retentionfunction, and a total tritium uptake can be calculated using theReference Man body water mass from ICRP 23 (1974). From thisuptake, the soft tissue dose equivalent can be calculated for anypertinent time period. For chronic exposure situations, anequilibrium body burden of tritium can be estimated from the bodywater concentration, and a dose equivalent can be calculated for anypertinent time period using a dose rate factor. A summary ofselected Hanford internal dosimetry factors for HTO is shown inTable 4.1. Their derivation is described in the following paragraphs.
Table 4.1. Hanford Tritiated Water (HTO) Dosimetry Factors
Radiological Half-Life 12.35 yrSpecific Effective Energy (SEE) Factor 9.0E-08 MeV/g-transformationEffective Energy per Transformation 5.7 keV (0.0057 MeV)Quality Factor 1.0Biological Half-Life 10 daysEffective Half-Life 10 daysTissue Weighting Factor 1.0Source Organ Body waterSource Organ Mass 42,000 gTarget Organ Soft tissueTarget Organ Mass 63,000 gHanford HTO Dose Coefficient 1.8E-11 Sv/Bq, or 0.066 mrem/µCi
Dose Equivalent per UnitConcentration Factor
1.3E-04 mrem per dpm/ml2.8 mrem per µCi/l
Dose Rate per Unit Body WaterConcentration Factor
0.19 mrem/day per µCi/l8.7E-5 mrem/day per dpm/ml
Derived Air Concentration(10 CFR 835 Appendix A)
2E-05 µCi/m. or8E+05 Bq/m3
Historically, the approach to tritium dosimetry used in ICRP 2,ICRP 10, and American National Standards Institute (ANSI)N13.14-1983 was to calculate the dose to body water as the criticalorgan (ICRP 1959, 1969; ANSI 1983). A body water mass of42,000 g was assumed for ICRP 23 Reference Man (1974). It wasassumed that the dose to body water was essentially the same as thedose to soft tissue. In ICRP 30 (1979), a more realistic approach totritium dosimetry was defined. The body water mass of ICRP 23Reference Man (42,000 g) was recognized to be essentiallyuniformly distributed throughout the body mass of soft tissue(63,000 g). Consequently, tritium is now considered to be uniformlydistributed throughout soft tissue, and it is the soft tissue mass that is

PNNL-MA-860 Chapter 4.0 Issued: January 31, 2000Page 4.4
irradiated rather than merely the body water. The net effect is todistribute the decay energy over a larger mass of tissue, resulting in alowered total dose. Although less conservative, this approach ismore accurate from a biological and technical point of view.Reported tritium doses for exposures to tritium at Hanford prior tothe 1989 implementation of this approach were approximately 33%higher than if they had been calculated using the newer approach.
Tritium as HTO is assumed to be instantaneously and uniformlymixed with body water immediately following intake. The f1 factoris assumed to be 1 for all ages. This makes HTO a special casewhere total intake and systemic uptake are identical. Although theNCRP (1976) suggests that 2 or more hours may be required for thisdistribution and mixing to occur, from a practical standpoint theprocess is quite rapid and an approximate equilibrium condition willprobably be reached by the time a sample can be collected. Thecollection of overnight urine samples provides good assurance thatan equilibrium condition in the body has been achieved, howeveradequate dosimetry can be done using single void samples.
The metabolic model used for tritium is described in ICRP 30(1979). Tritiated water is assumed to be uniformly distributedamong all soft tissues at any time following intake. Its retention,R(t), is described as a single exponential with an effective clearancehalf-time of 10 days. Thus, the fraction of tritium taken into thebody as tritiated water, which is retained in the body at time t dayslater, is given by:
t0693.0t10693.0
ee)t(R −×−
== (4.1)
Radioactive decay is insignificant in this determination because thebiological clearance half-time of 10 days far surpasses the physicaldecay half-time of 12 years as a mode of clearance from the body.This retention function has been well established and is consideredappropriate for exposures to tritiated water (HPS 1994). It can beexpected that the retention of tritiated water in individuals will varyfrom this, and if sufficient data are available to establish an alternatemodel for an individual worker’s exposure, they should be used. Inaddition to body water, ICRP 30 acknowledged the existence of twoorganically bound tritium components. However, the ICRPconcluded that these could be ignored for radiation protectionpurposes, and Johnson (1982) estimated that these componentswould add approximately 10% to the committed dose equivalent.Unless worker data specifically indicate the existence of significantlylonger-term components, the HIDP will follow the ICRPrecommendation of single compartment retention. The number of

Issued: January 31, 2000 PNNL-MA-860 Chapter 4.0Page 4.5
transformations )U( s resulting from an intake of 1 Bq can becalculated by integrating the retention function over the appropriatetime interval. This calculation is shown below for the 50-yearcommitted dose period:
tionstransforma1025.1
sh600,3hd24Bqd43.14
dteU
6
11
250,180
t0693.0s
×=
××=
=
−−
∫(4.2)
4.3.1 Dose Calculation for an Acute Exposure to HTO
The uniform concentration of tritium in body water and its singlecomponent clearance rate allow for the estimation of uptake based onconcentration rather than total daily excretion. The retentionfunction (Equation [4.1]) can be used to directly estimate the bodywater concentration as follows:
t0693.00t eCC −×= (4.3)
where C t is body water concentration on day t, C0 is initial bodywater concentration, and t is elapsed time (days) post intake. C0 canbe determined from Ct and t by simple algebraic manipulation of thisequation.
t0693.0t
0e
CC
−= (4.4)
Once C0 has been determined, the intake I0 (same as uptake fortritiated water) for an acute exposure can be estimated bymultiplying C0 by the source organ (body water) mass as shown inEquation (4.5):
VolumeorMassWaterBodyCI 00 ×= (4.5)
where concentration and body water mass or volume units areconsistent. The ICRP Reference Man body water mass of 42 kg orvolume of 42,000 ml is used for normal internal dose calculations.
Using the ICRP 30 fundamental dose calculation described inChapter 2.0 (Equation [2.2]), the transformations per unit intakefactor derived above, and the tritium SEE factor, the committedeffective dose equivalent for an intake of 1 Bq of tritiated water iscalculated to be

PNNL-MA-860 Chapter 4.0 Issued: January 31, 2000Page 4.6
Sv1080.1
)100.9()1025.1()106.1()Sv(H11
861050,E
−
−−
×=
×××××=(4.6)
giving a dose coefficient (hE,50) of 1.80E-11 Sv Bq-1. This dosecoefficient and its conventional unit’s conversion (0.0666 mrem/µCi)are the factors used for tritiated water for Hanford internal dosimetry.
Using conventional units of mrem for HE,50 and µCi for I0, as iscustomary for the HIDP, the committed effective dose equivalentfrom an intake of tritium is calculated as
)Ci(I0666.0)mrem(H 050,E µ×= (4.7)
Substituting concentration C0 (in µCi/l) times the Reference Manbody water volume of 42 l for I0, gives the following relationship, asdescribed in American National Standard HPS N13.14 (1983):
)l/Ci(C79.2)mrem(H 050,E µ×= (4.8)
which, when converted to the Hanford reporting units forconcentration of dpm/ml, becomes
)ml/dpm(C00126.0)mrem(H 050,E ×= (4.9)
A comparison of HTO dose coefficients from several publishedsources is shown in Table 4.2. The reason for the discrepancybetween the Hanford dose coefficient derived by Equation (4.6), theICRP 30 value, and the EPA value is differences in roundingconventions between the calculations. The reason for discrepanciesbetween the Hanford value and the ICRP 56 and ICRP 78 (1989;1997) values is more complex. According to discussions betweenHanford internal dosimetry staff and the internal dosimetry modelinggroup at Oak Ridge National Laboratory (ORNL) that originated thevalues, the ICRP 56 ingestion value was in error and was updated inICRP 67 (1993) without notice of an erratum. As opposed to theICRP 30 soft tissue mass of 63 kg, the ICRP 67 model used a bodymass of 68.831 kg representing the total body mass minus thecontents of the GI tract and urinary and gall bladders. Thus theresulting ICRP 67 SEE factor was 8.25E-08 Mev/g-trans (comparedwith the ICRP 30 value of 9E-08 Mev/g-trans). This adjustmentoffset the 10% increase in the number of transformations resultingfrom using the ICRP 56 two-component biokinetic model (97% ofthe tritium clearing with a 10-d half-time and 3% clearing with a40-d half-time, representing a small organically bound component).

Issued: January 31, 2000 PNNL-MA-860 Chapter 4.0Page 4.7
Table 4.2. Comparison of Tritium Dose Factors
Tritiated Water (HTO) ReferenceDose Coefficients
1.8E-11 Sv/Bq(0.0666 mrem/ µCi) Hanford (this manual)1.7E-11 Sv/Bq ICRP 30 (1979)1.73E-11 Sv/Bq EPA (1988)1.6E-11 Sv/Bq ICRP 56 (1989)1.8E-11 Sv/Bq ICRP 67 (1993), 68 (1994), 71 (1995) and 78 (1997)
Derived Air Concentration (DAC)2E-05 µCi/ml (8E+05 Bq/m3) 10 CFR 835 Appendix A2E-05 µCi/ml (8E+05 Bq/m3) EPA (1988)8E+05 Bq/m3 ICRP 30 (1979)
Organically Bound Tritium (OBT)
Dose Coefficients4.0E-11 Sv/Bq Ingestion ICRP 56 (1989)4.2E-11 Sv/Bq Ingestion ICRP 67 (1993), 68 [1994]), 78 (1997)4.1E-11 Sv/Bq Inhalation ICRP 71 (1995), 78 (1997)
Derived Air Concentration (DAC)1E-05 µCi/ml. (4E+05 Bq/m3) DOE (1999)
Stable Tritiated Particulates (STP)Dose Coefficients – all from ICRP 71 (1995)
6.2E-12 Sv/Bq Inhalation of 1-µm AMAD particles, type F, f1=14.5E-11 Sv/Bq Inhalation of 1-µm AMAD particles, type M, f1=0.22.6E-10 Sv/Bq Inhalation of 1-µm AMAD particles, type S, f1=0.02
Derived Air Concentration (DAC)—all fromDOE (1999)
Type F 9E-05 µCi/ml (3E+06 Bq/m3)Type M 1E-05 µCi/ml (4E+05 Bq/m3)Type S 2E-06 µCi/ml (8E+04 Bq/m3)
Thus, there is not a significant difference in the ICRP 30 dosecoefficient calculated by the HIDP using first principles and theICRP 67, 68, and 78 dose coefficients calculated by ICRP using areduced SEE factor (ICRP 1979; 1993; 1994; 1997). As of thiswriting, it has not been resolved to the satisfaction of the HIDP staffthat the later ICRP method is a significantly improved approach.Consequently, the Hanford dose coefficient as derived from basicprinciples using ICRP 30 methods in this chapter is used fordosimetry.

PNNL-MA-860 Chapter 4.0 Issued: January 31, 2000Page 4.8
4.3.2 Dose Calculation for a Chronic Exposure to HTO
For chronic exposure, or a series of continuing acute exposures, anequilibrium concentration in body water is assumed. The doseequivalent rate during the period when the concentration ismaintained can be calculated by substituting the equilibrium bodywater concentration (Ceq (µCi/l) × 42) for sA in Equation (2.1) andaddressing units conversion, which gives
)l/Ci(C19.0)d/mrem(H eqeq,E µ×=•
(4.10)
and in units typically reported by the Hanford radiochemistrybioassay laboratory:
)ml/dpm(C107.8)d/mrem(H eq5
eq,E ××= −•
(4.11)
The dose equivalent for the time period during which the equilibriumbody water concentration is maintained can then be calculated by
tH)mrem(H eq,EE ×=•
(4.12)
where t = duration of exposure in days.
The total committed dose resulting from a chronic exposure intervalconsists of the dose incurred during the interval (as calculated byEquation (4.12) and the dose incurred following the termination ofintake. This latter component can be calculated using the equationfor an acute exposure (e.g., Equation [4.8]) where C0 is equal to Ceq)in µCi/l as follows:
)C8.2()tH()mrem(H 0eq,Etotal,E ×+×=•
(4.13)
4.3.3 HTO Dosimetry Based on Multiple Sample Results
When data from routine monitoring indicate that multiple acuteintakes or combinations of acute and chronic exposure conditionsmay exist, dosimetry may be performed by integrating the bodywater concentration over time and multiplying by the dose rate perunit concentration factor listed in Table 4.2 (as shown in Equation[4.14]). This method is particularly useful if samples are obtainedfrequently enough to provide an accurate estimate of the integralvalue.

Issued: January 31, 2000 PNNL-MA-860 Chapter 4.0Page 4.9
dtC19.0H tE ∫= (4.14)
where HE = mrem and Ct is in µCi/l.
4.3.4 Bioassay for Intakes of Tritiated Water
Bioassay monitoring for intakes of tritiated water is relatively simpleand involves sampling a representative body fluid. Any body fluidcan be used, but from a practical standpoint urine is the medium ofchoice. Because dosimetry can be readily performed usingconcentration data and because the models are quite simple, a singlevoiding (spot) urine sample is sufficient to obtain an adequatevolume for analysis. Only a few milliliters are actually used in theliquid scintillation analysis procedure. Sufficient time should passfollowing exposure to allow for uniform distribution throughoutbody fluids. The NCRP suggests that 2 or more hours may berequired for this (NCRP 1976). For this reason, it is usuallyrecommended that tritium samples be collected at home using amultiple voiding sampling protocol to obtain an averageconcentration.
The Hanford bioassay laboratory’s liquid scintillation procedureinvolves direct mixing of a small quantity (1ml) of the urine samplewith the scintillation cocktail solution. The sample is then countedin a liquid scintillation analyzer.
4.3.5 Derived Reference Levels for HTO Bioassay
Derived screening levels, investigation levels, and compliance levels,based on committed effective dose equivalents of 10-mrem,100-mrem, and 5,000 mrem, respectively, are shown in Table 4.3 fora single acute intake, and Table 4.4 for multiple intakes.
4.3.6 Bioassay Measurements Capability for Acute HTO Exposures
The detection capability of a routine tritium bioassay monitoringprogram for acute exposures has been considered in terms ofminimum detectable dose (committed effective dose equivalent) perintake and year, using an analytical procedure sensitivity of20 dpm/ml. In making these calculations, it was assumed that anacute intake occurred on the day immediately following a sample;thus, the time post intake was considered equal to the length of thesample interval. It was also assumed that the pattern of one intake atthe start of each interval might be maintained for a year. The resultsof these calculations are listed in Table 4.5 and plotted as the acuteintake curve in Figure 4.1.

PNNL-MA-860 Chapter 4.0 Issued: January 31, 2000Page 4.10
Table 4.3. Single Acute Intake Derived Reference Levels for Tritium Urine Excretion
Days PostIntake
Body Water IRF100% - 10 dayICRP 30 HTO
10-mrem HE,50
DerivedScreening
Level(a)
(dpm/ml)
100-mrem HE,50
DerivedInvestigation
Level(b) (dpm/ml)
5-rem HE,50
DerivedCompliance
Level(c)
(dpm/ml)0 1.0E+00 7.9E+03 7.9E+04 4.0E+061 9.3E-01 7.4E+03 7.4E+04 3.7E+062 8.7E-01 6.9E+03 6.9E+04 3.5E+063 8.1E-01 6.4E+03 6.4E+04 3.2E+067 6.2E-01 4.9E+03 4.9E+04 2.4E+06
14 3.8E-01 3.0E+03 3.0E+04 1.5E+0630 1.3E-01 9.9E+02 9.9E+03 5.0E+0560 1.6E-02 1.2E+02 1.2E+03 6.2E+0490 2.0E-03 1.6E+01 1.6E+02 7.8E+03
180 3.8E-06 3.0E-02 3.0E-01 1.5E+01365 1.0E-11 8.2E-08 8.2E-07 4.1E-05
(a) Based on 150 µCi intake.(b) Based on 1,500 µCi intake.(c) Based on 75,000 µCi intake.
Table 4.4. Multiple Acute Intake Derived Reference Levels for Tritium Urine Excretion
Days PostIntake
Body Water IRF100% - 10 dayICRP 30 HTO
MonitoringIntervalsper Year
10-mrem HE,50
DerivedScreening
Level(a)
(dpm/ml)
100-mrem HE,50
Derived InvestigationLevel(b) (dpm/ml)
1 9.3E-01 3.7E+02 2.0E+01 2.0E+022 8.7E-01 1.8E+02 3.8E+01 3.8E+023 8.1E-01 1.2E+02 5.3E+01 5.3E+027 6.2E-01 5.2E+01 9.4E+01 9.4E+02
14 3.8E-01 2.6E+01 1.2E+02 1.2E+0330 1.3E-01 1.2E+01 8.3E+01 8.3E+0260 1.6E-02 6.0E+00 2.1E+01 2.1E+0290 2.0E-03 4.0E+00 3.9E+00 3.9E+01
180 3.8E-06 2.0E+00 1.5E-02 1.5E-01365 1.0E-11 1.0E+00 8.2E-08 8.2E-07
(a) Assumes one intake per monitoring interval and ignores residual from previous intakes.(b) Based on 10-mrem screening level intake of 150 µCi cumulative for 1 year.(c) Based on 100-mrem investigation level intake of 1500 µCi cumulative for 1 year.

Issued: January 31, 2000 PNNL-MA-860 Chapter 4.0Page 4.11
Table 4.5. Minimum Detectable Intakes (MDIs) and Doses (MDDs)(a) for Acute Tritium Intake Basedon the ICRP 30 Retention Model and Analytical Sensitivity of 20 dpm/ml in Body Water
Days PostIntake
ICRP 30(b)
RetentionFraction
MDI forInterval
(µµCi)
IntervalMDD
(mrem)
MonitoringIntervals per
Year
MaximumAnnualMDD(c)
(mrem)
ChronicExposure(mrem)
1 9.3E-01 4.1E-01 2.7E-02 NA NA 0.642 8.7E-01 4.3E-01 2.9E-02 NA NA 0.643 8.1E-01 4.7E-01 3.1E-02 NA NA 0.647 6.2E-01 6.1E-01 4.1E-02 52 2.1E+00 0.64
14 3.8E-01 1.0E+00 6.6E-02 26 1.7E+00 0.6430 1.3E-01 3.0E+00 2.0E-01 12 2.4E+00 0.6460 1.6E-02 2.4E+01 1.6E+00 6 9.7E+00 0.6490 2.0E-03 1.0E+02 1.3E+01 4 5.2E+01 0.64
120 2.4E-04 1.5E+03 1.0E+02 4 4.1E+04 0.64180 3.8E-06 9.9E+04 6.6E+03 2 1.3E+04 0.64365 1.0E-11 3.7E+10 2.4E+09 1 2.4E+09 0.64
(a) Committed effective dose equivalent.(b) ICRP 30 model is 100% retained with a 10-day biological half-time.(c) Assumes one intake per interval and no buildup from intakes.
1.0E-01
1.0E+00
1.0E+01
1.0E+02
1.0E+03
0 10 20 30 40 50 60 70 80 90 100 110 120 130
Days Between Samples
Min
imu
m D
etec
tab
le D
ose
(HE,5
0;
mre
m)
Mutliple Acute
Chronic Equilibrium
Figure 4.1. Tritium Bioassay Monitoring Program Detection Capability for Analytical Sensitivity of20 dpm/ml using the ICRP 30 Retention Model

PNNL-MA-860 Chapter 4.0 Issued: January 31, 2000Page 4.12
As previously noted, there is evidence for an organically boundcomponent of a tritium oxide intake that can affect bioassay datainterpretation at long times (e.g., >90 days) post intake. Table 4.6shows the bioassay program capability for a program factoring in the3% organically bound component. Because of the uncertaintiesassociated with this component and the significant impact onminimum detectable dose of extending bioassay intervals to periodsin excess of 90 days (compare with Table 4.5), this component is notbeing incorporated into routine program design and interpretation. Ifpost-intake monitoring of an individual worker shows evidence ofthis organically bound component, it will be factored into thecalculations.
Table 4.6. Minimum Detectable Intakes (MDIs) and Doses (MDDs)(a) for Acute Tritium Intakes,Assuming the ICRP 56 Two-Component Body Water Retention Model and an AnalyticalSensitivity of 20 dpm/ml in Body Water
Days PostIntake
ICRP 56(b)
RetentionFraction
MDI forInterval (µµCi)
IntervalMDD (mrem)
MonitoringIntervals per
Year
MaximumAnnualMDD(c)
(mrem)1 9.3E-01 4.0E-01 2.9E-02 NA NA2 8.7E-01 4.3E-01 3.1E-02 NA NA3 8.2E-01 4.6E-01 3.4E-02 NA NA7 6.2E-01 6.1E-01 4.4E-02 52 2.3E+00
14 3.9E-01 9.7E-01 7.0E-02 26 1.8E+0030 1.4E-01 2.7E+00 2.0E-01 12 2.4E+0060 2.6E-02 1.5E+01 1.1E+00 6 6.4E+0090 8.2E-03 4.6E+01 3.3E+00 4 1.3E+01
120 4.0E-03 9.5E+01 6.9E+00 4 2.8E+01180 1.3E-03 2.8E+02 2.1E+01 2 4.1E+01365 5.4E-05 7.03E+03 5.1E+02 1 5.1E+02
(a) Committed effective dose equivalent.(b) ICRP 56 retention model is 97% retained with a 10-day half-life and 3% retained with a
40-day half-life.(c) Assumes 1 intake per interval and no buildup from multiple intakes.
4.3.7 Bioassay Measurement Capability for Chronic HTO Exposures
If the exposure condition is chronic and an equilibrium body waterconcentration of 20 dpm/ml is assumed (equal to the sensitivity ofthe analytical procedure and implying a daily intake rate of 26 nCi),then the resulting committed effective dose equivalent from 365 daysof intake would be 0.64 mrem. Because of the assumption ofchronic equilibrium conditions, this estimate is independent ofsample frequency, and is thus shown as a flat line in Figure 4.1.

Issued: January 31, 2000 PNNL-MA-860 Chapter 4.0Page 4.13
4.3.8 Optimum Bioassay Sampling Intervals for HTO Exposures
From Figure 4.1, it is apparent that the optimum routine bioassaysampling frequency for tritium is once every 2 weeks (biweekly) forperiodic acute intakes of tritium. Where exposure conditions arewell established and anticipated tritium doses are low (e.g.,<100 mrem for the year), less frequent intervals (e.g., monthly toquarterly) are adequate. However, the uncertainties with doseestimates associated with longer sampling intervals become muchhigher. Because of the 10-day effective half-life and theuncertainties associated with a possible organically bound tritiumcomponent, sampling intervals for HTO greater than 90 days arespecifically not recommended. If the potential exposure to tritium isanticipated only for a very limited interval, starting and endingbioassay samples might be more suitable than participation in acontinuing monitoring program.
Based on Table 4.5, a worker monitoring program using screeninglevels of 110 dpm/ml for biweekly samples or 80 dpm/ml formonthly samples is capable of detecting a 10-mrem dose equivalentin a year based on a series of acute or chronic HTO intakes. Thesescreening levels are conservative because they ignore the buildup ofexcretion of tritium in urine as the number of periodic intakesincreases during the year, as shown in Figure 4.2. At these screeninglevels, sampling schedules should be reviewed to ensure that workersare on an adequate routine monitoring program consistent with theirwork. If indications are that annual doses may exceed 100 mremfrom ongoing work, then a biweekly sampling program isrecommended.
4.3.9 Special Monitoring for HTO
Special monitoring may be required after unplanned or unusualexposures. When an unusual exposure has been suspected orreported, arrangements should be made to collect a urine specimenwithin a reasonably short period of time following the exposure,allowing for the achievement of body water equilibrium. Forpotentially high exposures, this sample might be a single voidingsample collected at the workplace. For less serious exposures, anovernight (simulated 12-hour) or simulated 24-hour sample providesconfidence that body equilibrium has been achieved and may bemore convenient.
Follow-up sampling should be performed to confirm the initialsample results if implied doses might exceed 100 mrem. Additionalfollow-up samples may be warranted to verify the applicability of the10-day retention half-time in the individual, or to assess a more

PNNL-MA-860 Chapter 4.0 Issued: January 31, 2000Page 4.14
0.00E+00
5.00E+01
1.00E+02
1.50E+02
2.00E+02
2.50E+02
3.00E+02
0 50 100 150 200 250 300 350 400
Days After Initial Intake
Co
nc
en
tra
tio
n o
f T
riti
um
in
Uri
ne
(d
pm
/ml
pe
r m
icro
Ci
Inta
ke
)
7 day intake interval 14 day intake interval 30 day intake interval
Figure 4.2. Excretion of Tritium Following Multiple Intakes Based on the ICRP 30 Model andAssuming 1-µCi Intake per Interval
suitable half-time. To adequately determine the degree of agreementbetween observed and anticipated retention may require only two orthree samples over a period of about 3 weeks, or it may involve amore extended sampling program. The evaluator must exercisejudgment in determining the number of samples warranted. If theexposed worker is already on a routine (e.g., bi-weekly) monitoringfrequency, additional special sampling for follow-up may not berequired.
Once an exposure has been evaluated, elevated urine samples mightbe expected for some time (several months). If the worker returns towork that involves potential tritium exposure, a more frequentsampling program may be required until normal baselines are re-established. During this time period, consideration may need to begiven to the possibility that additional low-level uptakes of tritiummight occur, which could be undetectable due to variability in theexcretion pattern of tritium retained from the earlier intake.
4.4 Internal Dose Assessment Protocols for HTO
This section provides summary protocols for the assessment ofoccupational internal dose for HTO. As such, it applies the conceptsdescribed in Section 4.3 of the HIDP.

Issued: January 31, 2000 PNNL-MA-860 Chapter 4.0Page 4.15
4.4.1 Dose Assessment for a Single Acute Exposure
To calculate the committed effective dose equivalent from an acuteintake of tritium based on a single urine sample result, proceed asfollows:
1. Calculate the sample concentration, Ct, in dpm/ml.
ml,volumesampledpm,resultreportedCt = (4.15)
2. Calculate the initial body water concentration, C0, in dpm/ml.
t0693.0t
0e
CC ×−= (4.16)
where t is the time in days between the intake and the collection ofthe urine sample.
3. Calculate the committed effective dose equivalent, HE, in mrem.
0E C0013.0H ×= (4.17)
4.4.2 Dose Assessment for Chronic Exposure
To calculate the committed effective dose equivalent from a chronicexposure to tritium (assuming the equilibrium condition), proceed asfollows:
1. Calculate the body water equilibrium concentration, Ceq, indpm/ml.
)ml(volumesample)dpm(resultreportedCeq = (4.18)
2. Calculate the committed effective dose equivalent, HE, in mrem,for the interval of the exposure (t, in days).
( )[ ] eq5
E C0013.0t107.8H ×+××= − (4.19)
4.4.3 Dose Assessment for Periodic Samples
In situations where periodic samples are obtained, not associatedwith specifically identified intakes but rather with ongoing workpractices, an average concentration and dose associated with asampling interval can be calculated. The choice of an arithmetic

PNNL-MA-860 Chapter 4.0 Issued: January 31, 2000Page 4.16
mean versus a logarithmic mean has little impact on the doseestimates for intervals of 1 month or less (La Bone 1992). The dosefor each sampling interval can be calculated using Equations (4.11)and (4.12), and the total dose for multiple intervals (e.g., for a year)can be calculated by summing the interval doses for the total period.This approach lends itself well to a simple computer spreadsheetapplication software, which the HIDP typically uses for these cases.
4.5 Management of Internal Contamination Cases
The primary treatment for reducing internal dose from a tritiumuptake is to accelerate the turnover of body water. This can be doneby substantially increasing the fluid intake rate of an individualthrough oral or intravenous means, and/or using diuretics(Bhattacharyya et al. 1992; NCRP 1980; IAEA 1978). A case studyby Lloyd et al. (1986) of therapy for two HTO intakes indicated thatdiuresis therapy while hospitalized resulted in a 2.7-day clearancehalf-time, compared with a 10-day normal clearance half-time, and asustained drinking regime gave a clearance half-time of about 6 days.Dose-mitigating actions should be recommended by theOccupational Medicine Department of the Hanford EnvironmentalHealth Foundation (HEHF) in consultation with Internal Dosimetry.
4.6 Tritium Monitoring Program for the 400 Area
The 400 Area of Hanford Site, which includes the Fast Flux TestFacility (FFTF), obtains its drinking water from groundwater wells.Some of these wells contain low levels of tritium (below the EPAdrinking water standards) originating from aquifer contamination bythe past operation of 200 Area fuel processing and waste manage-ment facilities (Jaquish and Bryce 1989). Planned operationssupporting fusion materials research were expected to produce largequantities of tritium, resulting in the need for a routine tritiumbioassay program. In FFTF workers, the existence of potentiallydetectable tritium, which could be attributable to environmentalsources rather than occupational exposure, warranted establishing ascreening level to use as a basis for initiating investigations and doseassessments of potential occupational exposure.
A baseline bioassay monitoring program was undertaken for FFTFworkers prior to the commencement of the tritium operations(Carbaugh, Sula, and McFadden 1990). Forty-seven urine sampleswere collected from FFTF operations personnel over a 5-monthperiod in early 1989. The sample data are plotted in Figure 4.3.

Issued: January 31, 2000 PNNL-MA-860 Chapter 4.0Page 4.17
Figure 4.3. Tritium Urine Concentration in Occupationally Unexposed FFTF Workers
Based on the curve fit, it was estimated that the geometric mean was3 dpm/ml and the tritium concentration corresponding to the99.9 percentile for environmental exposure at FFTF was 40 dpm/ml.This concentration is similar to the present 20,000 pCi/l (44 dpm/ml)EPA Drinking Water Standard for tritium (EPA 1976).
The minimum detectable committed effective dose equivalentassociated with a 40-dpm/ml tritium screening level was estimated tobe 1.2 mrem for chronic equilibrium exposure conditions, 5 mremfor acute intakes with weekly to monthly sample intervals (theanticipated range of sampling intervals), and 100 mrem for quarterlyintervals.
Because of the low dose potentially associated with chronic exposureor anticipated sampling intervals, use of the 99.9 percentile isjustifiable on a cost-benefit basis. Thus, 40 dpm/ml was selected as

PNNL-MA-860 Chapter 4.0 Issued: January 31, 2000Page 4.18
a baseline level for tritium in 400 Area workers. Results below40 dpm/ml are considered normal for persons working in the400 Area. Results in excess of 40 dpm/ml indicate potentialoccupational exposure.
4.7 Organically Bound Tritium
While this chapter was being written a DOE work group wasstudying the issue of special tritium compounds (STCs), includingorganically bound tritium (OBT). The HIDP should be contacted forthe status of this work and any recommendations associated withmonitoring or dosimetry for OBT. Hanford facilities have notspecifically identified sources of OBT. It is anticipated that OBTcan be found in ingested foods, machinery oil used in tritiumfacilities, in laboratory compounds labeled for research purposes, orin wastes received from other DOE facilities. The NCRP has alsoaddressed the issue of dosimetry for tritium-labeled organiccompounds incorporated into genetic material in NCRP 63 (NCRP1979b). The following paragraphs provide a current summary ofwork in progress.
In its publication 56 (1989), the ICRP recommended a f1 factor of 1.0for GI tract absorption to blood for OBT, and proposed atwo-component retention model for OBT. The OBT modelsuggested that 50% of the OBT would be associated with body waterand demonstrate the tritiated water half-time of 10 days. Theremaining 50% would be associated with carbon-hydrogen bondingin tissues and would demonstrate a metabolic turnover rate similar tocarbon (biological half-time of 40 days). The formulation of theretention function is as follows:
40t693.0
10t693.0
e5.0e5.0)t(R−−
+= (4.20)
with t in days.
Equilibrium between body water (e.g., urine) and OBT is not anappropriate assumption because of the substantial fraction bound toorganic molecules. Thus, daily urinary excretion of OBT must beconsidered for bioassay interpretation.
The effective dose coefficients, e(50), for OBT, as tabulated by ICRPin publications 67 (1993), 68 (1994), 71 (1995), and 78 (1997) are asfollows:
Inhalation e(50) 4.1E-11 Sv/BqIngestion e(50) 4.2E-11 Sv/Bq

Issued: January 31, 2000 PNNL-MA-860 Chapter 4.0Page 4.19
The DOE (1999) has established a radiological control technicalposition for OBT. In that position it was stated that the doseconversion factors of ICRP 71 for OBT provide an acceptable basisfor determining air concentration values for meeting workplacecontrols and demonstrating compliance with dose limits. Theinhalation air concentration value of 1E-5 µCi/ml or 4E+5 Bq/m3
may be used in a manner similar to a DAC.
4.8 Tritiated Particulate Aerosols
While this chapter was being written, a DOE working group wasstudying the issue of STCs, including tritiated particulate aerosols.The HIDP should be contacted for the status of this work and anyrecommendations associated with monitoring or dosimetry fortritiated particulates. The following paragraphs provide a currentsummary of work in progress.
Tritiated particulate aerosols result from tritium being absorbed andretained on metal surfaces such as getters for tritium collection andstorage devices (typically these are in the form of metal tritides) andas a residual contaminant in tritium production facilities. Anadditional possibility for tritiated particulates is tritiated metal oxides(e.g., rust and dust). At Hanford, a limited source of zirconiumtritide metal filings has been identified in the 325 Building.
Data available to the DOE STC Working Group suggest thatsolubility in lung fluid could vary over 5 orders of magnitude,making urine bioassay for the more insoluble forms highlyineffective. The ICRP has noted in publication 71 that titaniumtritide powder demonstrated absorption type M characteristics andprovided f1 values and effective dose coefficients for absorptiontypes F, M, and S. The desirability of a fecal analysis procedure fortritiated particulates has been identified but such a procedure doesnot presently exist. The DOE Mound Laboratory is using airsampling (including lapel samplers) to measure worker exposure toair concentrations and calculating internal dose from airconcentration and exposure time data.
As interim guidance, the DOE has established a technical position(1999) that the adult effective dose coefficients provided by ICRPpublication 71 for tritium particulate aerosols provide an acceptablebasis for determining air concentration values (corresponding toDACs), which may be used for meeting the workplace controls.That position included the statement that the most restrictive formsof tritiated particulate aerosols (type S) should be used unless

PNNL-MA-860 Chapter 4.0 Issued: January 31, 2000Page 4.20
material-specific parameters are developed and appropriatelyreviewed. Table 4.2 lists the effective dose coefficients and the airconcentration values.
4.9 References
American National Standard Institute (ANSI). 1983. InternalDosimetry Standards for Tritium. ANSI Standard N13.14-1983,New York.
Bhattacharyya, M. H., B. D. Breitenstein, H. Metivier,B. A. Muggenburg, G. N. Stradling, and V. Volf. 1992. “Guidebookfor the treatment of accidental internal radionuclide contamination ofworkers.” Rad. Prot. Dosim. 41:1
Brunner, P., P. Schneider, H. Scheicher, G. Seyerl, P. Kurnick,O. Ennemoser, and W. Ambach. 1996. “Tritium intake by exposureto plastic case watches.” Health Phys. 70(4):484-487.
Carbaugh, E. H., M. J. Sula, and K. M. McFadden. 1990. Use ofProbability Analysis to Establish Routine Bioassay Screening Levels.PNL-SA-17716, Pacific Northwest Laboratory, Richland,Washington.
Health Physics Society (HPS). 1994. Internal Dosimetry Programsfor Tritium Exposure—Minimum Requirements. HPS N13.14-1994.An American National Standard approved by American NationalStandards Institute, Health Physics Society, McLean, Virginia.
Hill, R. W., and J. R. Johnson. 1993. “Metabolism and dosimetry oftritium.” Health Phys. 65(6):628-647.
International Atomic Energy Agency (IAEA). 1978. Manual onEarly Medical Treatment of Possible Radiation Injury. Safety SeriesNo. 47, Vienna, Austria.
International Commission on Radiological Protection (ICRP). 1959.Report of Committee II on permissible dose for internal radiation.ICRP publication 2, Pergamon Press, New York.
International Commission on Radiological Protection (ICRP). 1969.Evaluation of radiation doses to body tissues from internalcontamination due to occupational exposure. ICRP publication 10,Pergamon Press, New York.

Issued: January 31, 2000 PNNL-MA-860 Chapter 4.0Page 4.21
International Commission on Radiological Protection (ICRP). 1974.Report of task group on Reference Man. ICRP publication 23,Pergamon Press, New York.
International Commission on Radiological Protection (ICRP). 1979.“Limits for intakes of radionuclides by workers.” (ICRP publication30, part 1 and supplements). Annals of the ICRP, 2:3-4, PergamonPress, New York.
International Commission on Radiological Protection (ICRP). 1989.“Age-dependent doses to members of the public from intakes ofradionuclides: Part 1.” (ICRP publication 56). Annals of ICRP,20:2, Pergamon Press, New York.
International Commission on Radiological Protection (ICRP). 1993.“Age-dependent doses to members of the public from intakes ofradionuclides: Part 2 ingestion dose coefficients.” (ICRPpublication 67). Annals of ICRP, 23:3-4, Pergamon Press,New York.
International Commission on Radiological Protection (ICRP). 1994.“Dose coefficients for intakes of radionuclides by workers.” (ICRPpublication 68). Annals of ICRP, 24:4, Pergamon Press, New York.
International Commission on Radiological Protection (ICRP). 1995.“Age-dependent doses to members of the public from intakes ofradionuclides: Part 4 inhalation dose coefficients.” (ICRPpublication 71). Annals of ICRP, 25:3-4, Pergamon Press,New York.
International Commission on Radiological Protection (ICRP). 1997.“Individual monitoring for internal exposure of workers.” (ICRPpublication 78). Annals of ICRP, 27:3-4, Pergamon Press,New York.
Jaquish, R. E., and R. W. Bryce, eds. 1989. Hanford SiteEnvironmental Report for Calendar Year 1988. PNL-6825, PacificNorthwest Laboratory, Richland, Washington.
Johnson, J. R. 1982. “The estimation of effective dose equivalentfrom tritiated water exposures using tritium concentrations in urine.”Rad. Prot. Dosim. 2(4):245-247.
La Bone, T. R. 1992. “Internal Dosimetry of Tritium.” WSRC-MS-92-072, Westinghouse Savannah River Company, Aiken,South Carolina.

PNNL-MA-860 Chapter 4.0 Issued: January 31, 2000Page 4.22
Lloyd, D. C., A. A. Edwards, J. S. Prosser, A. Auf der Maur,A. Etzweiler, U. Weickhardt, U. Gossi, L. Geiger, U. Noelpp, andH. Rosler. 1986. “Accidental intake of tritiated water: a report oftwo cases.” Rad. Prot. Dosim. 15:3(191-196).
Moghissi, A. A., and Cothern, C. R. 1986. “Backgroundinformation for the development of a standard for tritium in drinkingwater.” Rad. Prot. Dosim. 16(1-2):175-179.
National Council on Radiation Protection and Measurements(NCRP). 1976. Tritium Measurement Techniques. NCRP ReportNo. 47, Bethesda, Maryland.
National Council on Radiation Protection and Measurements(NCRP). 1979a. Tritium in the Environment. NCRP Report No. 62,Bethesda, Maryland.
National Council on Radiation Protection and Measurements(NCRP). 1979b. Tritium and Other Radionuclide Labeled OrganicCompounds Incorporated in Genetic Material. NCRP ReportNo. 63, Bethesda, Maryland.
National Council on Radiation Protection and Measurements(NCRP). 1980. Management of Persons Accidentally Contaminatedwith Radionuclides. NCRP Report No. 65, Bethesda, Maryland.
U.S. Department of Energy (DOE). 1999. Acceptable Approach forDeveloping Air Concentration Values for Controlling Exposures toTritiated Particulate Aerosols and Organically-Bound Tritium.Radiological Control Technical Position, RCTP 99-02, Office ofWorker Protection Programs and Hazards Management,Washington, D.C.
U.S. Environmental Protection Agency (EPA). 1976. NationalInterim Drinking Water Regulations. EPA-5709-76-003,Washington D.C.
U.S. Environmental Protection Agency (EPA). 1985.Environmental Radiation Data—Report 42. EPA 520/5-85--031,Eastern Environmental Radiation Facility, Montgomery, Alabama.
U.S. Environmental Protection Agency (EPA). 1988. LimitingValues of Radionuclide Intake and Air Concentration and DoseConversion Factors for Inhalation, Submersion, and Ingestion.Federal Guidance Report No. 11, EPA-520/1-88-020,Washington, D.C.

5.0 Cesium
This chapter provides technical information on the sources, characteristics, and biokinetics of radiocesium and summarizes the technical basis used for its internal dosimetry at Hanford. Dosimetry methods used for radiocesium are based on the concepts of ICRP 30 (ICRP 1979a), as implemented using the CINDY computer code (Strenge et al. 1992). A summary of 137Cs dosimetric data is tabulated in Table 5.1. Details are provided in the following sections.
Table 5.1. Summary of 137Cs Hanford Dosimetric Data
Radiological Half-Life 30.0 years Inhalation Model Class D—all compounds (ICRP 30, ICRP 54) GI Absorption (f1) 1 for all compounds Systemic Biokinetic Model Uniform distribution in all body organs and tissues.
Two component exponential compartment retention. Component Fraction Half-Time A 0.1 2 d B 0.9 110 d Excretion Fractions Urine 0.80
Feces 0.20 Dose (HE,50) Coefficients(a)
1-µm AMAD Inhalation 5-µm AMAD Inhalation Soluble Ingestion
0.032 mrem/nCi and 8.6E-09 Sv/Bq 0.046 mrem/nCi and 1.2E-08 Sv/Bq 0.050 mrem/nCi and 1.4E-08 Sv/Bq
Derived Air Concentration(b) (DAC) 7E-08 µCi/ml and 2E+03 Bq/m3
Annual Limit on Intake Inhalation(c)
Soluble Ingestion(d)
168 µCi and 4.8 MBq 100 µCi and 4 MBq
(a) Calculated using CINDY and ICRP 30 methods for Reference Man. (b) From 10 CFR 835 Appendix B, stochastic limit-based, class D, 1-µm AMAD. (c) Calculated as 10 CFR 835 DAC x 2400 m3. (d) From EPA Federal Guidance Report No. 11 (EPA 1988).
5.1 Sources and Characteristics of Radiocesium
The most important radionuclide of cesium at Hanford from an internal exposure standpoint is 137Cs (T1/2 = 30.0 y), a fission product. Historically, 134Cs (T1/2 = 2.1 y, produced by neutron activation of stable 133Cs) was observed at activities on the order of less than 5% of the 137Cs activity during Hanford production operations. However, with the lack of production by new sources at
Issued: January 31, 2003 PNNL-MA-860 Chapter 5.0 Page 5.1

Hanford and the normal radiological decay process, 134Cs is no longer a significant nuclide in Hanford fission product or waste mixtures. Further discussion for this technical basis is limited to 137Cs. Because of its relatively high fission yield and its long half-life, 137Cs, along with 90Sr, is one of the most abundant radionuclides in aged fission product mixtures. More volatile than most of the longer-lived fission product radionuclides, cesium is more apt to escape containment or confinement and is commonly the most abundant radionuclide found in fission product releases within a facility. As discussed later, 137Cs is easily detected using in vivo bioassay techniques and can serve as a good indicator radionuclide for intakes of fission products, waste mixtures, and spent fuel. In addition to its presence in mixtures, 137Cs has existed in relatively pure form at the Waste Fractionation Facility (B-Plant, 221-B) and the Waste Encapsulation and Storage Facility (WESF, 225-B). Encapsulation programs at WESF have been terminated; however, cesium-bearing capsules and cesium-contaminated equipment are stored in the facility. Cesium has been found to be more dispersible than strontium, and therefore in most intake situations involving 137Cs and 90Sr, 137Cs will likely constitute the major component of intake. In cases where it is suspected that 90Sr or other radionuclides may be present along with 137Cs but no radionuclide ratio information exists, it is prudent to consider additional bioassay appropriate for the other radionuclides of concern.
5.2 Environmental Levels of 137Cs
Cesium-137 is present throughout the world environment as a result of atmospheric testing of nuclear weapons and releases from the 1986 Chornobyl nuclear accident in Ukraine. Elevated levels of 137Cs in caribou and reindeer have long been recognized as contributing to detectable levels in people who consume such meats, and fish have also been identified as concentrators of environmental cesium (NCRP 1977). Following the Chornobyl accident, whole body activity levels of 137Cs in humans were widely reported in the literature (e.g., Tarroni et al. 1990; Strand et al. 1989; Lloyd 1990; and Kang 1989). Generally these levels were in the range of a few nanocuries, although Strand et al. indicated microcurie quantities in Lapps who breed reindeer.
PNNL-MA-860 Chapter 5.0 Issued: January 31, 2003 Page 5.2

Potential transfer of radioactivity through the food chain received world-wide attention following the Chornobyl accident. In 1989 the joint World Health Organization (WHO)/Food and Agriculture Organization (FAO) established a guideline level of 1000 Bq/kg (27 nCi/kg) for cesium contamination in foods moving in international trade (WHO 1989). As summarized by Woodman and Nisbet (1999), the European Union has established additional intervention levels for cesium marketed in human foodstuffs and animal feeds. Mushrooms can also be a potentially significant source of radiocesium intake. The radiocesium content of mushrooms depends on the species, locality of growth, and radiocesium in the local soil. Nakajima et al. (1998) reported levels of 3 to 18 nCi/g in mushrooms grown in the contaminated areas near Chornobyl. Mushrooms imported to France from Austria were removed from the retail market in 1998 after levels as high as 135 nCi/kg were discovered. The possible existence of 137Cs at the foregoing levels complicates interpretation of the source of low-level cesium that might be detected in routine whole body examinations. An attempt should be made to ascertain whether the detected levels are most likely of occupational or environmental origin: if occupational, then dose assessment may be warranted; if environmental, then occupational dose assessment is not warranted. For workers who regularly consume large wild game, it might be reasonable to conclude that a few nanocuries of 137Cs may represent nonoccupational intake. This can be further investigated if samples of meat can be obtained for direct assessment. However, even then conclusions may be tenuous because only limited data are available regarding expected variation throughout the Pacific Northwest. These data, obtained by counting meat samples provided by Hanford workers showing detectable levels of 137Cs in their periodic whole body exams, indicate over 3 orders of magnitude of variability (MacLellan et al. 1993). Likewise, for a worker who has spent time in a location known to be potentially affected by elevated cesium levels (e.g., Ukraine, Europe, Scandinavian countries, or Russia), it may also be reasonable to assume environmental exposure. Such exposure would probably result from consumption of locally obtained meat, dairy products, or produce. Consideration should be given to the location where one was exposed, length of time there, food consumption, and elapsed time since exposure in determining the likelihood that environmental sources were responsible for cesium intake.
Issued: January 31, 2003 PNNL-MA-860 Chapter 5.0 Page 5.3

5.3 Biokinetic Behavior of Radiocesium
ICRP 30 (1979a) classifies all isotopes of cesium as inhalation class D, indicating that inhaled material will be absorbed rapidly from the respiratory tract into the circulatory system. This is consistent with observations at Hanford. From the blood, cesium is distributed uniformly in the body with no organ or tissues showing a higher concentration than muscle. For dose assessment purposes, cesium is assumed to be completely and rapidly absorbed into systemic circulation from both the respiratory tract and the GI tract (f1 factor = 1). The retention of stable cesium is described as two compartments, with 10% exhibiting a clearance half-time of 2 days and 90% exhibiting a clearance half-time of 110 days. Mathematically, the systemic compartment biokinetic model for stable cesium is depicted as follows:
⎥⎦⎤
⎢⎣⎡ ×−+⎥⎦
⎤⎢⎣⎡ ×−=
110t693.0exp9.0
2t693.0exp1.0)t(R (5.1)
where R(t) is the fraction of the initial uptake that is present in the body at t days post uptake. This systemic retention function is used for Hanford dosimetry unless there are sufficient data on an individual to identify an alternate function. For systemic excretion, the ICRP 54 (1988) split of 80% to urine and 20% to feces is used as the normal assumption. The ICRP 30 systemic model is also used in the more recent ICRP publications 68 (ICRP 1994a) and 78 (ICRP 1997). Publication 78 notes that the biological clearance half-time from the transfer compartment to the systemic compartment (i.e., the translocation to body tissues) is 0.25 days. That publication also notes that females may exhibit significantly shorter retention half-times in the long-term compartment than males. The whole body retention fractions, urine excretion fractions, and feces excretion fractions for inhalation of class D particles of 1-µm, 5-µm AMAD, and for a soluble ingestion intake are shown in Tables 5.2, 5.3, and 5.4, respectively.
5.4 Internal Dosimetry for Radiocesium
Internal dosimetry for 137Cs can be performed using hand calculations based on the fundamental principles of time-integrated concentration of radioactivity in the body or by using the CINDY
PNNL-MA-860 Chapter 5.0 Issued: January 31, 2003 Page 5.4

Table 5.2. 137Cs Whole Body Retention Fractions
Days Post Intake
1-µm-AMAD Class D Inhalation
5-µm-AMAD Class D Inhalation
Soluble Ingestion
1 0.62 0.89 0.98 2 0.60 0.86 0.95 7 0.55 0.79 0.87
14 0.52 0.75 0.83 30 0.47 0.68 0.75 60 0.39 0.56 0.62 90 0.32 0.46 0.51
180 0.18 0.26 0.29 365 0.056 0.080 0.088 730 0.0055 0.0079 0.0087
1825 5.1E-06 7.4E-06 8.1E-06
Table 5.3. 137Cs Urine Excretion Fractions
Days Post Intake
1-µm-AMAD Class D Inhalation
5-µm-AMAD Class D Inhalation
Soluble Ingestion
1 1.3E-02 2.1E-02 2.5E-02 2 1.3E-02 1.8E-02 2.0E-02 7 4.8E-03 6.6E-03 7.2E-03
14 2.8E-03 4.0E-03 4.4E-03 30 2.4E-03 3.4E-03 3.8E-03 60 2.0E-03 2.8E-03 3.1E-03 90 1.6E-03 2.3E-03 2.6E-03
180 9.1E-04 1.3E-03 1.4E-03 365 2.8E-04 4.0E-04 4.5E-04 730 2.8E-05 4.0E-05 4.4E-05
1825 2.6E-08 3.7E-08 4.1E-08
Table 5.4. 137Cs Feces Excretion Fractions
Days Post Intake
1-µm-AMAD Class D Inhalation
5-µm-AMAD Class D Inhalation
Soluble Ingestion
1 3.2E-03 5.4E-03 6.2E-03 2 3.2E-03 4.6E-03 5.1E-03 7 1.2E-03 1.7E-03 1.8E-03
14 7.0E-04 1.0E-03 1.1E-03 30 5.9E-04 8.5E-04 9.4E-04 60 4.9E-04 7.1E-04 7.8E-04 90 4.0E-04 5.8E-04 6.4E-04
180 2.3E-04 3.3E-04 3.6E-04 365 7.0E-05 1.0E-04 1.1E-04 730 6.9E-06 9.9E-06 1.1E-05
1825 6.5E-09 9.3E-09 1.0E-08
Issued: January 31, 2003 PNNL-MA-860 Chapter 5.0 Page 5.5

computer code as an implementation of the ICRP 30 methodology. Similar approaches can be used for 134Cs, if dosimetry for that radionuclide is required.
5.4.1 Fundamental Principles Method
Because cesium is assumed to be distributed evenly throughout all tissues in the body, the stochastic dose equivalent (effective dose equivalent) is limiting for compliance purposes. Dose conversion factors for the radiocesiums were developed by Snyder et al., and published in ORNL-5000 (1974). These factors include the “total body dose” from activity deposited in the total body. Dosimetrically, this represents the most straightforward and technically appropriate way to express the total dose equivalent to the body when a radionuclide is uniformly distributed. The effective dose equivalent is derived from the “total body dose” by using a weighting factor of 1.0 for the total body as an organ. That is, the effective dose equivalent is equal to the “total body dose.” The total body dose conversion factors (DCFs) from ORNL-5000, are as follows:
DCF(134Cs) = 5.1 E-7 rem/nCi-day
DCF(137Cs) = 3.2 E-7 rem/nCi-day. Because cesium distributes relatively uniformly in the body, the dose received by individual organs and tissues is about the same as the total body dose. Thus, the dose received by specific organs and tissues can be assumed to be equivalent to the total body dose equivalent. Integrating the retention function (Equation 5.1) with respect to time and multiplying by the initial systemic uptake (Uo) yields the cumulated internal activity in activity-days (e.g., nCi-days). Multiplying this product by the DCF gives the effective dose equivalent over the time period of interest as follows:
⎥⎥
⎦
⎤
⎢⎢
⎣
⎡
λ×+
λ××=
×λ−−×λ−−
2eff
texp1
1eff
texp10t,E
2eff1eff
9.01.0UxDCFH (5.2)
where t = days post uptake λeff1 for both 134Cs and 137Cs = 0.35/day λeff2 (134) = 0.0072/day λeff2 (137) = 0.0064/day
PNNL-MA-860 Chapter 5.0 Issued: January 31, 2003 Page 5.6

The λeff values provided above are based on ICRP recommendations. However, for retrospective dose assessments, λeff values may be empirically determined from whole body counts. Equations 5.1 and 5.2 are specifically for the calculation of an internal dose equivalent following an acute uptake. In actuality, most uptakes occur following inhalation of airborne contamination and deposition in the lung precedes systemic uptake. Nevertheless, for exposures to readily transportable forms of cesium (class D), the dose received by the lung is negligible in comparison with the total body dose and can generally be ignored for dose assessment purposes. The exception to this is cases where actual retention in the respiratory tract exceeds a few days. In these situations, and as a general application, the CINDY computer code includes the lung in the effective dose equivalent.
5.4.2 Intake-Based Dosimetry Using the ICRP System and the CINDY Computer Code
In contrast to the “total body dose” approach described in the preceding section, the effective dose equivalents for radiocesiums published in the supplement to ICRP 30 (1979b) are based on the summing of weighted doses to specific organs meeting the ICRP criteria for inclusion in the effective dose equivalent (Watson and Ford 1980). Dose factors calculated in this way are slightly higher (about 10%) than those obtained using the total body dose approach, and this difference is attributed to conventions used by the ICRP rather than to technical merit. The computer code CINDY (Strenge et al. 1992) is used for most internal dose calculations at Hanford. The code employs ICRP 30 methods, biokinetic models, and specific effective energies for radiocesiums. When bioassay data are available, CINDY calculates intake based on the bioassay data and the biokinetic models specified. To obtain internal doses, CINDY calculates the integrated retention for the interval of interest (e.g., 50 years), and then applies the SEE factors to give committed organ and tissue dose equivalents. The weighted organ and tissue doses are summed to give effective dose. Thus, as noted in the previous paragraph, the doses calculated by CINDY for radiocesium intakes are slightly higher than those that might be calculated using the “total body” approach. For a 1-nCi intake of 137Cs, CINDY calculates the following dose coefficients: Class D inhalation 5-µm-AMAD particles: 0.046 mrem/nCi Class D inhalation 1-µm-AMAD particles: 0.032 mrem/nCi Soluble ingestion: 0.050 mrem/nCi
Issued: January 31, 2003 PNNL-MA-860 Chapter 5.0 Page 5.7

Derived reporting, investigation, and compliance levels (based on HE,
50 of 10 mrem, 100 mrem, and 5,000 mrem, respectively) have been calculated for 1-µm and 5-µm particle sizes. The derived levels for whole body retention (as might be measured by whole body counting) are shown in Tables 5.5 and 5.6, and the derived levels for daily urine excretion are shown in Tables 5.7 and 5.8.
Table 5.5. 137Cs Whole Body Reference Levels for 1-µm-AMAD Class D Inhalation
10-mrem HE,50 Reporting Level
100-mrem HE,50
Investigation Level5-rem HE,50
Compliance Level Inhalation Intake (nCi) 313 3,130 156,000
Days Post Intake
Whole Body
IRF(t) Derived Reporting
Level (nCi)
Derived Investigation Level
(nCi)
Derived Compliance Level
(nCi) 1 0.62 194 1,940 96,900 2 0.60 188 1,980 93,700 7 0.55 172 1,720 85,900
14 0.52 163 1,630 81,200 30 0.47 147 1,470 73,400 60 0.39 122 1,220 60,900 90 0.32 100 1,000 50,000
180 0.18 56.3 563 28,100 365 0.056 17.5 175 8,750 730 0.0055 1.72 17.2 859
1825 5.1E-06 0.00160 0.0160 0.797
Table 5.6. 137Cs Whole Body Reference Levels for 5-µm-AMAD Class D Inhalation
10-mrem HE,50
Reporting Level 100-mrem HE,50
Investigation Level5-rem HE,50
Compliance Level Inhalation Intake (nCi) 217 2,170 109,000
Days Post Intake
Whole Body
IRF(t) Derived Reporting
Level (nCi)
Derived Investigation Level
(nCi)
Derived Compliance Level
(nCi) 1 0.89 193 1,930 96,700 2 0.86 187 1,870 93,500 7 0.79 172 1,720 85,900
14 0.75 163 1,630 81,500 30 0.68 148 1,480 73,900 60 0.56 122 1,220 60,900 90 0.46 100 1,000 50,000 180 0.26 56.5 565 28,300 365 0.080 17.4 174 8,700 730 0.0079 1.72 17.2 859
1825 7.4E-06 0.00160 0.0160 0.804
PNNL-MA-860 Chapter 5.0 Issued: January 31, 2003 Page 5.8

Table 5.7. 137Cs Urine Excretion Reference Levels for 1-µm-AMAD Particles
10-mrem HE,50
Reporting Level 100-mrem HE,50
Investigation Level5-rem HE,50
Compliance Level Inhalation Intake (nCi) 313 3,130 156,000
Days Post Intake Urine IRF(t)
Derived Reporting Level (dpm)
Derived Investigation Level
(dpm)
Derived Compliance Level
(dpm) 1 1.3E-02 9,020 90,200 4,510,000 2 1.3E-02 9,020 90,200 4,510,000 7 4.8E-03 3,330 33,300 1,670,000
14 2.8E-03 1,940 19,400 971,000 30 2.4E-03 1,670 16,700 832,000 60 2.0E-03 1,390 13,900 694,000 90 1.6E-03 1,110 11,100 555,000
180 9.1E-04 631 6,310 316,000 365 2.8E-04 194 1,940 97,100 730 2.8E-05 19 194 9,710
1825 2.6E-08 0.02 0.18 9.02
Table 5.8. 137Cs Urine Excretion Reference Levels for 5-µm-AMAD Particles
10-mrem HE,50
Reporting Level 100-mrem HE,50
Investigation Level5-rem HE,50
Compliance Level Inhalation Intake (nCi) 217 2,170 109,000
Days Post Intake Urine IRF(t)
Derived Reporting Level (dpm)
Derived Investigation Level (dpm)
Derived Compliance Level
(dpm) 1 2.1E-02 10,100 101,000 5,070,000 2 1.8E-02 8,690 86,900 4,340,000 7 6.6E-03 3,190 31,900 1,590,000
14 4.0E-03 1,930 19,300 965,000 30 3.4E-03 1,640 16,400 820,000 60 2.8E-03 1,350 13,500 676,000 90 2.3E-03 1,110 11,100 555,000
180 1.3E-03 627 6,270 314,000 365 4.0E-04 193 1,930 96,500 730 4.0E-05 19.3 193 9,650
1825 3.7E-08 0.02 0.18 8.9
Issued: January 31, 2003 PNNL-MA-860 Chapter 5.0 Page 5.9

5.4.3 Comparison of Dosimetric Factors
The HIDP uses the dose factors of CINDY as the basis for most internal dosimetry applications. However, it is recognized that compilations of dosimetric factors have been made by various scientific and governmental bodies, based on different calculational methods or models. The dose coefficient for unit intake, DAC, and ALI calculated using CINDY, and as tabulated by DOE in 10 CFR 835, Appendix A (DOE 1998), the ICRP in publication 54 (ICRP 1988), the EPA in Federal Guidance Report No. 11 (EPA 1988), and the ICRP in publication 68 (ICRP 1994a) are shown in Table 5.9. Generally speaking, the differences in these tabulated values (with the exception of ICRP 68 inhalation values) are not significant and can be attributed to slightly different computer code algorithms and rounding practices. The ICRP 68 inhalation values, based on the ICRP 66 lung model (ICRP 1994b) and different organ/tissue weighting factors, are approximately a factor of 2 lower than those calculated using the ICRP 30 model. These values are tabulated for information and as a simple reference for the potential impact of dosimetry under different systems.
5.5 Bioassay for Radiocesium
The bioassay techniques, the recommended routine program, and the measurements required for monitoring radiocesium after an acute intake are discussed in the following sections.
5.5.1 Bioassay Method
The presence of 137Cs is detected by gamma spectroscopy using the 0.661-MeV photon of 137mBa, which is the short half-life (T1/2 = 2.5 min) progeny that exists in secular equilibrium with 137Cs. Gamma spectroscopy can be either for in vivo measurements or for excreta analysis. In vivo whole body counting is the preferred method for 137Cs bioassay, due to its simplicity. Urine sample gamma spectroscopy can also be highly effective if in vivo measurements cannot be readily obtained. Fecal sampling is not normally recommended due to the high absorption (theoretically, 100%) in the GI tract. (An exception might occur if a person was being treated with Prussian blue, whereby fecal results would aid in determining efficacy of the treatment.)
PNNL-MA-860 Chapter 5.0 Issued: January 31, 2003 Page 5.10

Table 5.9. Comparison of 137Cs Dosimetric Factors
Reference Source Class D Inhalation
1-µm AMAD Class D Inhalation
5-µm AMAD Soluble Ingestion Dose Coefficients CINDY (HE,50) 0.032 mrem/nCi
8.6E-09 Sv/Bq 0.046 mrem/nCi 1.2E-08 Sv/Bq
0.050 mrem/nCi 1.4E-08Sv/Bq
ICRP 54 (HE,50) 8.7E-09 Sv/Bq
(0.0322 mrem/nCi) NA NA
EPA Federal Guidance Report No.11 (HE,50)
8.63E-09 Sv/Bq and 0.0319 mrem/nCi
NA 1.35E-08 Sv/Bq and 0.050 mrem/nCi
ICRP 68 [e(50)] 4.8E-09 Sv/Bq
(0.0178 mrem/nCi) 6.7E-09 Sv/Bq (0.0248 mrem/nCi)
1.3E-08 Sv/Bq (0.0481 mrem/nCi)
Stochastic DAC 10 CFR 835, App. A 7E-08 µCi/ml and
2E+03 Bq/m3NA NA
EPA Federal Guidance Report No. 11
6E-08 µCi/ml and 2E-03 MBq/m3
NA NA
ICRP 30, ICRP 54 2E+03 Bq/m3 NA NA Annual Limit on Intake, ALI
Calculated from 10 CFR 835 DAC
168 µCi and 4.8 MBq
NA NA
ICRP 30 6 MBq NA 4 MBq EPA Federal Guidance Report No. 11
6 MBq and 200 µCi NA 4 MBq and 100 µCi
NA = not applicable.
Issued: January 31, 2003 PNNL-MA-860 Chapter 5.0 Page 5.11

5.5.2 In Vivo Measurements
Hanford whole body counting using a 3-minute count on the 5-NaI detector preview counter currently provides an MDA of 1.3 nCi 137Cs in the body of a male subject of average size. A 10-minute count using the coaxial germanium scanning detector system gives an MDA of about 1.0 nCi. The associated minimum detectable doses for class D inhalation of 1-µm and 5-µm particles are shown in Tables 5.10 and 5.11. Comparing these tables with the derived reference levels of Tables 5.12 and 5.13 shows that whole body counting provides excellent sensitivity for pure 137Cs. For the pure nuclide, an annual whole body count is appropriate bioassay monitoring. Cesium-137 is also often used as an indicator for other nuclides because of its isotopic abundance in Hanford waste mixtures. For such circumstances, 137Cs whole body counting can be used as an effective monitor for other nuclides (notably 90Sr and plutonium). The dosimetric significance of 137Cs compared with the other nuclides is highly variable, depending on the mixture ratios. Statements of minimum detectable dose for mixtures are beyond the scope of this chapter, and are treated elsewhere in the technical basis documentation (see Appendix E of this manual and the exhibits in Chapter 5.0 of PNL-MA-552).(a)
5.5.3 Excreta Analysis
Urine sample gamma spectroscopy can also be used to detect internal radiocesium; however, because of the ease and sensitivity of in vivo detection methods, it is not commonly used for Hanford monitoring. As shown in the minimum detectable dose compilations of Tables 5.14 and 5.15, urinalysis gamma spectrometry can provide excellent bioassay monitoring sensitivity. This sensitivity makes offsite urine sample collection a viable alternative for follow-up measurement of former workers who left the area without obtaining a termination whole body count.
5.5.4 Routine Bioassay Monitoring Protocol
Annual in vivo measurements are recommended for periodic retrospective bioassay monitoring of workers potentially exposed to mixtures of radionuclides containing radiocesium. Even though in vivo measurement capabilities are sufficiently sensitive for a biennial
(a) Pacific Northwest National Laboratory (PNNL). Hanford Internal Dosimetry Project Manual.
PNNL-MA-552, Richland, Washington. (Internal manual.) Available URL: http://www.pnl.gov/eshs/pub/pnnl552.html
PNNL-MA-860 Chapter 5.0 Issued: January 31, 2003 Page 5.12

Table 5.10. Minimum Detectable Intakes and Doses (HE,50) for 1-µm-AMAD Inhalation Using the NaI Detector System (MDA = 1.3 nCi)
Days Post Intake
Whole Body IRF(t)
Minimum Detectable
Intake (nCi)
Minimum Detectable
Dose (mrem) 1 0.62 2.1 0.07 2 0.60 2.2 0.07 7 0.55 2.4 0.08
14 0.52 2.5 0.08 30 0.47 2.8 0.09 60 0.39 3.3 0.11 90 0.32 4.1 0.13
180 0.18 7.21 0.23 365 0.056 23 0.74 730 0.0055 240 7.6
1825 5.1E-06 250,000 8,2000 Table 5.11. Minimum Detectable Intakes and Doses (HE,50) for
5-µm-AMAD Inhalation Using the NaI Detector System (MDA = 1.3 nCi)
Days Post Intake
Whole Body IRF(t)
Minimum Detectable
Intake (nCi)
Minimum Detectable
Dose (mrem) 1 0.89 1.5 0.07 2 0.86 1.5 0.07 7 0.79 1.6 0.08
14 0.75 1.7 0.08 30 0.68 1.9 0.09 60 0.56 2.3 0.11 90 0.46 2.8 0.13
180 0.26 5.0 0.23 365 0.08 16 0.75 730 0.0079 170 7.6
1825 7.4E-06 180,000 8,100
Issued: January 31, 2003 PNNL-MA-860 Chapter 5.0 Page 5.13

Table 5.12. Minimum Detectable Intakes and Doses (HE,50) for 1-µm-AMAD Inhalation Using the Coaxial Germanium Detector System (MDA = 1.0 nCi)
Days Post Intake
Whole Body IRF(t)
Minimum Detectable
Intake (nCi)
Minimum Detectable
Dose (mrem) 1 0.62 1.6 0.05 2 0.60 1.7 0.05 7 0.55 1.8 0.06
14 0.52 1.9 0.06 30 0.47 2.1 0.07 60 0.39 2.6 0.08 90 0.32 3.1 0.10
180 0.18 5.6 0.18 365 0.056 18 0.57 730 0.0055 180 5.8
1825 5.1E-06 200,000 6,300 Table 5.13. Minimum Detectable Intakes and Doses (HE,50) for
5-µm-AMAD Inhalation Using the Coaxial Germanium Detector System (MDA = 1.0 nCi)
Days Post Intake
Whole Body IRF(t)
Minimum Detectable
Intake (nCi)
Minimum Detectable
Dose (mrem) 1 0.89 1.1 0.05 2 0.86 1.2 0.05 7 0.79 1.3 0.06
14 0.75 1.3 0.06 30 0.68 1.5 0.07 60 0.56 1.8 0.08 90 0.46 2.2 0.10
180 0.26 3.8 0.18 365 0.08 13 0.58 730 0.0079 130 5.8
1825 7.4E-06 140,000 6,200
PNNL-MA-860 Chapter 5.0 Issued: January 31, 2003 Page 5.14

Table 5.14. Minimum Detectable Intakes and Doses (HE,50) for 1-µm-AMAD Inhalation Using Urinalysis Gamma Spectrometry (MDA = 15 dpm/1)
Days Post Intake Urine IRF(t)
Minimum Detectable
Intake (nCi)
Minimum Detectable
Dose (mrem) 1 1.3E-02 0.7 0.02 2 1.3E-02 0.7 0.02 7 4.8E-03 2.0 0.06
14 2.8E-03 3.4 0.11 30 2.4E-03 3.9 0.13 60 2.0E-03 4.7 0.15 90 1.6E-03 5.9 0.19
180 9.1E-04 10.4 0.33 365 2.8E-04 34 1.08 730 2.8E-05 338 10.8
1825 2.6E-08 364,000 11,600
Table 5.15. Minimum Detectable Intakes and Doses (HE,50) for
5-µm-AMAD Inhalation Using Urinalysis Gamma Spectrometry (MDA = 15 dpm/1)
Days Post Intake Urine IRF(t)
Minimum Detectable
Intake (nCi)
Minimum Detectable
Dose (mrem) 1 2.1E-02 0.5 0.02 2 1.8E-02 0.5 0.02 7 6.6E-03 1.4 0.07
14 4.0E-03 2.4 0.11 30 3.4E-03 2.8 0.13 60 2.8E-03 3.4 0.16 90 2.3E-03 4.1 0.19
180 1.3E-03 7 0.33 365 4.0E-04 24 1.1 730 4.0E-05 236 11
1825 3.7E-08 256,000 11,800
Issued: January 31, 2003 PNNL-MA-860 Chapter 5.0 Page 5.15

frequency, the longer time between measurements makes investigation of potential exposures more difficult, and thus a minimum annual frequency is recommended. If radiocesium is detected through a routine measurement, then follow-up measurements to confirm the initial indication should generally be performed. Follow-up measurements can usually be most conveniently performed immediately following the initial measurement, while the subject is at the In Vivo Radioassay and Research Facility (IVRRF). Follow-up measurements should be performed as promptly as practical following an indication of an intake in order to facilitate any health physics investigation associated with the potential exposures. However, because of the high sensitivity of the in vivo measurement, verification measure-ments for cesium are not appreciably affected by delays of a few days to a month in obtaining them. Follow-up in vivo measurements using high-resolution germanium detectors are preferred for identifying other radionuclides possibly associated with the exposure, to discriminate against interference from radon progeny, and because the germanium detectors provide a more precise and accurate measurement. In addition to follow-up in vivo measurements, special bioassay should be considered for other significant nuclides (e.g., 90Sr or plutonium urinalysis, plutonium fecal analysis), if 137Cs is a mixture indicator nuclide.
5.5.5 Bioassay Measurements Following an Acute Intake
An in vivo examination should be performed after any indication of an intake of radiocesium. Unless the exposure appears to be of such magnitude that medical treatment to aid its removal is considered, the exam may be scheduled as convenient within several days of the intake, without significantly compromising the dosimetric sensitivity of the measurement. Appropriate bioassay for all significant radionuclides potentially involved in the exposure should be considered in the follow-up investigation. Because of the wide range of waste mixtures in Hanford facilities, a standard default mixture is no longer used for general internal dosimetry. In the event of an exposure, the composition of the source mixture should be determined by appropriate analysis of a representative sample of the material, or alternatively, special bioassay for the appropriate specific nuclides should be performed. The interpretation of in vivo measurements performed shortly after intake may be complicated by early transport of material through the lung and GI tract. Measurements performed after about 5 days post intake are more appropriate for dose evaluation. For intakes
PNNL-MA-860 Chapter 5.0 Issued: January 31, 2003 Page 5.16

potentially above a 100-mrem committed effective dose equivalent (considering all radionuclides contributing), long-term follow-up bioassay measurements should be considered to monitor internal radioactivity levels and establish individual retention characteristics.
5.6 Assessment of Internal Dose Equivalent
The assessment of the internal dose equivalent from 137Cs is normally accomplished by evaluation of in vivo measurement results. Committed dose equivalents are assessed for any confirmed internal exposure not attributed to environmental or other nonoccupational sources. Assessed committed effective dose equivalents below 100 mrem may be based on a single bioassay measurement and the standard biokinetic models described in this chapter. Assessments of internal dose equivalent that potentially exceed a committed effective dose equivalent of 100 mrem should be based on observed retention to the extent practicable. The ICRP 30 model for uptake and retention of cesium was described previously. The rapidly clearing compartment has little effect on the total dose equivalent received from an intake and can be ignored in retrospective dose assessments based on observed in vivo retention. As an alternative approach, default biokinetic assumptions about internal deposition and retention of cesium can be modified to obtain a better fit between the observed retention data and the model. The modified model can then be used to calculate dose equivalents. CINDY can be used for this intake and dose assessment, or if based on limited bioassay data, the tabulated values of this chapter can be used in conjunction with the basic formulas of Chapter 2.0. Because cesium distributes relatively uniformly in the body, the dose received by individual organs and tissues is about the same as the effective dose equivalent. To simplify the recording of doses to specific organs and tissues, the dose to uniformly distributed radionuclides is ascribed to a single organ category called “total body.” That is, assessments of exposure to radiocesium will include the committed effective dose equivalent, which is equivalent to the total body dose equivalent, which, in turn, is equivalent to the dose received by any organ. The “total body” designation thus serves as a surrogate for any specific organ or tissue in the body.
5.7 Management of Internal Contamination Cases
Although one of the most abundant radionuclides at Hanford, historically 137Cs has not contributed significantly to internal doses. Cesium-137 is easily detected by whole body counting and therefore
Issued: January 31, 2003 PNNL-MA-860 Chapter 5.0 Page 5.17

early measurements can result in fairly rapid intake and dose assessments. Primary considerations that might cause some difficulty for interpretation of initial in vivo measurements are possible external contamination on the subject, the rapid translocation and elimination that occurs shortly after intake, and the possibility of a nonoccupational source. Being a major fission product radionuclide, 137Cs is often accompanied by other fission product radionuclides. Thus, investigation of internal exposures involving 137Cs should also consider that other radionuclides may be involved. The most effective measure for removal of cesium from the body is by oral administration of Prussian blue. Prussian blue is a drug that must be administered by competent medical authorities. Prussian blue is not absorbed from the intestine and it binds the cesium ions that are enterically cycled into the GI tract, so that the cesium is not reabsorbed. The treatment can reduce the biological half-life to about one-third of its usual value. The effectiveness of the treatment depends on how soon after exposure it is started (NCRP 1980). Bhattacharyya et al. (1992) recommended administrations of 3 to 4 g of Prussian blue in water orally divided over three doses per day, continued for as long as effective. Significant human experience with Prussian blue therapy resulted from the Goiania, Brazil accident in which several members of the public incurred very high 137Cs intakes when a medical therapy machine was stolen for salvage and the source was unknowingly opened (IAEA 1988). Dunstana et al. (1994) reported dose reductions of 51 to 84% based on orally administered dosages of Prussian blue from 3 to 10 g/d. An excellent case study of this accident, the associated dosimetry, and the medical case management is described by the International Atomic Energy Agency (IAEA 1998). The IAEA report includes a large citation of references appropriate for case management.
5.8 References
10 CFR 835. 1998. U.S. Department of Energy. “Occupational Radiation Protection.” U.S. Code of Federal Regulations. Bhattacharyya, M. H., B. D. Breitenstein, H. Metivier, B. A. Muggenburg, G. N. Stradling, and V. Volf. 1992. “Guidebook for the treatment of accidental internal radionuclide contamination of workers,” eds. G. B. Gerber and R. G. Thomas. Rad. Prot. Dosim. 41:1.
PNNL-MA-860 Chapter 5.0 Issued: January 31, 2003 Page 5.18

Dunstana, R. M., J. L. Lipsztein, A. N. de Oliveira Carlos, and L. Bertelli. 1994. “Cs-137 internal contamination involving a Brazilian accident, and the efficacy of Prussian blue treatment.” Health Phys. 66(3):245-252. International Atomic Energy Agency (IAEA). 1988. The Radiological Accident in Goiana. Vienna, Austria. International Atomic Energy Agency (IAEA). 1998. Dosimetric and Medical Aspects of the Radiological Accident in Goiana in 1987. IAEA-TECDOC-1009, Vienna, Austria. International Commission on Radiological Protection and Measurements (ICRP). 1979a. “Limits for intakes of radionuclides by workers.” (ICRP publication 30, part 1.) Annals of the ICRP, 2:3-4, Pergamon Press, New York. International Commission on Radiological Protection and Measurements (ICRP). 1979b. “Limits for intakes of radionuclides by workers.” (ICRP publication 30, supplement to part 1.) Annals of the ICRP, 3:1-4, Pergamon Press, New York. International Commission on Radiological Protection and Measurements (ICRP). 1988. “Individual monitoring for intakes of radionuclides by workers: design and interpretation.” (ICRP publication 54.) Annals of the ICRP, 19:1-3, Pergamon Press, New York. International Commission on Radiological Protection and Measurements (ICRP). 1994a. “Dose coefficients for intakes of radionuclides by workers.” (ICRP publication 68.) Annals of the ICRP, 24:4, Pergamon Press, New York. International Commission on Radiological Protection and Measurements (ICRP). 1994b. “Human respiratory tract model for radiological protection.” (ICRP publication 66.) Annals of the ICRP, 24:1-3, Pergamon Press, New York. International Commission on Radiological Protection and Measurements (ICRP). 1997. “Individual monitoring for internal exposure of workers.” (ICRP publication 78.) Annals of the ICRP, 27:3-4, Pergamon Press, New York. Kang, C. 1989. “Measurements of whole body radiocesium at the Harwell Laboratory, 1976-1988.” Health Phys. 57:995-1001.
Issued: January 31, 2003 PNNL-MA-860 Chapter 5.0 Page 5.19

Lloyd, R. D. 1990. “Chernobyl fallout radionuclides in Utah residents.” Health Phys. 58:533-534. MacLellan, J. A., T. P Lynch, G. A. Rieksts, and R. L. Brodzinski. 1993. “Identification of environmentally derived cesium-137 burdens in a worker population.” In Environmental Health Physics: Proceeding of the 26th Midyear Topical Meeting of the Health Physics Society, eds. R. L. Kathren, D. H. Denham, and K. Salmon. Columbia Chapter, Health Physics Society, Richland, Washington. Nakajima, H., H. Ryo, T. Nomura, T. Saito, Y. Yamaguchi, and K. G. Yeliseeva. 1998. “Radionuclides carved on the annual rings of a tree near Chernobyl.” Health Phys.74(2):265-267. National Council on Radiation Protection and Measurements (NCRP). 1977. Cesium-137 from the Environment to Man: Metabolism and Dose. NCRP Report No. 52, Washington, D.C. National Council on Radiation Protection and Measurements (NCRP). 1980. Management of Persons Accidentally Contaminated with Radionuclides. NCRP Report No. 65, Bethesda, Maryland. Snyder, W. S., M. R. Ford, G. G. Warner, and S. B. Watson. 1974. A Tabulation of Dose Equivalent per Microcurie-Day of Source and Target Organs of an Adult for Various Radionuclides. ORNL-5000, Vol. 1 and 2, Oak Ridge National Laboratory, Oak Ridge, Tennessee. Strand, P., E. Bøe, L. Berteig, T. Berthelsen, T. Strand, K. Trygg, and O. Harbit. 1989. “Whole body counting and dietary surveys in Norway during the first year after the Chernobyl accident.” Rad. Prot. Dosim. 27(3):163-171. Strenge, D. L., R. A. Kennedy, M. J. Sula, and J. R. Johnson. 1992. Code for Internal Dosimetry (CINDY Version 1.2), Part 1: Conceptual Representation. PNL-7493 Pt. 1, Rev. 1. Pacific Northwest National Laboratory, Richland, Washington. Tarroni, G., C. Melandri, P. Battisti, C. M. Castellani, M. Formignani, and E. Rampa. 1990. “137Cs and 134Cs human internal contamination in Italy following the 1986 Chernobyl event.” Rad. Prot. Dosim. 32(4):259-271. U.S. Environmental Protection Agency (EPA). 1988. Limiting Values of Radionuclide Intake and Air Concentration and Dose Conversion Factors for Inhalation, Submersion, and Ingestion. Federal Guidance Report No. 11, EPA-520/1-88-020, Washington, D.C.
PNNL-MA-860 Chapter 5.0 Issued: January 31, 2003 Page 5.20

Watson, S. B., and M. R. Ford. 1980. A User’ s Manual to the ICRP Code-A Series of Computer Programs to Perform Dosimetric Calculations for the ICRP Committee 2 Report. ORNL/TM-6980, Oak Ridge National Laboratory, Oak Ridge, Tennessee. Woodman, R. F. M., and A. F. Nisbet. 1999. “Derivation of working levels for radionuclides in animal feedstuffs for use following a nuclear accident.” Health Phys. 77(4):383-391. World Health Organization (WHO). 1989. “WHO-FAO Coden Alimentarius Commission agrees activity levels in foods.” Health Phys. 57:1048.
Issued: January 31, 2003 PNNL-MA-860 Chapter 5.0 Page 5.21

6.0 Strontium
This chapter provides technical information on the sources of radiostrontium and its characteristics, and summarizes the technical basis used for its internal dosimetry at Hanford. Dosimetry methods used are based on the concepts of ICRP 30 (1979), as implemented using the CINDY computer code (Strenge et al. 1992). Because of its long radiological half-life, 90Sr (with its secular equilibrium progeny 90Y) is now the strontium isotope of significance at Hanford. Some information for the short-lived 89Sr is also included here for historical purposes. A summary of the 90Sr dosimetric data is tabulated in Table 6.1. A brief history of the strontium evaluation methods used at Hanford is also provided. Details are provided in the following sections.
Table 6.1. Summary of 90Sr Hanford Dosimetric Data
Systemic Excretion Fractions Urine: 0.8 Feces: 0.2 Chemical Form: All Forms except Sr-Titanate Titanate Inhalation Model Class D (default) Class Y GI Absorption (f1) 0.3 0.01 Committed Effective Dose Coefficients 1-µm AMAD Inhalation 5-µm AMAD Inhalation Ingestion Transportable Injection
0.22 mrem/nCi 0.27 mrem/nCi 0.13 mrem/nCi (soluble) 0.41 mrem/nCi
1.3 mrem/nCi 0.48 mrem/nCi 0.011 mrem/nCi (insoluble) Not applicable
6.1 Sources and Characteristics of Strontium at Hanford
The isotopes of dominant concern for strontium internal dosimetry are 90Sr and its decay product 90Y. These nuclides may be found in almost any Hanford facility that deals with fission products or fission product waste mixtures. Most facilities that have strontium may also be expected to have other fission products present, notably 137Cs, and it is a common practice to use 137Cs as an indicator of potential 90Sr. This can be a valid assumption, because both nuclides have comparable yields from the fissioning of 235U (see Table 6.2). However, it must be noted that some Hanford chemical processes have separated cesium from strontium, and relatively pure 90Sr may be associated with laboratories, waste separation facilities (notably B-Plant, [221-B]) and the Waste Encapsulation and Storage Facility (WESF, [225-B Building]), and waste storage tank sludge.
Issued: January 31, 2003 PNNL-MA-860 Chapter 6.0 Page 6.1

Table 6.2. 90Sr Fission Product Yields(a)
Fissionable Nuclide FP Mass 90,% FP Mass 137,%
233U 6.9 6.81 235U 5.91 6.22
239Pu 2.11 6.7 (a) From General Electric Co. (1983)
Thus, caution must be exercised because the 90Sr/137Cs ratio is highly variable between and within facilities. This use of a ratio can be valid if the nature of facility contamination is known. When Hanford reactors were operating, the potential existed for 89Sr to also be a concern, most likely at N-Reactor, the fuel storage basins, FFTF, or the Plutonium-Uranium Extraction (PUREX) Plant. However, the short radiological half-life of 89Sr (50 days) and the long time that has elapsed since reactors operated indicates that 89Sr is no longer a concern at Hanford, unless a new source (e.g., material received from offsite) is established. The ORIGEN computer code (Hedengren 1985) indicated that, for N-Reactor, 6%, Mark IV (MKIV) fuel at discharge, there might have been about 90 times as much 89Sr as 90Sr. Exposure to such material would have been more limiting in terms of internal dose than exposure to just 90Sr. But because of the rapid decay of 89Sr, within about 6 months 90Sr became the dominant isotope of concern. Less than 1% of the 89Sr produced in fuel remained at 1 year after exposure, and, for practical purposes, that nuclide ceased to be a dosimetric concern by that time. Selected decay data for 90Sr, 90Y, and 89Sr are shown in Table 6.3.
Table 6.3. Decay Data for Strontium Isotopes
Parameter 90Sr 90Y 89Sr Half-Life 29.12 y 64.0 h 50.5 d Decay Constant 6.5E-05 d-1 0.26 d-1 0.014 d-1
Decay Mode Beta (no gamma)
Beta (no gamma)
Beta (no gamma)
For most internal dosimetry purposes, 90Sr and 90Y are the nuclides of concern. These nuclides are found in equilibrium in virtually all circumstances under which exposure is likely. Although strontium separation operations have been performed in which pure 90Sr might be obtained, the rapid ingrowth of the 90Y decay product results in the secular equilibrium condition being achieved within about 2 weeks after separation. Thus, even if an exposure to pure 90Sr
PNNL-MA-860 Chapter 6.0 Issued: January 31, 2003 Page 6.2

occurred involving significant metabolic uptake and internal deposition, within about 2 weeks of exposure equal quantities of both nuclides would be present in the body. Pure 90Y was produced and packaged in the 325 Building during the 1990s (through 1999).
6.2 Environmental Levels of 90Sr Daily dietary intake of 90Sr is estimated to range from 0.1 to 0.4 Bq/d (San Francisco to New York) according to the United Nations Scientific Committee on the Effects of Atomic Radiation (UNSCEAR 1982, p. 231). Higher intakes of about 8 to 11 pCi/d were reported by Stroube, Jeline, and Baratta (1985). The concentration in milk may run from 0.04 to 0.2 Bq/l. A brief note by Irlweck and Streit (1979) indicated that normal background 90Sr in urine levels for Austria ranged from 0.2 to 2 pCi/l, which would correspond to 0.6 to 6 dpm/day for an ICRP Reference Man excretion rate of 1.4 l/d. These levels were attributed to worldwide fallout and natural variability. They suggested a screening level of 5 pCi/l (15 dpm/d) as a basis for assuming intake from sources other than worldwide fallout. Correcting these levels for an additional 20 years of physical radiological decay suggests a current daily excretion range of 0.4 to 4 dpm/d with their proposed screening level for identifying an unusual intake of 10 dpm/d. A detailed study of background 90Sr in the urine of unexposed Hanford workers is in progress.
6.3 Biokinetic Behavior of Radiostrontium The biokinetic behavior of strontium is a composite of the intake mode, the chemical form, the inhalation class, the internal distribution and retention, the excretion, and the radiological half-life of the strontium isotope. The basic models used for Hanford internal dosimetry are those of ICRP 30, as implemented using CINDY.
6.3.1 Inhalation Class All intakes of strontium at Hanford are considered to be inhalation class D, in accordance with the recommendations of ICRP 30. It is noted that strontium titanate is the only compound identified by the ICRP as belonging to inhalation class Y (Anderson et al. 1999). However, that compound of strontium has not been used at Hanford. Waste management practices involving strontium fluoride (SrF2) are of particular interest from an internal dosimetry perspective, because SrF2 was not specifically included in the ICRP lung model descriptions of strontium compounds. The waste fractionation process separated and purified 90Sr at B-Plant, and then converted it into SrF2 powder, which was encapsulated into welded cylinders at
Issued: January 31, 2003 PNNL-MA-860 Chapter 6.0 Page 6.3

WESF. The cylinders remain stored in a water pool at WESF. The SrF2 powder was selected as the chemical form because of its chemical stability and only moderate solubility (i.e., its relative insolubility). This relative insolubility and lack of specific discussion in the ICRP lung model might be cause for considering SrF2 to be a class W or Y material. However, this is not thought to be the case. While solubility studies for SrF2 in simulated lung fluid have not been identified, SrF2 is only moderately soluble on a large scale, having a solubility product of 3.5 × 10⁻⁴ mg/l. A different picture emerges upon consideration of the microscopic scale, as might be encountered in human intakes. Because of the very high specific activity of 90Sr, dosimetrically significant quantities of SrF2 powder have extremely small masses that come no where near the solubility product and thus are very quickly dissolved in a small volume of fluid as might be found in the lung or GI tract. Hence, 90SrF2 would be expected to exhibit class D behavior upon intake.
6.3.2
6.3.3
Uptake to Blood
The absorption coefficient (f1) used for the GI tract absorption of readily transportable (inhalation class D) forms of strontium is 0.3, which is consistent with the recommendations of ICRP publications 30 (1979), 56 (1989), 67 (1993), and 78 (1997). Those publications note that the normal range of the absorption coefficient is 0.15 to 0.45, and fasting for 24 hours can elevate it to 0.25 to 0.55. Suggested values for infants and children (age 1 to 15) are 0.6 and 0.4, respectively. Where evaluation of poorly transportable (class Y) forms may be required, the ICRP 30 value of 0.01 will be used.
Internal Distribution and Retention The biokinetic model used for the distribution, retention, and excretion of stable strontium is the ICRP alkaline earth model (1973; 1979) as implemented by the CINDY computer code. It is assumed that stable strontium is uniformly distributed throughout the bone volume, where it is retained and internally recycled according to a series of exponential terms modeled by Johnson and Myers (1981), which show good agreement with the ICRP alkaline earth model. More recent models for strontium distribution have been developed by Leggett, Eckerman, and Williams (1982), Leggett et al. (1984), and Leggett (1992) and are featured in ICRP 56, 67, and 78. These models have different formulations that cannot be readily adapted to CINDY, and were developed to allow for age-dependent parameters
PNNL-MA-860 Chapter 6.0 Issued: January 31, 2003 Page 6.4

for assessment of doses for age groups ranging from infant to adult. The ICRP 30 approach used by CINDY is adequate at this time for assessment of occupational exposure to adult workers. For dosimetry purposes, it is assumed that the intake is the pure isotope of 90Sr. The dose contribution from any 90Y present at the time of intake due to equilibrium with the 90Sr parent makes no significant difference in the total dose.
6.3.4 Excretion of Strontium
The alkaline earth excretion model assumes that the fraction of excreted uptake occurring by the urinary pathway and by the fecal pathway is 0.8 and 0.2, respectively. This is consistent with past Hanford practices and the recommendations of ICRP 30, 56, 67, and 78. CINDY incorporates this pathway fractionation into its algorithms. Urine sample analysis is the easiest and most common bioassay method for both 89Sr and 90Sr, and therefore the urinary excretion function becomes the key for internal dosimetry evaluations of strontium. The CINDY 90Sr urinary excretion function is used in this technical basis for strontium evaluations. The CINDY urinary excretion function is identical to that of the GENMOD code formerly used by the Hanford Internal Dosimetry Program and similar to excretion derived from the Dolphin model, which was used prior to 1989 (Sula, Carbaugh, and Bihl 1989). Urine and feces excretion fractions, respectively, are shown in Tables 6.4 and 6.5 for class D and Y inhalations of 1-µm- and 5-µm-AMAD particles, soluble ingestion, and transportable injection (wound) intakes. For readily transportable injection intakes (i.e., wounds), the total uptake to blood occurs very quickly. In these cases, the calculated intake and uptake are essentially synonymous. For a class D inhalation, the only significant difference from a transportable injection excretion function is the ratio of total uptake to total intake (0.52 for 1-µm, class D particles), where total uptake includes the contributions from both the respiratory and GI tracts. For class Y material, the uptake to blood occurs over a long period, nominally characterized by the clearance rate from the lung. Figure 6.1 illustrates the urine excretion fractions for inhalation of 5-µm class D and class Y particles. As is apparent in Figure 6.1, urinary excretion following an acute class Y intake can be expected to be relatively constant from about 50 to 1000 days post intake.
Issued: January 31, 2003 PNNL-MA-860 Chapter 6.0 Page 6.5

Table 6.4. 90Sr Urine Excretion Fractions
Days Post Intake
1-µm-AMAD Class D
Inhalation (f1 = 0.3)
5-µm-AMAD Class D
Inhalation (f1 = 0.3)
Soluble Ingestion (f1 = 0.3)
Transportable Injection (f1 = 0.3)
1-µm-AMAD Class Y
Inhalation (f1 = 0.01)
5-µm-AMAD Class Y
Inhalation (f1 = 0.01)
1 4.8E-02 5.5E-02 2.6E-02 8.3E-02 8.4E-04 1.7E-03 2 3.8E-02 4.4E-02 2.0E-02 6.6E-02 6.4E-04 1.2E-03 7 1.5E-02 1.7E-02 7.9E-03 2.6E-02 2.5E-04 4.7E-04
14 4.8E-03 5.7E-03 2.6E-03 8.6E-03 9.1E-05 1.6E-04 30 5.5E-04 6.6E-04 3.0E-04 1.0E-03 2.1E-05 2.2E-05 60 1.6E-04 1.9E-04 8.9E-05 3.0E-04 1.5E-05 9.3E-06 90 1.2E-04 1.5E-04 7.1E-05 2.4E-04 1.5E-05 8.4E-06
180 7.6E-05 9.3E-05 4.3E-05 1.4E-04 1.4E-05 7.0E-06 365 3.8E-05 4.7E-05 2.2E-05 7.3E-05 1.4E-05 5.9E-06 730 1.6E-05 2.0E-05 9.4E-06 3.1E-05 1.3E-05 4.9E-06
1825 5.9E-06 7.3E-06 3.4E-06 1.1E-05 7.5E-06 2.8E-06 3650 3.1E-06 3.8E-06 1.8E-06 5.8E-06 2.4E-06 9.4E-07 7300 1.1E-06 1.3E-06 6.2E-07 2.1E-06 3.0E-07 1.3E-07
18250 1.4E-07 1.7E-07 8.1E-08 2.7E-07 1.8E-08 9.9E-09
Table 6.5. 90Sr Fecal Excretion Fractions
Days Post Intake
1-µm-AMAD Class D
Inhalation (f1 = 0.3)
5-µm-AMAD Class D
Inhalation (f1 = 0.3)
Soluble Ingestion (f1 = 0.3)
Transportable Injection (f1 = 0.3)
1-µm-AMAD Class Y
Inhalation (f1 = 0.01)
5-µm-AMAD Class Y
Inhalation (f1 = 0.01)
1 6.3E-02 1.4E-01 3.4E-01 2.1E-02 1.3E-01 2.5E-01 2 4.0E-02 8.4E-02 2.0E-01 1.7E-02 1.5E-01 2.9E-01 7 3.9E-03 4.9E-03 3.6E-03 6.5E-03 5.4E-03 5.7E-03
14 1.2E-03 1.4E-03 6.6E-04 2.1E-03 1.9E-04 1.0E-04 30 1.4E-04 1.6E-04 7.6E-05 2.5E-04 1.4E-04 5.2E-05 60 3.9E-05 4.8E-05 2.2E-05 7.4E-05 1.4E-04 4.7E-05 90 3.1E-05 3.8E-05 1.8E-05 5.9E-05 1.2E-04 4.5E-05
180 1.9E-05 2.3E-05 1.1E-05 3.6E-05 1.1E-04 3.9E-05 365 9.5E-06 1.2E-05 5.5E-06 1.8E-05 8.4E-05 3.0E-05 730 4.1E-06 5.1E-06 2.3E-06 7.8E-06 5.1E-05 1.8E-05
1825 1.5E-06 1.8E-06 8.4E-07 2.8E-06 1.2E-05 4.1E-06 3650 7.6E-07 9.5E-07 4.4E-07 1.5E-06 1.3E-06 4.8E-07 7300 2.7E-07 3.3E-07 1.6E-07 5.2E-07 7.8E-08 3.5E-08
18250 3.5E-08 4.4E-08 2.0E-08 6.7E-08 4.4E-09 2.5E-09
PNNL-MA-860 Chapter 6.0 Issued: January 31, 2003 Page 6.6

1.0E-08
1.0E-07
1.0E-06
1.0E-05
1.0E-04
1.0E-03
1.0E-02
1.0E-01
1.0E+00
1 10 100 1000 10000
Days Post Intake
Urin
e Ex
cret
ion
Frac
tion
1-um Class D
5-um Class D
1-um Class Y
5-um Class Y
Figure 6.1. 90Sr Urine Excretion Following an Acute Inhalation Intake
6.4 Internal Dosimetry Factors for Radiostrontium
The 90Sr committed effective dose equivalent coefficients of greatest interest to Hanford internal dosimetry are for intakes of 1-µm- and 5-µm-AMAD particles. Values for these coefficients, as calculated by CINDY, are as follows: • Class D inhalation 5-µm-AMAD particles: 0.27 mrem/nCi intake • Class D inhalation 1-µm-AMAD particles: 0.22 mrem/nCi intake.
Committed dose coefficients for organs and tissues of significance to several different intake conditions are tabulated in Table 6.6. Committed dose coefficients for 90Y are approximately 2 to 3 orders of magnitude lower than those for 90Sr, hence the existence of 90Y in secular equilibrium to 90Sr at the time of intake does not add any significant dose to the intake beyond that resulting from the 90Sr. Selected internal dosimetry factors for 90Sr cited by various scientific and regulatory bodies are shown in Table 6.7. The 1-µm values calculated by CINDY using the Hanford parameters are not significantly different from those tabulated by ICRP 54 (1988) and Federal Guidance Report No. 11 (EPA 1988). The difference
Issued: January 31, 2003 PNNL-MA-860 Chapter 6.0 Page 6.7

Table 6.6. Hanford 90Sr Dose Coefficients for Significant Organs (mrem/nCi Intakea, b)
Class D Inhalation Class Y Inhalation Organ 1-µm 5-µm 1-µm 5-µm
Soluble Ingestion
TransportableInjection
Effective 0.22 0.27 1.3 0.48 0.13 0.41 Bone Surfaces 2.4 3.0 [0.23] [0.15] 1.4 4.6 Red Bone Marrow 1.1 1.3 [0.10] [0.064] 0.61 2.0 Lung [<0.01] [<0.01] 11 3.8 [<0.01] [<0.01] (a) Bracketed values are considered insignificant contributors to effective dose equivalent
and are shown for information only. (b) The values for 90Sr and 90Sr+90Y are not significantly different at the precision shown.
between these values and those of ICRP 68 (1994) is related to changes in the ICRP lung model, the new metabolic model, and the new organ and tissue weighting factors. Derived reporting, investigation, and dose limit compliance levels (based on committed effective dose equivalents of 10-mrem, 100-mrem, and 5,000 mrem, respectively) have been calculated for 1-µm and 5-µm particle sizes. The derived levels for daily urine excretion are shown in Tables 6.8 and 6.9 for inhalation class D, and Tables 6.10 and 6.11 for inhalation class Y. Although there is no reason to suspect class Y 90Sr at Hanford, the dose coefficients and derived levels are provided for information purposes.
6.5 Bioassay for Radiostrontium The general techniques and applicability of bioassay for strontium, urine and fecal sample bioassay, in vivo measurement of 90Sr, bioassay monitoring program capability, a recommended program, and special monitoring needs are discussed in the following sections.
Excreta Bioassay Techniques for 90Sr The standard method of bioassay for strontium is by analysis of urine excreta samples. Because strontium at Hanford is a class D material, its rapid transport to the systemic compartment makes urine sampling an accurate, reliable, and convenient means for bioassay monitoring. In addition, the lack of any readily detectable gamma emissions makes in vivo detection somewhat ineffective, although if sufficient strontium is present, the bremsstrahlung can be detected by in vivo counting. Fecal samples can also be analyzed; however, their collection is more difficult, and analysis of fecal samples is more costly than analysis of urine samples. Hanford 90Sr urinalysis analytical sensitivities prior to 1991 were summarized by Sula,
6.5.1
PNNL-MA-860 Chapter 6.0 Issued: January 31, 2003 Page 6.8

Carbaugh, and Bihl (1991). Since 1988, analytical sensitivities have been included in the various annual reports on Hanford radiological protection site support services (e.g., MacLellan et al. 1999).
Table 6.7. Comparison of Dosimetric Factors for Soluble 90Sr (f1 = 0.3)
Reference Source Class D Inhalation
1-µm AMAD Class D Inhalation
5-µm AMAD Soluble Ingestion Dose Coefficients
CINDY [hE,50] 0.22 mrem/nCi 5.8E-08 Sv/Bq
0.27 mrem/nCi 7.3E-08 Sv/Bq
0.13 mrem/nCi 3.5E-08Sv/Bq
ICRP-54 [hE,50] 6.2E-08 Sv/Bq (0.23 mrem/nCi) NA NA
EPA Federal Guidance Report No.11 [hE,50]
6.47E-08 Sv/Bq and 0.0239 mrem/nCi NA
3.85E-08 Sv/Bq and 0.143 mrem/nCi
ICRP-68 [e(50)] 2.4E-08 Sv/Bq (0.089 mrem/nCi)
3.0E-08 Sv/Bq (0.11 mrem/nCi)
2.8E-08 Sv/Bq (0.10 mrem/nCi)
Bone Surface DAC
10 CFR 835, App. A 8E-09 µCi/ml and 3E+02 Bq/m3 NA NA
EPA Federal Guidance Report No. 11
8E-09 µCi/ml and 3E-04 MBq/m3 NA NA
ICRP-30, ICRP-54 3E+02 Bq/ m3 NA NA Annual Limit on Intake, ALI (Bone Surface) Calculated from 10 CFR 835 DAC
19 µCi and 7.2E+05 Bq NA NA
ICRP-30 7E+05 Bq NA 1E+06 Bq EPA Federal Guidance Report No. 11 0.7 MBq and 20 µCi NA 1 MBq and 30 µCi NA = not applicable
Issued: January 31, 2003 PNNL-MA-860 Chapter 6.0 Page 6.9

Table 6.8. 90Sr Urine Excretion Reference Levels for Class D Inhalation of 1-µm-AMAD Particles
10-mrem HE,50 Reporting Level
100-mrem HE,50
Investigation Level
5-rem HE,50 Compliance Level
Inhalation Intake (nCi) 45.5 455 22,700
Days Post Intake
Urine Excretion Fraction (f1 = 0.3)
Derived Reporting Level
(dpm)
Derived Investigation Level (dpm)
Derived Compliance Level
(dpm) 1 4.8E-02 4.8E+03 4.8E+04 2.4E+06 2 3.8E-02 3.8E+03 3.8E+04 1.9E+06 7 1.5E-02 1.5E+03 1.5E+04 7.6E+05
14 4.8E-03 4.8E+02 4.8E+03 2.4E+05 30 5.5E-04 5.6E+01 5.6E+02 2.8E+04 60 1.6E-04 1.6E+01 1.6E+02 8.1E+03 90 1.2E-04 1.2E+01 1.2E+02 6.0E+03
180 7.6E-05 7.7E+00 7.7E+01 3.8E+03 365 3.8E-05 3.8E+00 3.8E+01 1.9E+03 730 1.6E-05 1.6E+00 1.6E+01 8.1E+02
1825 5.9E-06 6.0E-01 6.0E+00 3.0E+02 3650 3.1E-06 3.1E-01 3.1E+00 1.6E+02 7300 1.1E-06 1.1E-01 1.1E+00 5.5E+01
18250 1.4E-07 1.4E-02 1.4E-01 7.1E+00
Table 6.9. 90Sr Urine Excretion Reference Levels for Class D Inhalation of 5-µm-AMAD Particles
10-mrem HE,50
Reporting Level
100-mrem HE,50
Investigation Level
5-rem HE,50
Compliance LevelInhalation Intake (nCi) 37 370 18,500
Days Post Intake
Urine Excretion Fraction (f1 = 0.3)
Derived Reporting Level
(dpm)
Derived Investigation Level (dpm)
Derived Compliance Level
(dpm) 1 5.5E-02 4.5E+03 4.5E+04 2.3E+06 2 4.4E-02 3.6E+03 3.6E+04 1.8E+06 7 1.7E-02 1.4E+03 1.4E+04 7.0E+05
14 5.7E-03 4.7E+02 4.7E+03 2.3E+05 30 6.6E-04 5.4E+01 5.4E+02 2.7E+04 60 1.9E-04 1.6E+01 1.6E+02 7.8E+03 90 1.5E-04 1.2E+01 1.2E+02 6.2E+03
180 9.3E-05 7.6E+00 7.6E+01 3.8E+03 365 4.7E-05 3.9E+00 3.9E+01 1.9E+03 730 2.0E-05 1.6E+00 1.6E+01 8.2E+02
1825 7.3E-06 6.0E-01 6.0E+00 3.0E+02 3650 3.8E-06 3.1E-01 3.1E+00 1.6E+02 7300 1.3E-06 1.1E-01 1.1E+00 5.3E+01
18250 1.7E-07 1.4E-02 1.4E-01 7.0E+00
PNNL-MA-860 Chapter 6.0 Issued: January 31, 2003 Page 6.10

Table 6.10. 90Sr Urine Excretion Reference Levels for Class Y Inhalation of 1-µm-AMAD Particles
10-mrem Reporting Level
100-mrem Investigation
Level 5-rem
Compliance LevelInhalation Intake (nCi) 7.69 76.9 3,850
Days Post Intake
Urine Excretion Fraction (f1 = 0.01)
Derived Reporting Level
(dpm)
Derived Investigation Level (dpm)
Derived Compliance Level
(dpm) 1 8.4E-04 1.4E+01 1.4E+02 7.2E+03 2 6.4E-04 1.1E+01 1.1E+02 5.5E+03 7 2.5E-04 4.3E+00 4.3E+01 2.1E+03
14 9.1E-05 1.6E+00 1.6E+01 7.8E+02 30 2.1E-05 3.6E-01 3.6E+00 1.8E+02 60 1.5E-05 2.6E-01 2.6E+00 1.3E+02 90 1.5E-05 2.6E-01 2.6E+00 1.3E+02
180 1.4E-05 2.4E-01 2.4E+00 1.2E+02 365 1.4E-05 2.4E-01 2.4E+00 1.2E+02 730 1.3E-05 2.2E-01 2.2E+00 1.1E+02
1825 7.5E-06 1.3E-01 1.3E+00 6.4E+01 3650 2.4E-06 4.1E-02 4.1E-01 2.1E+01 7300 3.0E-07 5.1E-03 5.1E-02 2.6E+00
18250 1.8E-08 3.1E-04 3.1E-03 1.5E-01
Table 6.11. 90Sr Urine Excretion Reference Levels for Class Y Inhalation of 5-µm-AMAD Particles
10-mrem Reporting Level
100-mrem Investigation
Level 5-rem
Compliance LevelInhalation Intake (nCi) 20.8 208 10,400
Days Post Intake
Urine Excretion Fraction (f1 = 0.01)
Derived Reporting Level
(dpm)
Derived Investigation Level (dpm)
Derived Compliance Level
(dpm) 1 1.7E-03 7.8E+01 7.8E+02 3.9E+04 2 1.2E-03 5.5E+01 5.5E+02 2.8E+04 7 4.7E-04 2.2E+01 2.2E+02 1.1E+04
14 1.6E-04 7.4E+00 7.4E+01 3.7E+03 30 2.2E-05 1.0E+00 1.0E+01 5.1E+02 60 9.3E-06 4.3E-01 4.3E+00 2.1E+02 90 8.4E-06 3.9E-01 3.9E+00 1.9E+02
180 7.0E-06 3.2E-01 3.2E+00 1.6E+02 365 5.9E-06 2.7E-01 2.7E+00 1.4E+02 730 4.9E-06 2.3E-01 2.3E+00 1.1E+02
1825 2.8E-06 1.3E-01 1.3E+00 6.5E+01 3650 9.4E-07 4.3E-02 4.3E-01 2.2E+01 7300 1.3E-07 6.0E-03 6.0E-02 3.0E+00
18250 9.9E-09 4.6E-04 4.6E-03 2.3E-01
Issued: January 31, 2003 PNNL-MA-860 Chapter 6.0 Page 6.11

The minimum detectable intakes and committed effective dose equivalents associated with various urinalysis sampling times post intake, based on a 10-dpm/d minimum detectable activity for 90Sr in urine for 1-µm- and 5-µm AMAD particle sizes are shown for inhalation intakes of class D and class Y material in Tables 6.12 and 6.13, respectively. Corresponding values for transportable injection intakes of soluble material are shown in Table 6.14.
In Vivo Measurement of 90Sr Direct in vivo measurement of 90Sr in the skeleton is possible by counting the bremsstrahlung from its decay. This procedure is subject to substantial interference by any other gamma- and beta-emitting nuclides that might be present. Indications are that a retained quantity in the skeleton of about 100 nCi might be detectable by head counting, however, there is no calibration for this measurement. If isotope activity relationships are known, in vivo whole body counting can be an effective indicator for the potential presence of strontium. Cesium-137 is frequently used as the indicator, because its fission product yield is comparable to that of 90Sr. However, this method is not conclusive and caution must be exercised because there are processes at Hanford where strontium and cesium have undergone chemical separation from each other. Use of 137Cs as an indicator of 90Sr is more fully described in Chapter 5.0. Radiochemistry analyses for 137Cs and 90Sr in media representative of an intake may be used in lieu of supplemental bioassay measurements. This method is most appropriate when dealing with intakes of small dosimetric consequence. It is generally recommended that in vivo measurements be used only as indicators of the potential for strontium being present, and that evaluations of any strontium intake be based on urine samples.
6.5.2
6.5.3 Recommended Periodic Bioassay Monitoring Protocol Workers potentially exposed to 90Sr should be on an annual or biennial urinalysis bioassay program. Such programs should be easily capable of detecting class D intakes resulting in committed effective dose equivalents less than 100 mrem. Similar monitoring programs applied to inhalation class Y are capable of detecting committed effective dose equivalents below 200 mrem. For most Hanford applications, a whole body exam for high-energy gamma-emitting nuclides can also be used as a screening measurement for
PNNL-MA-860 Chapter 6.0 Issued: January 31, 2003 Page 6.12

Table 6.12. Hanford Bioassay Program Capability for 90Sr in Urine for Class D Inhalation (MDA = 10 dpm/d)
Days Post Intake
1-µm-AMAD Urine
Excretion Fraction (f1 = 0.3)
1-µm-AMAD Minimum Detectable
Intake (nCi)
1-µm-AMAD Minimum Detectable
Dose (HE,50, mrem)
5-µm-AMAD Urine
Excretion Fraction (f1 = 0.3)
5-µm-AMAD Minimum Detectable
Intake (nCi)
5-µm-AMAD Minimum Detectable
Dose (HE,50, mrem)
1 4.8E-02 9.4E-02 2.1E-02 5.5E-02 8.2E-02 2.1E-02 2 3.8E-02 1.2E-01 2.6E-02 4.4E-02 1.0E-01 2.8E-02 7 1.5E-02 3.0E-01 6.6E-02 1.7E-02 2.6E-01 7.2E-02
14 4.8E-03 9.4E-01 2.1E-01 5.7E-03 7.9E-01 2.1E-01 30 5.5E-04 8.2E+00 1.8E+00 6.6E-04 6.8E+00 1.8E+00 60 1.6E-04 2.8E+01 6.2E+00 1.9E-04 2.4E+01 6.4E+00 90 1.2E-04 3.8E+01 8.3E+00 1.5E-04 3.0E+01 8.1E+00
180 7.6E-05 5.9E+01 1.3E+01 9.3E-05 4.8E+01 1.3E+01 365 3.8E-05 1.2E+02 2.6E+01 4.7E-05 9.6E+01 2.6E+01 730 1.6E-05 2.8E+02 6.2E+01 2.0E-05 2.3E+02 6.1E+01
1825 5.9E-06 7.6E+02 1.7E+02 7.3E-06 6.2E+02 1.7E+02 3650 3.1E-06 1.5E+03 3.2E+02 3.8E-06 1.2E+03 3.2E+02 7300 1.1E-06 4.1E+03 9.0E+02 1.3E-06 3.5E+03 9.4E+02
18250 1.4E-07 3.2E+04 7.1E+03 1.7E-07 2.6E+04 7.2E+03 Table 6.13. Hanford Bioassay Program Capability for 90Sr in Urine for Class Y Inhalation
(MDA = 10 dpm/d)
Days Post Intake
1-µm-AMAD Urine
Excretion Fraction (f1 = 0.01)
1-µm-AMAD Minimum Detectable
Intake (nCi)
1-µm-AMAD Minimum Detectable
Dose (HE,50, mrem)
5-µm-AMAD Urine
Excretion Fraction (f1 = 0.01)
5-µm-AMAD Minimum Detectable
Intake (nCi)
5-µm-AMAD Minimum Detectable
Dose (HE,50, mrem)
1 8.4E-04 5.4E+00 7.0E+00 1.7E-03 2.6E+00 1.3E+00 2 6.4E-04 7.0E+00 9.1E+00 1.2E-03 3.8E+00 1.8E+00 7 2.5E-04 1.8E+01 2.3E+01 4.7E-04 9.6E+00 4.6E+00
14 9.1E-05 5.0E+01 6.4E+01 1.6E-04 2.8E+01 1.4E+01 30 2.1E-05 2.1E+02 2.8E+02 2.2E-05 2.0E+02 9.8E+01 60 1.5E-05 3.0E+02 3.9E+02 9.3E-06 4.8E+02 2.3E+02 90 1.5E-05 3.0E+02 3.9E+02 8.4E-06 5.4E+02 2.6E+02
180 1.4E-05 3.2E+02 4.2E+02 7.0E-06 6.4E+02 3.1E+02 365 1.4E-05 3.2E+02 4.2E+02 5.9E-06 7.6E+02 3.7E+02 730 1.3E-05 3.5E+02 4.5E+02 4.9E-06 9.2E+02 4.4E+02
1825 7.5E-06 6.0E+02 7.8E+02 2.8E-06 1.6E+03 7.7E+02 3650 2.4E-06 1.9E+03 2.4E+03 9.4E-07 4.8E+03 2.3E+03 7300 3.0E-07 1.5E+04 2.0E+04 1.3E-07 3.5E+04 1.7E+04
18250 1.8E-08 2.5E+05 3.3E+05 9.9E-09 4.6E+05 2.2E+05
Issued: January 31, 2003 PNNL-MA-860 Chapter 6.0 Page 6.13

Table 6.14. Hanford Bioassay Program Capability for 90Sr in Urine for Transportable Injection and Soluble Ingestion Intakes (MDA = 10 dpm/d; f1 = 0.3)
Transportable Injection Intake Soluble Ingestion Intake
Days Post Intake
Urine Excretion Fraction (f1 = 0.3)
Minimum Detectable
Intake (nCi)
Minimum Detectable
Dose (HE,50, mrem)
Urine Excretion Fraction (f1 = 0.3)
Minimum Detectable
Intake (nCi)
Minimum Detectable
Dose (HE,50, mrem)
1 8.3E-02 5.4E-02 2.2E-02 2.6E-02 1.7E-01 2.3E-02 2 6.6E-02 6.8E-02 2.8E-02 2.0E-02 2.3E-01 2.9E-02 7 2.6E-02 1.7E-01 7.1E-02 7.9E-03 5.7E-01 7.4E-02
14 8.6E-03 5.2E-01 2.1E-01 2.6E-03 1.7E+00 2.3E-01 30 1.0E-03 4.5E+00 1.8E+00 3.0E-04 1.5E+01 2.0E+00 60 3.0E-04 1.5E+01 6.2E+00 8.9E-05 5.1E+01 6.6E+00 90 2.4E-04 1.9E+01 7.7E+00 7.1E-05 6.3E+01 8.2E+00
180 1.4E-04 3.2E+01 1.3E+01 4.3E-05 1.0E+02 1.4E+01 365 7.3E-05 6.2E+01 2.5E+01 2.2E-05 2.0E+02 2.7E+01 730 3.1E-05 1.5E+02 6.0E+01 9.4E-06 4.8E+02 6.2E+01
1825 1.1E-05 4.1E+02 1.7E+01 3.4E-06 1.3E+03 1.7E+02 3650 5.8E-06 7.8E+02 3.2E+02 1.8E-06 2.5E+03 3.3E+02 7300 2.1E-06 2.1E+03 8.8E+02 6.2E-07 7.3E+03 9.4E+02
18250 2.7E-07 1.7E+04 6.8E+03 8.1E-08 5.6E+04 7.2E+03
potential intake of mixed fission products. A worker scheduled only for a whole body exam may not be recognized as having potential exposure to radiostrontium. If gamma-emitting nuclides such as 137Cs are also of potential concern, the impact of mixtures on potentially undetected effective dose equivalent must also be addressed. If other means (e.g., in vivo measurements) are used to monitor for other nuclides, then annual or biennial urine samples should be sufficient to monitor the 90Sr contribution to dose.
6.5.4 Special Monitoring for Suspected Exposures If exposure to 90Sr has occurred or is suspected to have occurred, one or more urine samples should be scheduled for investigation purposes. Because of the high sensitivity of the urine sample analysis, even slight intakes of 90Sr resulting in small fractions of a millirem committed effective dose equivalent can be detected if prompt sampling is performed. This also permits the use of less sensitive analytical procedures (i.e., expedite or emergency processing analyses) for reasonably accurate dose estimates. As is apparent from Table 6.8 and 6.9, for class D inhalation of either 1-µm or 5-µm particles, a urine sample result of 5 dpm/d obtained within 30 days following the intake would imply a committed
PNNL-MA-860 Chapter 6.0 Issued: January 31, 2003 Page 6.14

effective dose equivalent of less than 1 mrem, which could be rounded to zero. Thus, although some indications exist to suggest that 5 dpm/d may be above the normal background levels for urinary excretion, the dosimetric consequence for incident evaluation is insignificant and no confirmation of intake is made based on results of 5 dpm/d or less. Isotopic strontium analyses should be considered for any potential exposures to 89Sr. However, if more than 1 year has elapsed since the production of 89Sr, that isotope is unlikely to be a dosimetric concern due to its short radiological half-life. In vivo measurements should also be considered following potential 90Sr exposures, because generally 90Sr is likely to be mixed with other nuclides. For relatively small intakes, fecal samples for strontium are not likely to be warranted because of the high degree of systemic uptake and the ease of detection by urine sampling. If major intakes are suspected, fecal samples combined with urine samples may provide more accurate estimates of intake, particularly if the intake is thought to contain some nontransportable strontium.
6.6 Assessment of Internal Dose Equivalent Internal dosimetry for radiostrontium is usually performed at Hanford using an intake assessment methodology and urine bioassay data. The method may use either tabulated values for the excretion fractions or the CINDY computer code for curve fitting or determining excretion fractions at specific times post intake. Doses may be calculated using either an intake value and tabulated dose coefficients or by using CINDY. For Hanford sources, 90Sr and its 90Y decay product have generally been the isotopes of greatest concern for strontium dosimetry. As noted in the previous sections, 89Sr may also be a concern under some conditions. The general protocol for strontium dosimetry is as follows: • Estimate the intake based on urine excreta analyses and the
appropriate intake excretion function using CINDY or the appropriate equation and technique described in Chapter 2.0.
Issued: January 31, 2003 PNNL-MA-860 Chapter 6.0 Page 6.15

• Estimate doses using CINDY or tabulated dose coefficients. This includes committed effective dose equivalents, as well as dose equivalents to specific organs of concern based on criteria presented in the Hanford Internal Dosimetry Program Manual.(a)
When estimated intakes and associated doses are a relatively small fraction of the applicable radiation protection limit, direct application of the biokinetic models and dosimetry factors without modification for individual-specific considerations is appropriate. As intakes and doses become more significant, it is appropriate to give correspondingly greater attention to those individual-specific details. Urine data normalization is the factor most likely to be adjusted for an individual-specific modification. Dose assessments use the techniques and biokinetic models described previously and assume ICRP 23 (1974) Reference Man parameters, usually without correction for individual-specific characteristics. These assessments provide a basis for prospective bioassay program design and retrospective evaluation of doses that are small relative to the occupational exposure limits.
6.7 Management of Internal Contamination Cases The diagnostic procedures, therapeutic actions, and long-term monitoring following an intake of 90Sr are discussed in the following sections on the management of potential internal contamination cases.
6.7.1
Diagnostic Procedures A worker who may have received an intake of strontium should be scheduled for a whole body count and a urine sample. These initial measurements can be used to confirm an intake and provide preliminary estimates of the magnitude of potential doses. Suitable urine samples can include a single voiding, overnight, or simulated 24-hour sample, depending on the potential severity of intake (the higher the severity, the more important prompt information becomes). However, as noted in previous sections, the in vivo measurements are for the detection of gamma-emitting nuclides, which may or may not be indicative of 90Sr.
(a) Pacific Northwest Laboratory. 1997. Hanford Internal Dosimetry Program Manual. PNL-MA-552,
Richland, Washington. (Internal manual.) Available URL: http://www.pnl.gov/eshs/pub/pnnl552.html
PNNL-MA-860 Chapter 6.0 Issued: January 31, 2003 Page 6.16

A potential intake of 90Sr is best indicated by the results of the urine sample. Where the indicated dose is small (e.g., less than tens of millirem), a single urine sample is adequate for dosimetry. For more significant intakes, getting two or more urine samples (representing actual or simulated 24-hour periods) collected over several days or weeks following the intake is preferred. In general, less credence for dosimetry is placed on a sample taken within the first couple of days after an intake compared with one taken several days or more after the intake.
6.7.2
6.7.3
Therapeutic Actions Therapeutic actions to prevent the uptake of strontium are based primarily on reducing GI tract absorption and accelerating the passage of material through the GI tract. These measures require administration under medical supervision and are addressed in NCRP 65 (1980) and the “Guidebook for Treatment of Accidental Internal Radionuclide Contamination of Workers” (Bhattacharyya et al. 1992). Aluminum phosphate gel and sodium alginate are the drugs identified as being potentially effective in reducing the GI tract uptake of strontium. Accelerating the passage of material through the GI tract can be accomplished by use of laxatives and enemas. These measures can only be taken under the supervision of Hanford Environmental Health Foundation (HEHF) Occupational Medicine. Frequent sampling should be used during treatment to provide information on treatment efficiencies. However, standard models should not be used on these samples for dosimetry.
Long-Term Bioassay Follow-Up Monitoring After an Intake Long-term monitoring of urinary excretion following a 90Sr intake may be required to validate the excretion model or to ensure that potential additional intakes do not go undetected. The establishment of a sampling frequency for such monitoring is dependent upon the nature of the exposure, magnitude of deposition, and likelihood for additional exposure. Appropriate long-term follow-up monitoring should be determined as part of the exposure evaluation.
6.8 Historical 90Sr Internal Dosimetry Practices at Hanford Historically, Hanford internal dosimetry for strontium was based on estimating the long-term systemic deposition, using urine data and Dolphin’s excretion model (Dolphin and Eve 1963a; 1963b), and comparing it with the 2-µCi ICRP 2 MPBB (ICRP 1959). The long-term (formerly referred to as “permanent”) deposition was defined as the amount remaining in the body at 1 year post intake, which was calculated to be 15% of the initial systemic uptake. This evaluation
Issued: January 31, 2003 PNNL-MA-860 Chapter 6.0 Page 6.17

technique was described in several short explanations, the most recent being Appendix G of the Hanford Dosimetry Evaluation Manual (PNL-MA-575).(a) Earlier versions are listed by Sula et al. (1991). In April 1985, the practice of investigating all positive 90Sr results regardless of their dose implication was discontinued, and only results potentially indicating long-term systemic depositions in excess of 1% of the above-described level were investigated. This change in practice was made due to increased sensitivity of the analytical procedure and the indication of potential background levels in the range of the minimum detection level for the analytical procedure. Using the above method, derived investigation levels were calculated for various times post intake, and these were documented by letter to the Hanford Radiation Protection Historical Files as cited by Sula et al. (1991). With the issuance of Technical Basis for Internal Dosimetry at Hanford (Sula et al. 1989), the ICRP 30 (1979) dosimetry concepts of committed organ and tissue dose equivalents, and committed effective dose equivalent were adopted, along with the ICRP alkaline earth model (1973) as implemented using the GENMOD computer code (Johnson and Carver 1981). The CINDY computer code effectively replaced GENMOD at Hanford in 1992.
6.9 References Anderson, J., B. Kahn, T. R. La Bone, L. Brown, and F. Harris. 1999. “Solubility of various forms of strontium titanate in lungs: in vitro and in vivo studies.” Health Phys. 76(6):628-634. Bhattacharyya, M. H., B. D. Breitenstein, H. Metivier, B. A. Muggenburg, G. N. Stradling, and V. Volf. 1992. “Guidebook for the treatment of accidental internal radionuclide contamination of workers,” eds. G. B. Gerber and R. G. Thomas. Rad. Prot. Dosim. 41:1. Dolphin, G. W., and I. S. Eve. 1963a. “The metabolism of strontium in humans.” Phys. in Med. and Biol. 8(2):193-203. Dolphin, G. W., and I. S. Eve. 1963b. “Some aspects of radiostrontium dosimetry.” Phys. in Med. and Biol. 8(2):205-214.
(a) Pacific Northwest Laboratory. 1982. Hanford Dosimetry Evaluation Manual. PNL-MA-575,
Richland, Washington. (Internal manual.) PNNL-MA-860 Chapter 6.0 Issued: January 31, 2003 Page 6.18

General Electric Company. 1983. Chart of the Nuclides. 13th Edition, San Jose, California. Hedengren, D. C. 1985. ORIGEN2 Predictions of N-Reactor Fuel Fission Product Composition. SD-CP-I-077, Rockwell Hanford Operations, Richland, Washington. International Commission on Radiological Protection (ICRP). 1959. Report of Committee II on permissible dose for internal radiation. ICRP publication 2, Pergamon Press, New York. International Commission on Radiological Protection (ICRP). 1973. Alkaline earth metabolism in adult man. ICRP publication 20, Pergamon Press, New York. International Commission on Radiological Protection (ICRP). 1974. Report of task group on reference man. ICRP publication 23, Pergamon Press, New York. International Commission on Radiological Protection (ICRP). 1979. “Limits for intakes of radionuclides by workers.” (ICRP publication 30, part 1). Annals of the ICRP, 2:3-4, Pergamon Press, New York. International Commission on Radiological Protection and Measurements (ICRP). 1988. “Individual monitoring for intakes of radionuclides by workers: design and interpretation.” (ICRP publication 54.) Annals of the ICRP, 19:1-3, Pergamon Press, New York. International Commission on Radiological Protection (ICRP). 1989. “Age-dependent doses to members of the public from intake of radionuclides.” (ICRP publication 56, part 1). Annals of the ICRP, 20:2, Pergamon Press, New York. International Commission on Radiological Protection (ICRP). 1993. “Age-dependent doses to members of the public from intake of radionuclides: Part 2 ingestion dose coefficients.” (ICRP publication 67). Annals of the ICRP, 23:3-4, Pergamon Press, New York. International Commission on Radiological Protection (ICRP). 1994. “Dose coefficients for intakes of radionuclides by workers.” (ICRP publication 68). Annals of the ICRP, 24:4, Pergamon Press, New York.
Issued: January 31, 2003 PNNL-MA-860 Chapter 6.0 Page 6.19

International Commission on Radiological Protection (ICRP). 1997. “Individual monitoring for internal exposure of workers.” (ICRP publication 78). Annals of the ICRP, 27:3-4, Pergamon Press, New York. Irlweck, K., and S. Streit. 1979. “Urinary 90Sr concentration in occupationally exposed and nonexposed persons in Austria.” Health Phys. 37(1):163-165. Johnson, J. R., and M. B. Carver. 1981. “A general model for use in internal dosimetry.” Health Phys. 41:341-348. Johnson, J. R., and R. C. Myers. 1981. “Alkaline earth metabolism: a model useful in calculating organ burdens, excretion rates, and committed effective dose equivalent conversion factors.” Rad. Prot. Dosim. 1(2):87-95. Leggett, R. W. 1992. “A generic age-specific biokinetic for calcium-like elements.” Rad. Prot. Dosim. 41(2-4):183-198. Leggett, R. W., K. F. Eckerman, and L. R. Williams. 1982 “Strontium-90 in bone: A case study in age-dependent dosimetric modeling.” Health Phys. 43(3):307-322. Leggett, R. W., K. F. Eckerman, D. E. Dunning, M. Christy, D. J. Crawford-Brown, and L.R. Williams. 1984. On Estimating Dose Rates to Organs as a Function of Age Following Internal Exposure to Radionuclides. ORNL/TM-8265, Oak Ridge National Laboratory, Oak Ridge, Tennessee. MacLellan, J. A., D. E. Bihl, M. L. Johnson, T. P. Lynch, and R. K. Piper. 1999. Hanford Radiological Protection Support Services Annual Report for 1998. PNNL-12191, Pacific Northwest National Laboratory, Richland, Washington. National Council on Radiation Protection and Measurements (NCRP). 1980. Management of Persons Accidentally Contaminated with Radionuclides. NCRP Report No. 65, Bethesda, Maryland. Strenge, D. L., R. A. Kennedy, M. J. Sula, and J. R. Johnson. 1992. Code for Internal Dosimetry (CINDY Version 1.2), Part 1: Conceptual Representation. PNL-7493 Pt. 1, Rev. 1, Pacific Northwest National Laboratory, Richland, Washington. Stroube, Jr., W. B., C. F. Jeline, and E. J. Baratta. 1985. “Survey of radionuclides in foods, 1978-1982.” Health Phys. 49(5):731-735.
PNNL-MA-860 Chapter 6.0 Issued: January 31, 2003 Page 6.20

Sula, M. J., E. H. Carbaugh, and D. E. Bihl. 1989. Technical Basis for Internal Dosimetry at Hanford. PNL-6866, Pacific Northwest Laboratory, Richland, Washington. Sula, M. J., E. H. Carbaugh, and D. E. Bihl. 1991. Technical Basis for Internal Dosimetry at Hanford. PNL-6866 Rev. 1, Pacific Northwest Laboratory, Richland, Washington. United Nations Scientific Committee on the Effects of Atomic Radiation (UNSCEAR). 1982. Ionizing Radiation: Sources and Biological Effects. Report 82.IX.8, United Nations, New York. U.S. Environmental Protection Agency (EPA). 1988. Limiting Values of Radionuclide Intake and Air Concentration and Dose Conversion Factors for Inhalation, Submersion, and Ingestion. Federal Guidance Report No. 11, EPA-520/1-88-020, Washington, D.C.
Issued: January 31, 2003 PNNL-MA-860 Chapter 6.0 Page 6.21

Issued: September 30, 2000 PNNL-MA-860 Chapter 7.0 Page 7.1
7.0 Uranium
This chapter provides technical information on uranium sources, characteristics, biokinetics, and internal dosimetry for general application at Hanford. Also included are some discussions of historical assessment practices for exposures in specific facilities where uncontained uranium was routinely handled. Bioassay monitoring and internal dosimetry for uranium at Hanford posed relatively unique problems, primarily because, except for highly enriched uranium, total containment was not provided. Thus, low-level chronic airborne contamination levels were assumed to exist in facilities in which uncontained uranium was routinely handled. Such facilities associated with Hanford’s former plutonium production mission are no longer in operation, and have either been stabilized or undergone decontamination/decommissioning. Poten-tial exposures in these facilities are now very rare, due to infrequent entry. Thus, the chronic exposure scenario is no longer considered routine and single acute exposures are considered the most likely. Additional difficulties with uranium dosimetry are caused by the relatively low sensitivity of direct (in vivo) measurement capabilities for depleted and low-enrichment uranium, and the presence of environmental uranium in urine as background interference.
7.1 Sources and Characteristics
The sources, isotopic composition, transportability, particle size, environmental background, chemical toxicity, and biokinetic characteristics of uranium at Hanford are discussed in the following sections.
7.1.1 Sources
Uranium at Hanford may be present from a number of possible sources, including residual recycled uranium (RU) from the fuel cycle of the production reactors, depleted uranium (DU) from an ongoing research and development project, and various individual isotopes or mixtures associated with laboratory standards. In addi-tion, natural uranium (NU) is ubiquitous in the environment and can interfere with bioassay measurements. Uranium compounds encountered during historical production operations at Hanford ranged from the highly soluble uranyl nitrate, UO2(NO3)2, to somewhat less soluble uranium trioxide, UO3, to

PNNL-MA-860 Chapter 7.0 Issued: September 30, 2000 Page 7.2
relatively insoluble uranium oxides, UO2 and U3O8. The highly reactive uranium hexafluoride, UF6, and uranyl fluoride, UO2F2, were not handled at Hanford. Historically at Hanford, uranium was used primarily as feed material in the plutonium production process. The uranium was received as slightly enriched metallic uranium in the form of large billets and extruded into fuel elements at the 300 Area Fuel Production Facilities, primarily Building 333 but also 303-M and some ancillary buildings). After irradiation in production reactors, the elements were shipped to the PUREX facility for processing. The recovered uranium, as uranyl nitrate-hexahydrate, was shipped to the Uranium Oxide (UO3) Plant in 200 West Area for conversion to uranium trioxide. The final operating plutonium production reactor (N Reactor) and its associated fuels production facility were shut down in 1987, and the extraction of plutonium and uranium from the irradiated fuels ended at PUREX in 1990. The UO3 Plant operated intermittently from 1952 to 1994. In the early years of Hanford operations, when the chemical separations processes of the produc-tion cycle were performed in the first-generation facilities (T-Plant [221-T] and B-Plant [221-B]) and the second-generation process (REDOX Plant [202-S]), the uranium was not separated from the waste stream but sent to the underground high-level waste storage tanks. In 1952, the U-Plant (221-U) began operations that recovered uranium from the high-level waste tanks. These operations continu-ed through 1957. A more detailed explanation and history of uranium processing at Hanford is contained in Volume II Part 1 of Recycled Uranium (DOE-RL 2000). Uranium is also used in fuel elements for the FFTF reactor. The FFTF fuel consists of a mixture of plutonium and uranium oxide, with plutonium being the primary concern. The fuel elements were not fabricated at Hanford, but received as sealed units. Depleted uranium metal is machined in shops in the 306-W Building in support of a long-term research and development program. Uranium isotopes (both as separated isotopes and mixtures of isotopes) are stored and handled in several laboratories in the 200 and 300 Areas.
7.1.2 Isotopic Composition Uranium handled at Hanford generally ranges from depleted to slightly enriched, based on the weight percent of 235U. Table 7.1 summarizes 235U enrichment levels anticipated in several Hanford source terms and facilities. Table 7.2 gives radiological data for

Issued: September 30, 2000 PNNL-MA-860 Chapter 7.0 Page 7.3
uranium isotopes. Table 7.3 gives the principal isotopic composition of the various types of uranium at Hanford. Recycled uranium is present in the Fuel Production Facilities and in the UO3 Plant. Table 7.3 shows that the specific alpha activity of the recycled uranium exceeds that of virgin uranium for corresponding 235U weight percentages. This increase is due primarily to higher levels of 234U and 236U in the recycled uranium. The atom ratios used to calculate specific activity in Table 7.3 are based on operational data obtained from facility operating records and represent a reference recycled uranium mixture rather than any specific batch. Knowledge of the isotopic composition of natural uranium is important to help discriminate potential occupational exposure from normal environmental exposure. Uranium used in the plutonium production process was recycled uranium and incurred ingrowth of impurities during the irradiation phase of the fuel cycle (Rich et al. 1988 and DOE 2000). These impurities were not completely removed during the reprocessing and plutonium extraction phases of the production cycle and thus their presence in residual uranium contributes to internal dose along with uranium. The impurities include 236U, 239Pu, 99Tc, 237Np, and other,
Table 7.1. Types and Enrichment of Uranium Expected in Hanford Facilities
Area Facility Material Form Type 235U Enrichment 100 Reactors Fuel elements Recycled U 0.8 to 1.25% 200 Chemical Processing
(PUREX, UO3) Exposed fuel elements, UNH, UO3
Recycled U 0.8 to 1.25%
300 Fuel Production Facilities
U metal ingots New fuel elements
Recycled U 0.8 to 1.25%
306-W U metal Depleted U 0.25% 200 or 300 Analytical Labs U standards solutions Any Not Applicable
Table 7.2. Uranium Decay Data
Half-Life Isotope (Years)(a) (Days)
Specific Activity (CI/G)
232U 72 2.63E+04 2.14E+01 233U 1.585 E+05 5.79E+07 9.68E-03 234U 2.445 E+05 8.92E+07 6.25E-03 235U 7.038 E+08 2.57E+11 2.16E-06 236U 2.3415 E+07 8.55E+09 6.47E-05 238U 4.468 E+09 1.63E+12 3.36E-07
(a) From ICRP 38 (1983).

PNNL-MA-860 Chapter 7.0 Issued: September 30, 2000 Page 7.4
Table 7.3. Radiological Characteristics of Uranium Mixtures
Uranium Mixture Weight
Percentage (a, b) Natural
(NU) Depleted
(DU) Recycled
(RU) Commercial
Fuel (CF) 234U 0.0057 0.0005 0.0082 0.0300 235U 0.7204 0.2500 0.9700 2.9600 236U negligible negligible 0.0680 negligible 238U 99.2739 99.7500 98.9500 97.0100 Total 100.0000 100.0005 99.9962 100.0000
Specific Constituent Activity in Mixture (uCi/g, nCi/mg, or pCi/ug (c) 234U 0.3563 0.0313 0.5125 1.8750 235U 0.0156 0.0054 0.0210 0.0639 236U negligible negligible 0.0440 negligible 238U 0.3336 0.3352 0.3325 0.3260 Total 0.7054 0.3718 0.9099 2.2649
Specific Constituent Activity in Mixture (dpm/ug)(c) 234U 0.7909 0.0694 1.1378 4.1625 235U 0.0345 0.0120 0.0465 0.1419 236U negligible negligible 0.0977 negligible 238U 0.7405 0.7441 0.7381 0.7236 Total 1.5659 0.8254 2.0200 5.0281
Constituent Fraction of Total Uranium Activity in Mixture 234U 0.5051 0.0840 0.5632 0.8279 235U 0.0221 0.0145 0.0230 0.0282 236U negligible negligible 0.0484 negligible 238U 0.4729 0.9014 0.3654 0.1439 Total 1.0000 1.0000 1.0000 1.0000
(a) NU, DU, and CF data from Rich et al. 1988. (b) RU data based on average of data presented by Sula, Carbaugh, and Bihl 1991. (c) Can be used to represent specific alpha activity in the mixture as well.
shorter-lived, fission products. Table 7.4 gives maximum allowed levels of these impurities in uranium that was handled at the UO3 Plant (Thompson 1986). These levels can be considered to represent the maximum impurity levels for recycled uranium at Hanford. Actual operational experience (also indicated in Table 7.4) showed that levels of impurities in recycled uranium at Hanford were substantially below the maximum allowed levels. Default reference levels for these impurities are also established in the table. These reference levels are used for bioassay program design and internal dosimetry. While the levels of 103, 106Ru and 95Zr-Nb might have been pertinent to historical Hanford operations and dosimetry, the

Issued: September 30, 2000 PNNL-MA-860 Chapter 7.0 Page 7.5
Table 7.4. Impurities in Recycled Uranium at Hanford
Constituent Maximum Allowed(a)
Observed Range (b)
Reference Level(c)
Plutonium 10 ppbp U <1 - 2 ppbp U 0.4 nCi Pu-alpha/g-U(d)
Neptunium Not established 0.04 - 0.16 ppmp
U 0.4 nCi 237Np/g-U(e) Thorium 750 ppmp U 8 - 10 ppmp U 5 pCi 232Th/g-U(f) 99Tc Not established 3 - 4 ppmp U 0.2 uCi 99Tc/g-U(g) 103,106Ru <20 uCi/lb-U <6 uCi/lb-U 40 nCi 106Ru/g-U(h) 95ZrNb <10 uCi/lb-U <4 uCi/lb-U 20 nCi 95ZrNb/g-U(i) Other Gamma Emitters excluding 99Tc <2 uCi/lb-U
0.09 - 0.75 uCi/lb-U none(j)
(a) From UO3 Plant operating specifications, OSD-U-185-0001 (Thompson 1986). (b) From analysis of uranium lots 88-1, 88-2, 88-3 that were processed in 1988, and lots 93-
01, 93-02, 93-03, 93-04, and 93.05, processed in 1993. (c) A reference level is chosen for determining bioassay monitoring needs and for use as an
initial assumption in evaluating intakes. The use of the reference levels is expected to result in a slight overestimate of dose compared to levels actually observed in 1988.
(d) Based on 5 ppbp U and assuming plutonium is represented by aged 6% 240Pu (weapons grade) material.
(e) Based on 0.5 ppmp U of 237Np. (f) Based on 50 ppmp U of 232Th. (g) Based on 10 ppmp U of 99Tc. (h) Based on 20 uCi/lb-U of 106Ru. (i) Based on 10 uCi/lb-U of 95ZrNb. (j) Negligible contribution compared to other impurities.
short physical half-lives of these radionuclides render them moot to current sources at Hanford. 236U is produced by the 235U (n,() reaction, and does not occur naturally. Its presence is an indicator of recycled uranium as opposed to natural uranium. Data compiled by Wittekind and Morey (1985) suggest that 236U concentration in cast uranium ingots could range from 0.03 to 0.08 weight percent for Hanford uranium fuel. The 234U:238U activity ratio can help in differentiating types of uranium. Goldstein, Rodriguez, and Lujan (1997) reported that depleted uranium (234U:238U =0.15) and highly enriched uranium (234U:238U >100) are compositions only rarely found in natural samples, that typical water samples show 234U:238U activity ratios of 0.8 to 10, and that soil sample activity ratios ranged from 0.5 to 1.2. They suggested that activity ratios outside of these natural limits could be indicative of exposure to anthropogenic sources of uranium.

PNNL-MA-860 Chapter 7.0 Issued: September 30, 2000 Page 7.6
7.1.3 Environmental Background Uranium is ubiquitous to the natural environmental background. It is found in trace quantities in rocks, soil, surface water, groundwater, air, plants, and animals. Some of the routine concentrations that might be naturally encountered are shown in Table 7.5. The presence of uranium as part of the natural environment results in its presence in urine. The sensitivity of urine sampling as a uranium bioassay tool is limited by the presence of environmental levels of uranium. The sensitivity is subject to some uncertainty in interpreta-tion. In ICRP 30 (1979) the average daily ingestion intake of natural
Table 7.5. Environmental Levels of Uranium
Media Level Reference (a) 3 ppm PHS (1997) 1 pCi/g PHS (1997) 0.5-4.7 ppm
(7-60 Bq 238U/kg) NCRP 94 (1988)
25 Bq 238U/kg
Soil (typical)
(10-50 Bq 238U/kg ) UNSCEAR (1988)
Soil (phosphate rich) 4.5 – 83.4 pCi/g PHS (1997) 0.011 – 3 fCi/m3 PHS (1997) 0.3 µBq/m3 Golchert et al. (1985) Air 0.7 µBq/m3 Fisenne et al. (1987)
Water <1 pCi/l PHS (1997) 37 mBq/l Surface water (0.37 – 25,000 mBq/l)
Drury et al. 1983
111 mBq/l Ground water (0.037 to 24,000)
Drury et al. 1983
20 µg/l EPA (1991) Proposed drinking water standard (maybe 80 µg/l) PHS (1997) Human Consumption
0.6 – 1.0 pCi/d PHS (1997) Food 1.3 – 1.4 µg/d Welford and Baird (1967) 0.8 pCi/l PHS (1997) Water
(1.13 µg/l) Human Excretion
0.05 – 0.5 µg/d ICRP publication 23 (1974) Urine 0.2 µg/d Hanford Environmental
Screening Level (this document) Feces 1.4 – 1.8 µg/d ICRP publication 23 (1974) (a) PHS = Public Health Services.

Issued: September 30, 2000 PNNL-MA-860 Chapter 7.0 Page 7.7
uranium in food and water is estimated to be 1.9 µg. Assuming that the GI tract absorption of uranium at environmental levels is about 1% (Wrenn 1985) at equilibrium, about 0.02 µg/d could be expected in the urine of occupationally unexposed workers. The ICRP Reference Man Report (1974) lists urinary excretion from 0.05 to 0.5 µg/d and fecal excretion from 1.4 to 1.8 µg/d, although the range reported in its cited literature is much greater. Studies at Hanford, performed in 1985, 1990, and 1995, indicated that the concentrations of uranium in urine in the Hanford area are similar or slightly higher than the foregoing estimates (Carbaugh, Sula, and McFadden 1990; Long, Carbaugh, and Fairrow 1994; and Long and Carbaugh 1995). Urine samples were collected in mid-1985 from 21 occupationally unexposed Hanford workers who resided in various locations around Hanford, including Yakima, Benton City, Kennewick, and Richland. Both municipal drinking water and individual well-water systems were represented by the sampling. The results ranged from below detectable levels (0.03 µg/d) to 0.12 µg/d. For seven of the individuals, three samples were collected over a 2-week period, and the daily excretion remained fairly constant for each individual over the period. Data for this group are shown as the 1985 curve in Figure 7.1. The median daily uranium output for the 1985 study group was 0.06 µg and 0.2 µg/d was estimated to be the 99.9 percentile (one in a thousand samples collected from unexposed workers would be expected to exceed that value). Based on this study, samples containing less than 0.2 µg/d of uranium were considered to be within the expected environmental range, and results above 0.2 µg/d were considered to contain occupationally derived uranium. The net amount attributed to occupational sources was calculated as the total observed amount minus the average expected environmental level of 0.06 µg/d. A second study of background uranium levels in urine commenced in 1990. Urine samples were collected from 20 nonoccupationally exposed workers in early 1990 with the intent of collecting quarterly samples from each worker throughout the year, as well as samples of their drinking water. The workers were selected to provide an indication of the possible correlation between drinking water sources and urinary excretion. Due to the cancellation of the analytical support services laboratory contract this study was terminated after collection of the first samples. However, the data are useful as a comparison with the 1985 data and, as can be seen in Figure 7.1, show some very interesting variations. The geometric mean of this
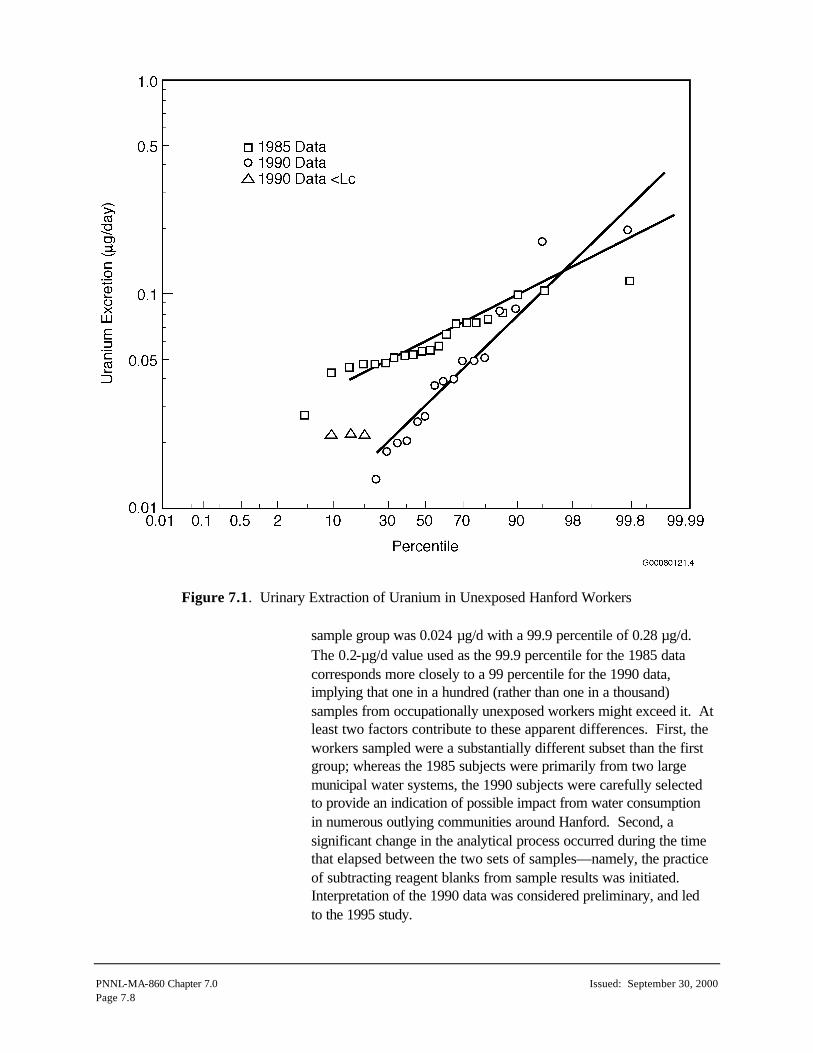
PNNL-MA-860 Chapter 7.0 Issued: September 30, 2000 Page 7.8
Figure 7.1. Urinary Extraction of Uranium in Unexposed Hanford Workers sample group was 0.024 µg/d with a 99.9 percentile of 0.28 µg/d. The 0.2-µg/d value used as the 99.9 percentile for the 1985 data corresponds more closely to a 99 percentile for the 1990 data, implying that one in a hundred (rather than one in a thousand) samples from occupationally unexposed workers might exceed it. At least two factors contribute to these apparent differences. First, the workers sampled were a substantially different subset than the first group; whereas the 1985 subjects were primarily from two large municipal water systems, the 1990 subjects were carefully selected to provide an indication of possible impact from water consumption in numerous outlying communities around Hanford. Second, a significant change in the analytical process occurred during the time that elapsed between the two sets of samples—namely, the practice of subtracting reagent blanks from sample results was initiated. Interpretation of the 1990 data was considered preliminary, and led to the 1995 study.

Issued: September 30, 2000 PNNL-MA-860 Chapter 7.0 Page 7.9
The 1995 study involved sampling 20 nonoccupationally exposed male Hanford workers, 8 of whom were resampled at 3-month intervals for a year. Concurrent drinking water samples were obtained from each worker and also analyzed for uranium. The workers included residents of Richland, Pasco, and Kennewick, as well as outlying areas, and included drinking water sources from surface water and groundwater wells. The study made the following conclusions important to the interpretation of worker uranium urinalyses:
• The urinary screening level of 0.2 µg U/d established by the 1985 study was appropriate for most individuals, however 2 to 5% of the workers could be expected to be above that value due to unknown nonoccupational sources. The study indicated the possibility that home drinking water might be the primary source of the unusually high excretion of uranium, however the study was not extensive enough to make that a definitive conclusion. Complicating factors include how much home water is consumed, the source of the water (wells or surface, i.e., Columbia River water), and water treatment (e.g., water softener systems).
• The geometric mean urinary excretion for the group was
0.021-µg/d.
• The use of the 238U to 234U ratio as a co-indicator for Hanford occupational exposure to recycled uranium is not feasible because the isotopic ratio in the slightly enriched Hanford recycled uranium may not be significantly different from that of natural environmental sources. The ratio can be of value if highly enriched or depleted uranium is the potential occupational concern.
• Correlation analyses between the amount of uranium in the urine
sample and the amount of uranium in the drinking water samples showed no significant correlation. There was a weak correlation when the concentration of uranium in water was high.
• A water source effect was observed for uranium in water.
Private well water typically exhibited higher uranium concentrations than large municipal drinking water sources.
• There did not appear to be a correlation between geographic
location of residence within the Yakima River Valley and daily excretion of uranium.

PNNL-MA-860 Chapter 7.0 Issued: September 30, 2000 Page 7.10
• There did not appear to be a seasonal effect on the concentration of uranium in urine or water when the overall data were tested, nor when specific mid-Columbia regions were examined.
Fecal excretion of uranium from ingestion of nonoccupational sources of uranium in the Hanford environs has not been studied in a manner similar to that of urine excretion. Lacking Hanford-specific information, it is assumed that the ICRP Reference Man values of 1.4 to 1.8 µg/d are reasonable.
7.2 Biokinetic Behavior This section discusses the inhalation transportability class, internal distribution and retention, the urinary and fecal excretion of uranium, and its chemical toxicity.
7.2.1 Transportability Class The transportability classes for uranium are those used in the ICRP publication 30 (1979) respiratory tract model and are sometimes referred to as solubility or inhalation classes. The class designation represents the relative speed at which material is solubilized and translocated into the transfer compartment from the deep pulmonary (or alveolar) region of the lung. Classes D, W and Y, as used in this technical basis, are identical to the ICRP 30 classes of the same name. The term “instantaneous uptake” is used in this technical basis to refer to the material that is essentially immediately taken up by the transfer compartment upon intake, and is typically applied to wound scenarios. The new respiratory tract model presented in ICRP publication 66 (ICRP 1994a), replaced the ICRP 30 concepts of inhalation class D, W, and Y, with absorption Types F, M, and S. Whereas the ICRP 30 inhalation classes described overall clearance (i.e., absorption and mechanical clearance), the ICRP 66 type refers only to the absorption characteristics (i.e., dissolution and absorption into blood). With regard to the dissolution and absorption rates, the ICRP 30 classes D, W, and Y correspond to the characteristics of ICRP 66 Types F, M, and S, respectively. Although Hanford has not adopted the ICRP 66 respiratory tract model, the use of the absorption types as a supple -mental concept to the ICRP 30 inhalation classes may be useful, particularly with the application of newly published solubility studies or animal study data. Unless specifically indicated, the chemical forms assigned to the ICRP 30 classes can be assumed to be assigned to the corresponding ICRP 66 absorption types (and vise versa).

Issued: September 30, 2000 PNNL-MA-860 Chapter 7.0 Page 7.11
Table 7.6 provides transportability classifications for uranium compounds as recommended in ICRP publication 30 and also shows the absorption type (F, M, or S) of ICRP publication 68 (1994b). Unless special dissolution analysis is performed, these assigned classifications are used for Hanford internal dosimetry. Special dissolution studies were performed in the mid-1980s for uranium handled in the UO3 Plant, the Fuel Production Facilities, and the 306-W Building, and are also summarized in Table 7.6. It is also worth noting that Dang et al. (1994) identified uranium oxide as having an order of magnitude slower transportability than ICRP 30 class Y.
7.2.2 Gastrointestinal Uptake to Blood (f1 Factor) Table 7.6 includes the recommendations of the ICRP in publication 30 (1979) and publication 69 (1995) for the fractional absorption of uranium to blood from the GI tract. The ICRP 30 value of 0.05 for inorganic forms of uranium was established based mainly on human data for uranyl nitrate ingestion reported by Hursh et al. (1969). More recent data reviewed by Wrenn et al. (1985), Harrison (1991), and Leggett and Harrison (1995) resulted in ICRP adopting 0.02 for adults as a more realistic for dietary forms of uranium. It was noted
Table 7.6. Inhalation Class, Lung Absorption Type, and f1 Factors for Occupational Exposure to Uranium Compounds
ICRP 30 Inhalation Class f1 Factor Compound
ICRP 68 Lung Absorption Type
f1 Factor
D 0.05
Highly soluble forms UF6, UO2F2, UO2(NO3)2, most hexavalent compounds
F 0.020
W 0.05
Less soluble forms UO3, UF4, UCl4, and most other hexavalent compounds
M 0.020
Y 0.002
Highly insoluble forms UO2, U3O8 S 0.002
80% D 20% W
Hanford UO3 Plant smear sample dissolution study in 1984(a), (UO3 powder)
10% D 90% Y
Hanford 303-M Building air sample dissolution study(b) (300 Area Uranium Fuel Production Facilities)
29% D 71% Y
Hanford 333 Building air sample dissolution study(b) (300 Area Uranium Fuel Production Facilities)
20% D 80% Y
Hanford 306-W Building Machine Shop air sample dissolution study(b)
(a) Sula, Bihl, and Carbaugh (1989). (b) Letter Report to Monte J. Sula from Darrell R. Fisher, January 20, 1986, “Particle Size Distribution and
Solubility of Uranium Aerosols in 333 and 303M Buildings at UNC, and PNL’s 306W Building. (Copy available in Hanford Radiological Records Historical File).

PNNL-MA-860 Chapter 7.0 Issued: September 30, 2000 Page 7.12
that this value actually summarizes a range of 1 to 2 orders of magnitude, with the more soluble compounds being more readily absorbed. Legget and Harrison noted that the range was from <0.001 to 0.06, with a central range of 0.003 to 0.032, and their choice of a value was 0.01 to 0.015. They also noted uranium may be more readily absorbed from water than food such as fresh vegetables and shellfish, because the latter may have more insoluble forms of uranium. Fasting may result in enhanced absorption. For highly insoluble forms of uranium, the ICRP retained its earlier value of 0.002. The HIDP adopts the more recent ICRP recommendations of 0.02 and 0.002 as the f1 values for, respectively, soluble and insoluble forms of uranium.
7.2.3 Distribution, Retention, and Excretion For the design of monitoring programs and for the assessment of dose equivalents when there is insufficient bioassay measurement data to develop individual-specific characteristics, the distribution, retention, and excretion of uranium are assumed to follow the biokinetic model described in ICRP 30. This model assigns the inhalation classes shown in Table 7.6. For material entering the systemic circulation, fractions 0.2 and 0.023 are assumed to go to mineral bone and be retained there with half-lives of 20 and 5000 days, respectively; fractions 0.12 and 0.00052 are assumed to go to the kidneys and to be retained with half-lives of 6 and 1500 days, respectively; and fractions 0.12 and 0.00052 are assumed to go to all other tissues of the body and be retained with half-lives of 6 and 1500 days, respectively. Uranium is assumed to be uniformly distributed among these other tissues. The remaining fraction of the uranium entering the systemic circulation, 0.54, is assumed to go directly to excretion. Long-lived uranium isotopes entering the bone are assumed to be distributed uniformly throughout the bone volume. The recent ICRP publication 69 (ICRP 1995) recycling model for uranium indicates an assumption of a small fraction (0.005) to feces. This is insignificant with regard to operational health physics and is not adopted for Hanford use at this time. Selected lung retention, urinary excretion, fecal excretion, and kidney retention fractions for instantaneous uptake, acute inhalations, and ingestion are tabulated in Tables 7.7 through 7.10 and plotted in Figures 7.2 through 7.5. These factors were calculated using the CINDY computer code.

Issued: September 30, 2000 PNNL-MA-860 Chapter 7.0 Page 7.13
Table 7.7. Lung Retention Fractions Following Uranium Inhalation(a)
Class D Inhalation Class W Inhalation Class Y InhalationDays Post Intake 1-µm 5-µm 1-µm 5-µm 1-µm 5-µm
0 0.33 0.17 0.33 0.17 0.33 0.17 1 0.080 0.028 0.21 0.075 0.21 0.077 2 0.024 0.0086 0.18 0.063 0.18 0.064 5 5.8E-04 2.1E-04 0.15 0.051 0.15 0.054 7 4.5E-05 1.6E-05 0.14 0.049 0.15 0.053
14 insig. insig. 0.13 0.044 0.15 0.052 30 insig. insig. 0.10 0.036 0.15 0.051 60 insig. insig. 0.070 0.025 0.14 0.050 90 insig. insig. 0.048 0.017 0.14 0.048
180 insig. insig. 0.015 0.0053 0.12 0.044 365 insig. insig. 0.0014 4.8E-04 0.10 0.036 730 insig. insig. 1.1E-05 3.9E-06 0.073 0.026
1,825 insig. insig. insig. insig. 0.029 0.010 3,600 insig. insig. insig. insig. 0.0099 0.0035 7,300 insig. insig. insig. insig. 0.0042 0.0015
18,250 insig. insig. insig. insig. 0.0038 0.0013 (a) Factors are applicable to 234U, 235U, 236U, 238U, natural uranium, depleted
uranium, recycled uranium, or any combination thereof.
0.001
0.010
0.100
1.000
1 10 100 1000 10000 100000
Days Post Intake
Inta
ke R
eten
tio
n F
ract
ion
1-um Class D
5-um Class D
1-um Class W
5-um Class W
1-um Class Y
5-um Class Y
Figure 7.2. Uranium Lung Retention

PNN
L-MA-860 Chapter 7.0
Issued: Septem
ber 30, 2000Page 7.14
Table 7.8. Urine Excretion Fractions Following Uranium Intake(a)
Class D Inhalation Class W Inhalation Class Y Inhalation Ingestion Days Post Intake
Instantaneous Uptake 1-µm 5-µm 1-µm 5-µm 1-µm 5-µm f1=0.02 f1=0.0020
1 1.2E-02 1.0E-01 8.4E-02 1.2E-02 2.0E-02 8.0E-04 1.6E-03 4.3E-03 4.3E-04 2 3.5E-02 4.1E-02 2.8E-02 3.9E-03 6.0E-03 2.7E-04 5.0E-04 8.4E-04 8.4E-05 5 2.2E-02 1.2E-02 1.2E-02 2.1E-03 3.0E-03 1.2E-04 2.3E-04 4.5E-04 4.5E-05 7 1.8E-02 9.3E-03 1.0E-02 1.8E-03 2.5E-03 1.0E-04 1.9E-04 3.7E-04 3.8E-05
14 1.0E-02 5.0E-03 5.5E-03 1.2E-03 1.4E-03 6.3E-05 1.1E-04 2.0E-04 2.0E-05 30 3.4E-03 1.7E-03 1.9E-03 6.5E-04 5.7E-04 3.2E-05 3.9E-05 6.9E-05 6.9E-06 60 9.1E-04 4.4E-04 5.0E-04 3.8E-04 2.3E-04 2.1E-05 1.5E-05 1.8E-05 1.8E-06 90 3.1E-04 1.5E-04 1.7E-04 2.6E-04 1.2E-04 1.9E-05 9.3E-06 6.3E-06 6.3E-07
180 1.7E-05 8.4E-06 9.4E-06 9.0E-05 3.4E-05 1.8E-05 6.5E-06 3.5E-07 3.5E-08 365 3.5E-06 1.7E-06 1.9E-06 1.1E-05 4.1E-06 1.8E-05 6.5E-06 6.9E-08 6.9E-09 730 3.2E-06 1.5E-06 1.7E-06 5.3E-07 5.1E-07 1.7E-05 6.1E-06 6.4E-08 6.4E-09
1,825 2.7E-06 1.3E-06 1.5E-06 3.5E-07 4.0E-07 1.1E-05 3.8E-06 5.4E-08 5.4E-09 3,600 2.0E-06 9.7E-07 1.1E-06 2.7E-07 3.0E-07 3.7E-06 1.3E-06 4.0E-08 4.0E-09 7,300 1.2E-06 5.6E-07 6.4E-07 1.5E-07 1.7E-07 3.7E-07 1.4E-07 2.4E-08 2.4E-09
18,250 2.5E-07 1.2E-07 1.4E-07 3.3E-08 3.7E-08 1.7E-08 8.0E-09 5.1E-09 5.1E-10 (a) Factors are applicable to 234U, 235U, 236U, 238U, natural uranium, depleted uranium, recycled uranium, or any combination thereof.

Issued: September 30, 2000
PN
NL-M
A-860 C
hapter 7.0
Page 7.15
1.0E-10
1.0E-09
1.0E-08
1.0E-07
1.0E-06
1.0E-05
1.0E-04
1.0E-03
1.0E-02
1.0E-01
1 10 100 1000 10000 100000
Days Post Intake
Uri
ne
Exc
reti
on
Fra
ctio
n
Instantaneous Uptake
1-um Class D
5-um Class D
1-um Class W
5-um Class W
1-um Class Y
5-um Class Y
Soluble Ingestion
Insoluble Ingestion
Figure 7.3. Uranium Urinary Excretion

PNN
L-MA-860 Chapter 7.0
Issued: Septem
ber 30, 2000Page 7.16
Table 7.9. Fecal Excretion Fractions Following Intake of Uranium(a)
Class D Inhalation Class W Inhalation Class Y Inhalation Ingestion Days Post Intake
Instantaneous Uptake 1-µm 5-µm 1-µm 5-µm 1-µm 5-µm Soluble Insoluble
1 0.0E+00 7.0E-02 1.7E-01 1.0E-01 2.1E-01 1.3E-01 2.5E-01 4.6E-01 4.7E-01 2 0.0E+00 4.4E-02 1.1E-01 1.3E-01 2.5E-01 1.6E-01 2.9E-01 2.8E-01 2.8E-01 5 0.0E+00 2.8E-03 6.7E-03 2.3E-02 3.0E-02 2.4E-02 3.4E-02 1.8E-02 1.8E-02 7 0.0E+00 3.8E-04 9.2E-04 6.1E-03 5.4E-03 5.4E-03 5.6E-03 2.4E-03 2.5E-03
14 0.0E+00 3.5E-07 8.4E-07 1.2E-03 4.2E-04 1.7E-04 6.3E-05 2.2E-06 2.3E-06 30 0.0E+00 4.3E-13 1.8E-12 9.2E-04 3.2E-04 1.3E-04 4.7E-05 5.3E-12 7.7E-13 60 0.0E+00 insig. insig. 6.1E-04 2.1E-04 1.3E-04 4.5E-05 insig. insig. 90 0.0E+00 insig. insig. 4.0E-04 1.4E-04 1.2E-04 4.3E-05 insig. insig.
180 0.0E+00 insig. insig. 1.2E-04 4.1E-05 1.1E-04 3.8E-05 insig. insig. 365 0.0E+00 insig. insig. 8.9E-06 3.1E-06 8.4E-05 2.9E-05 insig. insig. 730 0.0E+00 insig. insig. 5.6E-08 2.0E-08 5.0E-05 1.8E-05 insig. insig.
1,825 0.0E+00 insig. insig. 1.7E-13 8.3E-15 1.1E-05 3.9E-06 insig. insig. 3,600 0.0E+00 insig. insig. insig. insig. 9.4E-07 3.3E-07 insig. insig. 7,300 0.0E+00 insig. insig. insig. insig. 5.6E-09 2.0E-09 insig. insig.
18,250 0.0E+00 insig. insig. insig. insig. 1.5E-15 6.2E-16 insig. insig. (a) Factors are applicable to 234U, 235U, 236U, 238U, natural uranium, depleted uranium, recycled uranium, or any combination thereof.

Issued: September 30, 2000
PN
NL-M
A-860 C
hapter 7.0
Page 7.17
1.0E-10
1.0E-09
1.0E-08
1.0E-07
1.0E-06
1.0E-05
1.0E-04
1.0E-03
1.0E-02
1.0E-01
1.0E+00
1 10 100 1000 10000 100000
Days Post Intake
Fec
al E
xcre
tio
n F
ract
ion
1-um Class D
5-um Class D
1-um Class W
5-um Class W
1-um Class Y
5-um Class Y
Soluble Ingestion
Insoluble Ingestion
Figure 7.4. Uranium Fecal Excretion
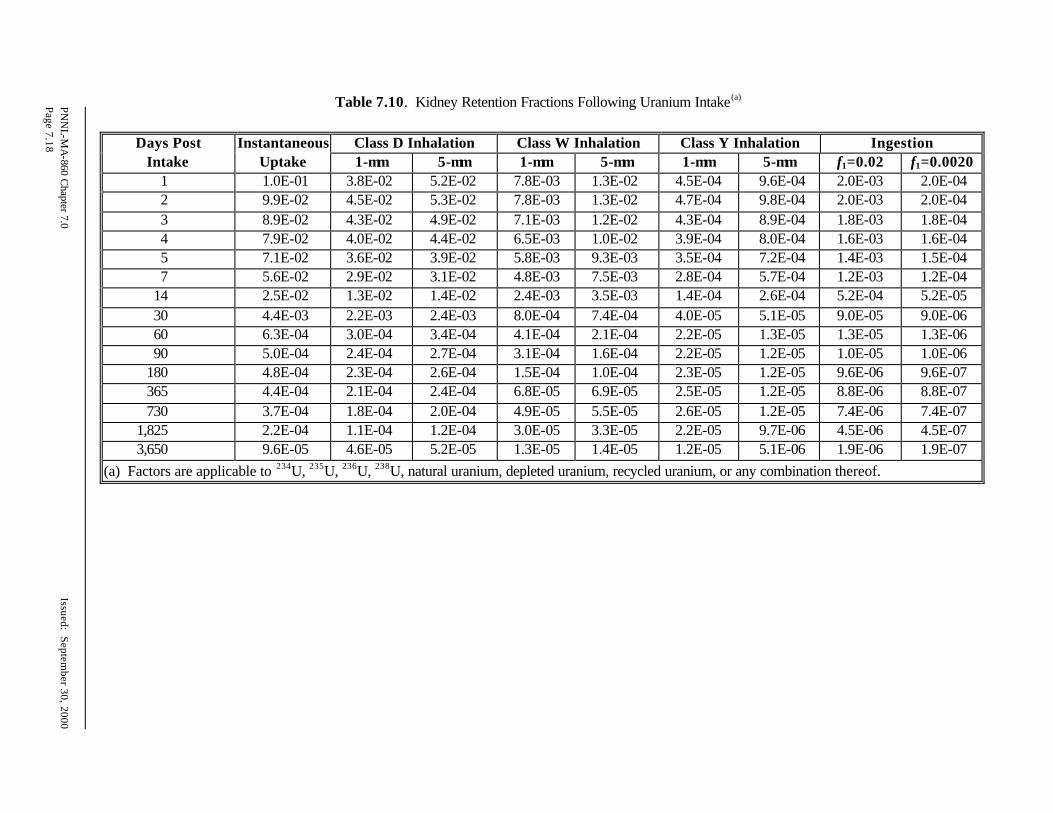
PNN
L-MA-860 Chapter 7.0
Issued: Septem
ber 30, 2000Page 7.18
Table 7.10. Kidney Retention Fractions Following Uranium Intake(a)
Class D Inhalation Class W Inhalation Class Y Inhalation Ingestion Days Post
Intake Instantaneous
Uptake 1-µm 5-µm 1-µm 5-µm 1-µm 5-µm f1=0.02 f1=0.0020 1 1.0E-01 3.8E-02 5.2E-02 7.8E-03 1.3E-02 4.5E-04 9.6E-04 2.0E-03 2.0E-04 2 9.9E-02 4.5E-02 5.3E-02 7.8E-03 1.3E-02 4.7E-04 9.8E-04 2.0E-03 2.0E-04 3 8.9E-02 4.3E-02 4.9E-02 7.1E-03 1.2E-02 4.3E-04 8.9E-04 1.8E-03 1.8E-04 4 7.9E-02 4.0E-02 4.4E-02 6.5E-03 1.0E-02 3.9E-04 8.0E-04 1.6E-03 1.6E-04 5 7.1E-02 3.6E-02 3.9E-02 5.8E-03 9.3E-03 3.5E-04 7.2E-04 1.4E-03 1.5E-04 7 5.6E-02 2.9E-02 3.1E-02 4.8E-03 7.5E-03 2.8E-04 5.7E-04 1.2E-03 1.2E-04
14 2.5E-02 1.3E-02 1.4E-02 2.4E-03 3.5E-03 1.4E-04 2.6E-04 5.2E-04 5.2E-05 30 4.4E-03 2.2E-03 2.4E-03 8.0E-04 7.4E-04 4.0E-05 5.1E-05 9.0E-05 9.0E-06 60 6.3E-04 3.0E-04 3.4E-04 4.1E-04 2.1E-04 2.2E-05 1.3E-05 1.3E-05 1.3E-06 90 5.0E-04 2.4E-04 2.7E-04 3.1E-04 1.6E-04 2.2E-05 1.2E-05 1.0E-05 1.0E-06
180 4.8E-04 2.3E-04 2.6E-04 1.5E-04 1.0E-04 2.3E-05 1.2E-05 9.6E-06 9.6E-07 365 4.4E-04 2.1E-04 2.4E-04 6.8E-05 6.9E-05 2.5E-05 1.2E-05 8.8E-06 8.8E-07 730 3.7E-04 1.8E-04 2.0E-04 4.9E-05 5.5E-05 2.6E-05 1.2E-05 7.4E-06 7.4E-07
1,825 2.2E-04 1.1E-04 1.2E-04 3.0E-05 3.3E-05 2.2E-05 9.7E-06 4.5E-06 4.5E-07 3,650 9.6E-05 4.6E-05 5.2E-05 1.3E-05 1.4E-05 1.2E-05 5.1E-06 1.9E-06 1.9E-07
(a) Factors are applicable to 234U, 235U, 236U, 238U, natural uranium, depleted uranium, recycled uranium, or any combination thereof.

Issued: September 30, 2000
PN
NL-M
A-860 C
hapter 7.0
Page 7.19
1.0E-07
1.0E-06
1.0E-05
1.0E-04
1.0E-03
1.0E-02
1.0E-01
1 10 100 1000 10000
Days Post Intake
Kid
ney
In
take
Ret
enti
on
Fra
ctio
n
Instantaneous Uptake
1-um Class D
5-um Class D
1-um Class W
5-um Class W
1-um Class Y
5-um Class Y
Soluble Ingestion
Insoluble Ingestion
Figure 7.5. Kidney Retention of Uranium

PNNL-MA-860 Chapter 7.0 Issued: September 30, 2000 Page 7.20
7.2.4 Chemical Toxicity Chemical toxicity is a potential concern for intakes of low-enrichment uranium (<10% 235U, by weight) in a readily transportable form (class D or W). Such concerns can make chemical toxicity a more limiting intake condition than dose equivalent. Chemical toxicity is not a major issue for slowly transportable forms (class Y). The Hanford basis for chemical toxicity is now a peak kidney concentration of 1.1 µg-U/g-kidney resulting from either acute or chronic exposure. This approach is conservative, in that a larger acute kidney concentration can be tolerated without significant effect than might result from a long-term chronic concentration. The 1.1-µg/g value was chosen based on acute or chronic intake scenarios, even though indications are that a 3-µg/g chronic value can be tolerated without significant effect. (See the following paragraphs for more detailed discussion.) Multiplying the 1.1-µg/g value by the kidney mass of 310 g gives a total kidney burden of 341 g as a Reference Man value for a “no effect” threshold. Acute intakes can be calculated which would result in such a kidney burden by dividing the kidney burden by the kidney retention fraction. This analysis is included for several intake scenarios in Section 7.3. Chronic intake rates can be similarly calculated, however such levels have not been included in this manual because chronic intake is not currently a routine Hanford condition. A chronic kidney burden of 3 µg-U/g-kidney has historically been the basis for development of action levels for bioassay monitoring of workers who are chronically exposed to uranium (Hursh and Spoor 1973). Studies by Morrow et al. (1982) with the highly transportable and toxic form of uranium, UO2F2, indicated that steady-state kidney concentrations of 3 µg/g in dogs were sufficient to produce indica-tions of uranium poisoning. Although UO2F2 is not handled at Hanford, it is prudent for bioassay monitoring purposes to assume a renal toxicity threshold of less than 3 µg/g of kidney. Based on recent studies by a number of investigators, Rich et al. (1988) suggested that the “no effect” threshold for uranium in kidney is 1.1 µg/g. Hanford adopted a “no effect” threshold of 0.4 µg/g as a sustained kidney burden value, based on one-third of the Rich value, rounded to one significant figure (Sula, Carbaugh, and Bihl 1989). This sustained kidney burden approach is now replaced for Hanford applications by a peak kidney concentration approach, using the 1.1 µg/g value for both chronic and acute exposure scenarios. Additional publications have raised some question as to the appropriate magnitude for an assumed “no effects threshold level” of

Issued: September 30, 2000 PNNL-MA-860 Chapter 7.0 Page 7.21
uranium intake, uptake, or kidney burden. In an extensive review article, Leggett (1989) noted that results and conclusions of studies have varied widely and that “apparent discrepancies may be due largely to differences in 1) perceptions and/or definitions of toxicity, 2) sensitivity of the measurements of kidney damage or dysfunction, 3) patterns of exposure (for example, acute versus chronic), and 4) sensitivity to renal U in different species.” Leggett concluded “it may be prudent to lower this long-standing guidance level [of 3 µgU/g] by roughly an order of magnitude until more is known about subtle physiological effects of small quantities of U in the kidneys.” Similar sentiment was expressed by SuLu and Zhao (1990) in recommending a maximum safe uranium burden in the kidney of 0.26 µg/g, based on a 10-fold safety factor below mild kidney impairment observed in one human case at 2.6 µgU/g. Considering Leggett noted that the early researchers cited ranges of “much less than 5 µg/g, probably 2 to 3 µg/g” rather than absolute values, the question of a 1.1 µg/g versus a 0.3 µg/g “no effects” threshold relates more to a matter of an assumed factor for conser-vativeness rather than actual linkage to significant identifiable effects. The ICRP provided a brie f overview of chemical toxicity in publication 78 (ICRP 1997). Guidance for a maximum single acute intake of 2.5-mg uranium in any one day was provided in ICRP 6 (1964), based on work by Eve (1964). However, Eve’s analysis was derived from the assumption that a daily intake of 2.5 mg of uranium could be tolerated without harm (i.e., chronic exposure of 2.5 mg/d). Of more relevance for acute intakes are the results of human injec-tion studies that have shown an uptake of 0.07 mg of hexavalent uranium per kilogram of body weight produced transient injury and 0.1 mgU/kg of body weight produced catalasuria and proteinuria (Hursh and Spoor 1973). A renal toxicity threshold of 0.1 mg of acute uptake to blood per kilogram of body weight or a 7-mg of acute uptake for Reference Man was used at Hanford during the 1980s and 1990s as a basis for action levels for highly soluble uranium bioassay monitoring. This corresponded to an acute inhalation of 15 mg of class D uranium as a threshold for renal toxicity. The Occupational Safety and Health Administration regulations (29 CFR 1910.1000 Table Z-1) set airborne permissible exposure limits (PELs) for natural uranium of 0.05 mg/m3 for soluble compounds and 0.25 mg/m3 for insoluble compounds, implying daily intake limits of 0.48 mg (0.5 mg) and 2.4 mg, respectively. The American Conference on Governmental Industrial Hygienists (ACGIH 1968; 1983) recommended a threshold limit value (TLV) for air concentration of uranium as 0.2 mg/m3. In addition, ACGIH

PNNL-MA-860 Chapter 7.0 Issued: September 30, 2000 Page 7.22
set a short-term exposure limit (STEL) of 0.6 mg/m3 as an average concentration over a 15-minute period. The OSHA PELs and ACGIH TLVs are time-weighted-average values that apply over an 8-hour workday for a 40-hour workweek and a working lifetime; i.e., they represent a chronic occupational exposure condition. Studies of the highly soluble uranyl fluoride (UO2F2) showed that intravenous doses of 0.01 mgU/kg of body weight for dogs and 0.1 mgU/kg of body weight for rats were nephrotoxic, and that the threshold for injury in man was thought to be about 0.07 mgU/kg of body weight (Morrow et al. 1982). The renal toxicity of uranium varies with the compound form, with toxicity increasing with chemical solubility (Morrow et al. 1982). Based on work by Just (1984), Just and Emler (1984), and Fisher, Swint, and Kathren (1990), McGuire (1991) concluded that an acute intake of soluble uranium of 10 mg or less is unlikely to have any detectable (even transient) effects, and that a 40-mg intake (possibly as high as 100 mg) is likely to be below the level of any permanent effects. McGuire cited as levels corresponding to a threshold for transient renal injury or effect, values of 0.058 mg-U/kg of body weight, 4 mg in total body of 70-kg person (Reference Man), and an acute intake of 8.3 mg. The ANSI standard HPS N13.22-1995, Bioassay Programs for Uranium (HPS 1995) repeated McGuire’s tabulations in its appendix.
7.3 Internal Dosimetry Factors This section contains factors that are useful in making internal dosimetry calculations. The factors included in this section are derived from the CINDY computer code and incorporate the models and assumptions described in the preceding section. Their application is intended for those circumstances where such assumptions are appropriate or more specific information is lacking. Variation from these factors is appropriate if sufficient data are available.
7.3.1 Intake Retention and Excretion Fractions Selected lung retention, urinary excretion, fecal excretion, and kidney retention fractions for instantaneous uptake, acute inhalation, and acute ingestion are tabulated in Tables 7.7 through 7.10 and plotted in Figures 7.2 through 7.5. These factors were calculated using the CINDY computer code. Chronic occupational exposure to uranium, though routine in the past at the UO3 Plant and the Fuel Production Facilities, is not a likely scenario at Hanford due to current work scope and workplace control practices. If needed, chronic exposure factors can be calculated using the CINDY code.

Issued: September 30, 2000 PNNL-MA-860 Chapter 7.0 Page 7.23
7.3.2 Dose Coefficients Dose coefficients, expressed as committed dose equivalent per unit activity of intake (or mass of intake, if converted using the pure isotopic specific activity of Table 7.2 or the isotopic mixture specific activities of Table 7.3), are a convenient shortcut to estimating doses based on standard assumptions when the magnitude of an intake is known or assumed. Acute intake dose coefficients are tabulated in Tables 7.11 through 7.14 for the uranium isotopes 238U, 236U, 235U, and 234U for instantaneous uptake, class D, W, and Y inhalations (for both 1-µm- and 5-µm-AMAD particle sizes) and for ingestion. These dose coefficients were derived using the CINDY computer code. Table 7.15 gives committed effective dose equivalent coefficients for the constituents of recycled uranium. Table 7.16 summarizes dose coefficients for natural uranium, depleted uranium, and recycled uranium mixtures. Impurity radionuclides present in recycled uranium must be considered in dose assessments. Table 7.15 includes a summary of the contributions to the 50-year committed effective dose equivalent from the presence of reference levels of impurities in recycled uranium. From the table, it is seen that impurities do not signifi-cantly affect effective dose equivalents from class Y recycled uranium intakes, but they do contribute sufficiently to doses of class D and class W intakes to warrant their consideration. While the bone surface dose contributions seem significantly higher for class Y intakes, the effective dose poses the most limiting exposure condi-tion, and the impurities have negligible impact on that dose. Contributions to total dose from non-uranium impurity radionuclides may be estimated by multiplying the committed dose from uranium isotopes by the ratio of the total committed effective dose equivalent to the committed dose from uranium activity alone, as given in Table 7.15. This represents a reasonable assessment of the total dose when impurities are within the historical specifications. If intakes are sufficiently large that depositions of impurity radionuclides may be observable via bioassay measurements, then such measurements should be performed and resulting measurements factored into dose estimates. Table 7.16 provides a tabulation of dose coefficients for acute intakes of uranium mixtures in term of committed dose equivalent per unit mass of uranium intake. These units were selected because the mon-itoring for such mixtures has historically been performed using elemental uranium mass bioassay measurements.

PNN
L-MA-860 Chapter 7.0
Issued: Septem
ber 30, 2000 Page 7.24
Table 7.11. Committed Dose Coefficients for Acute Intakes of 238U (rem/nCi)(a)
Class D Inhalation Class W Inhalation Class Y Inhalation Ingestion Organ or Tissue
Instantaneous Uptake 1-µm 5-µm 1-µm 5-µm 1-µm 5-µm f1=0.02 f1=0.002
Effective 5.5E-03 2.7E-03 3.0E-03 7.0E-03 3.0E-03 1.2E-01 4.2E-02 1.2E-04 2.5E-05 Bone Surface 7.6E-02 3.6E-02 4.1E-02 9.9E-03 1.1E-02 3.8E-03 2.0E-03 1.5E-03 1.5E-04 Kidneys 3.1E-02 1.5E-02 1.7E-02 4.1E-03 4.6E-03 1.6E-03 8.2E-04 6.3E-04 6.3E-05 Red Marrow 5.0E-03 2.4E-03 2.7E-03 6.6E-04 7.4E-04 2.5E-04 1.3E-04 1.0E-04 1.0E-05 Lung insig. 1.0E-03 4.3E-04 5.2E-02 1.8E-02 9.8E-01 3.5E-01 insig. insig. Lower Large Intestine insig. insig. insig. insig. insig. insig. 1.6E-04 1.7E-04 1.7E-04 Upper Large Intestine insig. insig. insig. insig. insig. insig. insig. insig. 5.4E-04 (a) To convert to rem/mg, multiply by specific activity of 0.336 nCi/mg.
Table 7.12. Committed Dose Coefficients for Acute Intakes of 236U (rem/nCi)(a)
Class D Inhalation Class W Inhalation Class Y Inhalation Ingestion
Organ or Tissue Instantaneous
Uptake 1-µm 5-µm 1-µm 5-µm 1-µm 5-µm f1=0.02 f1=0.002 Effective 5.8E-03 2.9E-03 3.2E-03 7.6E-03 3.3E-03 1.3E-01 4.5E-02 1.3E-04 2.6E-05 Bone Surface 8.0E-02 3.8E-02 4.3E-02 1.0E-02 1.2E-02 4.0E-03 2.1E-03 1.6E-03 1.6E-04 Kidneys 3.3E-02 1.6E-02 1.8E-02 4.3E-03 4.9E-03 1.7E-03 8.7E-04 6.7E-04 6.7E-05 Red Marrow 5.1E-03 2.4E-03 2.7E-03 6.6E-04 7.4E-04 2.5E-04 1.3E-04 1.0E-04 1.0E-05 Lung insig. 1.1E-03 4.7E-04 5.6E-02 2.0E-02 1.1E+00 3.7E-01 insig. insig. Lower Large Intestine insig. insig. insig. insig. insig. insig. insig. 1.7E-04 1.7E-04 Upper Large Intestine insig. insig. insig. insig. insig. insig. insig. 5.8E-05 5.6E-05 (a) To convert to rem/mg, multiply by specific activity of 64.7 nCi/mg.

Issued: September 30, 2000
PN
NL-M
A-860 C
hapter 7.0
Page 7.25
Table 7.13. Committed Dose Coefficients for Acute Intakes of 235U (rem/nCi)(a)
Class D Inhalation Class W Inhalation Class Y Inhalation Ingestion
Organ or Tissue Instantaneous
Uptake 1-µm 5-µm 1-µm 5-µm 1-µm 5-µm f1=0.02 f1=0.002 Effective 5.6E-03 2.8E-03 3.1E-03 7.4E-03 3.2E-03 1.2E-01 4.4E-02 1.3E-04 2.8E-05 Bone Surface 7.7E-02 3.7E-02 4.2E-02 1.0E-02 1.1E-02 3.9E-03 2.0E-03 1.5E-03 1.5E-04 Kidneys 3.2E-02 1.5E-02 1.7E-02 4.2E-03 4.7E-03 1.7E-03 8.5E-04 6.5E-04 6.5E-05 Red Marrow 5.0E-03 2.4E-03 2.7E-03 6.5E-04 7.3E-04 2.6E-04 1.3E-04 1.0E-04 1.0E-05 Lung insig. 1.1E-03 4.6E-04 5.5E-02 1.9E-02 1.0E+00 3.6E-01 insig. insig. Lower Large Intestine insig. insig. insig. insig. insig. insig. insig. 2.0E-04 2.0E-04 Upper Large Intestine insig. insig. insig. insig. insig. insig. insig. 6.5E-05 6.2E-05 (a) To convert to rem/mg, multiply by specific activity of 2.16 nCi/mg.
Table 7.14. Committed Dose Coefficients for Acute Intakes of 234U (rem/nCi)(a)
Class D Inhalation Class W Inhalation Class Y Inhalation Ingestion
Organ or Tissue Instantaneous
Uptake 1-µm 5-µm 1-µm 5-µm 1-µm 5-µm f1=0.02 f1=0.002 Effective 6.1E-03 3.0E-03 3.3E-03 8.0E-03 3.4E-03 1.3E-01 4.7E-02 1.4E-04 2.7E-05 Bone Surface 8.4E-02 4.0E-02 4.5E-02 1.1E-02 1.2E-02 4.2E-03 2.2E-03 1.7E-03 1.7E-04 Kidneys 3.4E-02 1.6E-02 1.9E-02 4.5E-03 5.1E-03 1.8E-03 9.0E-04 6.9E-04 6.9E-05 Red Marrow 5.4E-03 2.6E-03 2.9E-03 7.0E-04 7.9E-04 2.7E-04 1.4E-04 1.1E-04 1.1E-05 Lung insig. 1.2E-03 4.9E-04 5.9E-02 2.1E-02 1.1E+00 3.9E-01 insig. insig. Lower Large Intestine insig. insig. insig. insig. insig. insig. insig. 1.8E-04 1.8E-04 Upper Large Intestine insig. insig. insig. insig. insig. insig. insig. 6.4E-05 6.1E-05 (a) To convert to rem/mg, multiply by specific activity of 6.25E+03 nCi/mg.

PNNL-MA-860 Chapter 7.0 Issued: September 30, 2000 Page 7.26
Table 7.15. Dose Coefficients for Recycled Uranium Constituents
Instant Class D Inhalation Class W Inhalation Class Y Inhalation Uptake 1-µm 5-µm 1-µm 5-µm 1-µm 5-µm Mixture Committed Effective Dose Coefficients U-only (rem/nCi-U) 5.9E-03 2.9E-03 3.2E-03 7.6E-03 3.2E-03 1.3E-01 4.5E-02 Impurities Pu-alpha (rem/nCi-U)(a) 1.7E-03 2.1E-04 2.2E-04 2.1E-04 2.2E-04 1.5E-04 6.2E-05 237Np (rem/nCi-U)(b) 2.0E-03 2.4E-04 2.6E-04 2.4E-04 2.6E-04 1.5E-04 6.6E-05 232Th (rem/nCi-U)(c) 7.7E-05 8.8E-06 9.9E-06 8.8E-06 9.9E-06 6.6E-06 2.8E-06 99Tc (rem/nCi-U)(c) 5.3E-07 3.5E-07 4.8E-07 1.9E-06 1.0E-06 1.9E-06 1.0E-06 106Ru (rem/nCi-U)(c) 4.8E-06 2.6E-06 3.0E-06 5.3E-06 2.9E-06 2.1E-05 8.4E-06 95ZrNb (rem/nCi-U)(c) 1.0E-06 5.1E-07 5.9E-07 3.3E-07 2.6E-07 4.8E-07 2.4E-07 RU-Total (rem/nCi-U) 9.6E-03 3.3E-03 3.7E-03 8.1E-03 3.7E-03 1.3E-01 4.5E-02 Ratio of RU-total:U-only 1.64 1.16 1.16 1.06 1.15 1.00 1.00 RU-Total (rem/mg-U) 8.7E-03 3.0E-03 3.3E-03 7.3E-03 3.4E-03 1.2E-01 4.1E-02 Committed Bone Surface Dose Coefficients U-only (rem/nCi-U) 8.1E-02 3.8E-02 4.3E-02 1.1E-02 1.2E-02 4.0E-03 2.1E-03 Impurities Pu-alpha (rem/nCi-U) (a) 3.1E-02 3.7E-03 4.3E-03 3.7E-03 4.3E-03 1.5E-03 7.9E-04 237Np (rem/nCi-U) (b) 4.4E-02 5.3E-03 5.7E-03 5.3E-03 5.7E-03 2.1E-03 1.1E-03 232Th (rem/nCi-U)(c) 1.9E-03 2.3E-04 2.5E-04 2.3E-04 2.5E-04 9.9E-05 4.8E-05 99Tc (rem/nCi-U) (c) 7.5E-08 4.6E-08 6.4E-08 4.0E-08 5.7E-08 4.0E-08 5.7E-08 106Ru (nCi/nCi-U)(c) 5.3E-06 2.6E-06 3.0E-06 7.5E-07 9.2E-07 2.9E-07 3.3E-07 95ZrNb (nCi/nCi-U)(c) 1.8E-05 8.6E-06 9.7E-06 1.8E-06 2.2E-06 1.9E-07 2.2E-07 RU-Total (rem/nCi-U) 1.6E-01 4.8E-02 5.4E-02 2.0E-02 2.2E-02 7.7E-03 4.0E-03 Ratio of RU-total:U-only 1.96 1.24 1.24 1.88 1.88 1.92 1.90 RU-Total (rem/mg-U) 1.4E-01 4.3E-02 4.9E-02 1.8E-02 2.0E-02 7.0E-03 3.7E-03 Committed Lung Dose Coefficients U-only (rem/nCi-U) NA 1.1E-03 4.7E-04 5.6E-02 2.0E-02 1.1E+00 3.7E-01 Impurities Pu-alpha (rem/nCi-U)(a) insig. 2.8E-05 1.0E-05 2.8E-05 1.0E-05 5.3E-04 1.8E-04 237Np (rem/nCi-U)(b) insig. 2.6E-05 9.2E-06 2.6E-05 9.2E-06 4.8E-04 1.7E-04 232Th (rem/nCi-U)(c) insig. 2.9E-07 1.2E-07 2.9E-07 1.2E-07 1.9E-05 6.6E-06 99Tc (rem/nCi-U)(c) insig. 2.9E-07 1.4E-07 1.3E-05 4.8E-06 1.3E-05 4.8E-06 106Ru (nCi/nCi-U)(c) insig. 2.9E-06 2.8E-06 3.3E-05 1.2E-05 1.7E-04 5.7E-05 95ZrNb (nCi/nCi-U)(c) insig. 1.8E-07 1.7E-07 1.5E-06 5.5E-07 3.3E-06 1.2E-06 RU-Total (rem/nCi-U) insig. 1.2E-03 4.9E-04 5.6E-02 2.0E-02 1.1E+00 3.7E-01 Ratio of RU-total:U-only insig. 1.05 1.05 1.00 1.00 1.00 1.00 RU-Total (rem/mg-U) insig. 1.1E-03 4.4E-04 5.1E-02 1.8E-02 9.6E-01 3.4E-01 (a) Based on 20-year aged weapons grade plutonium (see Table 8.14). (b) Table 10.5 class W values used for class D and W. Class Y calculated from CINDY. (c) Based on closest, most soluble class. Calculated using CINDY. No allowance for decay.

Issued: September 30, 2000
PN
NL-M
A-860 C
hapter 7.0
Page 7.27
Table 7.16. Committed Dose Coefficients for Acute Intakes of Uranium Mixtures (rem/mg-U)
Class D Inhalation Class W Inhalation Class Y Inhalation Ingestion
Instantaneous Uptake 1-µm 5-µm 1-µm 5-µm 1-µm 5-µm f1=0.02 f1=0.002
Natural Uranium Effective 4.1E-03 2.0E-03 2.2E-03 5.3E-03 2.3E-03 8.8E-02 3.1E-02 9.2E-05 1.8E-05 Bone Surface 5.6E-02 2.7E-02 3.0E-02 7.4E-03 8.1E-03 8.8E-02 1.5E-03 1.1E-03 1.1E-04 Lung insig. 7.8E-04 3.3E-04 3.9E-02 1.4E-02 7.3E-01 2.6E-01 insig. insig.
Depleted Uranium Effective 2.1E-03 1.0E-03 1.1E-03 2.6E-03 1.1E-03 4.5E-02 1.6E-02 4.5E-05 9.4E-06 Bone Surface 2.9E-02 1.4E-02 1.5E-02 3.7E-03 4.1E-03 4.5E-02 7.5E-04 5.6E-04 5.6E-05 Lung insig. 3.8E-04 1.6E-04 2.0E-02 6.8E-03 3.7E-01 1.3E-01 insig. insig.
Recycled Uranium (U-Only) Effective 5.3E-03 2.6E-03 2.9E-03 6.9E-03 3.0E-03 1.1E-01 4.1E-02 1.2E-04 2.4E-05 Bone Surface 7.3E-02 3.5E-02 3.9E-02 9.6E-03 1.1E-02 3.7E-03 1.9E-03 1.5E-03 1.5E-04 Lung insig. 1.0E-03 4.2E-04 5.1E-02 1.8E-02 9.6E-01 3.4E-01 insig. insig.
Recycled Uranium (U+Impurities) Effective 8.7E-03 3.0E-03 3.3E-03 7.3E-03 3.4E-03 1.2E-01 4.1E-02 1.2E-04 2.5E-05 Bone Surface 1.4E-01 4.3E-02 4.9E-02 1.8E-02 2.0E-02 7.0E-03 3.7E-03 1.5E-03 1.7E-04 Lung insig. 1.1E-03 4.4E-04 5.1E-02 1.8E-02 9.6E-01 3.4E-01 insig. insig.

PNNL-MA-860 Chapter 7.0 Issued: September 30, 2000 Page 7.28
7.3.3 Comparison of Published Dosimetry Factors A comparison of dosimetry factors, including committed effective dose coefficients, annual limits on intake (ALIs), and derived air concentrations (DACs) published in several sources is shown in Table 7.17.
7.3.4 Derived Reference Levels Hanford reference and derived reference levels have been tabulated for recycled uranium. Screening and investigation levels have been calculated based on committed effective dose equivalents of 10-mrem and 100-mrem, respectively. A dose compliance level has been calculated based on 50-rem to the bone surfaces for class D inhalations and based on 5-rem committed effective dose equivalent for class W and Y intakes. The chemical toxicity threshold was calculated based on a peak kidney concentration of 1.1 µg-U/g-kidney, giving a total kidney burden of 341-µg and applying the most limiting kidney retention fraction. Reference level inhalation intakes are tabulated for 1-µm and 5-µm particle sizes for class D, W, and Y inhalations of recycled uranium in Tables 7.18, 7.19, and 7.20, respectively, and in Table 7.21 for ingestion intakes. The derived urine excretion levels shown in Table 7.18 through 7.21 represent the excess urinary excretion associated with the indicated intake above the natural background. To account for the anticipated natural uranium background at Hanford, 0.021 µg/d (rounding to 0.02 is appropriate) should be added to the tabulated values. Chest-count-derived reference levels for class W and Y intakes, based on recycled uranium, are shown in Tables 7.22 and 7.23 for 234Th (assumed to be in equilibrium with 238U), and in Tables 7.24 and 7.25 for 235U.
7.4 Bioassay Monitoring Bioassay monitoring procedures for uranium include excreta analysis and in vivo measurements. Urinalysis is an indicator of systemically deposited uranium; fecal analysis provides an indication of the amount of uranium that is being cleared from the lung; and in vivo counting provides a direct measurement of the quantity of uranium in the lung. The following sections discuss urine sampling, in vivo measurement, fecal excretion, the routine bioassay monitoring program, and special bioassay measurements following a potential acute intake.

Issued: September 30, 2000
PN
NL-M
A-860 C
hapter 7.0
Page 7.29
Table 7.17. Comparison of Selected Published Dosimetry Factors for 238U
Reference Class D Inhalation Class W Inhalation Class Y Inhalation Effective Dose Coefficients
CINDY [he,50] 2.7E-03 rem/nCi (1-µm) 3.0E-03 rem/nCi (5-µm)
7.0E-03 rem/nCi (1-µm) 3.0E-03 rem/nCi (5-µm)
1.2E-01 rem/nCi (1-µm) 4.2E-02 rem/nCi (5-µm)
ICRP 54 (1988) [he,50]
6.4E-07 Sv/Bq (1-µm) (2.4E-03 rem/nCi)
1.7E-06 Sv/Bq (1-µm) (6.3E-03 rem/nCi)
3.2E-05 Sv/Bq (1-µm) (1.2E-01 rem/nCi)
EPA Federal Guidance Report No. 11 [he,50]
6.62E-07 Sv/Bq (1-µm Class W) (2.4E-03 rem/nCi)
1.4E-06 Sv/Bq (1-µm) (5.2E-03 rem/nCi)
3.20E-05 Sv/Bq (1-µm) (1.18E-01 rem/nCi)
ICRP 68 (1994) [e(50)]
4.9E-07 Sv/Bq (1-µm Type F) (1.8E-03 rem/nCi) 5.8E-07 Sv/Bq (5-um Type F) (2.1E-03 rem/nCi)
2.6E-06 Sv/Bq (1-µm Type M) (9.6E-03 rem/nCi) 1.6E-06 Sv/Bq (5-µm Type M) (5.9E-03 rem/nCi)
7.3E-06 Sv/Bq (1-µm Type S) (2.7E-02 rem/nCi) 5.7E-06 Sv/Bq (5-µm Type S) (2.1E-02 rem/nCi)
Derived Air Concentration (Based on bone surface dose limit) (Based on stochastic limit) (Based on stochastic limit)
10 CFR 835 Appendix A 6E-10 µCi/ml 2E+01 Bq/m3
3E-10 µCi/ml 1E+01 Bq/m3
2E-11 µCi/ml 6E-01 Bq/m3
EPA Federal Guidance Report No. 11
6E-10 µCi/ml 2E-05 MBq/m3
3E-10 µCi/ml 1E-05 MBq/m3
2E-11 µCi/ml 7E-07 MBq/m3
ICRP 54 2E+01 Bq/m3 1E+01 Bq/m3 7E-01 Bq/m3 Annual Limit on Intake (Based on bone surface dose) (Based on stochastic limit) (Based on stochastic limit) ICRP 54 5E+04 Bq 3E+04 Bq 2E+03 Bq EPA Federal Guidance Report No. 11
0.05 MBq 1 µCi
0.03 MBq 0.8 µCi
0.002 MBq 0.04 µCi

PNN
L-MA-860 Chapter 7.0
Issued: Septem
ber 30, 2000 Page 7.30
Table 7.18. Urine Excretion(a) Reference Levels and Derived Reference Levels for Cla ss D Inhalation of Recycled Uranium
10-mrem HE,50 Screening Level
100-mrem HE,50
Investigation Level 50-rem HT,50
Compliance Level Chemical Toxicity Threshold Level
1-µm 5-µm 1-µm 5-µm 1-µm 5-µm 1-µm(b) 5-µm(c) Inhalation
Intake (mg)
3.3E+00 3.0E+00 3.3E+01 3.0E+01 1.2E+03 1.0E+03 7.6E+00 6.4E+00 Derived Screening
Level (µg/d) Derived Investigation
Level (µg/d) Derived Compliance
Level (µg/d) Derived Toxicity
Level (µg/d) Days Post
Intake 1-µm 5-µm 1-µm 5-µm 1-µm 5-µm 1-µm 5-µm
1 3.3E+02 2.5E+02 3.3E+03 2.5E+03 1.2E+05 8.6E+04 7.6E+02 5.4E+02 2 1.4E+02 8.5E+01 1.4E+03 8.5E+02 4.8E+04 2.9E+04 3.1E+02 1.8E+02 5 4.0E+01 3.6E+01 4.0E+02 3.6E+02 1.4E+04 1.2E+04 9.1E+01 7.7E+01 7 3.1E+01 3.0E+01 3.1E+02 3.0E+02 1.1E+04 1.0E+04 7.1E+01 6.4E+01
14 1.7E+01 1.7E+01 1.7E+02 1.7E+02 5.8E+03 5.6E+03 3.8E+01 3.5E+01 30 5.7E+00 5.8E+00 5.7E+01 5.8E+01 2.0E+03 1.9E+03 1.3E+01 1.2E+01 60 1.5E+00 1.5E+00 1.5E+01 1.5E+01 5.1E+02 5.1E+02 3.3E+00 3.2E+00 90 5.0E-01 5.2E-01 5.0E+00 5.2E+00 1.7E+02 1.7E+02 1.1E+00 1.1E+00
180 2.8E-02 2.8E-02 2.8E-01 2.8E-01 9.8E+00 9.6E+00 6.4E-02 6.0E-02 365 5.7E-03 5.8E-03 5.7E-02 5.8E-02 2.0E+00 1.9E+00 1.3E-02 1.2E-02 730 5.0E-03 5.2E-03 5.0E-02 5.2E-02 1.7E+00 1.7E+00 1.1E-02 1.1E-02
1825 4.3E-03 4.5E-03 4.3E-02 4.5E-02 1.5E+00 1.5E+00 9.9E-03 9.6E-03 3650 3.2E-03 3.3E-03 3.2E-02 3.3E-02 1.1E+00 1.1E+00 7.4E-03 7.0E-03 7300 1.9E-03 1.9E-03 1.9E-02 1.9E-02 6.5E-01 6.5E-01 4.3E-03 4.1E-03
18250 4.0E-04 4.2E-04 4.0E-03 4.2E-03 1.4E-01 1.4E-01 9.1E-04 9.0E-04 (a) Excess excretion above background. (b) Based on maximum kidney burden of 1.1 µg-U/g-kidneys at 2 days post intake (Rt = 0.045). (c) Based on maximum kidney burden of 1.1 µg-U/g-kidneys at 2 days post intake (Rt = 0.053).

Issued: September 30, 2000
PN
NL-M
A-860 C
hapter 7.0
Page 7.31
Table 7.19. Urine Excretion(a) Reference Levels and Derived Reference Levels for Class W Inhalation of Recycled Uranium
10-mrem HE,50 Screening Level
100-mrem HE,50
Investigation Level 50-rem HE,50
Compliance Level Chemical Toxicity Threshold Level
1-µm 5-µm 1-µm 5-µm 1-µm 5-µm 1-µm(b) 5-µm(c) Inhalation
Intake (mg)
1.4E+00 2.9E+00 1.4E+01 2.9E+01 6.8E+02 1.5E+03 4.4E+01 2.6E+01 Derived Screening
Level (µg/d) Derived Investigation
Level (µg/d) Derived Compliance
Level (µg/d) Derived Toxicity
Level (µg/d) Days Post
Intake 1-µm 5-µm 1-µm 5-µm 1-µm 5-µm 1-µm 5-µm
1 1.6E+01 5.9E+01 1.6E+02 5.9E+02 8.2E+03 2.9E+04 5.3E+02 5.2E+02 2 5.3E+00 1.8E+01 5.3E+01 1.8E+02 2.7E+03 8.8E+03 1.7E+02 1.6E+02 5 2.9E+00 8.8E+00 2.9E+01 8.8E+01 1.4E+03 4.4E+03 9.2E+01 7.8E+01 7 2.5E+00 7.4E+00 2.5E+01 7.4E+01 1.2E+03 3.7E+03 7.9E+01 6.5E+01
14 1.6E+00 4.1E+00 1.6E+01 4.1E+01 8.2E+02 2.1E+03 5.3E+01 3.6E+01 30 8.9E-01 1.7E+00 8.9E+00 1.7E+01 4.5E+02 8.4E+02 2.9E+01 1.5E+01 60 5.2E-01 6.8E-01 5.2E+00 6.8E+00 2.6E+02 3.4E+02 1.7E+01 6.0E+00 90 3.6E-01 3.5E-01 3.6E+00 3.5E+00 1.8E+02 1.8E+02 1.1E+01 3.1E+00 180 1.2E-01 1.0E-01 1.2E+00 1.0E+00 6.2E+01 5.0E+01 4.0E+00 8.8E-01 365 1.5E-02 1.2E-02 1.5E-01 1.2E-01 7.5E+00 6.0E+00 4.8E-01 1.1E-01 730 7.3E-04 1.5E-03 7.3E-03 1.5E-02 3.6E-01 7.5E-01 2.3E-02 1.3E-02
1825 4.8E-04 1.2E-03 4.8E-03 1.2E-02 2.4E-01 5.9E-01 1.5E-02 1.0E-02 3650 3.7E-04 8.8E-04 3.7E-03 8.8E-03 1.8E-01 4.4E-01 1.2E-02 7.8E-03 7300 2.1E-04 5.0E-04 2.1E-03 5.0E-03 1.0E-01 2.5E-01 6.6E-03 4.4E-03 18250 4.5E-05 1.1E-04 4.5E-04 1.1E-03 2.3E-02 5.4E-02 1.5E-03 9.6E-04
(a) Excess excretion above background. (b) Based on maximum kidney burden of 1.1 µg-U/g-kidneys at 2 days post intake (Rt = 0.0078). (c) Based on maximum kidney burden of 1.1 µg-U/g-kidneys at 2 days post intake (Rt = 0.013).

PNN
L-MA-860 Chapter 7.0
Issued: Septem
ber 30, 2000 Page 7.32
Table 7.20. Urine Excretion(a) Reference Levels and Derived Reference Levels for Class Y Inhalation of Recycled Uranium
10-mrem HE,50 Screening Level
100-mrem HE,50
Investigation Level 5-rem HE,50
Compliance Level Chemical Toxicity Threshold Level
1-µm 5-µm 1-µm 5-µm 1-µm 5-µm 1-µm(b) 5-µm(c) Inhalation
Intake (mg)
8.3E-02 2.4E-01 8.3E-01 2.4E+00 4.2E+01 1.2E+02 7.3E+02 3.5E+02 Derived Screening
Level (µg/d) Derived Investigation
Level (µg/d) Derived Compliance
Level (µg/d) Derived Toxicity
Level (µg/d) Days Post
Intake 1-µm 5-µm 1-µm 5-µm 1-µm 5-µm 1-µm 5-µm
1 6.7E-02 3.9E-01 6.7E-01 3.9E+00 3.3E+01 2.0E+02 5.8E+02 5.6E+02 2 2.3E-02 1.2E-01 2.3E-01 1.2E+00 1.1E+01 6.1E+01 2.0E+02 1.7E+02 5 1.0E-02 5.6E-02 1.0E-01 5.6E-01 5.0E+00 2.8E+01 8.7E+01 8.0E+01 7 8.3E-03 4.6E-02 8.3E-02 4.6E-01 4.2E+00 2.3E+01 7.3E+01 6.6E+01
14 5.3E-03 2.7E-02 5.3E-02 2.7E-01 2.6E+00 1.3E+01 4.6E+01 3.8E+01 30 2.7E-03 9.5E-03 2.7E-02 9.5E-02 1.3E+00 4.8E+00 2.3E+01 1.4E+01 60 1.8E-03 3.7E-03 1.8E-02 3.7E-02 8.8E-01 1.8E+00 1.5E+01 5.2E+00 90 1.6E-03 2.3E-03 1.6E-02 2.3E-02 7.9E-01 1.1E+00 1.4E+01 3.2E+00
180 1.5E-03 1.6E-03 1.5E-02 1.6E-02 7.5E-01 7.9E-01 1.3E+01 2.3E+00 365 1.5E-03 1.6E-03 1.5E-02 1.6E-02 7.5E-01 7.9E-01 1.3E+01 2.3E+00 730 1.4E-03 1.5E-03 1.4E-02 1.5E-02 7.1E-01 7.4E-01 1.2E+01 2.1E+00
1825 9.2E-04 9.3E-04 9.2E-03 9.3E-03 4.6E-01 4.6E-01 8.0E+00 1.3E+00 3650 3.1E-04 3.2E-04 3.1E-03 3.2E-03 1.5E-01 1.6E-01 2.7E+00 4.5E-01 7300 3.1E-05 3.4E-05 3.1E-04 3.4E-04 1.5E-02 1.7E-02 2.7E-01 4.9E-02
18250 1.4E-06 2.0E-06 1.4E-05 2.0E-05 7.1E-04 9.8E-04 1.2E-02 2.8E-03 (a) Excess excretion above background. (b) Based on maximum kidney burden of 1.1 µg-U/g-kidneys at 2 days post intake (Rt = 4.7E-04). (c) Based on maximum kidney burden of 1.1 µg-U/g-kidneys at 2 days post intake (Rt = 9.8E-04).

Issued: September 30, 2000
PN
NL-M
A-860 C
hapter 7.0
Page 7.33
Table 7.21. Urine Excretion(a) Reference Levels and Derived Reference Levels for Ingestion of Recycled Uranium
Compliance Level
10-mrem HE,50 Screening Level
100-mrem HE,50
Investigation Level 50-rem
HT,50 5-rem HE.50
Chemical Toxicity Threshold Level
Soluble Insoluble Soluble Insoluble Soluble Insoluble Soluble (b) Insoluble (c)
Inhalation Intake (mg)
8.3E+01 4.0E+02 8.3E+02 4.0E+03 3.3E+04 2.0E+05 1.7E+02 1.7E+03 Derived Screening
Level (µg/d) Derived Investigation
Level (µg/d) Derived Compliance
Level (µg/d) Derived Toxicity
Level (µg/d) Days Post Intake
Soluble Insoluble Soluble Insoluble Soluble Insoluble Soluble Insoluble 1 3.6E+02 1.7E+02 3.6E+03 1.7E+03 1.4E+05 8.6E+04 7.3E+02 7.3E+02 2 7.0E+01 3.4E+01 7.0E+02 3.4E+02 2.8E+04 1.7E+04 1.4E+02 1.4E+02 5 3.8E+01 1.8E+01 3.8E+02 1.8E+02 1.5E+04 9.0E+03 7.7E+01 7.7E+01 7 3.1E+01 1.5E+01 3.1E+02 1.5E+02 1.2E+04 7.6E+03 6.3E+01 6.5E+01
14 1.7E+01 8.0E+00 1.7E+02 8.0E+01 6.7E+03 4.0E+03 3.4E+01 3.4E+01 30 5.8E+00 2.8E+00 5.8E+01 2.8E+01 2.3E+03 1.4E+03 1.2E+01 1.2E+01 60 1.5E+00 7.2E-01 1.5E+01 7.2E+00 6.0E+02 3.6E+02 3.1E+00 3.1E+00 90 5.3E-01 2.5E-01 5.3E+00 2.5E+00 2.1E+02 1.3E+02 1.1E+00 1.1E+00 180 2.9E-02 1.4E-02 2.9E-01 1.4E-01 1.2E+01 7.0E+00 6.0E-02 6.0E-02 365 5.8E-03 2.8E-03 5.8E-02 2.8E-02 2.3E+00 1.4E+00 1.2E-02 1.2E-02 730 5.3E-03 2.6E-03 5.3E-02 2.6E-02 2.1E+00 1.3E+00 1.1E-02 1.1E-02
1825 4.5E-03 2.2E-03 4.5E-02 2.2E-02 1.8E+00 1.1E+00 9.2E-03 9.2E-03 3650 3.3E-03 1.6E-03 3.3E-02 1.6E-02 1.3E+00 8.0E-01 6.8E-03 6.8E-03 7300 2.0E-03 9.6E-04 2.0E-02 9.6E-03 8.0E-01 4.8E-01 4.1E-03 4.1E-03 18250 4.3E-04 2.0E-04 4.3E-03 2.0E-03 1.7E-01 1.0E-01 8.7E-04 8.7E-04
(a) Excess excretion above background. (b) Based on maximum kidney burden of 1.1 µg-U/g-kidneys at 2 days post intake (Rt = 2.0E-04). (c) Based on maximum kidney burden of 1.1 µg-U/g-kidneys at 2 days post intake (Rt = 2.0E-03).

PNN
L-MA-860 Chapter 7.0
Issued: Septem
ber 30, 2000 Page 7.34
Table 7.22. Chest Count Reference Levels and 234Th(a) Derived Reference Levels for Class W Inhalation of Recycled Uranium
10-mrem HE,50 Screening Level
100-mrem HE,50
Investigation Level 5-rem HE,50
Compliance Level Chemical Toxicity Threshold Level
1-µm 5-µm 1-µm 5-µm 1-µm 5-µm 1-µm(c) 5-µm(d)
Inhalation Intake
nCi 238U(b) 4.6E-01 9.8E-01 4.6E+00 9.8E+00 2.3E+02 4.9E+02 1.5E+01 8.6E+00 Derived Screening Level (nCi 234Th)
Derived Investigation Level (nCi 234Th)
Derived Compliance Level (nCi 234Th)
Derived Toxicity Level (nCi 234Th)
Days Post Intake
1-µm 5-µm 1-µm 5-µm 1-µm 5-µm 1-µm 5-µm 1 9.6E-02 7.3E-02 9.6E-01 7.3E-01 4.8E+01 3.7E+01 3.1E+00 6.5E-01 2 8.2E-02 6.2E-02 8.2E-01 6.2E-01 4.1E+01 3.1E+01 2.6E+00 5.4E-01 5 6.8E-02 5.0E-02 6.8E-01 5.0E-01 3.4E+01 2.5E+01 2.2E+00 4.4E-01 7 6.4E-02 4.8E-02 6.4E-01 4.8E-01 3.2E+01 2.4E+01 2.0E+00 4.2E-01
14 5.9E-02 4.3E-02 5.9E-01 4.3E-01 3.0E+01 2.2E+01 1.9E+00 3.8E-01 30 4.6E-02 3.5E-02 4.6E-01 3.5E-01 2.3E+01 1.8E+01 1.5E+00 3.1E-01 60 3.2E-02 2.4E-02 3.2E-01 2.4E-01 1.6E+01 1.2E+01 1.0E+00 2.2E-01 90 2.2E-02 1.7E-02 2.2E-01 1.7E-01 1.1E+01 8.3E+00 7.0E-01 1.5E-01
180 6.8E-03 5.2E-03 6.8E-02 5.2E-02 3.4E+00 2.6E+00 2.2E-01 4.6E-02 365 6.4E-04 4.7E-04 6.4E-03 4.7E-03 3.2E-01 2.3E-01 2.0E-02 4.1E-03 730 insig. insig. insig. insig. insig. insig. insig. insig.
(a) Assumes secular equilibrium with 238U. (b) Based on 0.3325 nCi 238U/mg-RU. (c) Based on maximum kidney burden of 1.1 µg-U/g-kidneys at 2 days post intake (Rt = 0.0078). (d) Based on maximum kidney burden of 1.1 µg-U/g-kidneys at 2 days post intake (Rt = 0.013).

Issued: September 30, 2000
PN
NL-M
A-860 C
hapter 7.0
Page 7.35
Table 7.23. Chest Count Reference Levels and 234Th(a) Derived Reference Levels for Class Y Inhalation of Recycled Uranium
10-mrem HE,50 Screening Level
100-mrem HE,50
Investigation Level 5-rem HE,50
Compliance Level Chemical Toxicity Threshold Level
1-µm 5-µm 1-µm 5-µm 1-µm 5-µm 1-µm(c) 5-µm(d)
Inhalation Intake
nCi 238U(b) 2.8E-02 8.1E-02 2.8E-01 8.1E-01 1.4E+01 4.1E+01 2.4E+02 1.2E+02 Derived Screening Level (nCi 234Th)
Derived Investigation Level (nCi 234Th)
Derived Compliance Level (nCi 234Th)
Derived Toxicity Level (nCi 234Th)
Days Post Intake
1-µm 5-µm 1-µm 5-µm 1-µm 5-µm 1-µm 5-µm 1 5.8E-03 6.2E-03 5.8E-02 6.2E-02 2.9E+00 3.1E+00 5.1E+01 8.9E+00 2 5.0E-03 5.2E-03 5.0E-02 5.2E-02 2.5E+00 2.6E+00 4.3E+01 7.4E+00 5 4.2E-03 4.4E-03 4.2E-02 4.4E-02 2.1E+00 2.2E+00 3.6E+01 6.2E+00 7 4.2E-03 4.3E-03 4.2E-02 4.3E-02 2.1E+00 2.1E+00 3.6E+01 6.1E+00
14 4.2E-03 4.2E-03 4.2E-02 4.2E-02 2.1E+00 2.1E+00 3.6E+01 6.0E+00 30 4.2E-03 4.1E-03 4.2E-02 4.1E-02 2.1E+00 2.1E+00 3.6E+01 5.9E+00 60 3.9E-03 4.1E-03 3.9E-02 4.1E-02 1.9E+00 2.0E+00 3.4E+01 5.8E+00 90 3.9E-03 3.9E-03 3.9E-02 3.9E-02 1.9E+00 1.9E+00 3.4E+01 5.6E+00
180 3.3E-03 3.6E-03 3.3E-02 3.6E-02 1.7E+00 1.8E+00 2.9E+01 5.1E+00 365 2.8E-03 2.9E-03 2.8E-02 2.9E-02 1.4E+00 1.5E+00 2.4E+01 4.2E+00 730 2.0E-03 2.1E-03 2.0E-02 2.1E-02 1.0E+00 1.1E+00 1.8E+01 3.0E+00
1825 8.0E-04 8.1E-04 8.0E-03 8.1E-03 4.0E-01 4.1E-01 7.0E+00 1.2E+00 3650 2.7E-04 2.8E-04 2.7E-03 2.8E-03 1.4E-01 1.4E-01 2.4E+00 4.0E-01 7300 1.2E-04 1.2E-04 1.2E-03 1.2E-03 5.8E-02 6.1E-02 1.0E+00 1.7E-01
18250 1.1E-04 1.1E-04 1.1E-03 1.1E-03 5.3E-02 5.3E-02 9.2E-01 1.5E-01 (a) Assumed secular equilibrium with 238U. (b) Based on 0.3325 nCi 238U/mg-RU. (c) Based on maximum kidney burden of 1.1 µg-U/g-kidneys at 2 days post intake (Rt = 4.7E-04). (d) Based on maximum kidney burden of 1.1 µg-U/g-kidneys at 2 days post intake (Rt = 9.8E-04).

PNN
L-MA-860 Chapter 7.0
Issued: Septem
ber 30, 2000 Page 7.36
Table 7.24. Chest Count Reference Levels and 235U Derived Reference Levels for Class W Inhalation of Recycled Uranium
10-mrem HE,50 Screening Level
100-mrem HE,50
Investigation Level 5-rem HE,50
Compliance Level Chemical Toxicity Threshold Level
1-µm 5-µm 1-µm 5-µm 1-µm 5-µm 1-µm(b) 5-µm(c)
Inhalation Intake
nCi 235U(a) 2.9E-02 6.2E-02 2.9E-01 6.2E-01 1.4E+01 3.1E+01 9.2E-01 5.5E-01 Derived Screening
Level (nCi 235U) Derived Investigation
Level (nCi 235U) Derived Compliance
Level (nCi 235U) Derived Toxicity Level (nCi 235U)
Days Post Intake
1-µm 5-µm 1-µm 5-µm 1-µm 5-µm 1-µm 5-µm 1 6.0E-03 4.6E-03 6.0E-02 4.6E-02 3.0E+00 2.3E+00 1.9E-01 4.1E-02 2 5.2E-03 3.9E-03 5.2E-02 3.9E-02 2.6E+00 1.9E+00 1.7E-01 3.4E-02 5 4.3E-03 3.2E-03 4.3E-02 3.2E-02 2.2E+00 1.6E+00 1.4E-01 2.8E-02 7 4.0E-03 3.0E-03 4.0E-02 3.0E-02 2.0E+00 1.5E+00 1.3E-01 2.7E-02
14 3.7E-03 2.7E-03 3.7E-02 2.7E-02 1.9E+00 1.4E+00 1.2E-01 2.4E-02 30 2.9E-03 2.2E-03 2.9E-02 2.2E-02 1.4E+00 1.1E+00 9.2E-02 2.0E-02 60 2.0E-03 1.5E-03 2.0E-02 1.5E-02 1.0E+00 7.7E-01 6.5E-02 1.4E-02 90 1.4E-03 1.1E-03 1.4E-02 1.1E-02 6.9E-01 5.3E-01 4.4E-02 9.3E-03
180 4.3E-04 3.3E-04 4.3E-03 3.3E-03 2.2E-01 1.6E-01 1.4E-02 2.9E-03 365 4.0E-05 3.0E-05 4.0E-04 3.0E-04 2.0E-02 1.5E-02 1.3E-03 2.6E-04 730 insig. insig. insig. insig. insig. insig. insig. insig.
(a) Based on 0.021 nCi 235U/mg-RU. (b) Based on maximum kidney burden of 1.1 µg-U/g-kidneys at 2 days post intake (Rt = 0.0078). (c) Based on maximum kidney burden of 1.1 µg-U/g-kidneys at 2 days post intake (Rt = 0.013).

Issued: September 30, 2000
PN
NL-M
A-860 C
hapter 7.0
Page 7.37
Table 7.25. Chest Count Reference Levels and 235U Derived Reference Levels for Class Y Inhalation of Recycled Uranium
10-mrem HE,50 Screening Level
100-mrem HE,50
Investigation Level 5-rem HE,50
Compliance Level Chemical Toxicity Threshold Level
1-µm 5-µm 1-µm 5-µm 1-µm 5-µm 1-µm(b) 5-µm(c)
Inhalation Intake
nCi 235U(a) 1.8E-03 5.1E-03 1.8E-02 5.1E-02 8.8E-01 2.6E+00 1.5E+01 7.3E+00 Derived Screening
Level (nCi 235U) Derived Investigation
Level (nCi 235U) Derived Compliance
Level (nCi 235U) Derived Toxicity Level (nCi 235U)
Days Post Intake
1-µm 5-µm 1-µm 5-µm 1-µm 5-µm 1-µm 5-µm 1 3.7E-04 3.9E-04 3.7E-03 3.9E-03 1.8E-01 2.0E-01 3.2E+00 5.6E-01 2 3.2E-04 3.3E-04 3.2E-03 3.3E-03 1.6E-01 1.6E-01 2.7E+00 4.7E-01 5 2.6E-04 2.8E-04 2.6E-03 2.8E-03 1.3E-01 1.4E-01 2.3E+00 3.9E-01 7 2.6E-04 2.7E-04 2.6E-03 2.7E-03 1.3E-01 1.4E-01 2.3E+00 3.9E-01
14 2.6E-04 2.7E-04 2.6E-03 2.7E-03 1.3E-01 1.3E-01 2.3E+00 3.8E-01 30 2.6E-04 2.6E-04 2.6E-03 2.6E-03 1.3E-01 1.3E-01 2.3E+00 3.7E-01 60 2.5E-04 2.6E-04 2.5E-03 2.6E-03 1.2E-01 1.3E-01 2.1E+00 3.7E-01 90 2.5E-04 2.5E-04 2.5E-03 2.5E-03 1.2E-01 1.2E-01 2.1E+00 3.5E-01
180 2.1E-04 2.3E-04 2.1E-03 2.3E-03 1.1E-01 1.1E-01 1.8E+00 3.2E-01 365 1.8E-04 1.8E-04 1.8E-03 1.8E-03 8.8E-02 9.2E-02 1.5E+00 2.6E-01 730 1.3E-04 1.3E-04 1.3E-03 1.3E-03 6.4E-02 6.7E-02 1.1E+00 1.9E-01
1825 5.1E-05 5.1E-05 5.1E-04 5.1E-04 2.5E-02 2.6E-02 4.4E-01 7.3E-02 3650 1.7E-05 1.8E-05 1.7E-04 1.8E-04 8.7E-03 9.0E-03 1.5E-01 2.6E-02 7300 7.4E-06 7.7E-06 7.4E-05 7.7E-05 3.7E-03 3.8E-03 6.4E-02 1.1E-02
18250 6.7E-06 6.7E-06 6.7E-05 6.7E-05 3.3E-03 3.3E-03 5.8E-02 9.5E-03
(a) Based on 0.021 nCi 235U/mg-RU. (b) Based on maximum kidney burden of 1.1 µg-U/g-kidneys at 2 days post intake (Rt = 4.7E-04). (c) Based on maximum kidney burden of 1.1 µg-U/g-kidneys at 2 days post intake (Rt = 9.8E-04).

PNNL-MA-860 Chapter 7.0 Issued: September 30, 2000 Page 7.38
7.4.1 Urine Sampling and Analysis The interpretation of urinalysis measurements is highly dependent on knowledge of the time and duration of the intake and on assumptions regarding the biokinetic transport and excretion of systemically absorbed uranium. Standard biokinetic models provide estimated uranium excretion rates in terms of daily output (i.e., micrograms per day). The influence of diurnal variations in urination frequency and volume may be lessened if a full 24-hour collection is obtained rather than a single grab sample. According to ICRP 30, studies of the metabolism of uranium in man show that a significant amount of uranium entering the circulatory system (54%) is not deposited in body tissue but instead passes directly to excretion. The excretion of this unabsorbed fraction can result in highly variable urinary levels under conditions of ongoing repeated or chronic exposure as depicted in Figure 7.6. Because of the possible large time variability in uranium excretion rates due to this unabsorbed fraction, quantitative interpretation of bioassay data is best accomplished by either collecting all of the unabsorbed fraction (i.e., that voided during the first several days after exposure) or by collecting samples after the unabsorbed fraction has been eliminated. For routine sampling of potentially chronically exposed workers, it is desirable to collect the urine sample several
Figure 7.6. Daily Variability in Instantaneous Urinary Excretion from Chronic Inhalation of 1 mg/workday of Class D Uranium (Curve shown is for 52nd week of exposure.)

Issued: September 30, 2000 PNNL-MA-860 Chapter 7.0 Page 7.39
days after any possible exposure. For the initial evaluation of potentially significant uptakes of uranium, a single void sample within 3 to 4 hours of the exposure is appropriate. For the reasons stated above, the optimum urine sample for a routine uranium bioassay sampling program is a 24-hour total urine collec-tion after several days’ absence from any source of intake. Because this is not always practicable to implement on a large scale, an approximate 24-hour sample is commonly used, which consists of urine voided between one-half hour prior to retiring to bed in the evening and one-half hour after rising for two consecutive nights. Alternatively, the evaluation of bioassay measurement results may be normalized to a single day’s excretion using reference volumes of 1400 ml/d for males and 1000 ml/d for females if only a partial day’s sample (e.g., single void) is obtained. The sensitivity of urine sampling is limited by the presence of environmental levels of uranium. As discussed in Section 7.1.3, it is estimated that environmental levels in urine locally average 0.021 µg/d and range from non-detection to over 0.2 µg/d. The net occupationally derived uranium in urine can be approximated by subtracting 0.02 µg/d (rounded) from the observed total daily excretion. Samples containing less than 0.2 µg/d of uranium are generally considered to be within the expected environmental range. As such, any result above 0.2 µg/d is initially considered to possibly contain occupationally derived uranium and the net amount attributed to occupational sources is generally calculated as the total observed amount minus the average expected environmental level of 0.02 µg/d. Thus, 0.18 µg/d becomes the de facto minimum detectable occupational urine excretion rate. Urine samples can be analyzed using either elemental mass or alpha radioactivity measurements. The above discussion of background uranium levels in urine can be converted from elemental uranium mass units to isotopic alpha activity units by multiplying by the specific activity for each constituent of natural uranium. Results are shown in Table 7.26. The minimum detectable uranium intakes based on the 0.18 µg/d net occupational excretion described above are shown in Table 7.27. The associated minimum detectable doses for Table 7.27 values of recycled uranium intakes are shown in Table 7.28 and depicted graphically in Figure 7.7. The doses for natural uranium and depleted uranium are lower.

PNNL-MA-860 Chapter 7.0 Issued: September 30, 2000 Page 7.40
Table 7.26. Natural Uranium Background Levels for Hanford Bioassay Urinalysis
Geometric
Mean Excretion Normal Upper Bound
Screening Level
Elemental U (mass) 0.021 µg/d 0.2 µg/d 238U 0.0070 dpm/d 0.15 dpm/d 236U negligible negligible 235U 0.0003 dpm/d 0.003 dpm/d 234U 0.0075 dpm/d 0.16 dpm/d
In addition to the routine elemental mass and alpha spectroscopy analytical methods, an inductively coupled plasma mass spectrom-etry (ICPMS) method has been developed that is capable of detecting the very small levels of 236U associated with Hanford recycled uranium (Wyse et al. 1995). This procedure is not part of the routine monitoring program but is occasionally used as an investigational tool for high routine analyses (MacLellan 1995). The method has not been submitted for DOELAP accreditation, however an aliquot of the same sample analyzed by the normal elemental mass procedure can provide independent quality verification on the overall results. Of special importance in the evaluation of bioassay measurement capability is the potential for chronic intakes. Any chronic exposure subsequent to an acute intake could significantly affect the interpre-tation of the urinalysis measurement. In facilities where uncontained uranium is handled, urinalysis as a means for monitoring for acute intakes is acceptable, but quantitative assessment of intake or dose equivalent based on the results of routine urine samples can be subject to large uncertainties. At present, it is assumed that chronic occupational exposure at Hanford is not occurring. Assessment of intakes of poorly transportable uranium using urinalysis should be cautiously performed and should consider available in vivo measure-ment results and other information regarding the exposure.
7.4.2 In Vivo Measurements Uranium is detectable in the lung using in vivo techniques. Detec-tion is achieved by measuring photon emissions from 235U and 234Th. Thorium-234 is a decay product of 238U assumed to be in secular equilibrium for uranium contamination at Hanford. The Hanford method for in vivo measurement of uranium is chest counting using

Issued: September 30, 2000
PN
NL-M
A-860 C
hapter 7.0
Page 7.41
Table 7.27. Minimum Detectable Intakes (mg) of Uranium Based on 0.18 µg/d in Urine(a)
Class D Inhalation Class W Inhalation Class Y Inhalation Ingestion Days Post Intake
Instantaneous Uptake 1-µm 5-µm 1-µm 5-µm 1-µm 5-µm Soluble Insoluble
1 1.5E-02 1.8E-03 2.1E-03 1.5E-02 9.0E-03 2.3E-01 1.1E-01 4.2E-02 4.2E-01 2 5.1E-03 4.4E-03 6.4E-03 4.6E-02 3.0E-02 6.7E-01 3.6E-01 2.1E-01 2.1E+00 5 8.2E-03 1.5E-02 1.5E-02 8.6E-02 6.0E-02 1.5E+00 7.8E-01 4.0E-01 4.0E+00 7 1.0E-02 1.9E-02 1.8E-02 1.0E-01 7.2E-02 1.8E+00 9.5E-01 4.9E-01 4.7E+00
14 1.8E-02 3.6E-02 3.3E-02 1.5E-01 1.3E-01 2.9E+00 1.6E+00 9.0E-01 9.0E+00 30 5.3E-02 1.1E-01 9.5E-02 2.8E-01 3.2E-01 5.6E+00 4.6E+00 2.6E+00 2.6E+01 60 2.0E-01 4.1E-01 3.6E-01 4.7E-01 7.8E-01 8.6E+00 1.2E+01 1.0E+01 1.0E+02 90 5.8E-01 1.2E+00 1.1E+00 6.9E-01 1.5E+00 9.5E+00 1.9E+01 2.9E+01 2.9E+02
180 1.1E+01 2.1E+01 1.9E+01 2.0E+00 5.3E+00 1.0E+01 2.8E+01 5.1E+02 5.1E+03 365 5.1E+01 1.1E+02 9.5E+01 1.6E+01 4.4E+01 1.0E+01 2.8E+01 2.6E+03 2.6E+04 730 5.6E+01 1.2E+02 1.1E+02 3.4E+02 3.5E+02 1.1E+01 3.0E+01 2.8E+03 2.8E+04
1,825 6.7E+01 1.4E+02 1.2E+02 5.1E+02 4.5E+02 1.6E+01 4.7E+01 3.3E+03 3.3E+04 3,600 9.0E+01 1.9E+02 1.6E+02 6.7E+02 6.0E+02 4.9E+01 1.4E+02 4.5E+03 4.5E+04 7,300 1.5E+02 3.2E+02 2.8E+02 1.2E+03 1.1E+03 4.9E+02 1.3E+03 7.5E+03 7.5E+04
18,250 7.2E+02 1.5E+03 1.3E+03 5.5E+03 4.9E+03 1.1E+04 2.3E+04 3.5E+04 3.5E+05 (a) Assumes 0.2 µg/d screening level with 0.02 µg/d mean background excretion subtracted.

PNNL-MA-860 Chapter 7.0 Issued: September 30, 2000 Page 7.42
Table 7.28. Minimum Detectable Committed Effective Dose Equivalents (rem) for Recycled Uranium Based on 0.18 µg/d in Urine(a)
Class D Inhalation Class W Inhalation Class Y Inhalation Ingestion Days
Post Intake 1-µm 5-um 1-µm 5-µm 1-µm 5-µm
InstantaneousUptake Soluble Insoluble
1 5.4E-06 7.1E-06 1.1E-04 3.1E-05 2.7E-02 4.6E-03 1.3E-04 5.0E-06 1.0E-05 2 1.32E-05 2.1E-05 3.4E-04 1.0E-04 8.0E-02 1.5E-02 4.5E-05 2.6E-05 5.4E-05 5 4.5E-05 5.0E-05 6.3E-04 2.0E-04 1.8E-01 3.2E-02 7.1E-05 4.8E-05 1.0E-04 7 5.8E-05 5.9E-05 7.3E-04 2.4E-04 2.2E-01 3.9E-02 8.7E-05 5.8E-05 1.2E-04
14 1.1E-04 1.1E-04 1.1E-03 4.4E-04 3.4E-01 6.7E-02 1.6E-04 1.1E-04 2.3E-04 30 3.2E-04 3.1E-04 2.0E-03 1.1E-03 6.8E-01 1.9E-01 4.6E-04 3.1E-04 6.5E-04 60 1.2E-03 1.2E-03 3.5E-03 2.7E-03 1.0E+00 4.9E-01 1.7E-03 1.2E-03 2.5E-03 90 3.6E-03 3.5E-03 5.1E-03 5.1E-03 1.1E+00 7.9E-01 5.1E-03 3.4E-03 7.1E-03
180 6.4E-02 6.3E-02 1.5E-02 1.8E-02 1.2E+00 1.1E+00 9.2E-02 6.2E-02 1.3E-01 365 3.2E-01 3.1E-01 1.2E-01 1.5E-01 1.2E+00 1.1E+00 4.5E-01 3.1E-01 6.5E-01 730 3.6E-01 3.5E-01 2.5E+00 1.2E+00 1.3E+00 1.2E+00 4.9E-01 3.4E-01 7.0E-01
1,825 4.2E-01 4.0E-01 3.8E+00 1.5E+00 2.0E+00 1.9E+00 5.8E-01 4.0E-01 8.3E-01 3,600 5.6E-01 5.4E-01 4.9E+00 2.0E+00 5.8E+00 5.7E+00 7.8E-01 5.4E-01 1.1E+00 7,300 9.6E-01 9.3E-01 8.8E+00 3.6E+00 5.8E+01 5.3E+01 1.3E+00 9.0E-01 1.9E+00
18,250 4.5E+00 4.2E+00 4.0E+01 1.7E+01 1.3E+03 9.2E+02 6.3E+00 4.2E+00 8.8E+00 (a) Assumes 0.2 µg/d screening level with 0.02 µg/d mean background excretion subtracted.
1.0E-03
1.0E-02
1.0E-01
1.0E+00
1.0E+01
1.0E+02
1.0E+03
1.0E+04
1 10 100 1000 10000
Days Post Intake
HE
,50,
(re
m)
Class D 1-um
Class D 5-um
Class W 1-um
Class W 5-um
Class Y 1-um
Class Y 5-um
Instant Uptake
Soluble Ingestion
Insoluble Ingestion
Figure 7.7. Minimum Detectable Dose for Recycled Uranium Based on 0.18 µg/d Net Urine Excretion

Issued: September 30, 2000 PNNL-MA-860 Chapter 7.0 Page 7.43
the low-energy planar germanium detectors, as described in the In Vivo Monitoring Project Manual (PNL-MA-574)(a). Current measurement protocols provide a nominal minimum detectable activity of 1.5 nCi for 234Th and 0.09 nCi for 235U. Table 7.29 shows the minimum detectable intakes of recycled uranium implied by the detection of 1.5 nCi of 234Th in the lung. The associated minimum detectable committed effective dose equivalents are shown in Table 7.30 and Figure 7.8. Tables 7.31, 7.32, and Figure 7.9 provide similar information based on the detection of 0.09 nCi of 235U in the lung. Collectively, these presentations show that routine in vivo measurements do not meet the bioassay monitoring goal of a 100-mrem committed effective dose equivalent as a minimum detectable dose. Their ability to demonstrate compliance with dose limits is dependent on the frequency of measurement. They are a valuable tool as special measurements following suspected intakes of class W or class Y material.
Table 7.29. Minimum Detectable Intakes (mg) of Recycled Uranium Based on 1.5 nCi 234Th in Chest Count(a, b)
Class D Inhalation Class W Inhalation Class Y InhalationDays Post
Intake 1-µm 5-µm 1-µm 5-µm 1-µm 5-µm 1 5.6E+01 1.6E+02 2.1E+01 6.0E+01 2.1E+01 5.9E+01 2 1.9E+02 5.2E+02 2.5E+01 7.2E+01 2.5E+01 7.0E+01 5 7.8E+03 2.1E+04 3.0E+01 8.8E+01 3.0E+01 8.4E+01 7 1.0E+05 2.8E+05 3.2E+01 9.2E+01 3.0E+01 8.5E+01
14 NA NA 3.5E+01 1.0E+02 3.0E+01 8.7E+01 30 NA NA 4.5E+01 1.3E+02 3.0E+01 8.8E+01 60 NA NA 6.4E+01 1.8E+02 3.2E+01 9.0E+01 90 NA NA 9.4E+01 2.7E+02 3.2E+01 9.4E+01
180 NA NA 3.0E+02 8.5E+02 3.8E+01 1.0E+02 365 NA NA 3.2E+03 9.4E+03 4.5E+01 1.3E+02 730 NA NA 4.1E+05 1.2E+06 6.2E+01 1.7E+02
1,825 NA NA NA NA 1.6E+02 4.5E+02 3,600 NA NA NA NA 4.6E+02 1.3E+03 7,300 NA NA NA NA 1.1E+03 3.0E+03
18,250 NA NA NA NA 1.2E+03 3.5E+03 (a) Assumes secular equilibrium with 238U. (b) Implies an MDA of 4.5-mg recycled uranium, based on Table 7.3
isotopic composition. NA = not applicable.
(a) Pacific Northwest National Laboratory (PNNL). In Vivo Monitoring Project Manual. PNNL-MA-
574, Richland, Washington. (Internal manual.)

PNNL-MA-860 Chapter 7.0 Issued: September 30, 2000 Page 7.44
Table 7.30. Minimum Detectable Committed Effective Dose Equivalents (rem) for Recycled Uranium Based on 1.5 nCi 234Th in Chest Count(a, b)
Class D Inhalation Class W Inhalation Class Y Inhalation Days Post
Intake 1-µm 5-µm 1-µm 5-µm 1-µm 5-µm 1 1.7E-01 5.3E-01 1.6E-01 2.0E-01 2.6E+00 2.4E+00 2 5.6E-01 1.7E+00 1.8E-01 2.4E-01 3.0E+00 2.9E+00 5 2.3E+01 7.1E+01 2.2E-01 3.0E-01 3.6E+00 3.4E+00 7 3.0E+02 9.3E+02 2.4E-01 3.1E-01 3.6E+00 3.5E+00
14 NA NA 2.5E-01 3.5E-01 3.6E+00 3.6E+00 30 NA NA 3.3E-01 4.3E-01 3.6E+00 3.6E+00 60 NA NA 4.7E-01 6.1E-01 3.9E+00 3.7E+00 90 NA NA 6.9E-01 9.0E-01 3.9E+00 3.9E+00
180 NA NA 2.2E+00 2.9E+00 4.5E+00 4.2E+00 365 NA NA 2.4E+01 3.2E+01 5.4E+00 5.1E+00 730 NA NA 3.0E+03 3.9E+03 7.4E+00 7.1E+00
1,825 NA NA NA NA 1.9E+01 1.8E+01 3,600 NA NA NA NA 5.5E+01 5.3E+01 7,300 NA NA NA NA 1.3E+02 1.2E+02
18,250 NA NA NA NA 1.4E+02 1.4E+02 (a) Assumes secular equilibrium with 238U. (b) Implies an MDA of 4.5-mg recycled uranium, based on Table 7.3
isotopic composition. NA = not applicable.
1.0E-01
1.0E+00
1.0E+01
1.0E+02
1.0E+03
1 10 100 1000 10000 100000
Days Post Intake
HE
,50
(re
m)
Class D 1-um
Class D 5-um
Class W 1-um
Class W 5-um
Class Y 1-um
Class Y 5-um
Figure 7.8. Minimum Detectable Dose for Recycled Uranium Based on 1.5 nCi 234Th in Chest

Issued: September 30, 2000 PNNL-MA-860 Chapter 7.0 Page 7.45
Table 7.31. Minimum Detectable Intakes (mg) of Recycled Uranium Based on 0.09 nCi 235U in Chest Count(a)
Class D Inhalation Class W Inhalation Class Y Inhalation Days Post
Intake 1-µm 5-µm 1-µm 5-µm 1-µm 5-µm 1 5.4E+01 1.5E+02 2.0E+01 5.7E+01 2.0E+01 5.6E+01 2 1.8E+02 5.0E+02 2.4E+01 6.8E+01 2.4E+01 6.7E+01 5 7.4E+03 2.0E+04 2.9E+01 8.4E+01 2.9E+01 7.9E+01 7 NA NA 3.1E+01 8.7E+01 2.9E+01 8.1E+01
14 NA NA 3.3E+01 9.7E+01 2.9E+01 8.2E+01 30 NA NA 4.3E+01 1.2E+02 2.9E+01 8.4E+01 60 NA NA 6.1E+01 1.7E+02 3.1E+01 8.6E+01 90 NA NA 8.9E+01 2.5E+02 3.1E+01 8.9E+01
180 NA NA 2.9E+02 8.1E+02 3.6E+01 9.7E+01 365 NA NA 3.1E+03 8.9E+03 4.3E+01 1.2E+02 730 NA NA 3.9E+05 1.1E+06 5.9E+01 1.6E+02
1,825 NA NA NA NA 1.5E+02 4.3E+02 3,600 NA NA NA NA 4.3E+02 1.2E+03 7,300 NA NA NA NA 1.0E+03 2.9E+03
18,250 NA NA NA NA 1.1E+03 3.3E+03 (a) Implies an MDA of 4.3-mg recycled uranium, based on Table 7.3
isotopic composition.
Table 7.32. Minimum Detectable Committed Effective Dose Equivalents (rem) for Recycled Uranium Based on 0.09 nCi 235U in Chest Count(a)
Class D Inhalation Class W Inhalation Class Y Inhalation Days Post
Intake 1-µm 5-µm 1-µm 5-µm 1-µm 5-µm 1 1.6E-01 5.1E-01 1.5E-01 1.9E-01 2.4E+00 2.3E+00 2 5.4E-01 1.6E+00 1.7E-01 2.3E-01 2.9E+00 2.7E+00 5 2.2E+01 6.7E+01 2.1E-01 2.9E-01 3.4E+00 3.3E+00 7 2.9E+02 8.8E+02 2.2E-01 3.0E-01 3.4E+00 3.3E+00
14 NA NA 2.4E-01 3.3E-01 3.4E+00 3.4E+00 30 NA NA 3.1E-01 4.0E-01 3.4E+00 3.4E+00 60 NA NA 4.5E-01 5.8E-01 3.7E+00 3.5E+00 90 NA NA 6.5E-01 8.6E-01 3.7E+00 3.7E+00
180 NA NA 2.1E+00 2.7E+00 4.3E+00 4.0E+00 365 NA NA 2.2E+01 3.0E+01 5.1E+00 4.9E+00 730 NA NA 2.8E+03 3.7E+03 7.0E+00 6.8E+00
1,825 NA NA NA NA 1.8E+01 1.8E+01 3,600 NA NA NA NA 5.2E+01 5.0E+01 7,300 NA NA NA NA 1.2E+02 1.2E+02
18,250 NA NA NA NA 1.4E+02 1.4E+02 (a) Implies an MDA of 4.3-mg recycled uranium, based on Table 7.3
isotopic composition. NA = not applicable.

PNNL-MA-860 Chapter 7.0 Issued: September 30, 2000 Page 7.46
1.0E-01
1.0E+00
1.0E+01
1.0E+02
1.0E+03
1 10 100 1000 10000 100000
Days Post Intake
HE
,50
(re
m)
Class D 1-um
Class D 5-um
Class W 1-um
Class W 5-um
Class Y 1-um
Class Y 5-um
Figure 7.9. Minimum Detectable Dose for Recycled Uranium Based on 0.09 nCi 235U in Chest Count
In vivo measurements of 235U and 234Th are used as co-indicators of natural and recycled uranium based on the isotopic compositions shown in Table 7.3. These compositions and the MDDs of Tables 7.30 and 7.32 show that 234Th and 235U are roughly comparable indicators of recycled uranium. For depleted and natural uranium mixtures, the 234Th measurement will be more sensitive. These two results, obtained from a single in vivo chest measurement, can be used as independent verification of the presence of uranium, or alternatively as a method of identifying potential false-positive detections. For example, the relative isotopic activity abundance of 238U to 235U for a mixture can be multiplied by the detected amount of 235U. This result (the 238U implied by the 235U measurement) can then be compared with the 234Th (assumed to be in equilibrium with the 238U) to determine if the measurements reasonably agree.
7.4.3 Fecal Sample Measurements Fecal samples are useful for confirming and evaluating inhalation and ingestion intakes, particularly where insoluble material is involved. The sample results can be used in conjunction with the ICRP 30 respiratory tract model to estimate the magnitude of intakes and initial lung depositions as a basis for dose assessment. Clear-ance of uranium via feces can be divided into two components: that

Issued: September 30, 2000 PNNL-MA-860 Chapter 7.0 Page 7.47
which represents rapid clearance from the respiratory tract and that which represents longer-term clearance from the pulmonary region and systemic circulation. For evaluation of an inhalation of slowly transportable uranium, the measurement of the quantity of uranium excreted via feces during the first few days following the intake can provide a basis for estimating the significance of the intake, when levels are below that detectable using in vivo techniques. Because the quantity of uranium ingested daily through food is assumed to be about 2 µg, it is generally not practicable to use fecal sampling as a routine bioassay monitoring technique. However, it can be used effectively following incidents or for monitoring of potential intakes of enriched or depleted uranium. Table 7.33 lists minimum detectable intakes of uranium based on the detection of a net excretion of 2-µg/d uranium above the background level.
Table 7.33. Minimum Detectable Intakes (mg) of Uranium Based on 2 µg/d in Feces(a)
Class D Inhalation Class W Inhalation Class Y Inhalation Ingestion Days Post Intake 1-µm 5-µm 1-µm 5-µm 1-µm 5-µm Soluble Insoluble
1 2.9E-02 1.2E-02 2.0E-02 9.5E-03 1.5E-02 8.0E-03 4.3E-03 4.3E-03 2 4.5E-02 1.8E-02 1.5E-02 8.0E-03 1.3E-02 6.9E-03 7.1E-03 7.1E-03 5 7.1E-01 3.0E-01 8.7E-02 6.7E-02 8.3E-02 5.9E-02 1.1E-01 1.1E-01 7 5.3E+00 2.2E+00 3.3E-01 3.7E-01 3.7E-01 3.6E-01 8.3E-01 8.0E-01
14 5.7E+03 2.4E+03 1.7E+00 4.8E+00 1.2E+01 3.2E+01 9.1E+02 8.7E+02 30 NA NA 2.2E+00 6.3E+00 1.5E+01 4.3E+01 NA NA 60 NA NA 3.3E+00 9.5E+00 1.5E+01 4.4E+01 NA NA 90 NA NA 5.0E+00 1.4E+01 1.7E+01 4.7E+01 NA NA
180 NA NA 1.7E+01 4.9E+01 1.8E+01 5.3E+01 NA NA 365 NA NA 2.2E+02 6.5E+02 2.4E+01 6.9E+01 NA NA 730 NA NA 3.6E+04 1.0E+05 4.0E+01 1.1E+02 NA NA
1,825 NA NA NA NA 1.8E+02 5.1E+02 NA NA 3,600 NA NA NA NA 2.1E+03 6.1E+03 NA NA
(a) Assumed net excretion when corrected for nominal background 1.4 to 1.8 µg/d. NA = not applicable.
Table 7.34 and Figure 7.10 show the minimum detectable doses associated with the Table 7.33 values for recycled uranium. The associated doses for natural and depleted uranium are lower.
7.4.4 Routine Bioassay Monitoring Program Because of the high variability in background uranium excretion in urine, all workers involved in uranium bioassay should have a baseline bioassay prior to commencing uranium work. In addition,

PNNL-MA-860 Chapter 7.0 Issued: September 30, 2000 Page 7.48
Table 7.34. Minimum Detectable Committed Effective Dose Equivalents (rem) for Recycled Uranium Based on 2-µg/d in Feces(a)
Class D Inhalation Class W Inhalation Class Y Inhalation Ingestion Days Post
Intake 1-µm 5-µm 1-µm 5-µm 1-µm 5-µm Soluble Insoluble 1 8.6E-05 3.9E-05 1.5E-04 3.2E-05 1.8E-03 3.3E-04 5.2E-07 1.1E-07 2 1.4E-04 6.0E-05 1.1E-04 2.7E-05 1.5E-03 2.8E-04 8.6E-07 1.8E-07 5 2.1E-03 9.9E-04 6.3E-04 2.3E-04 1.0E-02 2.4E-03 1.3E-05 2.8E-06 7 1.6E-02 7.2E-03 2.4E-03 1.3E-03 4.4E-02 1.5E-02 1.0E-04 2.0E-05
14 1.7E+01 7.9E+00 1.2E-02 1.6E-02 1.4E+00 1.3E+00 1.1E-01 2.2E-02 30 1.4E+07 3.7E+06 1.6E-02 2.1E-02 1.8E+00 1.7E+00 4.5E+04 6.5E+04 60 NA NA 2.4E-02 3.2E-02 1.8E+00 1.8E+00 NA NA 90 NA NA 3.7E-02 4.9E-02 2.0E+00 1.9E+00 NA NA
180 NA NA 1.2E-01 1.7E-01 2.2E+00 2.2E+00 NA NA 365 NA NA 1.6E+00 2.2E+00 2.9E+00 2.8E+00 NA NA 730 NA NA 2.6E+02 3.4E+02 4.8E+00 4.6E+00 NA NA
1,825 NA NA 8.6E+07 8.2E+08 2.2E+01 2.1E+01 NA NA 3,600 NA NA NA NA 2.6E+02 2.5E+02 NA NA 7,300 NA NA NA NA 4.3E+04 4.1E+04 NA NA
18,250 NA NA NA NA 1.6E+11 1.3E+11 NA NA (a) Assumed net excretion when corrected for nominal background 1.4 to 1.8 µg/d. NA = not applicable.
1.0E-04
1.0E-03
1.0E-02
1.0E-01
1.0E+00
1.0E+01
1.0E+02
1 10 100 1000 10000
Days Post Intake
HE
,50,
(rem
)
Class D 1-um
Class D 5-um
Class W 1-um
Class W 5-um
Class Y 1-um
Class Y 5-um
Soluble Ingestion
Insoluble Ingestion
Figure 7.10. Minimum Detectable Dose for Recycled Uranium Based on 2-µg/d Net Fecal Excretion

Issued: September 30, 2000 PNNL-MA-860 Chapter 7.0 Page 7.49
significant changes in geographic location (e.g., moving from a private groundwater well water supply to a surface water supply, or vice versa) may warrant reestablishing a baseline excretion. A contractor request urinalysis may be obtained as a non-periodic measurement following completion of a specific task involving potential uranium exposure. This approach may provide a cost-effective monitoring program for workers with infrequent potential for occupational uranium intakes, and may permit higher supplemental screening levels based on the time following the potential for intake. The interpretation of routine urinalysis measurements is highly dependent on the nature of the intake, i.e., low-level chronic exposure conditions significantly affect the interpretation of bioassay measurements. Chronic exposures to uranium have occurred in the UO3 Plant, 300 Area Fuel Production Facilities, and the 306-W Building, but are no longer normal conditions, and thus bioassay protocols for chronic exposure have been terminated. Chronic exposure bioassay programs for these facilities were most recently described in Technical Basis for Internal Dosimetry at Hanford (Sula, Carbaugh, and Bihl 1991). If such exposure conditions return, the current bioassay program recommendations will be reconsidered. The discussion below addresses bioassay monitoring for acute intakes, which are now considered to be the most likely intake scenarios.
Class D Routine Monitoring
Routine bioassay monitoring for acute inhalations of highly soluble uranium (class D) should consist of a minimum of quarterly urinalyses using a dose assessment screening level of 0.5-µg/d, based on Table 7.18. Such a program provides adequate assurance that potentially significant doses do not go undetected and that the chemical toxicity threshold level has not been exceeded. Results between the upper bound of normal background (0.2-µg/d) and 0.5-µg/d may indicate that slight intakes have occurred but do not require individual dose assessment. Results above 0.5-µg/d should be investigated. Results above 1-µg/d suggest that the transient chemical toxicity level might have been exceeded, however a more recent intake or chronic low-level nonoccupational ingestion could significantly affect interpretation. More frequent sampling (e.g., monthly) allows for the use of substantially higher screening levels (e.g., 5-µg/d as a screening level for investigation and dose assessment, and 12-µg/d as a screening level for transient chemical toxicity).

PNNL-MA-860 Chapter 7.0 Issued: September 30, 2000 Page 7.50
Chest counting is not warranted as periodic bioassay for acute class D uranium monitoring.
Class W Routine Monitoring Annual urinalysis for class W recycled uranium comes sufficiently close to the bioassay goal of 100-mrem committed effective dose equivalent to be considered adequate for routine monitoring. Semi-annual (twice yearly) urinalyses can easily demonstrate compliance with the 100-mrem-bioassay goal. In both cases, any result exceeding the 0.2-µg/d environmental screening level should be investigated for potential occupational intake resulting in a committed effective dose equivalent exceeding 10-mrem. Semi-annual chest counting can be useful as a supplemental bioassay for class W uranium intakes, and is capable of independently demonstrating compliance with dose limits.
Class Y Routine Monitoring
Routine bioassay monitoring programs are inherently not capable of meeting the 100-mrem committed effective dose equivalent bioassay goal due to the normal presence of uranium in the environment. Thus, reliance must be placed on good workplace surveillance practices to detect potential intake conditions in a timely manner so that special bioassay may be initiated. The recommended routine monitoring program for class Y inhalations of uranium is an annual urinalysis combined with an annual chest count. This protocol provides the capability of demonstrating compliance with the annual dose limits. As shown in Table 7.28, quarterly urinalyses do not significantly improve the sensitivity of bioassay with respect to the 100-mrem goal, however monthly samples would, albeit at a cost 12 times higher than annual measurements. Likewise, as demonstrated in Tables 7.30 and 7.32, the shift from annual to more frequent (e.g., semiannual or quarterly) chest counts is of some technical benefit for dose limit compliance monitoring, but must be weighed against the added cost of such programs.
7.4.5 Special Monitoring for Suspected Intakes Bioassay monitoring should be initiated promptly upon indication that a potential acute intake has occurred. The primary consideration in determining the appropriate measurements is the mode of intake and the clearance rate of the material from the initial deposition site.

Issued: September 30, 2000 PNNL-MA-860 Chapter 7.0 Page 7.51
For readily transportable materials, urine sampling to determine kidney burden is required. For slowly transportable material, in vivo measurements and collection of early fecal excretion are necessary. For unknown forms or mixtures with a range of transportabilities, both urine and fecal samples are recommended in addition to lung counts. For intakes of readily transportable forms of uranium with potential significance relative to the threshold for chemical toxicity, a urine sample should be collected and analyzed within 12 hours of the intake. If preliminary information indicates that a significant intake was likely, the contractor should be advised to contact HEHF Occupational Medicine promptly for medical support. (See also Section 7.6.) Investigations of high routine uranium urinalysis measurements are often problematic due to the potential for elevated background from natural environmental sources. Verification and confirmation of the initial measurement is important. If the worker is potentially exposed to recycled uranium, analysis for 236U by the specia l ICPMS method can be an effective tool to identify occupational intake from environmental exposure. Comparison of isotopic ratios in a urine or fecal result with the potential workplace source can be useful, provided that the workplace source is significantly different from natural environmental uranium. In some cases, investigation of potential nonoccupational sources (e.g., drinking water or comparison with a family member) might be beneficial to the investigation.
7.5 Assessment of Internal Dose
Internal dose assessment can be performed using the methods described in Section 7.5.1 for acute intakes and Section 7.5.2 for chronic intakes. The kidney burden and potential chemical toxicity associated with uranium intakes are discussed in Section 7.5.3. Assessment of internal dose equivalents from intakes of uranium is preferably based on evaluation of bioassay measurements. The choice of bioassay measurement depends on consideration of the transportability of the inhaled material and the nature of the exposure. Generally, urinalysis measurements are most indicative of systemically deposited uranium, and in vivo measurements provide a measure of lung burden. The potential for mixed chronic and acute intakes (i.e., acute occupational exposure on top of a low-level

PNNL-MA-860 Chapter 7.0 Issued: September 30, 2000 Page 7.52
chronic natural background exposure) complicates the interpretation of available data and must be carefully considered during the evaluation process. Experience has shown that actual uranium exposures may involve varying mixtures of inhalation classes and particle sizes that may not be adequately represented by a single classification. If there is no basis for establishing the inhalation class and particle size character-istics of the intake, then it is prudent to assume a class Y material with a particle AMAD of 5 µm for evaluation of dose equivalent. Evaluations of potential for renal damage, based on urinalysis, are relatively insensitive to transportability and particle variations. If either the threshold for toxicity or a committed effective dose equivalent of 100 mrem is exceeded, simplifying assumptions should be reviewed for their appropriateness and additional bioassay and other measurements should be performed, as necessary, to improve the quality of the assessment. Special care should be taken in to account for the isotopic composi-tion of the uranium. For example, the dose equivalent for an intake of class Y recycled uranium, such as is present at the Fuel Production Facilities, will exceed the dose equivalent from an equal mass of natural uranium, or depleted uranium (from 306-W Building) because of the higher specific alpha activity. Impurity radionuclides present in the recycled uranium can also increase the magnitude of the internal dose received, particularly for soluble forms of uranium. The default assumption of recycled uranium used for bioassay program design may not be appropriate for dose assessment. Tables and graphs provided in this chapter have been constructed using the ICRP 30 model for uranium biokinetics and thus can be used to convert bioassay measurement results to intake and committed effective dose equivalent. Although the tables and figures are sufficient for evaluating lower-level intakes and those that are relatively straightforward, additional computing capability may be necessary for more complex evaluations, particularly when bioassay data indicate that distribution and retention patterns deviate from the standard model. In this case, evaluations are performed using the computer code CINDY (see Appendix D). CINDY parameters are set up according to the ICRP 30 biokinetic model for uranium; however, the code provides the capability to change model param-eters based on bioassay measurement results. Deviations from the standard ICRP model are documented in the assessment.

Issued: September 30, 2000 PNNL-MA-860 Chapter 7.0 Page 7.53
7.5.1 Acute Intake Assessment Acute intakes are best assessed through the performance of bioassay measurements beginning shortly after the intake. It is important that any additional exposure to uranium, even low-level chronic intakes, be avoided to the extent practicable during the period of bioassay monitoring following an acute intake. Interpretation of excreta data is highly susceptible to errors introduced by even minor subsequent intakes and thus, if the possibility of continued exposure cannot be ruled out, all excreta sample data collected following an acute intake must be considered to be potentially biased. Acute intakes of readily transportable forms of uranium are best evaluated through collection and analysis of follow-up urine samples. Samples collected after the unabsorbed fraction is eliminated from the body (i.e., after the first day post intake) provide the best estimate of systemically deposited material. Table 7.8 lists urine excretion fractions that may be used as default values for selected times following an acute intake. In vivo measurements of lung activity provide the most direct basis for the assessment of internal dose equivalent for moderately or poorly transportable forms of uranium, however they are insensitive to small intakes. They do provide a useful tool for estimating the upper bound of an intake immediately following exposure. Multiple measurements of internal activity can provide a measure of the pulmonary retention for the specific exposure case; however, the initial assessment of intake, based on a single in vivo measurement can be made using the retention factors of Table 7.7 Although intakes of poorly transportable uranium are preferably assessed using direct (in vivo) bioassay measurements, most acute intakes of such material will be below the sensitivity of in vivo measurement techniques. The collection and analysis of fecal samples within the first week provides an alternative, and the most sensitive, indicator of activity deposited in the respiratory tract. It is difficult to obtain all fecal matter representing the rapidly clearing component from the lung to the GI tract, and normalizing available fecal sample data to account for partial collection may be required. Table 7.9 provides fecal excretion rates at various times post intakes, and additional information on the collection and evaluation of fecal samples is provided in Appendix C.
7.5.2 Chronic Intake Assessment Urinalysis is the preferred bioassay measurement technique for monitoring chronic exposures to readily transportable forms of

PNNL-MA-860 Chapter 7.0 Issued: September 30, 2000 Page 7.54
uranium. For predominantly moderately or poorly transportable forms of uranium, the lung is the primary contributor to effective dose equivalent and in vivo chest measurements are the most direct indicator of internal dose. Because of the relatively poor sensitivity of in vivo techniques for low-enrichment uranium, the results of periodic urinalysis measurements may provide a means for estimating the magnitude of dose equivalent from chronic exposures below the sensitivity of the in vivo measurements. Chronic exposures to moderately or poorly transportable forms of uranium will result in accumulations of uranium activity in the lung. Use of in vivo chest activity measurements provides a direct means for assessing the magnitude of the chronic exposure and the resulting dose equivalents. Urinalysis and air monitoring data can be used to help characterize the nature of the exposures. The computer code CINDY can be used to estimate intakes yielding the observed bioassay measurement results and to calculate resulting dose equivalents. Distribution and retention parameters in CINDY may be modified to better reflect bioassay measurement results. In cases where urinalysis data indicate chronic exposures, but in vivo measurements do not detect internal activity, the urinalysis data can be used to provide an estimate of intake; however, the uncertainty associated with such estimates is quite high and should be modified as necessary to be consistent with in vivo measurement results. Intake rate and dose equivalents from chronic exposure to uranium, based on urinalysis, can be computed using CINDY. Alternatively, if multiple small, intermittent intakes are assumed throughout the year, each sample can be assumed to be independent of (i.e., unaffected by) the others. Under this scenario, an effective chronic intake rate can be approximated using the geometric mean (µg) of the daily urinary excretion rate [Mu(t)] based on analysis of urine samples (n) collected during the period of exposure, as follows:
]n
)t(Mlog[logAnti ug
Σ=µ
This effective daily excretion rate can then be used to calculate an effective daily intake rate for the period of exposure. (CINDY provides a simple tool for converting the effective daily excretion rate to a daily intake rate.) Multiplying the effective daily intake rate by the duration of the exposure will give the total intake, from which committed doses can be calculated using the appropriate dose coefficient. CINDY can also be used to calculate doses.

Issued: September 30, 2000 PNNL-MA-860 Chapter 7.0 Page 7.55
The historical use of the above method for evaluating routine bioassay program data for the UO3 Plant, the 300 Area Fuel Production Facilities, and 306-W Building was described more fully in Technical Basis for Internal Dosimetry at Hanford (Sula, Carbaugh, and Bihl 1991).
7.5.3 Assessment of Kidney Burden and Potential Chemical Toxicity The maximum kidney burden from an acute exposure can be assessed from urinalysis data in the following manner. First calculate the total uranium intake using one of the methods described above. Then multiply the intake by the maximum kidney retention fraction from Table 7.10 (or as calculated for a specific intake scenario using CINDY). As long as the total maximum kidney retention does not exceed 341-µg, the threshold for chemical toxicity (based on 1.1-µg-U/g-kidney, as described in Section 7.2.4) has not been exceeded and the uranium intake is below that considered potentially harmful. Exceeding the threshold does not necessarily imply serious harm, however potential impact should be considered in light of the discussion in Section 7.2.4. The average daily urinary excretion for continuous intake is related to the kidney burden. This ratio varies with time, but is independent of inhalation class and particle size. For continuous exposures lasting longer than about 5 years, the ratio of the kidney burden to the average daily excretion is about 2. Thus, assuming a kidney burden of 341 µg (i.e., 1.1 µg-U/g-kidney; the assumed threshold level at which a chronic kidney burden may result in renal damage), the average daily excretion would be about 341/2 = 170 µg/d. If exposure were halted for 2 days (such as during a weekend), the daily excretion would drop to about 85 µg/d. For class D uranium, the 341-µg kidney burden would result from prolonged intakes of about 320 µg/d. If preliminary information indicates that an intake at the threshold for chemical toxicity was possible, investigation of the potential intake should be performed. If evidence suggests that a significant intake was likely, follow-up samples should be promptly collected and analyzed, and HEHF Occupational Medicine should be notified. Because acute damage of the kidneys is the primary consideration, kidney function tests provide the most direct and useful means of assessing the impact of the exposure. Sensitive tests for kidney damage include beta-2-microglobulin and catalase relative to creatinine (Fisher 1985). Albuminuria is also an indicator of kidney damage. Leggett (1989) and Fisher, Swint, and Kathren (1990) have identified a number of other potentially useful tests. The decision to perform such tests is made by HEHF Occupational Medicine.

PNNL-MA-860 Chapter 7.0 Issued: September 30, 2000 Page 7.56
7.6 Management of Internal Contamination Cases Acute intakes of uranium pose both radiological and nephrotoxicity concerns. Renal damage results in failure of the proximal tubules to reabsorb constituents filtered from the blood. Laboratory abnormal-ities include proteinuria, glucosuria, and increased urine output. Clinical symptoms of severe uranium poisoning may include nausea, vomiting, abdominal cramps, and diarrhea. Urine samples should be collected within 3 to 4 hours following any uranium uptake with potential chemical toxicity concerns. As a general rule, biological indicators of kidney damage should be checked if urine concentrations exceed 2 mg/l. Clinical indicators of kidney damage include albuminuria, glucose, catalase, and beta-2 microglobulin. Urine concentrations on the order of 20 mg/l indicate serious exposure with potential life-threatening consequences and are cause for immediate medical attention (Rich et al. 1988). Antidotal therapy for uranium poisoning includes oral administration of GI tract adsorbents and oral or intravenous infusion of sodium bicarbonate (Bhattacharyya et al. 1992; NCRP 1980). The bicarbonate promotes formation of the uranyl-bicarbonate complex, which is more rapidly excreted in urine (Fisher 1985). Ethylene diamine tetraacetic acid (EDTA) and DTPA have been used in experimental animals to increase the excretion of uranium; however, chelation therapy appears to have no beneficial effect more than 4 hours after exposure (NCRP 1980). Therapeutic actions such as described above require prescription by appropriate medical authority (e.g., HEHF Occupational Medicine).
7.7 References 29 CFR 1910.1000 Table Z-1. 2000. Occupational Safety and Health Administration (OSHA), “Limits for Air Contaminants.” U.S. Code of Federal Regulations. Available URL: http://www.osha-slc.gov/OSHStd_data/1910_1000_TABLE_Z-1.html American Conference on Governmental Industrial Hygienists (ACGIH). 1968. Threshold Limit Values in Airborne Contaminants for 1968, recommended and intended values. St. Louis, Missouri. American Conference on Governmental Industrial Hygienists (ACGIH). 1983. Threshold Limit Values for Chemical Substances and Physical Agents in the Work Environment with intended changes for 1983-84. Cincinnati, Ohio.

Issued: September 30, 2000 PNNL-MA-860 Chapter 7.0 Page 7.57
Bhattacharyya, M. H., B. D. Breitenstein, H. Metivier, B. A. Muggenburg, G. N. Stradling, and V. Volf. 1992. “Guidebook for the treatment of accidental internal radionuclide contamination of workers,” eds. G. B. Gerber and R. G. Thomas. Rad. Prot. Dosim. 41:1. Carbaugh, E. H., M. J. Sula, and K. M. McFadden. 1990. Use of Probability Analysis to Establish Routine Bioassay Screening Levels. PNL-SA-17716, Pacific Northwest Laboratory, Richland, Washington. Dang, H. S., V. R. Pullat, T. Surendran, T. K. Haridasau, D. D. Jaiswal, and R. C. Sharma. 1994. “Studies on the pulmonary clearance fraction for a group of workers with chronic exposure to Y class uranium.” Rad. Prot. Dosim. 54:1 (69-71). Drury, J. S., M. F. Baldauf, E. W. Daniel, C. S. Fore, and M. Sl Uziel. 1983. Radioactivity in Food Crops. ORNL-5963, Oak Ridge National Laboratory, Oak Ridge, Tennessee. Eve, I. S. 1964. “Some suggested maximum permissible single intakes of uranium.” Health Phys. 10:773-776. Fisher, D. R. 1985. “Uranium.” In Handbook on the Toxicity of Inorganic Compounds, eds. H. G. Seiler and H. Sigel. Marcel Dekker, Inc., New York. Fisher, D. R., M. J. Swint, and R. L. Kathren. 1990. Evaluation of Health Effects in Sequoyah Fuels Corporation (SFC) Workers from Accidental Exposure to Uranium Hexafluoride. NRC Report NUREG/CR-5566 (PNL-7328), U.S. Nuclear Regulatory Commission, Washington, D.C. Golchert, N. W., T. L. Duffy, and J. Sedlet. 1985. Environmental Monitoring at Argonne National Laboratory. Report ANL-85-17, 1984 data. Argonne National Laboratory, Argonne, Illinois. Goldstein, S. J., J. M. Rodriguez, and N. Lujan. 1997. “Measurement and application of uranium isotopes for human and environmental monitoring.” Health Phys. 72(1):10-18. Harrison, J. D. 1991. “The gastrointestinal absorption of the actinide elements.” Sci. Total Environ. 100:43-60.

PNNL-MA-860 Chapter 7.0 Issued: September 30, 2000 Page 7.58
Health Physics Society (HPS). 1995. Bioassay Programs for Uranium. HPS N13.22-1995. An American National Standard approved by American National Standards Institute, Health Physics Society, McLean, Virginia. Hursh, J. B., Newuman, W. R., Toribara, T., Wilson, H., and Waterhouse, C. 1969. “Oral ingestion of uranium by man.” Health Phys. 17:619-621. Hursh, J. B., and N. L. Spoor. 1973. “Protection Criteria.” In Uranium, Plutonium, and Transplutonium Elements, eds. H. C. Hodge, J. N. Stannard, and J. B. Hursh, pp. 197-239. Springer-Verlag, Berlin, West Germany. International Commission on Radiological Protection (ICRP). 1964. Recommendations of the Internal Commission on Radiological Protection. ICRP publication 6, Pergamon Press, Oxford, England. International Commission on Radiological Protection (ICRP). 1974. Report of task group on Reference Man. ICRP publication 23, Pergamon Press, New York. International Commission on Radiological Protection (ICRP). 1979. “Limits for intakes of radionuclides by workers.” (ICRP publication 30, part 1). Annals of ICRP, 2:3-4, Pergamon Press, New York. International Commission on Radiological Protection (ICRP). 1994a. “Human respiratory tract model for radiological protection.” (ICRP publication 66). Annals of ICRP, 24:1-3. Pergamon Press, New York. International Commission on Radiological Protection (ICRP). 1994b. “Dose coefficients for intakes of radionuclides by workers.” (ICRP publication 68). Annals of ICRP, 24:4, Pergamon Press, New York. International Commission on Radiological Protection (ICRP). 1995. “Age-dependent doses to members of the public from intakes of radionuclides: Part 3 ingestion dose coefficients.” (ICRP publication 69). Annals of ICRP, 25:1, Pergamon Press, New York. International Commission on Radiological Protection (ICRP). 1997. “Individual monitoring for internal exposure of workers.” (ICRP publication 78). Annals of ICRP, 27:3-4, Pergamon Press, New York.

Issued: September 30, 2000 PNNL-MA-860 Chapter 7.0 Page 7.59
Just, R. A. Report on Toxicological Studies Concerning Exposures to UF6 and UF6 Hydrolysis Products. DOE Report K/D-5573, Revision 1. Just, R. A., and V. S. Emler. 1984. Generic Report on Health Effects for the U.S. Gaseous Diffusion Plants. DOE Report K/D-5050, Section VII, Part 1. Leggett, R. W. 1989. “The behavior and chemical toxicity of U in the kidney: A reassessment.” Health Phys. 57(3):365-383. Leggett, R. W., and J. D. Harrison. 1995. “Fractional absorption of ingested uranium in humans.” Health Phys. 68:484-498. Long, M. P., E. H. Carbaugh, and N. L. Fairrow. 1994. Practical Issues in Discriminating Between Environmental and Occupational Sources in a Uranium Urinalysis Bioassay Program. PNL-SA-24340, Pacific Northwest National Laboratory, Richland, Washington. Long, M. P., and E. H. Carbaugh. 1995. Final Report – Natural Uranium Background Study. Letter Report to distribution, dated June 26, 1995. Personal correspondence. Permanent copy retained in Hanford Radiological Records Historical File (contact E. H. Carbaugh). MacLellan, J. A. 1995. Discrimination Between Occupational and Environmental Sources of Internal Uranium Exposure . Poster presented at the 40th Annual Meeting of the Health Physics Society, July 23-27, 1995. Boston, Massachusetts. McGuire, S. A. 1991. Chemical toxicity of uranium hexafluoride compared to acute effects of radiation. NUREG-1391, U.S. Nuclear Regulatory Commission, Washington, D.C. Morrow, P. E., L. J. Leach, F. A. Smith, R. M. Gelein, J. B. Scott, H. D. Beiter, F. J. Amato, J. J. Picano, C. L. Yuile, and T. G. Consler. 1982. Metabolic fate and evaluation of injury in rats and dogs following exposure to the hydrolysis products of uranium hexaflouride. NUREG/CR-2268, U.S. Nuclear Regulatory Commission, Washington D.C. National Council on Radiation Protection and Measurements (NCRP). 1980. Management of Persons Accidentally Contaminated with Radionuclides. NCRP Report No. 65, Bethesda, Maryland.

PNNL-MA-860 Chapter 7.0 Issued: September 30, 2000 Page 7.60
National Council on Radiation Protection and Measurements (NCRP). 1988. Exposure of the Population in the United States and Canada from Natural Background Radiation. NCRP Report No. 94, Bethesda, Maryland. Public Health Service (PHS). 1997. Toxicological Profile for Uranium. Draft for public comment. U.S. Department of Health & Human Services, Public Health Service, Agency for Toxic Substances and Disease Registry. Atlanta, Georgia. Rich, B. L., S. L. Hinnefeld, C. R. Lagerquist, W. G. Mansfield, L. H. Munson, and E. R. Wagner. 1988. Health Physics Manual of Good Practices for Uranium Facilities. EGG-2530, EG&G Idaho, Inc., Idaho Falls, Idaho. Sula, M. J., E. H. Carbaugh, and D. E. Bihl. 1989. Technical Basis for Internal Dosimetry at Hanford . PNL-6866, Pacific Northwest Laboratory, Richland, Washington. Sula, M. J., E. H. Carbaugh, and D. E. Bihl. 1991. Technical Basis for Internal Dosimetry at Hanford . PNL-6866, Revision 1, Pacific Northwest Laboratory, Richland, Washington. Sulu and Zhao, Fu-Yao. 1990. “Nephrotoxic limit and annual limit on intake for Natural U.” Health Phys. 58(5):619-623. Thompson, R. J. 1986. Operating Specifications for the Uranium Oxide Plant. OSD-U-185-00001, Rockwell Hanford Operations, Richland, Washington. United Nations Scientific Committee on the Effects of Atomic Radiation (UNSCEAR). 1988. Sources, Effects, and Risks of Ionizing Radiation. Report to the General Assembly, with annexes. United Nations Publications, New York. U.S. Department of Energy-Richland Operations Office (DOE-RL). 2000. Recycled Uranium: The Flow and Characteristics of Recycled Uranium Throughout the DOE Complex, 1952-1999. Volume II: Part 1, Hanford Site, Site Assessment Team Report. DOE/EH-0617 and DOE/RL-2000-43, Richland, Washington. U.S. Environmental Protection Agency (EPA). 1991. “40 CFR Parts 141 and 142 National Primary Drinking Water Regulations; Radionuclides; Proposed Rule.” Published in 56 FR 33050-33127, July 18, 1991, Federal Register.

Issued: September 30, 2000 PNNL-MA-860 Chapter 7.0 Page 7.61
Welford, G. A., and R. Baird. 1967. “Uranium levels in human diet and biological materials.” Health Phys. 13(1321-1324). Wittekind, W. D., and D. C. Morey. 1985. “Uranium 236 Material Flow and Computer Model.” UNI-3570, UNC Nuclear Industries, Richland, Washington. Wrenn, M. E. 1985. Metabolism of ingested uranium and radium.” Health Phys. 48:601. Wrenn, M. E., P. W. Durbin, B. Howard, J. L. Lipzstein, J. L. Rundo, E. T. Sill, and D. L. Willis. 1985. “Metabolism of ingested U and Ra.” Health Phys. 48:601-603. Wyse, E. J., O. T. Farmer, J. P. Bramson, J. A. MacLellan, and D. W. Koppenaal. 1995. Radioanalytical Applications of ICP/MS Using Enhanced Sensitivity Techniques. Poster presented at the 40th Annual Meeting of the Health Physics Society, July 23-27, 1995. Boston, Massachusetts.

Issued: January 31, 2003 PNNL-MA-860 Chapter 8.0 Page 8.1
8.0 Plutonium
This chapter provides information on the sources, characteristics, and biokinetics of plutonium and ingrown americium and summarizes the technical basis for their internal dosimetry at Hanford.
Prior to 1989, the general approach to plutonium internal dosimetry at Hanford was to evaluate the systemic deposition based on urine data, and compare the result with a referenced maximum permissible body burden (MPBB) such as those contained in ICRP publication 2 (1959). The assessed systemic deposition was a “committed” systemic deposition, i.e., an estimate of the total amount of activity that would eventually reach systemic compartments. The calculated depositions did not address the time post intake at which the maximum systemic deposition might be expected, nor the amount of activity that might be retained in the body at various times post intake. Once the committed systemic deposition was calculated, its value was assumed to remain constant for the worker’s life. The percentage of the MPBB was used to indicate the degree of compliance (or noncompliance) with Atomic Energy Commission, Energy Research and Development Agency, and DOE standards for radiation protection. Initially, systemic depositions below 5% MPBB were not reported as confirmed depositions. This cutoff for recording and reporting was lowered to 1% MPBB in the 1970s. Lung dose equivalents were assessed prior to 1989 in cases where in vivo measurements had observed activity in the lung. The approach used for assessment was documented on a case-by-case basis in the specific case evaluation. Generally, the approach was to use the best available information regarding isotope ratios and estimates of lung clearance rates based on 241Am in vivo measurements, urine data, and fecal data when they were available. Lacking such data, default assumptions were used and documented in evaluations. The techniques for calculating dose were similar to those used in ICRP 2 and ICRP 10 (1969) and applied a quality factor of 10 for alpha particle emissions. The results of those lung dose estimates were compared with the long-standing 15-rem/yr limit of ICRP 2. In late 1988, the technical approach to plutonium dosimetry at Hanford changed to the dosimetry approach of ICRP 26/30 (1977/1979), incorporating the concepts of organ and tissue weighting factors to give an effective dose equivalent from specific organ doses. The alpha particle quality factor was also changed from 10 to 20, and the concepts of stochastic and deterministic (nonstochastic) dose limits were adopted. In addition, advances in

PNNL-MA-860 Chapter 8.0 Issued: January 31, 2003 Page 8.2
measurement technology and modeling improved the capabilities for plutonium dosimetry. The concept of “presystemic deposition” was introduced by Sula, Carbaugh, and Bihl (1989) for the purpose of simulating biokinetic behavior in estimating internal doses. The presystemic deposition was defined as the component(s) of an initial deposition that would ultimately translocate to the blood, regardless of the time required to translocate. A transfer rate from the initial deposition into the systemic compartment was linked with each component of the presystemic deposition. Once material from the presystemic deposition reached the systemic compartment, it was assumed to behave in accordance with the applicable biokinetic model. The presystemic deposition specifically excluded material permanently retained at the entry site or in lymphatic tissues. A further shift in internal dosimetry for plutonium occurred in 1992 with requirements to report intake magnitude in addition to dose equivalents (10 CFR 835, DOE 1992). This resulted in a shift away from presystemic deposition assessments (which ignored intake fractions not retained, such as the material exhaled immediately following inhalation) to the total intake assessment. The adoption of the CINDY computer code (Strenge et al. 1992) as the principal calculational tool for Hanford internal dosimetry facilitated this shift to intake assessment.
8.1 Sources and Characteristics
This section provides general information on the isotopes, mixtures, and forms of plutonium that are commonly found at Hanford. The physical data were taken directly from, or calculated based on, information in ICRP 30 and ICRP 38 (1983).
8.1.1 Sources of Plutonium
Production of plutonium was the original mission for Hanford. It was produced by irradiation of uranium fuel elements in reactors in the 100 Areas, then separated and purified in the 200 Area chemical processing facilities. After purification, it underwent conversion to final metallic form at the Plutonium Finishing Plant (PFP [234-5Z Building]) in the 200-West Area, where it was stored until it was shipped to other DOE sites for component fabrication. Plutonium-contaminated waste is buried or stored in a variety of waste management facilities. Trace plutonium and americium levels can be found in some of the high-level waste storage facilities (e.g., 100-K Spent Fuel Storage Basins, 200 Area tank farms and associated facilities).

Issued: January 31, 2003 PNNL-MA-860 Chapter 8.0 Page 8.3
Plutonium can also be found at Hanford as a result of research projects that involved spent fuel associated with nuclear power plants, breeder reactor applications, and radioisotope applications. Many of these research projects were in 300 Area facilities. Analytical chemistry laboratories may contain plutonium standard solutions.
Plutonium has also been distributed in the worldwide environment at very low levels as a result of atmospheric testing of nuclear devices. Wrenn, Singh, and Xue (1994) indicated that persons living in the northern hemisphere have accumulated about 3 pCi of 239+240Pu from fallout from the weapons tests of the 1950s, and reported a background mean urine excretion of 3 to 8 Η 10-5 dpm/day resulting from that body burden. Similar levels of body burden have been reported by McInroy et al. (1979); McInroy, Boyd, and Eutsler (1981); and Nelson, Thomas, and Kathren (1993). Ibrahim et al. (1999) reported a mean 239Pu urine excretion rate of 1.1 µBq/d (9.2Η10-5 dpm/d) in a group of long-term residents near the Rocky Flats Site. These body burdens and the urine results suggest that normal background urinary excretion levels of plutonium are far below the nominal 0.02 dpm minimum detectable activity routinely available for Hanford urine bioassay measurements.
8.1.2 Isotope Decay Data
The plutonium and plutonium decay product isotopes of concern at Hanford and selected decay data are listed in Table 8.1. The radiological constants given in Table 8.1 are taken or calculated from data in ICRP 30 and 38.
Table 8.1. Plutonium and Americium Decay Data
Half-Life Decay Constant Specific Activity
Isotope Decay Mode Years Days Year-1 Day-1 Ci/g 238Pu Alpha 87.7 3.20E+04 7.90E-03 2.16E-05 1.71E+01 239Pu Alpha 24,065 8.78E+06 2.88E-05 7.89E-08 6.21E-02 240Pu Alpha 6,537 2.39E+06 1.06E-04 2.90E-07 2.27E-01 241Pu Beta 14.4 5.26E+03 4.81E-02 1.32E-04 1.03E+02 242Pu Alpha 376,300 1.37E+08 1.84E-06 5.05E-09 3.92E-03
241Am Alpha 432.2 1.58E+05 1.60E-03 4.39E-06 3.43E+00

PNNL-MA-860 Chapter 8.0 Issued: January 31, 2003 Page 8.4
8.1.3 Reference Isotope Mixtures
Pure isotopes of plutonium are seldom encountered at Hanford facilities. Instead, plutonium is usually encountered as a mixture of isotopes. For specific exposure situations where the isotopic composition of a mixture is known, that composition should be used for dosimetry purposes. In situations where mixtures are unknown, or for bioassay planning purposes, assumptions regarding the mixture should be made. The isotopic composition of a plutonium mixture is related to several variables, including the following:
• the length of time fuel was irradiated (fuel exposure or burn-up time)
• the time since irradiation (cooling time)
• the time since processing of fuel or purification of plutonium.
Typically, plutonium at Hanford falls into one of two generic mixtures. These mixtures are defined by the weight percent (wt%) of 240Pu. Thus, 6% plutonium has a nominal 240Pu content of 6 wt% and 12% plutonium has a nominal 240Pu content of 12 wt%. The 6% plutonium mixture is commonly referred to as “weapons grade” because that was the nominal target mixture for nuclear weapons components. Weapons-grade plutonium had a relatively short reactor exposure time. The 12% plutonium mixture is commonly referred to at Hanford as “fuel grade,” and resulted from lengthier reactor exposure for research or power production purposes. Plutonium mixtures are also associated with the much longer fuel cycle of large-scale power production reactors. The spent fuel from the power reactor fuel cycle demonstrates a significant buildup of 240Pu, e.g., 25 wt% would not be an unusual number. This form of plutonium can be associated with Hanford research projects involving commercial fuel, such as the Nuclear Waste Vitrification Project (NWVP), circa 1970s.
Other isotopic compositions may be encountered and should be addressed as needed. In a discussion of the manufacture of plutonium, the DOE Standard Guide of Good Practices for Occupational Radiological Protection in Plutonium Facilities (DOE 1998) identified isotopic mixtures for heat source, weapons-grade and reactor-grade plutonium mixtures. The weapons-grade mixture is similar to the Hanford weapons-grade mixture, and the reactor-grade mixture is similar to the NWVP mixture described

Issued: January 31, 2003 PNNL-MA-860 Chapter 8.0 Page 8.5
above. In the internal dosimetry section of that standard, the Hanford weapons grade and fuel-grade mixtures are specifically listed as example mixtures. The heat-source mixture refers to material used for radioisotope thermal generators, which are primarily 238Pu. Heat-source plutonium is not a typical Hanford mixture. Reference Hanford plutonium mixtures, prior to any 241Am ingrowth, are provided in Table 8.2. These reference mixtures are approxima-tions based on the isotopic composition of a number of batches of freshly processed plutonium and are not intended to represent any specific batch. Actual exposures may or may not reflect these compositions. When the actual composition of a mixture to which a worker has been exposed can be obtained, such data should be used.
Table 8.2. Reference Hanford Plutonium Mixtures Prior to Aging (wt%)
Isotope Weapons Grade Fuels Grade Commercial Power Grade
238Pu 0.05 0.10 1 239Pu 93.1 84.8 55 240Pu 6.0 12.0 26 241Pu 0.8 3.0 13 242Pu 0.05 0.1 5
241Am 0.0 0.0 0.0
In the typical plutonium mixture, the plutonium-alpha activity is relatively constant over time due to the long decay half-life of the alpha emitters. The plutonium-beta activity (241Pu) decays with a 14-year half-life into 241Am. Thus, over a period of years, plutonium-beta activity in a mixture will decrease while at the same time the 241Am activity and the total alpha activity of the mixture will increase. Serial decay relationships can be used to estimate the activity of each isotope for any decay time. A hand-calculator program developed at Hanford by Rittman (1984) and written into a computer utility for personal computers (PCs)(a) is used to solve these decay relationships, which can also be solved using computer spreadsheet application software. Tables 8.3, 8.4, and 8.5 provide the specific activities of each isotope in the reference mixtures and isotope ratios relative to 239+240Pu and 241Am. These tables clearly show that 242Pu is an insignificant contributor to the specific activity of the reference mixtures, and may be ignored for purposes of dosimetry.
(a) Personal correspondence between P. D. Rittman and E. H. Carbaugh, 1993, Pacific Northwest
National Laboratory.

PNN
L-MA
-860 Chapter 8.0
Issued: January 31, 2003
Page 8.6
Table 8.3. Activity Composition of Hanford Reference Weapons-Grade Plutonium Mixture
Mixture Designation: Fresh 5-Year 10-Year 15-Year 20-Year 25-Year 30-Year 40-Year 50-Year Years of Aging: 0 5 10 15 20 25 30 40 50 Specific Activity in Mixture (Ci/g)
238Pu 8.56E-03 8.23E-03 7.91E-03 7.60E-03 7.31E-03 7.03E-03 6.75E-03 6.24E-03 5.77E-03 239Pu 5.77E-02 5.77E-02 5.77E-02 5.77E-02 5.77E-02 5.77E-02 5.77E-02 5.76E-02 5.76E-02 240Pu 1.36E-02 1.36E-02 1.36E-02 1.36E-02 1.36E-02 1.36E-02 1.36E-02 1.35E-02 1.35E-02 241Pu 8.24E-01 6.48E-01 5.09E-01 4.00E-01 3.15E-01 2.48E-01 1.95E-01 1.20E-01 7.44E-02 242Pu 1.97E-06 1.97E-06 1.97E-06 1.97E-06 1.97E-06 1.97E-06 1.97E-06 1.97E-06 1.97E-06 241Am 0 5.83E-03 1.04E-02 1.39E-02 1.66E-02 1.87E-02 2.03E-02 2.25E-02 2.36E-02 239+240Pu 7.13E-02 7.13E-02 7.13E-02 7.13E-02 7.12E-02 7.12E-02 7.12E-02 7.12E-02 7.11E-02 Pu-alpha 7.99E-02 7.95E-02 7.92E-02 7.89E-02 7.85E-02 7.83E-02 7.80E-02 7.74E-02 7.69E-02 Total alpha 7.99E-02 8.53E-02 8.96E-02 9.28E-02 9.52E-02 9.70E-02 9.83E-02 9.99E-02 1.01E-01
Activity Ratios
239+240Pu:241Am NA 1.22E+01 6.87E+00 5.13E+00 4.28E+00 3.80E+00 3.50E+00 3.17E+00 3.01E+00 241Am:238Pu NA 7.09E-01 1.31E+00 1.83E+00 2.27E+00 2.66E+00 3.01E+00 3.60E+00 4.09E+00 241Pu:239+240Pu 1.16E+01 9.09E+00 7.15E+00 5.62E+00 4.42E+00 3.48E+00 2.73E+00 1.69E+00 1.05E+00 Total alpha:239+240Pu 1.12E+00 1.20E+00 1.26E+00 1.30E+00 1.34E+00 1.36E+00 1.38E+00 1.40E+00 1.41E+00 Total alpha:241Am NA 1.46E+01 8.63E+00 6.67E+00 5.72E+00 5.18E+00 4.84E+00 4.45E+00 4.26E+00
NA = not applicable

Issued: January 31, 2003 PN
NL-M
A-860 C
hapter 8.0
Page 8.7
Table 8.4. Activity Composition of Hanford Reference Fuel-Grade Plutonium Mixture
Mixture Designation: Fresh 5-Year 10-Year 15-Year 20-Year 25-Year 30-Year 40-Year 50-Year Years of Aging: 0 5 10 15 20 25 30 40 50 Specific Activity in Mixture (Ci/g)
238Pu 1.71E-02 1.64E-02 1.58E-02 1.52E-02 1.46E-02 1.40E-02 1.35E-02 1.25E-02 1.15E-02 239Pu 5.26E-02 5.26E-02 5.26E-02 5.26E-02 5.26E-02 5.26E-02 5.25E-02 5.25E-02 5.25E-02 240Pu 2.72E-02 2.72E-02 2.72E-02 2.72E-02 2.72E-02 2.71E-02 2.71E-02 2.71E-02 2.71E-02 241Pu 3.09E+00 2.43E+00 1.91E+00 1.50E+00 1.18E+00 9.29E-01 7.30E-01 4.51E-01 2.79E-01 242Pu 3.93E-06 3.93E-06 3.93E-06 3.93E-06 3.93E-06 3.93E-06 3.93E-06 3.93E-06 3.93E-06 241Am 0 2.19E-02 3.89E-02 5.22E-02 6.24E-02 7.03E-02 7.63E-02 8.43E-02 8.86E-02 239+240Pu 7.98E-02 7.98E-02 7.98E-02 7.97E-02 7.97E-02 7.97E-02 7.97E-02 7.96E-02 7.96E-02 Pu-alpha 9.69E-02 9.62E-02 9.56E-02 9.49E-02 9.43E-02 9.37E-02 9.32E-02 9.21E-02 9.11E-02 Total alpha 9.69E-02 1.18E-01 1.35E-01 1.47E-01 1.57E-01 1.64E-01 1.69E-01 1.76E-01 1.80E-01
Activity Ratios
239+240Pu:241Am NA 3.64E+00 2.05E+00 1.53E+00 1.28E+00 1.13E+00 1.04E+00 9.45E-01 8.98E-01 241Am:238Pu NA 1.33E+00 2.46E+00 3.43E+00 4.27E+00 5.01E+00 5.65E+00 6.76E+00 7.69E+00 241Pu:239+240Pu 3.87E+01 3.05E+01 2.40E+01 1.88E+01 1.48E+01 1.17E+01 9.17E+00 5.67E+00 3.51E+00 Total alpha:239+240Pu 1.21E+00 1.48E+00 1.69E+00 1.84E+00 1.97E+00 2.06E+00 2.13E+00 2.21E+00 2.26E+00 Total alpha:241Am NA 5.40E+00 3.45E+00 2.82E+00 2.51E+00 2.33E+00 2.22E+00 2.09E+00 2.03E+00
NA = not applicable

PNN
L-MA
-860 Chapter 8.0
Issued: January 31, 2003
Page 8.8
Table 8.5. Activity Composition of Hanford Reference Commercial Power-Grade Plutonium Mixture
Mixture Designation: Fresh 5-Year 10-Year 15-Year 20-Year 25-Year 30-Year 40-Year 50-Year Years of Aging: 0 5 10 15 20 25 30 40 50 Specific Activity in Mixture (Ci/g)
238Pu 1.71E-01 1.65E-01 1.58E-01 1.52E-01 1.46E-01 1.41E-01 1.35E-01 1.25E-01 1.15E-01 239Pu 3.41E-02 3.41E-02 3.41E-02 3.41E-02 3.41E-02 3.41E-02 3.41E-02 3.41E-02 3.41E-02 240Pu 5.90E-02 5.89E-02 5.89E-02 5.89E-02 5.89E-02 5.88E-02 5.88E-02 5.87E-02 5.87E-02 241Pu 1.34E+01 1.05E+01 8.28E+00 6.51E+00 5.12E+00 4.03E+00 3.17E+00 1.96E+00 1.21E+00 242Pu 1.97E-04 1.97E-04 1.97E-04 1.97E-04 1.97E-04 1.97E-04 1.97E-04 1.97E-04 1.97E-04 241Am 0 9.49E-02 1.69E-01 2.26E-01 2.70E-01 3.04E-01 3.31E-01 3.65E-01 3.84E-01 239+240Pu 9.31E-02 9.31E-02 9.30E-02 9.30E-02 9.29E-02 9.29E-02 9.29E-02 9.28E-02 9.27E-02 Pu-alpha 2.65E-01 2.58E-01 2.52E-01 2.45E-01 2.39E-01 2.34E-01 2.28E-01 2.18E-01 2.08E-01 Total alpha 2.65E-01 3.53E-01 4.20E-01 4.71E-01 5.10E-01 5.38E-01 5.59E-01 5.83E-01 5.92E-01
Activity Ratios
239+240Pu:241Am NA 9.81E-01 5.51E-01 4.11E-01 3.44E-01 3.05E-01 2.81E-01 2.54E-01 2.41E-01 241Am:238Pu NA 5.76E-01 1.07E+00 1.49E+00 1.85E+00 2.17E+00 2.45E+00 2.92E+00 3.33E+00 241Pu:239+240Pu 1.44E+02 1.13E+02 8.91E+01 7.00E+01 5.51E+01 4.33E+01 3.41E+01 2.11E+01 1.30E+01 Total alpha:239+240Pu 2.84E+00 3.79E+00 4.52E+00 5.07E+00 5.48E+00 5.79E+00 6.02E+00 6.28E+00 6.39E+00 Total alpha:241Am NA 3.72E+00 2.49E+00 2.09E+00 1.89E+00 1.77E+00 1.69E+00 1.60E+00 1.54E+00
NA = not applicable

Issued: January 31, 2003 PNNL-MA-860 Chapter 8.0 Page 8.9
For each reference mixture, a family of curves can be developed to describe the changing activity relationships between isotopes (see Figures 8.1 through 8.4). These curves can then be used to identify, for dosimetry purposes, the plutonium mixture and its approximate age after processing or purification. When information about isotopic composition or activity ratios is lacking, assumptions must be made for dose assessment. Hanford internal dosimetry applications of these curves were developed by Sula, Carbaugh, and Bihl (1989; 1991) for freshly separated and 5-year aged conditions of 6% Pu and 12% Pu. Since that time, production of plutonium at Hanford has ceased and mixtures have continued to age. Thus, presentations of such relationships for freshly irradiated or separated plutonium mixtures are no longer needed, while the need for data about additional mixture ages has presented itself. Consequently, this manual now uses, as the basis for bioassay program design and interpretation, reference mixtures of 10-, 20-, and 40-year-old weapons- and fuel-grade plutonium. The primary use for these reference mixtures is in the planning of bioassay monitoring frequencies and methods, and for defining the capability of the internal dosimetry program.
0
2
4
6
8
10
12
14
0 10 20 30 40 50 60
Age of Mixture (years)
Act
ivity
Rat
io (23
9 +
240 Pu
/241 A
m)
Weapons GradeFuel GradeCommercial Power Grade
Figure 8.1. 239+240Pu/241Am Activity Ratio for Hanford Reference Plutonium Mixtures

PNNL-MA-860 Chapter 8.0 Issued: January 31, 2003 Page 8.10
0
2
4
6
8
10
12
14
16
0 10 20 30 40 50 60
Age of Mixture (years)
Act
ivity
Rat
io (T
otal
Alp
ha/24
1 Am
)
Weapons GradeFuel GradeCommercial Power Grade
Figure 8.2. Total Alpha/241Am Activity Ratio for Hanford Reference Plutonium Mixtures
Figure 8.3. Total Alpha/239+240Pu Activity Ratio for Hanford Reference Plutonium Mixtures
0
1
2
3
4
5
6
7
0 10 20 30 40 50 60 Age of Mixture (years)
Weapons Grade Fuel Grade Commercial Power Grade
Act
ivity
Rat
io (T
otal
Alp
ha/2
39=2
40 P
u

Issued: January 31, 2003 PNNL-MA-860 Chapter 8.0 Page 8.11
Figure 8.4. 241Am/Total Alpha Activity Ratio for Hanford Reference Plutonium Mixtures
8.2 Biokinetic Behavior This section discusses the inhalation transportability class, internal distribution and retention, and the urinary and fecal excretion of plutonium.
8.2.1 Transportability Class The transportability classes for plutonium are similar to those used in the ICRP 30 respiratory tract model and are sometimes referred to as solubility or inhalation classes. The class designation represents the relative speed at which material is solubilized and translocated into the transfer compartment from the deep pulmonary (or alveolar) region of the lung. Classes D, W, and Y as used in this technical basis are identical to the ICRP 30 classes of the same name. The term “instantaneous uptake” is used in this technical basis to refer to the material that is essentially immediately taken up by the transfer compartment upon intake, and is typically applied to wound scenarios.
0
0.1
0.2
0.3
0.4
0.5
0.6
0.7
0 10 20 30 40 50 60 Age of Mixture (years)
Weapons Grade Fuel Grade Commercial Power Grade
241 A
m/T
otal
Alp
ha

PNNL-MA-860 Chapter 8.0 Issued: January 31, 2003 Page 8.12
The new respiratory tract model presented in ICRP publication 66 (1994a), replaced the ICRP 30 concepts of inhalation class D, W, and Y, with absorption types F, M, and S. Whereas the ICRP 30 inhalation classes described overall clearance (i.e., absorption and mechanical clearance), the ICRP 66 type refers only to the absorption characteristics (i.e., dissolution and absorption into blood). With regard to the dissolution and absorption rates, the ICRP 30 classes D, W, and Y correspond to the characteristics of ICRP 66 types F, M, and S, respectively. Although Hanford has not adopted the ICRP 66 respiratory tract model, the use of the absorption types as a supplemental concept to the ICRP 30 inhalation classes may be useful, particularly with the application of newly published solubility studies or animal study data. Unless specifically indicated, the chemical forms assigned to the ICRP 30 classes can be assumed to be assigned to the corresponding ICRP 66 absorption types (and vice versa). The transportability of plutonium varies greatly depending on the chemical form. In ICRP publication 19 (1972), plutonium oxides were identified as belonging to class Y, and other forms of plutonium (e.g., nitrates, carbonates, carbides, fluorides) were identified as most appropriately belonging to class W. It was specifically noted that no plutonium compounds were assigned to class D. This approach was essentially endorsed by ICRP publication 68 (1994b), which assigned insoluble plutonium oxides to absorption type S and unspecified compounds to type M. Caution should be used in applying these categorizations, because significant variations have been observed, as discussed below. Plutonium nitrate, as might be found in chemistry lab solutions and the early phases of plutonium finishing, was identified by ICRP 30 as class W. However, work by Moody, Stradling, and Britcher (1994) concluded that plutonium nitrate behavior was something between class W and Y, with aged nitrate residues being very simil ar to class Y. Stradling and Stather (1989) indicated that residual plutonium that has been subject to air oxidation for several years at normal room temperature and humidity may best be characterized as class Y material. Stradling and Stather studied the behavior of two dusts in rat lungs. One dust was a plutonium dioxide corrosion product of plutonium metal oxidized in air under ambient conditions (20° to 25°C and relative humidity of 60 to 70%) over a period of about 15 years. The second dust was a dry powder, process line residue consisting of an atmospherically degraded mixture of plutonium and uranium nitrates (originally 1.2M HNO3) intimately mixed and highly diluted with inactive debris, resulting from the corrosion of an experimental rig over 15 years (i.e., rust). The plutonium oxide

Issued: January 31, 2003 PNNL-MA-860 Chapter 8.0 Page 8.13
powder was found to exhibit very definite class Y behavior characteristics. The translocation rate for plutonium in the nitrate-bearing residues was about 3 times faster than for a class Y compound, but about 10 times slower than for a class W compound; i.e., the nitrate-bearing residue came closer to being class Y than class W in behavior. These findings imply that dry, residual plutonium contamination within facilities and gloveboxes should be treated as class Y material regardless of its original chemical form. Designation of plutonium as a class W material should be limited to current processes generating nitrates or residuals from recent runs of such processes. Plutonium worker bioassay programs should consider the potential for exposure to aged plutonium oxides if there is any source of old residual contamination. La Bone et al. (1992) identified a circumstance in which a 238Pu-oxide inhalation case appeared to exhibit biokinetic behavior more characteristic of a class D material. This characteristic for 238Pu has been informally discussed among internal dosimetrists and radiation protection staff for years. One explanation for it is that the alpha particle recoil from decay of the very high specific activity 238Pu may serve to break down the matrix to forms readily absorbed by blood. In addition to classes D, W, and Y, the possibility of a super class Y (super Y) form has been identified. Super Y was defined by the HIDP in 1988 to describe highly nontransportable forms of plutonium based on some actual observed cases at Hanford (Bihl et al. 1988; Carbaugh, Bihl, and Sula 1991). For general discussion of inhalation exposures, super Y material has been defined as being similar to class Y material with respect to compartment deposition fractions in the ICRP 30 respiratory tract model. However, retention half-lives for the transport from the lung to the blood (ICRP 30 lung compartments a, c, e, and i) have been adjusted from 500 days to 10,000 days, representing the highly insoluble (i.e., very slow dissolution rate) of the super class Y material. The 500-day clearance half-time of ICRP 30 lung compartment g was left unchanged, representing particle clearance from the pulmonary region by mechanical processes not affected by the highly insoluble nature of super class Y material. The precise nature of super class Y material is not known, although it appears to have been associated with processes involving high-fired plutonium oxides. The phenomenon has been informally verified by dosimetry personnel at Rocky Flats, Savannah River, and Los Alamos sites, and is supported in the literature by Foster (1991). When combinations of transportability classes may exist in a matrix, the transportability of the mixture is assumed to be that of the predominant material. For example, in a plutonium oxide matrix

PNNL-MA-860 Chapter 8.0 Issued: January 31, 2003 Page 8.14
containing americium oxide as an ingrown impurity, the transport-ability of the americium oxide is assumed to be the same as that of the major mass constituent of the matrix (Eidson 1980). Thus, the americium is assumed to exhibit the class Y behavior of the host matrix (plutonium oxide), rather than the class W behavior normally expected of americium oxide. The above-described behavior would not be the case if the mixture were merely a blend of the two oxide powders. In this latter case, each element would be expected to exhibit its own characteristic behavior. These assumptions are also consistent with the observations by Stradling and Stather (1989). The wide range of transportability for plutonium compounds, and its variability from the standard ICRP recommendations, emphasizes the importance of addressing the uniqueness of individual workers and exposure circumstances when dealing with known intakes. When limited information is available, the Hanford practice is to use class W for exposure to plutonium nitrate solutions (e.g., wet solutions, trace contaminants in high-level waste tanks) and class Y for oxides involving either high-firing or room temperature oxidation processes. Super class Y is not routinely used as a default program design form. Based on personal communication with a Hanford soil chemist,(a) plutonium in soil is assumed to be class Y unless the plutonium came from a recent release of plutonium nitrate (class W). Plutonium nitrate converts to the hydroxide form in the soil and oxides of plutonium are stable unless the soil is acidified (pH<5).
8.2.2 Gastrointestinal Uptake to Blood (f1 Factor) The uptake of plutonium from the gastrointestinal (GI) tract is quite small and is dependent on its chemical form. The fraction of material taken up by the blood from the total in the GI tract is called the f1 factor. In ICRP 30 Part 4 (1988), the ICRP recommended that 10-5 be used for oxides of plutonium, 10-4 for nitrates, and 10-3 for other compounds. In ICRP 56 (1989), the 10-3 value was used for adult members of the public. Based on additional published studies, ICRP 67 (1993) recommended a value of 5 × 10⁻⁴ for unknown forms. This recommendation was adopted in ICRP 68 (1994b) for occupational exposures to all other compounds of plutonium except nitrate (10-4) and oxide (10-5). However, the tabulated plutonium dose coefficients in ICRP 68 showed the use of 5 × 10⁻⁴ for type M, rather than the nitrate value. For application to worker monitoring programs, ICRP 78 (1997) retained the ICRP 68 values for ingestion, and used 10-5 for inhalation of type S compounds (insoluble oxides) and used 5× 10⁻⁴ for inhalation of Type M compounds (unspecified compounds). No specific f1 factor was identified for nitrates.
(a) Conversation between D. A. Cataldo and D. E. Bihl, 1995.

Issued: January 31, 2003 PNNL-MA-860 Chapter 8.0 Page 8.15
For Hanford plutonium internal dose applications, the f1 factors of ICRP 78 are preferred, unless otherwise specified. The type M factor (5× 10⁻⁴) is applied to inhalation class W material, and the type S factor (1× 10⁻⁵) is applied to class Y forms. Ingestion intakes will use the f1 factors specified in ICRP 78, namely, 1 × 10⁻⁴ for nitrates, 1× 10⁻⁵ for oxides, and 5× 10⁻⁴ for other compounds.
8.2.3 Distribution and Retention in Systemic Organs and Tissues The ICRP 30 Part 4 model is used for calculating the distribution and retention of plutonium in the body. For dissolved (ionic form) plutonium reaching the transfer compartment (i.e., the blood stream), this ICRP model distributes 45% to the bone surfaces from which it clears with a biological half-time of 50 years, and 45% to the liver from which it clears with a biological half-time of 20 years. The activity deposited in bone is assumed to be deposited uniformly over bone surfaces of both cortical and trabecular bone, where it remains until it decays or is excreted. A small fraction is permanently retained in the gonads (0.035% for testes and 0.011% for ovaries). Although the translocated fractions for testes and ovaries differ, the gonadal dose equivalent for males and females is identical. This is attributed to the substantially differing masses of the two organs, with the result that the alpha activity concentration within the tissues, and therefore the tissue doses, are the same. The remaining 10% is assumed to go directly to excretion and any short-term holdup in the tissues of the circulatory or urinary systems. For purposes of dosimetry, this fraction is considered to be an insignificant contributor to effective dose equivalent (relative to bone, red marrow, liver, and gonad dose contributors), and is ignored. The shift to the ICRP 30 Part 4 model from the ICRP 48 (1986) model used since 1988 is based on the better agreement with human autopsy data, as initially reported by Sula et al. (1987) and addressed in greater depth by Kathren (1993). Consideration was given to newer models such as the USTUR model presented by Kathren, and the recycling models used in ICRP publications 56 (1989) and 67 (1993). The USTUR plutonium model is thought by HIDP staff to be a more technically correct model, however it could not be fully implemented using the standard resources currently available to the HIDP (notably, the CINDY computer code). Comparison of dose estimates based on the ICRP 30 Part 4 model and the USTUR model were performed by the HIDP as part of this technical basis development, and showed that the USTUR model resulted in committed doses ranging up to 20% lower than those provided using
PNNL-MA-860 Chapter 8.0 Issued: January 31, 2003 Page 8.16
the ICRP 30 Part 4 model. The recycling models could not be implemented at all using the current standard tools of the HIDP and thus were not considered to be viable options.
8.2.4 Urinary Excretion The NCRP, in its Report 84 (NCRP 1985), states that, “interpretation of excretion data for purposes of body burden estimation should be based on models derived with that application primarily in mind. The models of ICRP 30 and ICRP 48 (1986) were derived for the estimation of organ dose and were not necessarily intended to account for excretion.” In recognition of this, the HIDP has selected the Jones function (Jones 1985) to relate the urine excretion of plutonium to systemic uptake. The Jones function is based on human injection studies originally reported by Langham et al. (1950) and Langham (1956), and follow-up work by Rundo et al. (1976) and Moss and Gautier (1985). The studies involved direct intravenous injection of plutonium citrate. The application of the function to observed excretion data results in an estimate of the uptake of plutonium by systemic circulation. The Jones function models urinary excretion of plutonium following systemic uptake as a four-component exponential function. Jones emphasized that his function was an empirical fit to human data and should not be interpreted as modeling retention in specifically identifiable compartments. Thus, its application at Hanford is limited to estimating uptake and predicting excretion based on uptake. It is specifically not being used for organ dose calculations. The Jones function is a four-component exponential sum, mathematically defined as
( )
t0000284.05t00380.05
t0442.04t558.03u
e1042.1e1055.8
e1039.2e1075.4te−−−−
−−−−
×+×
+×+×= (8.1)
where eu(t) is the fraction of uptake to blood excreted in urine on day t, and t is the days post uptake (note: t = 0 is time of uptake; t = 1 represents the first 24 hours following uptake; t = 2 represents the second day post uptake; etc.). The Jones excretion function described above replaced the Langham and Healy (Healy 1957) functions for evaluating plutonium depositions at Hanford. Further discussion of this change can be

Issued: January 31, 2003 PNNL-MA-860 Chapter 8.0 Page 8.17
found in the Hanford Radiation Protection Historical Files of the Radiation Records Library.(a) The effective date for this change was November 1986. The Jones excretion function has also been applied to material that is not readily transportable to the systemic compartment through the use of one or more isolated presystemic compartments, initially containing all of the material that will ultimately become systemic uptake. Each presystemic compartment clears to the systemic compartment by an associated fractional transfer rate using simple first-order kinetics. The PUCALC computer program was developed by the HIDP to calculate presystemic depositions and urinary excretion based on a single pre-systemic-to-systemic uptake transfer rate. The program allows for fits of various combinations of transfer rate and presystemic deposition estimates to urine data and is particularly useful in cases involving substantial excretion data, where multiple presystemic components may be identifiable. The evaluation process is described in Section 8.5.
8.2.5 Fecal Excretion The excretion of bile to the GI tract provides a pathway for systemic excretion of plutonium to feces from the liver. Few data are available to quantify this pathway relative to urine, however the assumption of an equal amount excreted from the systemic compartment by way of feces and urine is not uncommon. For inhalation intakes, the fecal excretion is typically dominated by clearance from the respiratory tract, even at long-times post intake for class Y forms.
8.3 Internal Dosimetry Factors This section contains factors that are useful in making internal dosimetry calculations. The factors included in this section are derived from the CINDY computer code and incorporate the models and assumptions described in the preceding section. Their application is intended for those circumstances where such assumptions are appropriate or more specific information is lacking. Variation from these factors is appropriate if sufficient data are available.
(a) Carbaugh, E. H., and M. J. Sula. 1986. Proposed Change to Plutonium Excretion Function Used for
Hanford Internal Dosimetry. Letter Report to the Hanford Radiation Protection Historical Files, December 11, 1986, Pacific Northwest Laboratory, Richland, Washington.

PNNL-MA-860 Chapter 8.0 Issued: January 31, 2003 Page 8.18
8.3.1 Intake Retention and Excretion Fractions The intake retention (or excretion) fraction expresses the fraction of intake retained in a particular compartment or excreted by a particular pathway (urine or feces) at a given time post intake. Although excretion implies elimination rather than retention, conventional models include excretion compartments under the general term retention and use the term “intake retention fraction” (IRF) to describe both. IRFs for various times post intake are tabulated as described below for 239Pu. These values are also suitable for other isotopes of plutonium, with appropriate correction for different radiological half-lives. Lung retention fractions for the class W, class Y, and super class Y inhalations of 1-µm and 5-µm AMAD particles of 239Pu are tabulated in Table 8.6 and plotted in Figure 8.5. Urine excretion fractions for an instantaneous uptake, acute inhalations, and acute ingestions of 239Pu are shown in Table 8.7 and Figure 8.6. Tabulated values for fecal excretion factors are shown in Table 8.8 and Figure 8.7. Values for days other than those tabulated here can be obtained by interpolation between the tabulated data, or by obtaining the values directly from the CINDY computer code. The ratio of fecal to urinary excretion is shown for these same intakes in Table 8.9 and Figure 8.8. This latter table may be useful for identifying the appropriate type of intake for unknown circumstances, if sufficient data are obtained.
8.3.2 Dose Coefficients Dose coefficients, expressed as committed dose equivalent per unit activity of intake (rem per nanocurie of acute intake or rem per nanocurie per day of chronic intake), are a convenient shortcut to estimating doses based on standard assumptions when the magnitude of an intake is known or assumed. Acute intake dose coefficients have been tabulated in this section for instantaneous uptake, class W, Y, and super class Y inhalations (for both 1-µm and 5-µm-AMAD particle sizes) and for ingestion. These dose coefficients were all derived using the CINDY computer code. Dose coefficients for single isotopes are shown in Tables 8.10 through 8.13. In the case of 241Pu, the 241Am ingrown from the time of intake is included in Table 8.12. The 241Am values tabulated in Table 8.13 assume that behavior is characteristic of plutonium; i.e., the plutonium biokinetic model is used for americium because the americium is considered trapped in a plutonium matrix, which limits its behavior to that of the predominant matrix. Dose coefficients have been derived for intakes of some mixtures representing the

Issued: January 31, 2003 PNNL-MA-860 Chapter 8.0 Page 8.19
Table 8.6. Lung Retention for 1-µm and 5-µm-AMAD Particles Plutonium Inhalation Intake (fraction of intake)
Class W Class Y Super Class Y Days Post
Intake 1-µm 5-µm 1-µm 5-µm 1-µm 5-µm 0 0.33 0.17 0.33 0.17 0.33 0.17 1 0.21 0.075 0.21 0.077 0.21 0.078 2 0.18 0.063 0.18 0.064 0.18 0.065 5 0.15 0.051 0.15 0.054 0.15 0.055 7 0.14 0.049 0.15 0.053 0.15 0.054
14 0.13 0.044 0.15 0.052 0.15 0.053 30 0.10 0.036 0.15 0.051 0.15 0.052 60 0.070 0.025 0.14 0.050 0.14 0.051 90 0.048 0.017 0.14 0.048 0.14 0.049
180 0.015 0.0053 0.12 0.044 0.13 0.046 365 0.0014 4.80E-04 0.10 0.036 0.11 0.039 730 1.10E-05 3.90E-06 0.073 0.026 0.086 0.031
1,825 insig. insig. 0.029 0.010 0.057 0.020 3,600 insig. insig. 0.0096 0.0034 0.048 0.017 7,300 insig. insig. 0.0042 0.0015 0.042 0.015
18,250 insig. insig. 0.0037 0.0013 0.029 0.010
0.001
0.01
0.1
1
1 10 100 1000 10000 100000
Days Post Intake
Inta
ke R
eten
tion
Frac
tion
1-um Class W5-um Class W1-um Class Y5-um Class Y1-um Super Class Y5-um Super Class Y
Figure 8.5. 239Pu Lung Retention

PNNL-MA-860 Chapter 8.0 Issued: January 31, 2003 Page 8.20
Table 8.7. 239Pu Urine Excretion Fractions for Instantaneous Uptake, Inhalation, and Ingestion Intakes
Class W Inhalation Class Y Inhalation Super Class Y
Inhalation Ingestion Days Post
Intake Instantaneous
Uptake 1-µm 5-µm 1-µm 5-µm 1-µm 5-µm f1=5E-04 f1=1E-05 1 3.0E-03 2.2E-04 3.5E-04 1.2E-05 2.5E-05 1.7E-08 2.8E-08 1.7E-06 3.4E-08 2 1.9E-03 1.4E-04 2.2E-04 7.3E-06 1.6E-05 1.9E-08 2.7E-08 1.0E-06 2.1E-08 5 5.8E-04 4.6E-05 6.9E-05 2.4E-06 4.9E-06 1.5E-08 1.5E-08 3.1E-07 6.2E-09 7 3.7E-04 3.1E-05 4.4E-05 1.6E-06 3.1E-06 1.4E-08 1.3E-08 1.9E-07 3.8E-09
14 2.3E-04 2.2E-05 2.8E-05 1.1E-06 1.9E-06 1.5E-08 1.3E-08 1.1E-07 2.3E-09 30 1.5E-04 1.7E-05 2.0E-05 8.5E-07 1.4E-06 1.8E-08 1.5E-08 7.7E-08 1.5E-09 60 9.9E-05 1.3E-05 1.4E-05 7.1E-07 9.3E-07 2.2E-08 1.7E-08 5.0E-08 9.9E-10 90 7.9E-05 1.1E-05 1.1E-05 6.9E-07 7.9E-07 2.5E-08 2.0E-08 4.0E-08 8.0E-10
180 5.7E-05 8.3E-06 8.1E-06 7.2E-07 6.5E-07 3.2E-08 2.5E-08 2.9E-08 5.8E-10 365 3.5E-05 4.8E-06 4.9E-06 8.0E-07 5.2E-07 4.2E-08 3.2E-08 1.8E-08 3.5E-10 730 1.9E-05 2.5E-06 2.6E-06 8.9E-07 4.4E-07 5.3E-08 4.0E-08 9.6E-09 2.0E-10
1,825 1.4E-05 1.6E-06 1.8E-06 8.8E-07 4.0E-07 7.6E-08 5.3E-08 6.8E-09 1.3E-10 3,600 1.3E-05 1.5E-06 1.7E-06 7.4E-07 3.5E-07 1.1E-07 7.3E-08 6.4E-09 1.3E-10 7,300 1.2E-05 1.4E-06 1.5E-06 6.1E-07 2.9E-07 1.7E-07 1.1E-07 5.8E-09 1.2E-10
18,250 8.4E-06 1.0E-06 1.1E-06 4.4E-07 2.1E-07 3.1E-07 1.6E-07 4.2E-09 8.4E-11
1.0E-11
1.0E-10
1.0E-09
1.0E-08
1.0E-07
1.0E-06
1.0E-05
1.0E-04
1.0E-03
1.0E-02
1 10 100 1000 10000 100000
Days Post Intake
Urin
e Ex
cret
ion
Frac
tion
Instantaneous Uptake1-um Class W5-um Class W1-um Class Y5-um Class Y1-um Super Class Y5-um Super Class YSoluble IngestionInsoluble Ingestion
Figure 8.6. 239Pu Urinary Excretion

Issued: January 31, 2003 PNNL-MA-860 Chapter 8.0 Page 8.21
Table 8.8. 239Pu Fecal Excretion Fractions for Instantaneous Uptake, Inhalation, and Ingestion Intakes
Class W Inhalation Class Y Inhalation Super Class Y
Inhalation Ingestion Days Post
Intake Instantaneous
Uptake 1-µm 5-µm 1-µm 5-µm 1-µm 5-µm f1=5E-04 f1=1E-05 1 3.0E-03 1.1E-01 2.2E-01 1.3E-01 2.5E-01 1.3E-01 2.5E-01 4.7E-01 4.7E-01 2 1.9E-03 1.3E-01 2.6E-01 1.6E-01 2.9E-01 1.6E-01 2.9E-01 2.8E-01 2.8E-01 5 5.8E-04 2.3E-02 3.1E-02 2.4E-02 3.4E-02 2.4E-02 3.4E-02 1.8E-02 1.8E-02 7 3.7E-04 6.3E-03 5.6E-03 5.4E-03 5.7E-03 5.4E-03 5.7E-03 2.5E-03 2.5E-03
14 2.3E-04 1.2E-03 4.6E-04 1.7E-04 6.5E-05 1.7E-04 6.3E-05 2.4E-06 2.3E-06 30 1.5E-04 9.6E-04 3.5E-04 1.3E-04 4.8E-05 1.3E-04 4.7E-05 7.7E-08 1.5E-09 60 9.9E-05 6.3E-04 2.3E-04 1.3E-04 4.6E-05 1.3E-04 4.5E-05 5.0E-08 9.9E-10 90 7.9E-05 4.2E-04 1.6E-04 1.2E-04 4.4E-05 1.2E-04 4.3E-05 4.0E-08 8.0E-10
180 5.7E-05 1.3E-04 4.9E-05 1.1E-04 3.9E-05 1.1E-04 3.8E-05 2.9E-08 5.8E-10 365 3.5E-05 1.4E-05 8.1E-06 8.5E-05 3.0E-05 8.4E-05 3.0E-05 1.8E-08 3.5E-10 730 1.9E-05 2.5E-06 2.6E-06 5.1E-05 1.8E-05 5.1E-05 1.8E-05 9.6E-09 2.0E-10
1,825 1.4E-05 1.6E-06 1.8E-06 1.2E-05 4.3E-06 1.1E-05 4.0E-06 6.8E-09 1.3E-10 3,600 1.3E-05 1.5E-06 1.7E-06 1.6E-06 6.6E-07 9.9E-07 3.8E-07 6.4E-09 1.3E-10 7,300 1.2E-05 1.5E-06 1.5E-06 6.2E-07 3.0E-07 1.8E-07 1.1E-07 5.8E-09 1.2E-10
18,250 8.4E-06 1.0E-06 1.1E-06 4.4E-07 2.1E-07 3.1E-07 1.6E-07 4.2E-09 8.4E-11
1.0E-11
1.0E-10
1.0E-09
1.0E-08
1.0E-07
1.0E-06
1.0E-05
1.0E-04
1.0E-03
1.0E-02
1.0E-01
1.0E+00
1 10 100 1000 10000 100000
Days Post Intake
Feca
l Exc
retio
n Fr
actio
n
Instantaneous Uptake1-um Class W5-um Class W1-um Class Y5-um Class Y1-um Super Class Y5-um Super Class YSoluble IngestionInsoluble Ingestion
Figure 8.7. 239Pu Fecal Excretion

PNNL-MA-860 Chapter 8.0 Issued: January 31, 2003 Page 8.22
Table 8.9. Fecal-to-Urine Ratios for 239Pu Intakes
Class W Inhalation Class Y Inhalation Super Class Y
Inhalation Ingestion Days Post
Intake Instantaneous
Uptake 1-µm 5-µm 1-µm 5-µm 1-µm 5-µm f1=5E-4 f1=1E-5 1 1.0E+00 5.0E+02 6.3E+02 1.1E+04 1.0E+04 7.6E+06 8.9E+06 2.8E+05 1.4E+07 2 1.0E+00 9.3E+02 1.2E+03 2.2E+04 1.8E+04 8.4E+06 1.1E+07 2.8E+05 1.3E+07 5 1.0E+00 5.0E+02 4.5E+02 1.0E+04 6.9E+03 1.6E+06 2.3E+06 5.8E+04 2.9E+06 7 1.0E+00 2.0E+02 1.3E+02 3.4E+03 1.8E+03 3.9E+05 4.4E+05 1.3E+04 6.6E+05
14 1.0E+00 5.5E+01 1.6E+01 1.5E+02 3.4E+01 1.1E+04 4.8E+03 2.2E+01 1.0E+03 30 1.0E+00 5.6E+01 1.8E+01 1.5E+02 3.4E+01 7.2E+03 3.1E+03 1.0E+00 1.0E+00 60 1.0E+00 4.8E+01 1.6E+01 1.8E+02 4.9E+01 5.9E+03 2.6E+03 1.0E+00 1.0E+00 90 1.0E+00 3.8E+01 1.5E+01 1.7E+02 5.6E+01 4.8E+03 2.2E+03 1.0E+00 1.0E+00
180 1.0E+00 1.6E+01 6.0E+00 1.5E+02 6.0E+01 3.4E+03 1.5E+03 1.0E+00 1.0E+00 365 1.0E+00 2.9E+00 1.7E+00 1.1E+02 5.8E+01 2.0E+03 9.4E+02 1.0E+00 1.0E+00 730 1.0E+00 1.0E+00 1.0E+00 5.7E+01 4.1E+01 9.6E+02 4.5E+02 1.0E+00 1.0E+00
1,825 1.0E+00 1.0E+00 1.0E+00 1.4E+01 1.1E+01 1.4E+02 7.5E+01 1.0E+00 1.0E+00 3,600 1.0E+00 1.0E+00 1.0E+00 2.1E+00 1.9E+00 9.0E+00 5.2E+00 1.0E+00 1.0E+00 7,300 1.0E+00 1.0E+00 1.0E+00 1.0E+00 1.0E+00 1.1E+00 1.0E+00 1.0E+00 1.0E+00
18,250 1.0E+00 1.0E+00 1.0E+00 1.0E+00 1.0E+00 1.0E+00 1.0E+00 1.0E+00 1.0E+00
1.0E-01
1.0E+00
1.0E+01
1.0E+02
1.0E+03
1.0E+04
1.0E+05
1.0E+06
1.0E+07
1 10 100 1000 10000 100000
Days Post Intake
Feca
l:Urin
e Ex
cret
ion
Rat
io
Instantaneous Uptake1-um Class W5-um Class W1-um Class Y5-um Class Y1-um Super Class Y5-um Super Class YSoluble IngestionInsoluble Ingestion
Figure 8.8. Feces-to-Urine Excretion Ratios for 239Pu Intakes

Issued: January 31, 2000
PNN
L-MA
-860 Chapter 8.0
Page 8.23
Table 8.10. Committed Dose Coefficients for Acute Intakes of 238Pu (rem/nCi)
Class W Inhalation Class Y Inhalation Super Class Y Inhalation Ingestion
Organ or Tissue Instantaneous
Uptake 1-µm 5-µm 1-µm 5-µm 1-µm 5-µm f1=5E-04 f1=1E-05 Effective 3.2E+00 4.0E-01 4.3E-01 2.9E-01 1.2E-01 5.1E-01 1.9E-01 1.6E-03 5.0E-05 Bone Surface 5.9E+01 7.1E+00 7.8E+00 2.7E+00 1.4E+00 7.3E-01 4.4E-01 2.9E-02 5.9E-04 Red Marrow 4.7E+00 5.7E-01 6.3E-01 2.2E-01 1.1E-01 5.9E-02 3.5E-02 2.4E-03 4.7E-05 Liver 1.1E+01 1.3E+00 1.4E+00 5.1E-01 2.5E-01 1.5E-01 8.8E-02 5.4E-03 1.1E-04 Lung 3.2E-05 6.7E-02 2.4E-02 1.2E+00 4.1E-01 3.9E+00 1.4E+00 1.6E-08 3.2E-10 Gonads 8.6E-01 1.0E-01 1.1E-01 3.9E-02 2.0E-02 9.7E-03 5.8E-03 4.3E-04 8.6E-06 Lower Large Intestine insig. insig. insig. insig. insig. insig. insig. 2.1E-04 2.1E-04
Table 8.11. Committed Dose Coefficients for Acute Intakes of 239Pu and/or 240Pu (rem/nCi)(a)
Class W Inhalation Class Y Inhalation Super Class Y Inhalation Ingestion Organ or Tissue
Instantaneous Uptake 1-µm 5-µm 1-µm 5-µm 1-µm 5-µm f1=5E-04 f1=1E-05
Effective 3.6E+00 4.4E-01 4.8E-01 3.1E-01 1.3E-01 5.5E-01 2.1E-01 1.8E-03 5.2E-05 Bone Surface 6.7E+01 8.0E+00 8.8E+00 3.1E+00 1.6E+00 9.0E-01 5.3E-01 3.3E-02 6.7E-04 Red Marrow 5.2E+00 6.2E-01 6.8E-01 2.4E-01 1.2E-01 6.9E-02 4.1E-02 2.6E-03 5.2E-05 Liver 1.2E+01 1.4E+00 1.5E+00 5.6E-01 2.8E-01 1.8E-01 1.0E-01 5.8E-03 1.2E-04 Lung 2.9E-05 6.1E-02 2.2E-02 1.1E+00 4.0E-01 4.1E+00 1.5E+00 1.4E-08 2.9E-10 Gonads 9.8E-01 1.2E-01 1.3E-01 4.5E-02 2.5E-02 1.2E-02 7.1E-03 4.9E-04 9.8E-06 Lower Large Intestine insig. insig. insig. insig. insig. insig. insig. 1.9E-04 1.9E-04 (a) 239Pu and 240Pu are dosimetrically equivalent.

PNN
L-MA
-860 Chapter 8.0
Issued: January 31, 2000
Page 8.24
Table 8.12. Committed Dose Coefficients for Acute Intakes of 241Pu (rem/nCi)
Class W Inhalation Class Y Inhalation Super Class Y Inhalation Ingestion Organ or Tissue
Instantaneous Uptake 1-µm 5-µm 1-µm 5-µm 1-µm 5-µm f1=5E-04 f1=1E-05
Effective 6.9E-02 8.3E-03 9.1E-03 5.0E-03 2.2E-03 1.1E-02 4.2E-03 3.5E-05 7.7E-07 Bone Surface 1.3E+00 1.6E-01 1.7E-01 6.6E-02 3.2E-02 2.3E-02 1.3E-02 6.5E-04 1.3E-05 Red Marrow 1.0E-01 1.2E-02 1.3E-02 5.2E-03 2.5E-03 1.8E-03 1.0E-03 5.1E-05 1.0E-06 Liver 2.0E-01 2.4E-02 2.7E-02 1.1E-02 5.3E-03 4.5E-03 2.6E-03 1.0E-04 2.0E-06 Lung 1.7E-06 2.7E-05 9.7E-06 1.2E-02 4.1E-03 7.9E-02 2.8E-02 8.3E-10 1.7E-11 Gonads 2.1E-02 2.5E-03 2.8E-03 1.0E-03 5.0E-04 3.1E-04 1.8E-04 1.1E-05 2.1E-07 Lower Large Intestine insig. insig. insig. insig. insig. insig. insig. 9.7E-07 9.8E-07
Table 8.13. Committed Dose Coefficients for Acute Intakes of 241Am in a Plutonium Matrix (rem/nCi)
Class W Inhalation Class Y Inhalation Super Class Y Inhalation Ingestion Organ or Tissue
Instantaneous Uptake 1-µm 5-µm 1-µm 5-µm 1-µm 5-µm f1=5E-04 f1=1E-05
Effective 3.7E+00 4.5E-01 4.9E-01 3.2E-01 1.4E-01 5.8E-01 2.2E-01 1.9E-03 5.5E-05 Bone Surface 6.7E+01 8.1E+00 8.9E+00 3.1E+00 1.6E+00 8.9E-01 5.3E-01 3.4E-02 6.7E-04 Red Marrow 5.3E+00 6.3E-01 7.0E-01 2.5E-01 1.2E-01 7.0E-02 4.1E-02 2.6E-03 5.3E-05 Liver 1.2E+01 1.4E+00 1.6E+00 5.8E-01 2.9E-01 1.8E-01 1.1E-01 6.0E-03 1.2E-04 Lung 1.2E-04 6.7E-02 2.4E-02 1.2E+00 4.4E-01 4.4E+00 1.6E+00 6.3E-08 2.8E-10 Gonads 1.0E+00 1.2E-01 1.3E-01 4.6E-02 2.3E-02 1.2E-02 7.2E-03 5.0E-04 1.0E-05 Lower Large Intestine insig. insig. insig. insig. insig. insig. insig. 2.2E-04 2.2E-04

Issued: January 31, 2003 PNNL-MA-860 Chapter 8.0 Page 8.25
types of plutonium most typically encountered at Hanford. The dose coefficients are tabulated in Table 8.14 for weapons-grade plutonium and in Table 8.15 for fuel-grade plutonium. The mixtures are weapons-grade and fuel-grade plutonium aged 10 years, 20 years, and 40 years. For each of these mixtures, dose coefficients have been tabulated for instantaneous uptake, and class W, Y, and super class Y inhalations of 1-µm- and 5-µm-AMAD particles. Previous HIDP documentation (Sula, Carbaugh, and Bihl 1989; 1991) provided dose coefficients for fresh and 5-year aged weapons and fuel-grade mixtures for instantaneous uptake and inhalation of 1-µm-AMAD particles. As discussed in Section 8.2, the retention model used for the super class Y form is highly speculative and subject to great uncertainty. The super class Y dose coefficients are intended for comparison with other more widely accepted models, rather than confident dosimetry. Reference mixture dose coefficients have not been provided for ingestion intakes, because ingestion has not historically been considered a significant mode of occupational exposure, due to extremely low GI tract uptake of plutonium. If an ingestion intake occurs, the dose to significant organs can be calculated using the CINDY computer code, or using the individual nuclide dose coefficients for ingestion listed in Tables 8.10 through 8.13.
8.3.3 Cumulative Dose Equivalents The cumulative dose equivalent from an intake through various times post intake is sometimes of interest with regard to tenaciously retained radionuclides. The most commonly referenced cumulative dose for occupational exposure is the committed dose equivalent through a 50-year period following an intake. The cumulative effective dose equivalents (expressed as a percentage of the 50-year committed effective dose equivalent) through various times post intake are shown in Table 8.16 for 239Pu class W, Y, and super Y inhalation intakes of 1-µm-AMAD particles. Cumulative dose equivalents for other forms of plutonium or other time intervals can be readily obtained from the CINDY computer code. Cumulative doses are of principal interest with regard to potential biological effects, because they represent the dose received through a time interval, as opposed to a projected dose expected to be received in the future from an intake.

PNNL-MA-860 Chapter 8.0 Issued: January 31, 2003 Page 8.26
Table 8.14. Committed Dose Coefficients for Acute Intakes of Weapons-Grade Plutonium (rem/nCi)(a)
Class W Inhalation Class Y Inhalation Super Class Y
Inhalation Organ or Tissue
Instant Uptake 1-µm 5-µm 1-µm 5-µm 1-µm 5-µm
10-Year Aged Weapons-Grade Mixture Effective 4.0E+00 4.8E-01 5.0E-01 3.4E-01 1.4E-01 6.1E-01 2.3E-01 Bone Surface 7.4E+01 8.8E+00 9.7E+00 3.4E+00 1.8E+00 1.0E+00 6.0E-01 Red Marrow 5.7E+00 6.8E-01 6.8E-01 2.7E-01 1.3E-01 7.8E-02 4.6E-02 Liver 1.3E+01 1.5E+00 1.7E+00 6.2E-01 3.1E-01 2.0E-01 1.1E-01 Lung insig. 6.2E-02 2.2E-02 1.2E+00 4.3E-01 4.6E+00 1.7E+00 Gonads 1.1E+00 1.3E-01 1.4E-01 5.0E-02 3.0E-02 1.4E-02 8.6E-03 20-Year Aged Weapons-Grade Mixture Effective 3.8E+00 4.7E-01 4.8E-01 3.3E-01 1.4E-01 5.9E-01 2.2E-01 Bone Surface 7.1E+01 8.5E+00 9.3E+00 3.3E+00 1.7E+00 9.6E-01 5.7E-01 Red Marrow 5.5E+00 6.6E-01 6.1E-01 2.6E-01 1.3E-01 7.4E-02 4.4E-02 Liver 1.3E+01 1.5E+00 1.6E+00 6.0E-01 3.0E-01 1.9E-01 1.1E-01 Lung insig. 6.3E-02 2.3E-02 1.2E+00 4.2E-01 4.4E+00 1.6E+00 Gonads 1.0E+00 1.3E-01 1.4E-01 4.8E-02 2.9E-02 1.3E-02 8.5E-03 40-Year Aged Weapons-Grade Mixture Effective 3.7E+00 4.5E-01 4.6E-01 3.2E-01 1.3E-01 5.7E-01 2.2E-01 Bone Surface 6.8E+01 8.2E+00 9.0E+00 3.2E+00 1.6E+00 9.1E-01 5.4E-01 Red Marrow 5.3E+00 6.3E-01 5.6E-01 2.5E-01 1.2E-01 7.1E-02 4.2E-02 Liver 1.2E+01 1.4E+00 1.5E+00 5.7E-01 2.9E-01 1.8E-01 1.0E-01 Lung insig. 6.3E-02 2.3E-02 1.1E+00 4.1E-01 4.3E+00 1.5E+00 Gonads 1.0E+00 1.2E-01 1.3E-01 4.6E-02 2.8E-02 1.2E-02 8.3E-03 (a) nCi of total alpha activity in mixture.
8.3.4 Comparison of Published Dosimetry Factors
A comparison of dosimetry factors, including dose coefficients, annual limits on intake (ALIs), and derived air concentrations (DACs) published in several sources is shown in Table 8.17. For Hanford applications, the DAC values of 10 CFR 835 Appendix A are typically used to control facility operations.
8.3.5 Derived Reference Levels Unlike other radionuclides, such as 137Cs or 90Sr, derived bioassay reference levels are of little value for plutonium. The 239Pu intake that would correspond to a 10-mrem screening level is only 0.02 nCi for a class W inhalation, and a 0.2 nCi intake would correspond to an

Issued: January 31, 2003 PNNL-MA-860 Chapter 8.0 Page 8.27
Table 8.15. Committed Dose Coefficients for Acute Intakes of Hanford Fuel-Grade Plutonium Mixtures (rem/nCi)(a)
Class W Inhalation Class Y Inhalation Super Class Y
Inhalation Organ or Tissue
Instant Uptake 1-µm 5-µm 1-µm 5-µm 1-µm 5-µm
10-Year Aged Fuel-Grade Mixture Effective 4.6E+00 5.6E-01 6.1E-01 3.8E-01 1.6E-01 7.1E-01 2.7E-01 Bone Surface 8.5E+01 1.0E+01 1.1E+01 4.0E+00 2.0E+00 1.2E+00 7.0E-01 Red Marrow 6.6E+00 7.9E-01 8.6E-01 3.1E-01 1.5E-01 9.4E-02 5.5E-02 Liver 1.5E+01 1.8E+00 1.9E+00 7.2E-01 3.5E-01 2.4E-01 1.4E-01 Lung insig. 6.4E-02 2.3E-02 1.3E+00 4.7E-01 5.3E+00 1.9E+00 Gonads 1.3E+00 1.5E-01 1.7E-01 5.9E-02 2.9E-02 1.6E-02 9.5E-03 20-Year Aged Fuel-Grade Mixture Effective 4.1E+00 5.0E-01 5.5E-01 3.5E-01 1.5E-01 6.4E-01 2.4E-01 Bone Surface 7.6E+01 9.2E+00 1.0E+01 3.6E+00 1.8E+00 1.1E+00 6.2E-01 Red Marrow 5.9E+00 7.1E-01 7.8E-01 2.8E-01 1.4E-01 8.2E-02 4.8E-02 Liver 1.3E+01 1.6E+00 1.7E+00 6.5E-01 3.2E-01 2.1E-01 1.2E-01 Lung insig. 6.4E-02 2.3E-02 1.2E+00 4.5E-01 4.8E+00 1.7E+00 Gonads 1.1E+00 1.4E-01 1.5E-01 5.2E-02 2.6E-02 1.4E-02 8.4E-03 40-Year Aged Fuel-Grade Mixture Effective 3.8E+00 4.6E-01 5.0E-01 3.3E-01 1.4E-01 5.9E-01 2.2E-01 Bone Surface 7.0E+01 8.4E+00 9.2E+00 3.2E+00 1.7E+00 9.4E-01 5.6E-01 Red Marrow 5.5E+00 6.5E-01 7.2E-01 2.6E-01 1.3E-01 7.3E-02 4.3E-02 Liver 1.2E+01 1.5E+00 1.6E+00 5.9E-01 3.0E-01 1.9E-01 1.1E-01 Lung insig. 6.4E-02 2.3E-02 1.2E+00 4.3E-01 4.4E+00 1.6E+00 Gonads 1.0E+00 1.2E-01 1.4E-01 4.8E-02 2.4E-02 1.3E-02 7.5E-03 (a) nCi of total alpha activity in mixture.
Table 8.16. Cumulative Effective Dose Equivalent for 239Pu Intakes
Cumulative Time
Post Intake Inhalation Intake (expressed as percentage
of 50-year committed dose) Days Years Class W Class Y Super Y 90 0.25 1.7% 2.8% 1.7%
180 0.5 2.7% 5.2% 3.3% 365 1 4.3% 10% 6.1% 730 2 7.1% 17% 11%
1825 5 15% 30% 20% 3650 10 28% 43% 32% 7300 20 50% 60% 53%
18,250 50 100% 100% 100%

PNNL-MA-860 Chapter 8.0 Issued: January 31, 2003 Page 8.28
Table 8.17. Comparison of Selected Published Dosimetry Factors for 239Pu
Reference Soluble Inhalation Insoluble Inhalation Dose Coefficients
Effective Dose CINDY (he,50) 0.44 rem/nCi (1-µm class W)
0.48 rem/nCi (5-µm class W) 0.31 rem/nCi (1-µm class Y) 0.13 rem/nCi (5-µm class Y)
ICRP 30 Part 4 and ICRP 54 (1988) (he,50)
1.1E-04 Sv/Bq (1-µm class W) (0.41 rem/nCi)
8.1E-05 Sv/Bq (1-µm class Y) (.30 rem/nCi)
EPA Federal Guidance Report No. 11 (he,50)
1.16E-04 Sv/Bq (1-µm class W) (0.43 rem/nCi)
8.33E-05 Sv/Bq (1-µm class Y) (0.31 rem/nCi)
ICRP 68 (1994) [e(50)] 4.7E-05 Sv/Bq (1-µm type M) (0.17 rem/nCi)
3.2E-05 Sv/Bq (5-µm type M) (0.12 rem/nCi)
1.5E-05 Sv/Bq (1-µm type S) (0.055 rem/nCi)
8.3E-06 Sv/Bq (5-µm type S) (0.030 rem/nCi)
Bone Surfaces Dose
CINDY (ht,50) 8.0 rem/nCi (1-µm class W) 8.8 rem/nCi (5-µm class W)
3.1 rem/nCi (1-µm class Y) 1.6 rem/nCi (5-µm class Y)
ICRP 30 Part 4 and ICRP 54 (1988) (he,50)
2.1E-03 Sv/Bq (1-µm class W) (7.8 rem/nCi)
8.2E-04 Sv/Bq (1-µm class Y) (3.0 rem/nCi)
EPA Federal Guidance Report No. 11 (ht,50)
2.11E-03 Sv/Bq (1-µm class W) (7.8 rem/nCi)
8.21E-04 Sv/Bq (1-µm class Y) (3.0 rem/nCi)
Derived Air Concentration (based on
bone surface dose)
10 CFR 835 Appendix A 2E-12 µCi/ml (class W) 8E-02 Bq/m3 (class W)
6E-12 µCi/ml (class Y) 2E-01 Bq/m3 (class Y)
EPA Federal Guidance Report No. 11
3E-12 µCi/ml (class W) 1E-07 MBq/m3 (class W)
7E-12 µCi/ml (class Y) 3E-07 MBq/m3 (class Y)
ICRP 30 Part 4 1E-01 Bq/m3 (class W) 3E-01 Bq/m3 (class Y)
Annual Limit on Intake (based on bone surface
dose)
ICRP 30 Part 4 2E+02 Bq (class W) 6E+02 Bq (class Y)
EPA Federal Guidance Report No. 11
2E-4 MBq (class W) 0.006 µCi (class Y)
6E-4 Bq (class Y) 0.02 µCi (class Y)

Issued: January 31, 2003 PNNL-MA-860 Chapter 8.0 Page 8.29
investigation level of 100 mrem. The associated urine excretion from these intakes is sufficiently low that a derived screening or investigation level has no practical value for routine monitoring. Likewise, a derived bioassay level for medical referral is not of practical value for routine bioassay monitoring, because such monitoring is typically done on an annual basis. Medical referral criteria have been established based on workplace indicators of potential intake, and are contained in the Hanford Internal Dosimetry Project Manual, PNL-MA-552, Chapter 7.(a) Those criteria were established based on historical Hanford experience as a good practice and not on a rigid set of technical conditions or models. The Hanford practice is to investigate all routine (periodic) urine or in vivo measurements that show indications of potential plutonium intake and to calculate doses for any confirmed intake. Thus the derived screening and investigation level concepts of calculated bioassay results against which actual measurements are compared are not applicable.
8.4 Bioassay Monitoring This section discusses the general techniques and applicability of bioassay monitoring and describes the capabilities of excreta sample bioassay and in vivo measurements. General recommendations are also provided for routine bioassay monitoring for plutonium.
8.4.1 General Techniques and Applicability Bioassay monitoring for plutonium can be provided by both radiochemistry analysis of excreta and direct in vivo measurements. The application of these techniques, and the interpretation of the resulting data, are highly dependent upon the type of plutonium to which a worker may be exposed. Although the ICRP considers plutonium to be an inhalation class W or Y compound, substantially more and less transportable forms have been observed in past Hanford cases. For this reason, bioassay guidance has been developed for instantaneous uptake, class W, Y, and super class Y compounds. The instantaneous uptake form is assumed to behave as a direct injection of plutonium into the transfer compartment. The class W and Y forms are assumed to behave according to the ICRP 30 respiratory tract model. The super Y form is defined as being identical to class Y with respect to compartment
(a) Pacific Northwest National Laboratory (PNNL). Hanford Internal Dosimetry Project Manual.
PNNL-MA-552, Richland, Washington. (Internal manual.) Available URL: http://www.pnl.gov/eshs/pub/pnnl552.html

PNNL-MA-860 Chapter 8.0 Issued: January 31, 2003 Page 8.30
deposition fractions, however the transport rate from lung to blood (lung compartments a, c, e, and i) have been adjusted for a retention half-time of 10,000 days.
8.4.2 Urine Sampling and Analysis Urine sample analysis is the standard technique for confirming and evaluating the magnitude of systemic uptakes. Uptake is required in order for material to be excreted by the urine pathway. It can also be used for estimating inhalation intakes and initial lung burdens of slowly transportable compounds; however, fecal samples and in vivo measurements are usually the preferred techniques. To reach the urine, plutonium must first reach the transfer compartment (blood) in a soluble (dissolved) form, from which it can then be removed by the kidneys through normal metabolic processes. Insoluble material in the transfer compartment is assumed not to be excreted by the urine pathway until it has been dissolved. In reviewing urine sample results, anomalous results could be indicative of urine contamination from external sources (hands, sample container, and clothing). Caution needs to be exercised when samples are obtained from workers who have recently had external contamination. The extreme sensitivity of urine sample analysis lends itself to the possibility of the sample being contaminated by trace particles well below the level that can be observed by standard personal survey and workplace control practices. This was one of the reasons why at-home sampling was originally selected for the Hanford Site in lieu of obtaining a sample at work. The typical urine sampling practice is to collect a urine sample over a specified time interval and perform a chemical separation for plutonium. This technique is followed by electroplating and quantitative alpha spectrometry. The final results are reported as 238Pu and 239Pu. The reported 239Pu result is actually the sum of the measured 239+240Pu, because alpha spectrometry systems do not have the capability to differentiate between the alpha energies for 239Pu and 240Pu decay emissions. This does not pose a significant problem because the dosimetry for the two isotopes is essentially the same. When considering the total plutonium-alpha activity of a sample, it is important to combine the 238Pu with the 239Pu results. Prior to October 1983, the Hanford radiochemistry bioassay laboratory used an autoradiography procedure instead of the electroplating/alpha spectrometry procedure. This autoradiography procedure actually measured the total plutonium-alpha activity, which was reported as 239Pu. This point should be remembered when

Issued: January 31, 2003 PNNL-MA-860 Chapter 8.0 Page 8.31
comparing sample results analyzed by autoradiography with sample results obtained from alpha spectrometry, and may help account for potential shifts in long-term data trends. The reported detection levels for historical urine sample analysis procedures at various times are shown in Table 8.18. The method used to define the detection level has changed over time, so the values in Table 8.18 are not strictly comparable with each other.
Table 8.18. Detection Limits for Routine Hanford Analyses of Plutonium in Urine
Time Period Detection Limit,
dpm/routine sample Prior to June 1949 0.66 June 1949 to Dec. 1952 0.33 Dec. 1952 to 01/28/53 0.18 01/28/53 to 03/27/53 0.15 03/27/53 to 11/07/53 0.05 11/07/53 to 12/04/53 0.07 12/53 to 05/55 0.057 05/55 to 09/55 0.027 09/55 to 10/55 0.04 10/55 to 10/01/83 0.05(a) 10/01/83 to 12/31/83 0.035 12/31/83 to 05/90 0.02 06/90 to 11/91 0.03 11/91 to present 0.02 (a) During part of this period, results that were less
than the detection limit were reported as 0.025. Special rapid analytical procedures are available for special circumstances. These procedures can be executed and results obtained in substantially shorter times than the routine procedure, but they are less sensitive. Their use is primarily for diagnostic bioassay of suspected internal contamination related to unplanned exposures (incidents). The decision to use such procedures involves consider-ing the probability and potential magnitude of the exposure. The contractual detection limit for plutonium in urine can be found in the radiochemistry bioassay laboratory statement of work available from the HIDP) and in the Hanford Internal Dosimetry Project Manual (PNL-MA-552).(a)
(a) Pacific Northwest National Laboratory (PNNL). Hanford Internal Dosimetry Project Manual.
PNNL-MA-552, Richland, Washington. (Internal manual.) Available URL: http://www.pnl.gov/eshs/pub/pnnl552.html

PNNL-MA-860 Chapter 8.0 Issued: January 31, 2003 Page 8.32
8.4.3 Fecal Sampling and Analysis Fecal samples are useful for confirming and evaluating suspected inhalation and ingestion exposures. The sample results can be used in conjunction with the ICRP 30 respiratory tract model to estimate the magnitudes of intakes and initial lung depositions as a basis for lung dose assessment. They can also be used as checks on urine- or in vivo-based estimates of intake. In addition, fecal samples can provide radionuclide identification data and isotope ratios. Fecal samples are of primary value immediately following a suspected intake, when material is rapidly clearing the respiratory and GI tracts. Long-term sampling following intake can be useful for differentiating ingestion from inhalation, and class W from class Y inhalation. It may also be of value at long times post intake as an aid to estimating residual lung burdens and isotope ratios; however substantial uncertainties exist for such applications. Most fecal excretion following an intake occurs shortly after the intake. According to the ICRP 30 respiratory tract model, approximately one-half (48%) of an intake of class Y plutonium (1-µm-AMAD particle size) would be excreted in the first 5 days following intake. Additional long-term clearance from the lung by the fecal pathway would total approximately 10% of the intake, excreted at the fractional biological clearance rate of 0.0014/day. For a 5-µm particle size, the early fecal excretion is a higher fraction of intake. Additional fecal excretion comes via the biliary pathway. This pathway represents fecal excretion from systemic deposition. While the magnitude of this pathway relative to the urine pathway has been investigated, it is not recommended that fecal excretion be used for evaluating systemic deposition. The primary reason for this is the interference that can be caused by very slight acute or chronic inhalation or ingestion exposures and the uncertainty of the magnitude of the biliary excretion relative to urinary excretion. There is no way to differentiate the source of fecal excretion (lung clearance, ingestion, or bile) when interpreting fecal sample results. For the purpose of modeling systemic excretion, it is assumed that systemic excretion is evenly distributed between the urine and biliary excretion pathways. The complications of interpreting long-term fecal excretions do not rule out their potential value, particularly if certain conditions can be met regarding their collection; notably, lack of potential additional exposure immediately prior to collection of the sample and collection of more than one sample.

Issued: January 31, 2003 PNNL-MA-860 Chapter 8.0 Page 8.33
Multiple fecal samples are recommended if the data are critical for an evaluation. Normal daily fecal excretion rates vary greatly from the 135 g/d of ICRP 23 (1974) Reference Man and can be offset to some extent by collecting consecutive samples and averaging the results. The laboratory plutonium analysis procedure for fecal samples involves wet ashing and dry ashing to destroy organic elements, redissolution to a standard volume using nitric acid, extraction of an aliquot representing 25% of the sample, additional dissolution using hydrofluoric acid, chemical separation of plutonium, followed by electroplating and alpha spectrometry. A 242Pu tracer is used for determining chemical yields. Contractual detection levels are established in the radiochemical bioassay laboratory statement of work, as approximations for the minimum detectable activity (MDA) desired for the analysis.
8.4.4 In Vivo Measurements In vivo measurement techniques suitable for plutonium applications and routinely performed at the Hanford In Vivo Radioassay and Research Facility (IVRRF) include chest counting, skeleton measurement by head counting, liver counting, and wound counting. Less common measurements include upper extremity lymph node counting (e.g., axillary lymph nodes), and a scanning lung count to identify the likelihood of a nonuniform distribution of activity in the lung (e.g., a hot particle). Most of these procedures involve measurement of the 60-keV photons from the 241Am present as an ingrown impurity in a plutonium mixture. Direct measurement of the 17-keV plutonium L x-rays is possible, but the sensitivity of the measurement is not adequate to detect most internal organ depositions. Direct measurement of plutonium in wounds can also be performed. Minimum detectable activities for these measurements are described in the In Vivo Monitoring Project Manual (PNL-MA-574)(a) and the Hanford Internal Dosimetry Program Manual (PNL-MA-552).(b) Because of the relative insensitivity of direct in vivo plutonium measurement techniques at low levels (other than for wounds), the presence of plutonium is often inferred by detection of 241Am.
(a) Pacific Northwest National Laboratory (PNNL). In Vivo Monitoring Project Manual.
PNNL-MA-574, Richland, Washington. (Internal manual.) (b) Pacific Northwest National Laboratory (PNNL). Hanford Internal Dosimetry Project Manual.
PNNL-MA-552, Richland, Washington. (Internal manual.) Available URL: http://www.pnl.gov/eshs/pub/pnnl552.html

PNNL-MA-860 Chapter 8.0 Issued: January 31, 2003 Page 8.34
Estimation of the amount of plutonium must be made using known or assumed isotope ratios. Such ratios may be obtained from workplace data (smear samples, air samples, etc.), inferred from excreta data (recognizing that fecal or urine samples may be biased by different clearance rates from the body), or from assumptions regarding material composition based on the facility and process involved. The following paragraphs briefly describe the types of in vivo measurements available at the Hanford IVRRF. Further discussion of these measurement techniques can be found in the In Vivo Monitoring Program Manual (PNL-MA-574). Chest counting is a standard measurement technique used for monitoring plutonium workers. A count is performed by placing planar germanium detectors over the subject’s chest. Because of the potential impact of chest wall thickness on measurement sensitivity, measurement corrections are made on all workers based on a height-to-weight ratio. In addition, measurements on workers with known depositions will usually be corrected based on direct measurement of chest wall thickness using ultrasound techniques. Chest measure-ment results may not represent actual lung burdens unless they have been corrected for interference from activity deposited in other organs (notably the skeleton and, to a lesser extent, the liver). When such a correction has been made the result is more correctly referred to as a lung burden estimate rather than a chest count result. Lacking such corrections, chest measurement results may conservatively be assumed to represent lung burdens, especially at short times after intake. Head counts (also called skull counts) will usually be performed when chest counts confirm detectable activity to determine if modification for skeleton activity is needed. The results of the head count are extrapolated to an estimate of the total quantity retained in the skeleton using a human skeleton calibration phantom. Head counts can also be used as an approximate check on urine-based systemic deposition estimates, recognizing that ionic americium in the blood may not behave the same as plutonium. Liver counts provide a direct estimate of activity in the liver based on the Livermore calibration phantom (Griffith et al. 1978). These counts are used to correct chest counts for interference from activity deposited in the liver and are primarily used for long-term follow-up and as an approximate check on urine-based systemic deposition estimates. They can also provide a check on the assumptions used in the computer codes for calculating committed dose equivalents.

Issued: January 31, 2003 PNNL-MA-860 Chapter 8.0 Page 8.35
Wound counts using a single planar germanium detector can directly measure plutonium and americium. Wound counts can be performed either at the Emergency Decontamination Facility (EDF) or at the IVRRF. The detection equipment is similar at both facilities, however MDAs are substantially better at the IVRRF due to the use of shielded counting rooms. The 239Pu results (based on the 17 keV L x-rays) can be significantly underestimated if the activity is deeply embedded in tissue. Upper extremity lymph node counts are used to identify potential deposition sites for non-transportable or slowly transportable material deposited in extremity wounds. These nodes include the supratracular lymph nodes located near the elbow and the axillary lymph nodes located near the armpit. The nodes are counted by placing planar germanium detectors in the lymph node region. Activity deposited in the axillary lymph nodes has the potential for interfering with chest count results. Precise calibrations for these counts are not available. Scanning lung counts are used to determine the distribution of activity deposited in the lung. By a series of counts, the extent to which activity is deposited in the tracheal-bronchial region (include-ing the lymph nodes) and the left and right pulmonary regions can be reasonably determined. The results of these counts are not likely to affect lung dose estimates, except to the extent that they shed light on the nature of the retention and potential lung dynamics. The calibration for these counts is still under development. Results may be expressed as the percentage of total lung activity in a given counting region.
8.4.5 Bioassay Monitoring Capability The bioassay monitoring capability for plutonium can be discussed as the minimum detectable intake (MDI) or minimum detectable dose (MDD) associated with a bioassay measurement at the minimum detectable activity (MDA) at some time post intake. Analyses of the MDIs and MDDs (committed effective dose equivalents and committed bone surface dose equivalent for cases where the bone surface dose was more limiting than the effective dose) have been performed for three bioassay methods (239Pu in urine, 239Pu in feces, and in vivo 241Am lung counting). These analyses included instant uptake, and class W, Y, and super class Y inhalations (1-µm and 5-µm-AMAD particles) for both weapons-grade and fuel-grade reference plutonium mixtures, aged 10, 20, and 40 years. The analyses assumed MDAs for the bioassay measure- ments to be slightly higher than those that have been observed for

PNNL-MA-860 Chapter 8.0 Issued: January 31, 2003 Page 8.36
most Hanford bioassay measurements. Thus, the stated MDIs and MDDs in the following tables are slightly higher than those expected to be achieved by routine worker monitoring. To determine the capability of bioassay of plutonium by urine analysis, the intakes of 239Pu associated with minimum detectable urine analysis results were calculated for transportable injection, and class W, Y, and super Y inhalations. These intakes are given in Table 8.19. Based on the activity ratios described in Section 8.1, the total-alpha intake was estimated for the mixtures, and the committed dose equivalents were calculated using the dose coefficients of Tables 8.14 and 8.15. The results are summarized in Tables 8.20 through 8.31 and graphically presented in Figures 8.9 through 8.20. The minimum detectable committed doses associated with 241Am detection by chest counting are shown in Tables 8.32 through 8.43 and Figures 8.21 through 8.32. The capability for plutonium fecal bioassay is addressed in a similar manner, with the 239Pu intakes compiled in Table 8.44. The corresponding minimum detectable committed effective dose equivalents are shown in Tables 8.45 through 8.56 and in Figures 8.33 through 8.44.
Table 8.19. Minimum Detectable Intakes (nCi) of 239Pu Based on Detection of 0.02 dpm/d in Urine
Class W Inhalation Class Y Inhalation Super Class Y
Inhalation Days Post Intake
Instant Uptake 1-µm 5-µm 1-µm 5-µm 1-µm 5-µm
1 3.0E-03 4.1E-02 2.6E-02 7.5E-01 3.6E-01 5.3E+02 3.2E+02 2 4.7E-03 6.4E-02 4.1E-02 1.2E+00 5.6E-01 4.7E+02 3.3E+02 5 1.6E-02 2.0E-01 1.3E-01 3.8E+00 1.8E+00 6.0E+02 6.0E+02 7 2.4E-02 2.9E-01 2.0E-01 5.6E+00 2.9E+00 6.4E+02 6.9E+02
14 3.9E-02 4.1E-01 3.2E-01 8.2E+00 4.7E+00 6.0E+02 6.9E+02 30 6.0E-02 5.3E-01 4.5E-01 1.1E+01 6.4E+00 5.0E+02 6.0E+02 60 9.1E-02 6.9E-01 6.4E-01 1.3E+01 9.7E+00 4.1E+02 5.3E+02 90 1.1E-01 8.2E-01 8.2E-01 1.3E+01 1.1E+01 3.6E+02 4.5E+02
180 1.6E-01 1.1E+00 1.1E+00 1.3E+01 1.4E+01 2.8E+02 3.6E+02 365 2.6E-01 1.9E+00 1.8E+00 1.1E+01 1.7E+01 2.1E+02 2.8E+02 730 4.7E-01 3.6E+00 3.5E+00 1.0E+01 2.0E+01 1.7E+02 2.3E+02
1,825 6.4E-01 5.6E+00 5.0E+00 1.0E+01 2.3E+01 1.2E+02 1.7E+02 3,600 6.9E-01 6.0E+00 5.3E+00 1.2E+01 2.6E+01 8.2E+01 1.2E+02 7,300 7.5E-01 6.4E+00 6.0E+00 1.5E+01 3.1E+01 5.3E+01 8.2E+01
18,250 1.1E+00 9.0E+00 8.2E+00 2.0E+01 4.3E+01 2.9E+01 5.6E+01

Issued: January 31, 2003 PNNL-MA-860 Chapter 8.0 Page 8.37
Table 8.20. Minimum Detectable Committed Effective Dose Equivalent (rem) for 10-Year Aged Weapons-Grade Plutonium Based on Detection of 0.02 dpm/d 239Pu in Urine
Class W Inhalation Class Y Inhalation Super Class Y Inhalation Days Post Intake
Instant Uptake 1-µm 5-µm 1-µm 5-µm 1-µm 5-µm
1 1.5E-02 2.5E-02 1.6E-02 3.2E-01 6.3E-02 4.1E+02 9.3E+01 2 2.4E-02 3.9E-02 2.6E-02 5.3E-01 9.9E-02 3.6E+02 9.6E+01 5 7.8E-02 1.2E-01 8.2E-02 1.6E+00 3.2E-01 4.6E+02 1.7E+02 7 1.2E-01 1.8E-01 1.3E-01 2.4E+00 5.1E-01 4.9E+02 2.0E+02
14 2.0E-01 2.5E-01 2.0E-01 3.5E+00 8.3E-01 4.6E+02 2.0E+02 30 3.0E-01 3.2E-01 2.8E-01 4.5E+00 1.1E+00 3.8E+02 1.7E+02 60 4.6E-01 4.2E-01 4.0E-01 5.4E+00 1.7E+00 3.1E+02 1.5E+02 90 5.7E-01 4.9E-01 5.1E-01 5.6E+00 2.0E+00 2.8E+02 1.3E+02
180 7.9E-01 6.5E-01 7.0E-01 5.3E+00 2.4E+00 2.2E+02 1.0E+02 365 1.3E+00 1.1E+00 1.2E+00 4.8E+00 3.0E+00 1.6E+02 8.1E+01 730 2.4E+00 2.2E+00 2.2E+00 4.3E+00 3.6E+00 1.3E+02 6.5E+01
1,825 3.2E+00 3.4E+00 3.1E+00 4.4E+00 4.0E+00 9.1E+01 4.9E+01 3,600 3.5E+00 3.6E+00 3.3E+00 5.2E+00 4.5E+00 6.3E+01 3.6E+01 7,300 3.8E+00 3.9E+00 3.8E+00 6.3E+00 5.5E+00 4.1E+01 2.4E+01
18,250 5.4E+00 5.4E+00 5.1E+00 8.7E+00 7.5E+00 2.2E+01 1.6E+01
1.0E-02
1.0E-01
1.0E+00
1.0E+01
1.0E+02
1.0E+03
1 10 100 1000 10000 100000
Days Post Intake
Com
mitt
ed E
ffect
ive
Dos
e Eq
uiva
lent
(rem
)
Uptake1-um Class W5-um Class W1-um Class Y5-um Class Y1-um Super Y5-um Super Y5-rem Dose Limit
Figure 8.9. Minimum Detectable Committed Effective Doses for 10-Year Aged Weapons-Grade Plutonium Based on Detection of 0.02 dpm/d 239Pu in Urine

PNNL-MA-860 Chapter 8.0 Issued: January 31, 2003 Page 8.38
Table 8.21. Minimum Detectable Committed Effective Dose Equivalent (rem) for 20-Year Aged Weapons-Grade Plutonium Based on Detection of 0.02 dpm/d 239Pu in Urine
Class W Inhalation Class Y Inhalation Super Class Y Inhalation Days Post
Intake Instant Uptake 1-µm 5-µm 1-µm 5-µm 1-µm 5-µm
1 1.5E-02 2.6E-02 1.7E-02 3.3E-01 6.8E-02 4.2E+02 9.5E+01 2 2.4E-02 4.1E-02 2.6E-02 5.5E-01 1.1E-01 3.7E+02 9.8E+01 5 7.9E-02 1.2E-01 8.4E-02 1.7E+00 3.4E-01 4.7E+02 1.8E+02 7 1.2E-01 1.8E-01 1.3E-01 2.5E+00 5.5E-01 5.1E+02 2.0E+02
14 2.0E-01 2.6E-01 2.1E-01 3.6E+00 8.9E-01 4.7E+02 2.0E+02 30 3.1E-01 3.3E-01 2.9E-01 4.7E+00 1.2E+00 4.0E+02 1.8E+02 60 4.6E-01 4.4E-01 4.1E-01 5.6E+00 1.8E+00 3.2E+02 1.6E+02 90 5.8E-01 5.2E-01 5.3E-01 5.8E+00 2.1E+00 2.8E+02 1.3E+02
180 8.0E-01 6.8E-01 7.2E-01 5.5E+00 2.6E+00 2.2E+02 1.1E+02 365 1.3E+00 1.2E+00 1.2E+00 5.0E+00 3.3E+00 1.7E+02 8.3E+01 730 2.4E+00 2.3E+00 2.2E+00 4.5E+00 3.8E+00 1.3E+02 6.6E+01
1,825 3.3E+00 3.5E+00 3.2E+00 4.5E+00 4.2E+00 9.4E+01 5.0E+01 3,600 3.5E+00 3.8E+00 3.4E+00 5.3E+00 4.8E+00 6.5E+01 3.6E+01 7,300 3.8E+00 4.1E+00 3.9E+00 6.5E+00 5.8E+00 4.2E+01 2.4E+01
18,250 5.5E+00 5.7E+00 5.3E+00 9.1E+00 8.0E+00 2.3E+01 1.7E+01
1.0E-02
1.0E-01
1.0E+00
1.0E+01
1.0E+02
1.0E+03
1 10 100 1000 10000 100000
Days Post Intake
Com
mitt
ed E
ffect
ive
Dos
e Eq
uiva
lent
(rem
)
Uptake1-um Class W5-um Class W1-um Class Y5-um Class Y1-um Super Y5-um Super Y5-rem Dose Limit
Figure 8.10. Minimum Detectable Committed Effective Doses for 20-Year Aged Weapons-Grade Plutonium Based on Detection of 0.02 dpm/d 239Pu in Urine

Issued: January 31, 2003 PNNL-MA-860 Chapter 8.0 Page 8.39
Table 8.22. Minimum Detectable Committed Effective Dose Equivalent (rem) for 40-Year Aged Weapons-Grade Plutonium Based on Detection of 0.02 dpm/d 239Pu in Urine
Class W Inhalation Class Y Inhalation Super Class Y Inhalation Days Post Intake
Instant Uptake 1-µm 5-µm 1-µm 5-µm 1-µm 5-µm
1 1.6E-02 2.6E-02 1.7E-02 3.4E-01 6.6E-02 4.2E+02 9.9E+01 2 2.5E-02 4.1E-02 2.6E-02 5.5E-01 1.0E-01 3.8E+02 1.0E+02 5 8.0E-02 1.2E-01 8.4E-02 1.7E+00 3.3E-01 4.8E+02 1.8E+02 7 1.3E-01 1.8E-01 1.3E-01 2.5E+00 5.3E-01 5.1E+02 2.1E+02
14 2.0E-01 2.6E-01 2.1E-01 3.7E+00 8.6E-01 4.8E+02 2.1E+02 30 3.1E-01 3.3E-01 2.9E-01 4.7E+00 1.2E+00 4.0E+02 1.8E+02 60 4.7E-01 4.4E-01 4.1E-01 5.7E+00 1.8E+00 3.3E+02 1.6E+02 90 5.9E-01 5.2E-01 5.3E-01 5.8E+00 2.1E+00 2.9E+02 1.4E+02
180 8.2E-01 6.8E-01 7.2E-01 5.6E+00 2.5E+00 2.2E+02 1.1E+02 365 1.3E+00 1.2E+00 1.2E+00 5.0E+00 3.2E+00 1.7E+02 8.7E+01 730 2.5E+00 2.3E+00 2.2E+00 4.5E+00 3.7E+00 1.4E+02 6.9E+01
1,825 3.3E+00 3.5E+00 3.2E+00 4.6E+00 4.1E+00 9.5E+01 5.2E+01 3,600 3.6E+00 3.8E+00 3.4E+00 5.4E+00 4.7E+00 6.5E+01 3.8E+01 7,300 3.9E+00 4.1E+00 3.9E+00 6.6E+00 5.7E+00 4.2E+01 2.5E+01
18,250 5.6E+00 5.7E+00 5.3E+00 9.2E+00 7.8E+00 2.3E+01 1.7E+01
1.0E-02
1.0E-01
1.0E+00
1.0E+01
1.0E+02
1.0E+03
1 10 100 1000 10000 100000
Days Post Intake
Com
mitt
ed E
ffect
ive
Dos
e Eq
uiva
lent
(rem
)
Uptake1-um Class W5-um Class W1-um Class Y5-um Class Y1-um Super Y5-um Super Y5-rem Dose Limit
Figure 8.11. Minimum Detectable Committed Effective Doses for 40-Year Aged Weapons-Grade Plutonium Based on Detection of 0.02 dpm/d 239Pu in Urine

PNNL-MA-860 Chapter 8.0 Issued: January 31, 2003 Page 8.40
Table 8.23. Minimum Detectable Committed Effective Dose Equivalent (rem) for 10-Year Aged Fuel-Grade Plutonium Based on Detection of 0.02 dpm/d 239Pu in Urine
Class W Inhalation Class Y Inhalation Super Class Y Inhalation Days Post
Intake Instant Uptake 1-µm 5-µm 1-µm 5-µm 1-µm 5-µm
1 2.3E-02 3.9E-02 2.7E-02 4.8E-01 9.7E-02 6.4E+02 1.5E+02 2 3.7E-02 6.1E-02 4.2E-02 7.9E-01 1.5E-01 5.7E+02 1.5E+02 5 1.2E-01 1.9E-01 1.3E-01 2.4E+00 5.0E-01 7.2E+02 2.7E+02 7 1.9E-01 2.8E-01 2.1E-01 3.6E+00 7.9E-01 7.7E+02 3.2E+02
14 3.0E-01 3.9E-01 3.3E-01 5.3E+00 1.3E+00 7.2E+02 3.2E+02 30 4.7E-01 5.0E-01 4.6E-01 6.8E+00 1.7E+00 6.0E+02 2.7E+02 60 7.1E-01 6.6E-01 6.6E-01 8.1E+00 2.6E+00 4.9E+02 2.4E+02 90 8.9E-01 7.8E-01 8.4E-01 8.4E+00 3.1E+00 4.3E+02 2.1E+02
180 1.2E+00 1.0E+00 1.1E+00 8.0E+00 3.7E+00 3.4E+02 1.6E+02 365 2.0E+00 1.8E+00 1.9E+00 7.2E+00 4.7E+00 2.6E+02 1.3E+02 730 3.7E+00 3.4E+00 3.6E+00 6.5E+00 5.5E+00 2.0E+02 1.0E+02
1,825 5.0E+00 5.3E+00 5.2E+00 6.6E+00 6.1E+00 1.4E+02 7.8E+01 3,600 5.4E+00 5.7E+00 5.5E+00 7.7E+00 7.0E+00 9.8E+01 5.6E+01 7,300 5.8E+00 6.1E+00 6.2E+00 9.5E+00 8.4E+00 6.4E+01 3.7E+01
18,250 8.3E+00 8.5E+00 8.4E+00 1.3E+01 1.2E+01 3.5E+01 2.6E+01
1.0E-02
1.0E-01
1.0E+00
1.0E+01
1.0E+02
1.0E+03
1 10 100 1000 10000 100000
Days Post Intake
Com
mitt
ed E
ffect
ive
Dos
e Eq
uiva
lent
(rem
)
Uptake1-um Class W5-um Class W1-um Class Y5-um Class Y1-um Super Y5-um Super Y5-rem Dose Limit
Figure 8.12. Minimum Detectable Committed Effective Doses for 10-Year Aged Fuel-Grade Plutonium Based on Detection of 0.02 dpm/d 239Pu in Urine

Issued: January 31, 2003 PNNL-MA-860 Chapter 8.0 Page 8.41
Table 8.24. Minimum Detectable Committed Effective Dose Equivalent (rem) for 20-Year Aged Fuel-Grade Plutonium Based on Detection of 0.02 dpm/d 239Pu in Urine
Class W Inhalation Class Y Inhalation Super Class Y Inhalation Days Post
Intake Instant Uptake 1-µm 5-µm 1-µm 5-µm 1-µm 5-µm
1 2.4E-02 4.0E-02 2.8E-02 5.2E-01 1.1E-01 6.7E+02 1.5E+02 2 3.8E-02 6.3E-02 4.4E-02 8.5E-01 1.7E-01 6.0E+02 1.6E+02 5 1.3E-01 1.9E-01 1.4E-01 2.6E+00 5.4E-01 7.6E+02 2.8E+02 7 2.0E-01 2.9E-01 2.2E-01 3.9E+00 8.6E-01 8.1E+02 3.3E+02
14 3.2E-01 4.0E-01 3.5E-01 5.6E+00 1.4E+00 7.6E+02 3.3E+02 30 4.9E-01 5.2E-01 4.9E-01 7.3E+00 1.9E+00 6.3E+02 2.8E+02 60 7.4E-01 6.8E-01 7.0E-01 8.7E+00 2.9E+00 5.2E+02 2.5E+02 90 9.2E-01 8.1E-01 8.9E-01 9.0E+00 3.4E+00 4.5E+02 2.1E+02
180 1.3E+00 1.1E+00 1.2E+00 8.6E+00 4.1E+00 3.5E+02 1.7E+02 365 2.1E+00 1.8E+00 2.0E+00 7.8E+00 5.1E+00 2.7E+02 1.3E+02 730 3.8E+00 3.5E+00 3.8E+00 7.0E+00 6.1E+00 2.1E+02 1.1E+02
1,825 5.2E+00 5.5E+00 5.4E+00 7.1E+00 6.7E+00 1.5E+02 8.0E+01 3,600 5.6E+00 5.9E+00 5.7E+00 8.3E+00 7.6E+00 1.0E+02 5.8E+01 7,300 6.1E+00 6.3E+00 6.5E+00 1.0E+01 9.2E+00 6.7E+01 3.9E+01
18,250 8.7E+00 8.9E+00 8.9E+00 1.4E+01 1.3E+01 3.7E+01 2.7E+01
1.0E-02
1.0E-01
1.0E+00
1.0E+01
1.0E+02
1.0E+03
1 10 100 1000 10000 100000
Days Post Intake
Com
mitt
ed E
ffect
ive
Dos
e Eq
uiva
lent
(rem
)
Uptake1-um Class W5-um Class W1-um Class Y5-um Class Y1-um Super Y5-um Super Y5-rem Dose Limit
Figure 8.13. Minimum Detectable Committed Effective Doses for 20-Year Aged Fuel-Grade Plutonium Based on Detection of 0.02 dpm/d 239Pu in Urine

PNNL-MA-860 Chapter 8.0 Issued: January 31, 2003 Page 8.42
Table 8.25. Minimum Detectable Committed Effective Dose Equivalent (rem) for 40-Year Aged Fuel-Grade Plutonium Based on Detection of 0.02 dpm/d 239Pu in Urine
Class W Inhalation Class Y Inhalation Super Class Y Inhalation Days Post
Intake Instant Uptake 1-µm 5-µm 1-µm 5-µm 1-µm 5-µm
1 2.5E-02 4.2E-02 2.8E-02 5.5E-01 1.1E-01 6.9E+02 1.6E+02 2 4.0E-02 6.5E-02 4.5E-02 9.0E-01 1.7E-01 6.2E+02 1.6E+02 5 1.3E-01 2.0E-01 1.4E-01 2.7E+00 5.7E-01 7.8E+02 2.9E+02 7 2.0E-01 3.0E-01 2.3E-01 4.1E+00 9.0E-01 8.4E+02 3.4E+02
14 3.3E-01 4.2E-01 3.6E-01 6.0E+00 1.5E+00 7.8E+02 3.4E+02 30 5.0E-01 5.4E-01 5.0E-01 7.7E+00 2.0E+00 6.5E+02 2.9E+02 60 7.6E-01 7.0E-01 7.1E-01 9.3E+00 3.0E+00 5.3E+02 2.6E+02 90 9.6E-01 8.3E-01 9.0E-01 9.5E+00 3.5E+00 4.7E+02 2.2E+02
180 1.3E+00 1.1E+00 1.2E+00 9.1E+00 4.3E+00 3.7E+02 1.8E+02 365 2.2E+00 1.9E+00 2.0E+00 8.2E+00 5.4E+00 2.8E+02 1.4E+02 730 4.0E+00 3.7E+00 3.8E+00 7.4E+00 6.3E+00 2.2E+02 1.1E+02
1,825 5.4E+00 5.7E+00 5.5E+00 7.5E+00 7.0E+00 1.5E+02 8.3E+01 3,600 5.8E+00 6.1E+00 5.9E+00 8.8E+00 8.0E+00 1.1E+02 6.0E+01 7,300 6.3E+00 6.5E+00 6.6E+00 1.1E+01 9.6E+00 6.9E+01 4.0E+01
18,250 9.0E+00 9.2E+00 9.0E+00 1.5E+01 1.3E+01 3.8E+01 2.7E+01
1.0E-02
1.0E-01
1.0E+00
1.0E+01
1.0E+02
1.0E+03
1 10 100 1000 10000 100000
Days Post Intake
Com
mitt
ed E
ffect
ive
Dos
e Eq
uiva
lent
(rem
)
Uptake1-um Class W5-um Class W1-um Class Y5-um Class Y1-um Super Y5-um Super Y5-rem Dose Limit
Figure 8.14. Minimum Detectable Committed Effective Doses for 40-Year Aged Fuel-Grade Plutonium Based on Detection of 0.02 dpm/d 239Pu in Urine

Issued: January 31, 2003 PNNL-MA-860 Chapter 8.0 Page 8.43
Table 8.26. Minimum Detectable Committed Bone Surfaces Dose Equivalent (rem) for 10-Year Aged Weapons-Grade Plutonium Based on Detection of 0.02 dpm/d 239Pu in Urine
Class W Inhalation Class Y Inhalation Days Post
Intake Instant Uptake 1-µm 5-µm 1-µm 5-µm
1 2.8E-01 4.5E-01 3.1E-01 3.2E+00 8.2E-01 2 4.4E-01 7.1E-01 5.0E-01 5.3E+00 1.3E+00 5 1.4E+00 2.2E+00 1.6E+00 1.6E+01 4.2E+00 7 2.3E+00 3.2E+00 2.5E+00 2.4E+01 6.6E+00
14 3.6E+00 4.5E+00 3.9E+00 3.5E+01 1.1E+01 30 5.6E+00 5.9E+00 5.5E+00 4.5E+01 1.5E+01 60 8.5E+00 7.7E+00 7.8E+00 5.4E+01 2.2E+01 90 1.1E+01 9.1E+00 1.0E+01 5.6E+01 2.6E+01
180 1.5E+01 1.2E+01 1.4E+01 5.3E+01 3.1E+01 365 2.4E+01 2.1E+01 2.2E+01 4.8E+01 3.9E+01 730 4.4E+01 4.0E+01 4.2E+01 4.3E+01 4.6E+01
1,825 6.0E+01 6.2E+01 6.1E+01 4.4E+01 5.1E+01 3,600 6.4E+01 6.6E+01 6.5E+01 5.2E+01 5.8E+01 7,300 7.0E+01 7.1E+01 7.3E+01 6.3E+01 7.0E+01
18,250 1.0E+02 1.0E+02 1.0E+02 8.7E+01 9.7E+01
1.0E-01
1.0E+00
1.0E+01
1.0E+02
1 10 100 1000 10000 100000
Days Post Intake
Com
mitt
ed D
ose
Equi
vale
nt (r
em)
Uptake1-um Class W5-um Class W1-um Class Y5-um Class Y50-rem Dose Limit
Figure 8.15. Minimum Detectable Bone Surface Dose for 10-Year Aged Weapons-Grade Plutonium Based on Detection of 0.02 dpm/d 239Pu in Urine

PNNL-MA-860 Chapter 8.0 Issued: January 31, 2003 Page 8.44
Table 8.27. Minimum Detectable Committed Bone Surfaces Dose Equivalent (rem) for 20-Year Aged Weapons-Grade Plutonium Based on Detection of 0.02 dpm/d 239Pu in Urine
Class W Inhalation Class Y Inhalation Days Post
Intake Instant Uptake 1-µm 5-µm 1-µm 5-µm
1 2.9E-01 4.7E-01 3.2E-01 3.3E+00 8.2E-01 2 4.5E-01 7.3E-01 5.1E-01 5.5E+00 1.3E+00 5 1.5E+00 2.2E+00 1.6E+00 1.7E+01 4.2E+00 7 2.3E+00 3.3E+00 2.6E+00 2.5E+01 6.6E+00
14 3.7E+00 4.7E+00 4.0E+00 3.6E+01 1.1E+01 30 5.7E+00 6.0E+00 5.6E+00 4.7E+01 1.5E+01 60 8.7E+00 7.9E+00 8.0E+00 5.6E+01 2.2E+01 90 1.1E+01 9.3E+00 1.0E+01 5.8E+01 2.6E+01
180 1.5E+01 1.2E+01 1.4E+01 5.5E+01 3.2E+01 365 2.4E+01 2.1E+01 2.3E+01 5.0E+01 3.9E+01 730 4.5E+01 4.1E+01 4.3E+01 4.5E+01 4.7E+01
1,825 6.1E+01 6.4E+01 6.2E+01 4.5E+01 5.1E+01 3,600 6.6E+01 6.8E+01 6.6E+01 5.3E+01 5.9E+01 7,300 7.1E+01 7.3E+01 7.5E+01 6.5E+01 7.1E+01
18,250 1.0E+02 1.0E+02 1.0E+02 9.1E+01 9.8E+01
1.0E-01
1.0E+00
1.0E+01
1.0E+02
1.0E+03
1 10 100 1000 10000 100000
Days Post Intake
Com
mitt
ed D
ose
Equi
vale
nt(r
em)
Uptake1-um Class W5-um Class W1-um Class Y5-um Class Y50-rem Dose Limit
Figure 8.16. Minimum Detectable Bone Surface Dose for 20-Year Aged Weapons-Grade Plutonium Based on Detection of 0.02 dpm/d 239Pu in Urine

Issued: January 31, 2003 PNNL-MA-860 Chapter 8.0 Page 8.45
Table 8.28. Minimum Detectable Committed Bone Surfaces Dose Equivalent (rem) for 40-Year Aged Weapons-Grade Plutonium Based on Detection of 0.02 dpm/d 239Pu in Urine
Class W Inhalation Class Y Inhalation Days Post
Intake Instant Uptake 1-µm 5-µm 1-µm 5-µm
1 2.9E-01 4.7E-01 3.2E-01 3.4E+00 8.1E-01 2 4.5E-01 7.4E-01 5.2E-01 5.5E+00 1.3E+00 5 1.5E+00 2.2E+00 1.6E+00 1.7E+01 4.1E+00 7 2.3E+00 3.3E+00 2.6E+00 2.5E+01 6.5E+00
14 3.7E+00 4.7E+00 4.1E+00 3.7E+01 1.1E+01 30 5.7E+00 6.1E+00 5.7E+00 4.7E+01 1.4E+01 60 8.7E+00 8.0E+00 8.1E+00 5.7E+01 2.2E+01 90 1.1E+01 9.4E+00 1.0E+01 5.8E+01 2.6E+01
180 1.5E+01 1.2E+01 1.4E+01 5.6E+01 3.1E+01 365 2.5E+01 2.2E+01 2.3E+01 5.0E+01 3.9E+01 730 4.5E+01 4.1E+01 4.4E+01 4.5E+01 4.6E+01
1,825 6.1E+01 6.5E+01 6.3E+01 4.6E+01 5.0E+01 3,600 6.6E+01 6.9E+01 6.7E+01 5.4E+01 5.8E+01 7,300 7.1E+01 7.4E+01 7.6E+01 6.6E+01 7.0E+01
18,250 1.0E+02 1.0E+02 1.0E+02 9.2E+01 9.6E+01
1.0E-01
1.0E+00
1.0E+01
1.0E+02
1.0E+03
1 10 100 1000 10000 100000
Days Post Intake
Com
mitt
ed D
ose
Equi
vale
nt(r
em)
Uptake1-um Class W5-um Class W1-um Class Y5-um Class Y50-rem Dose Limit
Figure 8.17. Minimum Detectable Bone Surface Dose for 40-Year Aged Weapons-Grade Plutonium Based on Detection of 0.02 dpm/d 239Pu in Urine

PNNL-MA-860 Chapter 8.0 Issued: January 31, 2003 Page 8.46
Table 8.29. Minimum Detectable Committed Bone Surfaces Dose Equivalent (rem) for 10-Year Aged Fuel-Grade Plutonium Based on Detection of 0.02 dpm/d 239Pu in Urine
Class W Inhalation Class Y Inhalation Days Post
Intake Instant Uptake 1-µm 5-µm 1-µm 5-µm
1 4.3E-01 6.9E-01 4.8E-01 5.1E+00 1.2E+00 2 6.8E-01 1.1E+00 7.6E-01 8.3E+00 1.9E+00 5 2.2E+00 3.3E+00 2.4E+00 2.5E+01 6.2E+00 7 3.5E+00 4.9E+00 3.8E+00 3.8E+01 9.8E+00
14 5.6E+00 6.9E+00 6.0E+00 5.5E+01 1.6E+01 30 8.6E+00 9.0E+00 8.4E+00 7.2E+01 2.2E+01 60 1.3E+01 1.2E+01 1.2E+01 8.6E+01 3.3E+01 90 1.6E+01 1.4E+01 1.5E+01 8.8E+01 3.9E+01
180 2.3E+01 1.8E+01 2.1E+01 8.5E+01 4.7E+01 365 3.7E+01 3.2E+01 3.4E+01 7.6E+01 5.9E+01 730 6.8E+01 6.1E+01 6.4E+01 6.8E+01 6.9E+01
1,825 9.2E+01 9.5E+01 9.3E+01 6.9E+01 7.6E+01 3,600 1.0E+02 1.0E+02 9.9E+01 8.2E+01 8.7E+01 7,300 1.1E+02 1.1E+02 1.1E+02 1.0E+02 1.1E+02
18,250 1.5E+02 1.5E+02 1.5E+02 1.4E+02 1.5E+02
1.0E-01
1.0E+00
1.0E+01
1.0E+02
1.0E+03
1 10 100 1000 10000 100000
Days Post Intake
Com
mitt
ed D
ose
Equi
vale
nt (r
em)
Uptake1-um Class W5-um Class W1-um Class Y5-um Class Y50-rem Dose Limit
Figure 8.18. Minimum Detectable Bone Surface Dose for 10-Year Aged Fuel-Grade Plutonium Based on Detection of 0.02 dpm/d 239Pu in Urine

Issued: January 31, 2003 PNNL-MA-860 Chapter 8.0 Page 8.47
Table 8.30. Minimum Detectable Committed Bone Surfaces Dose Equivalent (rem) for 20-Year Aged Fuel-Grade Plutonium Based on Detection of 0.02 dpm/d 239Pu in Urine
Class W Inhalation Class Y Inhalation Days Post
Intake Instant Uptake 1-µm 5-µm 1-µm 5-µm
1 4.5E-01 7.4E-01 5.1E-01 5.3E+00 1.3E+00 2 7.1E-01 1.2E+00 8.1E-01 8.8E+00 2.0E+00 5 2.3E+00 3.5E+00 2.6E+00 2.7E+01 6.5E+00 7 3.6E+00 5.3E+00 4.0E+00 4.0E+01 1.0E+01
14 5.9E+00 7.4E+00 6.3E+00 5.8E+01 1.7E+01 30 9.0E+00 9.6E+00 8.9E+00 7.5E+01 2.3E+01 60 1.4E+01 1.3E+01 1.3E+01 9.0E+01 3.4E+01 90 1.7E+01 1.5E+01 1.6E+01 9.3E+01 4.0E+01
180 2.4E+01 2.0E+01 2.2E+01 8.9E+01 4.9E+01 365 3.9E+01 3.4E+01 3.6E+01 8.0E+01 6.1E+01 730 7.1E+01 6.5E+01 6.8E+01 7.2E+01 7.3E+01
1,825 9.6E+01 1.0E+02 9.9E+01 7.3E+01 8.0E+01 3,600 1.0E+02 1.1E+02 1.0E+02 8.6E+01 9.1E+01 7,300 1.1E+02 1.2E+02 1.2E+02 1.0E+02 1.1E+02
18,250 1.6E+02 1.6E+02 1.6E+02 1.5E+02 1.5E+02
1.0E-01
1.0E+00
1.0E+01
1.0E+02
1.0E+03
1 10 100 1000 10000 100000
Days Post Intake
Com
mitt
ed D
ose
Equi
vale
nt(r
em)
Uptake1-um Class W5-um Class W1-um Class Y5-um Class Y50-rem Dose Limit
Figure 8.19. Minimum Detectable Bone Surface Dose for 20-Year Aged Fuel-Grade Plutonium Based on Detection of 0.02 dpm/d 239Pu in Urine

PNNL-MA-860 Chapter 8.0 Issued: January 31, 2003 Page 8.48
Table 8.31. Minimum Detectable Committed Bone Surfaces Dose Equivalent (rem) for 40-Year Aged Fuel-Grade Plutonium Based on Detection of 0.02 dpm/d 239Pu in Urine
Class W Inhalation Class Y Inhalation Days Post
Intake Instant Uptake 1-µm 5-µm 1-µm 5-µm
1 4.6E-01 7.6E-01 5.2E-01 5.3E+00 1.4E+00 2 7.3E-01 1.2E+00 8.3E-01 8.7E+00 2.1E+00 5 2.4E+00 3.6E+00 2.7E+00 2.7E+01 6.9E+00 7 3.8E+00 5.4E+00 4.2E+00 4.0E+01 1.1E+01
14 6.1E+00 7.6E+00 6.5E+00 5.8E+01 1.8E+01 30 9.3E+00 9.8E+00 9.2E+00 7.5E+01 2.4E+01 60 1.4E+01 1.3E+01 1.3E+01 9.0E+01 3.6E+01 90 1.8E+01 1.5E+01 1.7E+01 9.2E+01 4.3E+01
180 2.4E+01 2.0E+01 2.3E+01 8.8E+01 5.2E+01 365 4.0E+01 3.5E+01 3.7E+01 8.0E+01 6.5E+01 730 7.3E+01 6.7E+01 7.0E+01 7.2E+01 7.7E+01
1,825 1.0E+02 1.0E+02 1.0E+02 7.2E+01 8.5E+01 3,600 1.1E+02 1.1E+02 1.1E+02 8.5E+01 9.7E+01 7,300 1.2E+02 1.2E+02 1.2E+02 1.0E+02 1.2E+02
18,250 1.7E+02 1.7E+02 1.7E+02 1.4E+02 1.6E+02
1.0E-01
1.0E+00
1.0E+01
1.0E+02
1.0E+03
1 10 100 1000 10000 100000
Days Post Intake
Com
mitt
ed D
ose
Equi
vale
nt(r
em)
Uptake1-um Class W5-um Class W1-um Class Y5-um Class Y50-rem Dose Limit
Figure 8.20. Minimum Detectable Bone Surface Dose for 40-Year Aged Fuel-Grade Plutonium Based on Detection of 0.02 dpm/d 239Pu in Urine

Issued: January 31, 2003 PNNL-MA-860 Chapter 8.0 Page 8.49
Table 8.32. Minimum Detectable Committed Effective Dose Equivalent (rem) for 10-Year Aged Weapons-Grade Plutonium Based on Detection of 0.16 nCi 241Am in the Lungs
Days Post Class W Inhalation Class Y Inhalation Super Class Y Inhalation
Intake 1-um 5-um 1-um 5-um 1-um 5-um 0 2.0E+00 4.2E+00 1.4E+00 1.2E+00 2.6E+00 1.9E+00 1 3.1E+00 9.2E+00 2.2E+00 2.5E+00 3.9E+00 4.1E+00 2 3.7E+00 1.1E+01 2.6E+00 3.0E+00 4.6E+00 4.9E+00 5 4.5E+00 1.4E+01 3.0E+00 3.6E+00 5.4E+00 5.8E+00 7 4.8E+00 1.4E+01 3.2E+00 3.7E+00 5.4E+00 5.9E+00 14 5.1E+00 1.5E+01 3.2E+00 3.7E+00 5.7E+00 5.9E+00 30 6.4E+00 1.9E+01 3.2E+00 3.7E+00 5.7E+00 6.0E+00 60 9.4E+00 2.8E+01 3.2E+00 3.9E+00 5.7E+00 6.1E+00 90 1.4E+01 4.0E+01 3.4E+00 3.9E+00 6.1E+00 6.3E+00
180 4.3E+01 1.3E+02 3.6E+00 4.2E+00 6.5E+00 6.7E+00 365 4.5E+02 1.3E+03 4.2E+00 5.0E+00 7.0E+00 7.5E+00 730 5.1E+04 1.5E+05 5.6E+00 6.6E+00 8.9E+00 9.0E+00
1,825 8.3E+09 2.1E+10 1.2E+01 1.4E+01 1.1E+01 1.2E+01 3,600 1.9E+10 1.2E+12 3.0E+01 3.5E+01 1.1E+01 1.2E+01 7,300 2.6E+11 2.5E+11 5.7E+01 6.8E+01 1.0E+01 1.1E+01
18,250 5.1E+12 1.0E+12 5.4E+01 6.2E+01 1.2E+01 1.3E+01
1
10
100
1000
10000
1 10 100 1000 10000 100000
Days Post Intake
Com
mitt
ed E
ffec
tive
Dos
e E
quiv
alen
t (r
em)
1-um Class W5-um Class W1-um Class Y5-um Class Y1-um Super Y5-um Super Y5-rem Dose Limit
Figure 8.21. Minimum Detectable Committed Effective Doses for 10-Year Aged Weapons-Grade Plutonium Based on Detection of 0.16 nCi 241Am in the Lungs

PNNL-MA-860 Chapter 8.0 Issued: January 31, 2003 Page 8.50
Table 8.33. Minimum Detectable Committed Effective Dose Equivalent (rem) for 20-Year Aged Weapons-Grade Plutonium Based on Detection of 0.16 nCi 241Am in the Lungs
Days Post Class W Inhalation Class Y Inhalation Super Class Y Inhalation
Intake 1-um 5-um 1-um 5-um 1-um 5-um 0 1.3E+00 2.6E+00 9.1E-01 7.7E-01 1.6E+00 1.2E+00 1 2.0E+00 5.9E+00 1.4E+00 1.7E+00 2.5E+00 2.5E+00 2 2.4E+00 7.0E+00 1.7E+00 2.0E+00 3.0E+00 3.2E+00 5 3.0E+00 8.6E+00 2.0E+00 2.4E+00 3.5E+00 3.7E+00 7 3.1E+00 9.0E+00 2.0E+00 2.4E+00 3.6E+00 3.7E+00
14 3.4E+00 9.8E+00 2.0E+00 2.5E+00 3.6E+00 3.8E+00 30 4.2E+00 1.2E+01 2.0E+00 2.5E+00 3.6E+00 3.8E+00 60 6.3E+00 1.8E+01 2.1E+00 2.6E+00 3.8E+00 4.0E+00 90 9.0E+00 2.6E+01 2.2E+00 2.6E+00 3.9E+00 4.0E+00 180 2.8E+01 8.2E+01 2.4E+00 2.9E+00 4.1E+00 4.3E+00 365 3.1E+02 8.9E+02 2.8E+00 3.4E+00 4.7E+00 5.0E+00 730 3.6E+04 1.1E+05 4.1E+00 4.8E+00 5.9E+00 6.2E+00
1,825 1.7E+10 2.8E+08 9.3E+00 1.1E+01 8.6E+00 8.8E+00 3,600 4.4E+11 4.5E+09 2.5E+01 3.0E+01 9.4E+00 9.5E+00 7,300 6.3E+12 2.6E+11 5.3E+01 6.4E+01 9.4E+00 9.8E+00 18,250 1.0E+13 2.1E+13 5.5E+01 6.6E+01 1.3E+01 1.3E+01
1.0E+00
1.0E+01
1.0E+02
1.0E+03
1.0E+04
1 10 100 1000 10000 100000
Days Post Intake
Com
mitt
ed E
ffect
ive
Dos
e Eq
uiva
lent
(rem
)
1-um 5-um 1-um 5-um 1-um 5-um 5-rem Dose Limit
Figure 8.22. Minimum Detectable Committed Effective Doses for 20-Year Aged Weapons-Grade Plutonium Based on Detection of 0.16 nCi 241Am in the Lungs

Issued: January 31, 2003 PNNL-MA-860 Chapter 8.0 Page 8.51
Table 8.34. Minimum Detectable Committed Effective Dose Equivalent (rem) for 40-Year Aged Weapons-Grade Plutonium Based on Detection of 0.16 nCi 241Am in the Lungs
Days Post Class W Inhalation Class Y Inhalation
Super Class Y Inhalation
Intake 1-um 5-um 1-um 5-um 1-um 5-um 0 9.7E-01 1.9E+00 6.9E-01 5.5E-01 1.2E+00 9.3E-01 1 1.5E+00 4.3E+00 1.1E+00 1.2E+00 1.9E+00 2.1E+00 2 1.8E+00 5.3E+00 1.2E+00 1.5E+00 2.2E+00 2.3E+00 5 2.2E+00 6.7E+00 1.5E+00 1.7E+00 2.6E+00 2.9E+00 7 2.3E+00 6.7E+00 1.5E+00 1.7E+00 2.7E+00 2.9E+00
14 2.6E+00 7.4E+00 1.6E+00 1.7E+00 2.7E+00 2.9E+00 30 3.1E+00 9.1E+00 1.6E+00 1.7E+00 2.8E+00 2.9E+00 60 4.5E+00 1.3E+01 1.6E+00 1.9E+00 2.9E+00 3.2E+00 90 6.5E+00 1.9E+01 1.7E+00 1.9E+00 2.9E+00 3.2E+00 180 2.1E+01 6.1E+01 1.8E+00 2.1E+00 3.1E+00 3.5E+00 365 2.3E+02 6.7E+02 2.2E+00 2.5E+00 3.6E+00 4.0E+00 730 2.9E+04 8.2E+04 3.0E+00 3.5E+00 4.6E+00 5.0E+00
1,825 2.3E+09 1.9E+09 7.6E+00 8.7E+00 7.0E+00 7.3E+00 3,600 1.1E+10 3.2E+11 2.2E+01 2.5E+01 8.3E+00 8.6E+00 7,300 1.0E+12 3.7E+12 5.1E+01 5.8E+01 9.1E+00 9.5E+00 18,250 2.2E+12 6.7E+14 5.6E+01 6.5E+01 1.3E+01 1.4E+01
1
10
100
1000
10000
1 10 100 1000 10000 100000
Days Post Intake
Com
mitt
ed E
ffect
ive
Dos
e Eq
uiva
lent
(rem
)
1-um Class W5-um Class W1-um Class Y5-um Class Y1-um Super Y5-um Super Y5-rem Dose Limit
Figure 8.23. Minimum Detectable Committed Effective Doses for 40-Year Aged Weapons-Grade Plutonium Based on Detection of 0.16 nCi 241Am in the Lungs

PNNL-MA-860 Chapter 8.0 Issued: January 31, 2003 Page 8.52
Table 8.35. Minimum Detectable Committed Effective Dose Equivalent (rem) for 10-Year Aged Fuel-Grade Plutonium Based on Detection of 0.16 nCi 241Am in the Lungs
Days Post Class W Inhalation Class Y Inhalation Super Class Y Inhalation
Intake 1-um 5-um 1-um 5-um 1-um 5-um 0 9.3E-01 2.0E+00 6.3E-01 5.2E-01 1.2E+00 8.8E-01 1 1.5E+00 4.4E+00 9.8E-01 1.2E+00 1.8E+00 1.9E+00 2 1.7E+00 5.4E+00 1.1E+00 1.3E+00 2.1E+00 2.3E+00 5 2.1E+00 6.5E+00 1.4E+00 1.6E+00 2.5E+00 2.7E+00 7 2.2E+00 7.0E+00 1.4E+00 1.7E+00 2.6E+00 2.7E+00
14 2.4E+00 7.5E+00 1.4E+00 1.7E+00 2.6E+00 2.9E+00 30 3.0E+00 8.9E+00 1.4E+00 1.7E+00 2.6E+00 2.9E+00 60 4.3E+00 1.4E+01 1.5E+00 1.7E+00 2.7E+00 2.9E+00 90 6.4E+00 2.0E+01 1.5E+00 1.8E+00 2.8E+00 2.9E+00 180 2.0E+01 6.1E+01 1.6E+00 2.0E+00 2.9E+00 3.1E+00 365 2.1E+02 6.5E+02 1.9E+00 2.3E+00 3.2E+00 3.6E+00 730 2.4E+04 7.5E+04 2.5E+00 3.0E+00 3.9E+00 4.3E+00
1,825 6.9E+09 8.1E+09 5.5E+00 6.4E+00 5.2E+00 5.5E+00 3,600 1.2E+12 2.2E+10 1.4E+01 1.6E+01 5.2E+00 5.5E+00 7,300 9.0E+12 7.0E+10 2.5E+01 3.1E+01 4.7E+00 5.0E+00 18,250 1.4E+14 1.6E+13 2.4E+01 2.9E+01 5.7E+00 6.2E+00
0.1
1
10
100
1000
10000
1 10 100 1000 10000
Days Post Intake
Com
mitt
ed E
ffect
ive
Dos
e Eq
uiva
lent
(rem
)
1-um Class W5-um Class W1-um Class Y5-um Class Y1-um Super Y5-um Super Y5-rem Dose Limit
Figure 8.24. Minimum Detectable Committed Effective Doses for 10-Year Aged Fuel-Grade Plutonium Based on Detection of 0.16 nCi 241Am in the Lungs

Issued: January 31, 2003 PNNL-MA-860 Chapter 8.0 Page 8.53
Table 8.36. Minimum Detectable Committed Effective Dose Equivalent (rem) for 20-Year Aged Fuel-Grade Plutonium Based on Detection of 0.16 nCi 241Am in the Lungs
Days Post Class W Inhalation Class Y Inhalation Super Class Y Inhalation
Intake 1-um 5-um 1-um 5-um 1-um 5-um 0 6.2E-01 1.3E+00 4.3E-01 3.6E-01 7.9E-01 5.7E-01 1 9.5E-01 2.9E+00 6.6E-01 7.7E-01 1.2E+00 1.2E+00 2 1.1E+00 3.5E+00 7.8E-01 9.6E-01 1.4E+00 1.5E+00 5 1.4E+00 4.4E+00 9.2E-01 1.1E+00 1.7E+00 1.7E+00 7 1.5E+00 4.6E+00 9.3E-01 1.1E+00 1.7E+00 1.8E+00
14 1.6E+00 4.9E+00 9.5E-01 1.1E+00 1.7E+00 1.8E+00 30 2.0E+00 6.3E+00 9.7E-01 1.2E+00 1.7E+00 1.8E+00 60 2.9E+00 8.9E+00 1.0E+00 1.2E+00 1.8E+00 1.9E+00 90 4.2E+00 1.3E+01 1.0E+00 1.3E+00 1.8E+00 1.9E+00 180 1.3E+01 4.2E+01 1.1E+00 1.3E+00 2.0E+00 2.1E+00 365 1.5E+02 4.4E+02 1.3E+00 1.6E+00 2.3E+00 2.4E+00 730 1.7E+04 5.5E+04 1.8E+00 2.2E+00 2.8E+00 3.0E+00
1,825 2.1E+09 4.9E+09 4.3E+00 5.2E+00 3.9E+00 4.2E+00 3,600 7.3E+09 2.6E+10 1.2E+01 1.4E+01 4.5E+00 4.6E+00 7,300 8.0E+10 3.1E+11 2.5E+01 3.0E+01 4.5E+00 4.7E+00 18,250 3.1E+12 1.4E+12 2.5E+01 3.1E+01 6.0E+00 6.3E+00
0.1
1
10
100
1000
10000
1 10 100 1000 10000 100000
Days Post Intake
Com
mitt
ed E
ffect
ive
Dos
e Eq
uiva
lent
(rem
)
1-um Class W5-um Class W1-um Class Y5-um Class Y1-um Super Y5-um Super Y5-rem Dose Limit
Figure 8.25. Minimum Detectable Committed Effective Doses for 20-Year Aged Fuel-Grade Plutonium Based on Detection of 0.16 nCi 241Am in the Lungs

PNNL-MA-860 Chapter 8.0 Issued: January 31, 2003 Page 8.54
Table 8.37. Minimum Detectable Committed Effective Dose Equivalent (rem) for 40-Year Aged Fuel-Grade Plutonium Based on Detection of 0.16 nCi 241Am in the Lungs
Days Post Class W Inhalation Class Y Inhalation
Super Class Y Inhalation
Intake 1-um 5-um 1-um 5-um 1-um 5-um 0 4.6E-01 1.0E+00 3.3E-01 2.8E-01 5.9E-01 4.4E-01 1 7.4E-01 2.2E+00 5.3E-01 6.1E-01 9.4E-01 9.5E-01 2 8.7E-01 2.7E+00 6.1E-01 7.5E-01 1.1E+00 1.1E+00 5 1.1E+00 3.3E+00 7.2E-01 8.6E-01 1.3E+00 1.4E+00 7 1.1E+00 3.5E+00 7.3E-01 9.0E-01 1.3E+00 1.4E+00
14 1.2E+00 3.8E+00 7.4E-01 9.0E-01 1.3E+00 1.4E+00 30 1.5E+00 4.7E+00 7.5E-01 9.3E-01 1.3E+00 1.4E+00 60 2.3E+00 6.7E+00 7.9E-01 9.3E-01 1.4E+00 1.5E+00 90 3.2E+00 1.0E+01 8.1E-01 9.7E-01 1.4E+00 1.5E+00 180 1.0E+01 3.2E+01 8.8E-01 1.1E+00 1.5E+00 1.6E+00 365 1.1E+02 3.5E+02 1.1E+00 1.2E+00 1.8E+00 1.9E+00 730 1.4E+04 4.2E+04 1.5E+00 1.9E+00 2.2E+00 2.3E+00
1,825 6.1E+09 1.8E+10 3.8E+00 4.5E+00 3.4E+00 3.5E+00 3,600 9.7E+09 3.6E+11 1.1E+01 1.3E+01 3.9E+00 4.1E+00 7,300 3.9E+10 1.7E+13 2.4E+01 2.9E+01 4.3E+00 4.5E+00 18,250 4.6E+11 5.0E+14 2.8E+01 3.3E+01 6.3E+00 6.6E+00
0.1
1
10
100
1000
10000
1 10 100 1000 10000 100000
Days Post Intake
Com
mitt
ed E
ffect
ive
Dos
e Eq
uiva
lent
(rem
)
1-um Class W5-um Class W1-um Class Y5-um Class Y1-um Super Y5-um Super Y5-rem Dose Limit
Figure 8.26. Minimum Detectable Committed Effective Doses for 40-Year Aged Fuel-Grade Plutonium Based on Detection of 0.16 nCi 241Am in the Lungs

Issued: January 31, 2003 PNNL-MA-860 Chapter 8.0 Page 8.55
Table 8.38. Minimum Detectable Committed Bone Surface Doses for 10-Year Aged Weapons-Grade Plutonium Based on Detection of 0.16 nCi 241Am in the Lungs
Class W Inhalation Class Y Inhalation Days Post
Intake 1-µm 5-µm 1-µm 5-µm 0 3.7E+01 8.2E+01 1.4E+01 1.5E+01 1 5.6E+01 1.8E+02 2.2E+01 3.2E+01 2 6.7E+01 2.1E+02 2.6E+01 3.9E+01 5 8.3E+01 2.6E+02 3.0E+01 4.6E+01 7 8.8E+01 2.7E+02 3.2E+01 4.7E+01
14 9.4E+01 3.0E+02 3.2E+01 4.7E+01 30 1.2E+02 3.7E+02 3.2E+01 4.8E+01 60 1.7E+02 5.4E+02 3.2E+01 5.0E+01 90 2.5E+02 7.8E+02 3.4E+01 5.1E+01
180 7.8E+02 2.5E+03 3.6E+01 5.4E+01 365 8.3E+03 2.6E+04 4.2E+01 6.4E+01 730 9.4E+05 3.0E+06 5.6E+01 8.5E+01
1,825 1.5E+11 4.1E+11 1.2E+02 1.8E+02 3,600 3.4E+11 2.2E+13 3.0E+02 4.5E+02 7,300 3.6E+12 4.9E+12 5.7E+02 8.7E+02
18,250 9.4E+13 2.0E+13 5.4E+02 8.0E+02 NA = not applicable
1
10
100
1000
10000
1 10 100 1000 10000
Days Post Intake
Com
mitt
ed D
ose
Equ
ival
ent
(rem
)
1-um Class W5-um Class W1-um Class Y5-um Class Y50-rem Dose Limit
Figure 8.27. Minimum Detectable Bone Surface Doses for 10-Year Aged Weapons-Grade Plutonium Based on Detection of 0.16 nCi 241Am in the Lungs

PNNL-MA-860 Chapter 8.0 Issued: January 31, 2003 Page 8.56
Table 8.39. Minimum Detectable Committed Bone Surface Doses for 20-Year Aged Weapons-Grade Plutonium Based on Detection of 0.16 nCi 241Am in the Lungs
Class W Inhalation Class Y Inhalation Days Post
Intake 1-µm 5-µm 1-µm 5-µm 0 2.3E+01 5.1E+01 9.1E+00 9.4E+00 1 3.7E+01 1.1E+02 1.4E+01 2.1E+01 2 4.4E+01 1.4E+02 1.7E+01 2.5E+01 5 5.4E+01 1.7E+02 2.0E+01 2.9E+01 7 5.7E+01 1.8E+02 2.0E+01 3.0E+01
14 6.2E+01 1.9E+02 2.0E+01 3.0E+01 30 7.6E+01 2.4E+02 2.0E+01 3.0E+01 60 1.1E+02 3.5E+02 2.1E+01 3.1E+01 90 1.6E+02 5.0E+02 2.2E+01 3.2E+01
180 5.0E+02 1.6E+03 2.4E+01 3.5E+01 365 5.7E+02 1.7E+04 2.8E+01 4.1E+01 730 6.5E+05 2.1E+06 4.1E+01 5.8E+01
1,825 3.2E+11 5.5E+09 9.3E+01 1.4E+02 3,600 8.0E+12 8.8E+10 2.5E+02 3.7E+02 7,300 1.1E+14 5.1E+12 5.3E+02 7.8E+02
18,250 1.9E+14 4.1E+14 5.5E+02 7.8E+02 NA = not applicable
1
10
100
1000
10000
1 10 100 1000 10000 100000
Days Post Intake
Com
mitt
ed D
ose
Equi
vale
nt(r
em)
1-um Class W5-um Class W1-um Class Y5-um Class Y50-rem Dose Limit
Figure 8.28. Minimum Detectable Bone Surface Doses for 20-Year Aged Weapons-Grade Plutonium Based on Detection of 0.16 nCi 241Am in the Lungs

Issued: January 31, 2003 PNNL-MA-860 Chapter 8.0 Page 8.57
Table 8.40. Minimum Detectable Committed Bone Surface Doses for 40-Year Aged Weapons-Grade Plutonium Based on Detection of 0.16 nCi 241Am in the Lungs
Class W Inhalation Class Y Inhalation Days Post
Intake 1-µm 5-µm 1-µm 5-µm 0 1.8E+01 3.8E+01 6.9E+00 6.7E+00 1 2.7E+01 8.5E+01 1.1E+01 1.5E+01 2 3.3E+01 1.0E+02 1.2E+01 1.8E+01 5 4.0E+01 1.3E+02 1.5E+01 2.1E+01 7 4.2E+01 1.3E+02 1.5E+01 2.1E+01
14 4.7E+01 1.4E+02 1.6E+01 2.1E+01 30 5.7E+01 1.8E+02 1.6E+01 2.1E+01 60 8.2E+01 2.6E+02 1.6E+01 2.3E+01 90 1.2E+02 3.8E+02 1.7E+01 2.3E+01
180 3.9E+02 1.2E+03 1.8E+01 2.6E+01 365 4.2E+03 1.3E+04 2.2E+01 3.1E+01 730 5.2E+05 1.6E+06 3.0E+01 4.3E+01
1,825 4.2E+10 3.7E+10 7.6E+01 1.1E+02 3,600 2.0E+11 6.3E+12 2.2E+02 3.1E+02 7,300 1.8E+13 7.2E+13 5.1E+02 7.1E+02
18,250 4.0E+13 1.3E+16 5.6E+02 8.0E+02 NA = not applicable
1
10
100
1000
10000
1 10 100 1000 10000 100000Days Post Intake
Com
mitt
ed D
ose
Equi
vale
nt(r
em)
1-um Class W5-um Class W1-um Class Y5-um Class Y50-rem Dose Limit
Figure 8.29. Minimum Detectable Bone Surface Doses for 40-Year Aged Weapons-Grade Plutonium Based on Detection of 0.16 nCi 241Am in the Lungs

PNNL-MA-860 Chapter 8.0 Issued: January 31, 2003 Page 8.58
Table 8.41. Minimum Detectable Committed Bone Surface Dose Equivalent (rem) for 10-Year Aged Fuel-Grade Plutonium Based on Detection of 0.16 nCi 241Am in the Lungs
Class W Inhalation Class Y Inhalation Days Post
Intake 1-µm 5-µm 1-µm 5-µm 0 1.7E+01 3.6E+01 6.7E+00 6.5E+00 1 2.6E+01 8.0E+01 1.0E+01 1.5E+01 2 3.1E+01 9.8E+01 1.2E+01 1.7E+01 5 3.8E+01 1.2E+02 1.5E+01 2.0E+01 7 4.0E+01 1.3E+02 1.5E+01 2.1E+01
14 4.3E+01 1.4E+02 1.5E+01 2.1E+01 30 5.3E+01 1.6E+02 1.5E+01 2.1E+01 60 7.6E+01 2.4E+02 1.6E+01 2.1E+01 90 1.1E+02 3.5E+02 1.6E+01 2.3E+01
180 3.6E+02 1.1E+03 1.7E+01 2.5E+01 365 3.8E+03 1.2E+04 2.0E+01 2.9E+01 730 4.3E+05 1.4E+06 2.7E+01 3.8E+01
1,825 1.2E+11 1.5E+11 5.8E+01 8.0E+01 3,600 2.2E+13 4.0E+11 1.4E+02 2.0E+02 7,300 1.6E+14 1.3E+12 2.7E+02 3.9E+02
18,250 2.6E+15 2.9E+14 2.6E+02 3.6E+02 NA = not applicable
1
10
100
1000
10000
1 10 100 1000 10000 100000
Days Post Intake
Com
mitt
ed D
ose
Equ
ival
ent
(rem
)
1-um Class W5-um Class W1-um Class Y5-um Class Y50-rem Dose Limit
Figure 8.30. Minimum Detectable Bone Surface Doses for 10-Year Aged Fuel-Grade Plutonium Based on Detection of 0.16 nCi 241Am in the Lungs

Issued: January 31, 2003 PNNL-MA-860 Chapter 8.0 Page 8.59
Table 8.42. Minimum Detectable Committed Bone Surface Dose Equivalent (rem) for 20-Year Aged Fuel-Grade Plutonium Based on Detection of 0.16 nCi 241Am in the Lungs
Class W Inhalation Class Y Inhalation Days Post
Intake 1-µm 5-µm 1-µm 5-µm 0 1.1E+01 2.4E+01 4.4E+00 4.3E+00 1 1.8E+01 5.3E+01 6.8E+00 9.3E+00 2 2.1E+01 6.4E+01 8.0E+00 1.2E+01 5 2.5E+01 8.0E+01 9.4E+00 1.4E+01 7 2.7E+01 8.4E+01 9.6E+00 1.4E+01
14 2.9E+01 8.9E+01 9.8E+00 1.4E+01 30 3.6E+01 1.1E+02 9.9E+00 1.4E+01 60 5.3E+01 1.6E+02 1.0E+01 1.4E+01 90 7.7E+01 2.4E+02 1.0E+01 1.5E+01
180 2.5E+02 7.6E+02 1.2E+01 1.6E+01 365 2.7E+03 8.0E+03 1.4E+01 1.9E+01 730 3.1E+05 1.0E+06 1.9E+01 2.6E+01
1,825 3.9E+10 8.9E+10 4.4E+01 6.3E+01 3,600 1.3E+11 4.7E+11 1.2E+02 1.7E+02 7,300 1.5E+12 5.7E+12 2.6E+02 3.6E+02
18,250 5.7E+13 2.6E+13 2.6E+02 3.7E+02 NA = not applicable
1
10
100
1000
10000
1 10 100 1000 10000 100000
Days Post Intake
Com
mitt
ed D
ose
Equi
vale
nt(r
em)
1-um Class W5-um Class W1-um Class Y5-um Class Y50-rem Dose Limit
Figure 8.31. Minimum Detectable Bone Surface Doses for 20-Year Aged Fuel-Grade Plutonium Based on Detection of 0.16 nCi 241Am in the Lungs

PNNL-MA-860 Chapter 8.0 Issued: January 31, 2003 Page 8.60
Table 8.43. Minimum Detectable Committed Bone Surface Dose Equivalent (rem) for 40-Year Aged Fuel-Grade Plutonium Based on Detection of 0.16 nCi 241Am in the Lungs
Class W Inhalation Class Y Inhalation Days Post
Intake 1-µm 5-µm 1-µm 5-µm 0 8.4E+00 1.8E+01 3.2E+00 3.4E+00 1 1.3E+01 4.1E+01 5.1E+00 7.4E+00 2 1.6E+01 4.9E+01 5.9E+00 9.1E+00 5 1.9E+01 6.1E+01 7.0E+00 1.0E+01 7 2.0E+01 6.4E+01 7.1E+00 1.1E+01
14 2.2E+01 7.0E+01 7.2E+00 1.1E+01 30 2.7E+01 8.7E+01 7.3E+00 1.1E+01 60 4.1E+01 1.2E+02 7.6E+00 1.1E+01 90 5.8E+01 1.8E+02 7.9E+00 1.2E+01
180 1.9E+02 5.9E+02 8.5E+00 1.3E+01 365 2.1E+03 6.4E+03 1.0E+01 1.5E+01 730 2.5E+05 7.7E+05 1.5E+01 2.3E+01
1,825 1.1E+11 3.3E+11 3.7E+01 5.4E+01 3,600 1.8E+11 6.7E+12 1.0E+02 1.6E+02 7,300 7.1E+11 3.1E+14 2.3E+02 3.6E+02
18,250 8.4E+12 9.2E+15 2.7E+02 4.0E+02 NA = not applicable
1
10
100
1000
1 10 100 1000 10000 100000Days Post Intake
Com
mitt
ed D
ose
Equ
ival
ent
(rem
)
1-um Class W5-um Class W1-um Class Y5-um Class Y50-rem Dose Limit
Figure 8.32. Minimum Detectable Bone Surface Doses for 40-Year Aged Fuel-Grade Plutonium Based on Detection of 0.16 nCi 241Am in the Lungs

Issued: January 31, 2003 PNNL-MA-860 Chapter 8.0 Page 8.61
Table 8.44. Minimum Detectable Intakes (nCi) of 239Pu Based on Detection of 0.2 dpm/d in Feces
Class W Inhalation Class Y Inhalation Super Class Y Inhalation Days Post Intake
Instant Uptake 1-µm 5-µm 1-µm 5-µm 1-µm 5-µm
1 3.0E-02 8.2E-04 4.1E-04 6.9E-04 3.6E-04 6.9E-04 3.6E-04 2 4.7E-02 6.9E-04 3.5E-04 5.6E-04 3.1E-04 5.6E-04 3.1E-04 5 1.6E-01 3.9E-03 2.9E-03 3.8E-03 2.6E-03 3.8E-03 2.6E-03 7 2.4E-01 1.4E-02 1.6E-02 1.7E-02 1.6E-02 1.7E-02 1.6E-02
14 3.9E-01 7.5E-02 2.0E-01 5.3E-01 1.4E+00 5.3E-01 1.4E+00 30 6.0E-01 9.4E-02 2.6E-01 6.9E-01 1.9E+00 6.9E-01 1.9E+00 60 9.1E-01 1.4E-01 3.9E-01 6.9E-01 2.0E+00 6.9E-01 2.0E+00 90 1.1E+00 2.1E-01 5.6E-01 7.5E-01 2.0E+00 7.5E-01 2.1E+00
180 1.6E+00 6.9E-01 1.8E+00 8.2E-01 2.3E+00 8.2E-01 2.4E+00 365 2.6E+00 1.9E+01 1.1E+01 1.1E+00 3.0E+00 1.1E+00 3.0E+00 730 4.7E+00 3.6E+01 3.5E+01 1.8E+00 5.0E+00 1.8E+00 5.0E+00
1,825 6.4E+00 5.6E+01 5.0E+01 7.5E+00 2.1E+01 8.2E+00 2.3E+01 3,600 6.9E+00 6.0E+01 5.3E+01 5.6E+01 1.4E+02 9.1E+01 2.4E+02 7,300 7.5E+00 6.0E+01 6.0E+01 1.5E+02 3.0E+02 5.0E+02 8.2E+02
18,250 1.1E+01 9.0E+01 8.2E+01 2.0E+02 4.3E+02 2.9E+02 5.6E+02

PNNL-MA-860 Chapter 8.0 Issued: January 31, 2003 Page 8.62
Table 8.45. Minimum Detectable Committed Effective Dose Equivalent (rem) for 10-Year Aged Weapons-Grade Plutonium Based on Detection of 0.2 dpm/d 239Pu in Feces
Class W Inhalation Class Y Inhalation Super Class Y Inhalation Days Post
Intake Instant Uptake 1-µm 5-µm 1-µm 5-µm 1-µm 5-µm
1 1.5E-01 4.9E-04 2.6E-04 3.0E-04 6.3E-05 5.3E-04 1.0E-04 2 2.4E-01 4.2E-04 2.2E-04 2.4E-04 5.5E-05 4.3E-04 9.0E-05 5 7.8E-01 2.4E-03 1.8E-03 1.6E-03 4.7E-04 2.9E-03 7.7E-04 7 1.2E+00 8.6E-03 1.0E-02 7.1E-03 2.8E-03 1.3E-02 4.6E-03
14 2.0E+00 4.5E-02 1.2E-01 2.3E-01 2.4E-01 4.1E-01 4.1E-01 30 3.0E+00 5.7E-02 1.6E-01 3.0E-01 3.3E-01 5.3E-01 5.5E-01 60 4.6E+00 8.6E-02 2.5E-01 3.0E-01 3.4E-01 5.3E-01 5.8E-01 90 5.7E+00 1.3E-01 3.5E-01 3.2E-01 3.6E-01 5.8E-01 6.1E-01
180 7.9E+00 4.2E-01 1.2E+00 3.5E-01 4.1E-01 6.3E-01 6.9E-01 365 1.3E+01 1.1E+01 7.0E+00 4.5E-01 5.3E-01 8.2E-01 8.7E-01 730 2.4E+01 2.2E+01 2.2E+01 7.5E-01 8.8E-01 1.4E+00 1.4E+00
1,825 3.2E+01 3.4E+01 3.1E+01 3.2E+00 3.7E+00 6.3E+00 6.5E+00 3,600 3.5E+01 3.6E+01 3.3E+01 2.4E+01 2.4E+01 7.0E+01 6.9E+01 7,300 3.8E+01 3.6E+01 3.8E+01 6.2E+01 5.3E+01 3.8E+02 2.4E+02
18,250 5.4E+01 5.4E+01 5.1E+01 8.7E+01 7.5E+01 2.2E+02 1.6E+02
1.0E-05
1.0E-04
1.0E-03
1.0E-02
1.0E-01
1.0E+00
1.0E+01
1.0E+02
1.0E+03
1 10 100 1000 10000 100000
Days Post Intake
Com
mitt
ed E
ffect
ive
Dos
e Eq
uiva
lent
(rem
)
Uptake1-um Class W5-um Class W1-um Class Y5-um Class Y1-um Super Y5-um Super Y5-rem Dose Limit
Figure 8.33. Minimum Detectable Committed Effective Doses for 10-Year Aged Weapons-Grade Plutonium Based on Detection of 0.2 dpm/d 239Pu in Feces

Issued: January 31, 2003 PNNL-MA-860 Chapter 8.0 Page 8.63
Table 8.46. Minimum Detectable Committed Effective Dose Equivalent (rem) for 20-Year Aged Weapons-Grade Plutonium Based on Detection of 0.2 dpm/d 239Pu in Feces
Class W Inhalation Class Y Inhalation Super Class Y Inhalation Days Post
Intake Instant Uptake 1-µm 5-µm 1-µm 5-µm 1-µm 5-µm
1 1.5E-01 5.2E-04 2.6E-04 3.1E-04 6.8E-05 5.5E-04 1.1E-04 2 2.4E-01 4.4E-04 2.2E-04 2.5E-04 5.8E-05 4.5E-04 9.2E-05 5 7.9E-01 2.5E-03 1.9E-03 1.7E-03 5.0E-04 3.0E-03 7.8E-04 7 1.2E+00 9.0E-03 1.0E-02 7.4E-03 3.0E-03 1.3E-02 4.7E-03
14 2.0E+00 4.7E-02 1.3E-01 2.3E-01 2.6E-01 4.2E-01 4.2E-01 30 3.1E+00 5.9E-02 1.7E-01 3.1E-01 3.5E-01 5.5E-01 5.7E-01 60 4.6E+00 9.0E-02 2.5E-01 3.1E-01 3.7E-01 5.5E-01 5.9E-01 90 5.8E+00 1.4E-01 3.6E-01 3.3E-01 3.8E-01 5.9E-01 6.2E-01
180 8.0E+00 4.4E-01 1.2E+00 3.6E-01 4.3E-01 6.5E-01 7.0E-01 365 1.3E+01 1.2E+01 7.2E+00 4.7E-01 5.6E-01 8.5E-01 8.9E-01 730 2.4E+01 2.3E+01 2.2E+01 7.8E-01 9.4E-01 1.4E+00 1.5E+00
1,825 3.3E+01 3.5E+01 3.2E+01 3.3E+00 3.9E+00 6.5E+00 6.6E+00 3,600 3.5E+01 3.8E+01 3.4E+01 2.5E+01 2.6E+01 7.2E+01 7.0E+01 7,300 3.8E+01 3.8E+01 3.9E+01 6.4E+01 5.6E+01 4.0E+02 2.4E+02
18,250 5.5E+01 5.7E+01 5.3E+01 9.1E+01 8.0E+01 2.3E+02 1.7E+02
1.0E-05
1.0E-04
1.0E-03
1.0E-02
1.0E-01
1.0E+00
1.0E+01
1.0E+02
1.0E+03
1 10 100 1000 10000 100000
Days Post Intake
Com
mitt
ed E
ffect
ive
Dos
e Eq
uiva
lent
(rem
)
Uptake1-um Class W5-um Class W1-um Class Y5-um Class Y1-um Super Y5-um Super Y5-rem Dose Limit
Figure 8.34. Minimum Detectable Committed Effective Doses for 20-Year Aged Weapons-Grade Plutonium Based on Detection of 0.2 dpm/d 239Pu in Feces

PNNL-MA-860 Chapter 8.0 Issued: January 31, 2003 Page 8.64
Table 8.47. Minimum Detectable Committed Effective Dose Equivalent (rem) for 40-Year Aged Weapons-Grade Plutonium Based on Detection of 0.2 dpm/d 239Pu in Feces
Class W Inhalation Class Y Inhalation Super Class Y Inhalation Days Post
Intake Instant Uptake 1-µm 5-µm 1-µm 5-µm 1-µm 5-µm
1 1.6E-01 5.2E-04 2.6E-04 3.1E-04 6.6E-05 5.5E-04 1.1E-04 2 2.5E-01 4.4E-04 2.2E-04 2.5E-04 5.7E-05 4.5E-04 9.6E-05 5 8.0E-01 2.5E-03 1.9E-03 1.7E-03 4.8E-04 3.0E-03 8.2E-04 7 1.3E+00 9.0E-03 1.0E-02 7.5E-03 2.9E-03 1.3E-02 4.9E-03
14 2.0E+00 4.7E-02 1.3E-01 2.4E-01 2.5E-01 4.2E-01 4.4E-01 30 3.1E+00 5.9E-02 1.7E-01 3.1E-01 3.4E-01 5.5E-01 5.9E-01 60 4.7E+00 9.0E-02 2.5E-01 3.1E-01 3.6E-01 5.5E-01 6.2E-01 90 5.9E+00 1.4E-01 3.6E-01 3.4E-01 3.7E-01 6.0E-01 6.5E-01
180 8.2E+00 4.4E-01 1.2E+00 3.7E-01 4.2E-01 6.5E-01 7.3E-01 365 1.3E+01 1.2E+01 7.2E+00 4.7E-01 5.5E-01 8.6E-01 9.2E-01 730 2.5E+01 2.3E+01 2.2E+01 7.9E-01 9.1E-01 1.4E+00 1.5E+00
1,825 3.3E+01 3.5E+01 3.2E+01 3.4E+00 3.8E+00 6.5E+00 6.9E+00 3,600 3.6E+01 3.8E+01 3.4E+01 2.5E+01 2.5E+01 7.3E+01 7.3E+01 7,300 3.9E+01 3.8E+01 3.9E+01 6.5E+01 5.5E+01 4.0E+02 2.5E+02
18,250 5.6E+01 5.7E+01 5.3E+01 9.2E+01 7.8E+01 2.3E+02 1.7E+02
1.0E-05
1.0E-04
1.0E-03
1.0E-02
1.0E-01
1.0E+00
1.0E+01
1.0E+02
1.0E+03
1 10 100 1000 10000 100000
Days Post Intake
Com
mitt
ed E
ffect
ive
Dos
e Eq
uiva
lent
(rem
)
Uptake1-um Class W5-um Class W1-um Class Y5-um Class Y1-um Super Y5-um Super Y5-rem Dose Limit
Figure 8.35. Minimum Detectable Committed Effective Doses for 40-Year Aged Weapons-Grade Plutonium Based on Detection of 0.2 dpm/d 239Pu in Feces

Issued: January 31, 2003 PNNL-MA-860 Chapter 8.0 Page 8.65
Table 8.48. Minimum Detectable Committed Effective Dose Equivalent (rem) for 10-Year Aged Fuel-Grade Plutonium Based on Detection of 0.2 dpm/d 239Pu in Feces
Class W Inhalation Class Y Inhalation Super Class Y Inhalation Days Post
Intake Instant Uptake 1-µm 5-µm 1-µm 5-µm 1-µm 5-µm
1 2.3E-01 7.8E-04 4.2E-04 4.5E-04 9.7E-05 8.3E-04 1.6E-04 2 3.7E-01 6.6E-04 3.6E-04 3.6E-04 8.4E-05 6.8E-04 1.4E-04 5 1.2E+00 3.7E-03 3.0E-03 2.4E-03 7.2E-04 4.5E-03 1.2E-03 7 1.9E+00 1.4E-02 1.7E-02 1.1E-02 4.3E-03 2.0E-02 7.2E-03
14 3.0E+00 7.1E-02 2.0E-01 3.4E-01 3.7E-01 6.4E-01 6.5E-01 30 4.7E+00 8.9E-02 2.7E-01 4.5E-01 5.1E-01 8.3E-01 8.7E-01 60 7.1E+00 1.4E-01 4.0E-01 4.5E-01 5.3E-01 8.3E-01 9.1E-01 90 8.9E+00 2.0E-01 5.8E-01 4.8E-01 5.5E-01 9.0E-01 9.6E-01
180 1.2E+01 6.6E-01 1.9E+00 5.3E-01 6.2E-01 9.8E-01 1.1E+00 365 2.0E+01 1.8E+01 1.1E+01 6.8E-01 8.1E-01 1.3E+00 1.4E+00 730 3.7E+01 3.4E+01 3.6E+01 1.1E+00 1.4E+00 2.1E+00 2.3E+00
1,825 5.0E+01 5.3E+01 5.2E+01 4.8E+00 5.7E+00 9.8E+00 1.0E+01 3,600 5.4E+01 5.7E+01 5.5E+01 3.6E+01 3.7E+01 1.1E+02 1.1E+02 7,300 5.8E+01 5.7E+01 6.2E+01 9.3E+01 8.1E+01 6.0E+02 3.7E+02
18,250 8.3E+01 8.5E+01 8.4E+01 1.3E+02 1.2E+02 3.5E+02 2.6E+02
1.0E-05
1.0E-04
1.0E-03
1.0E-02
1.0E-01
1.0E+00
1.0E+01
1.0E+02
1.0E+03
1 10 100 1000 10000 100000
Days Post Intake
Com
mitt
ed E
ffect
ive
Dos
e Eq
uiva
lent
(rem
)
Uptake1-um Class W5-um Class W1-um Class Y5-um Class Y1-um Super Y5-um Super Y5-rem Dose Limit
Figure 8.36. Minimum Detectable Committed Effective Doses for 10-Year Aged Fuel-Grade Plutonium Based on Detection of 0.2 dpm/d 239Pu in Feces

PNNL-MA-860 Chapter 8.0 Issued: January 31, 2003 Page 8.66
Table 8.49. Minimum Detectable Committed Effective Dose Equivalent (rem) for 20-Year Aged Fuel-Grade Plutonium Based on Detection of 0.2 dpm/d 239Pu in Feces
Class W Inhalation Class Y Inhalation Super Class Y Inhalation Days Post
Intake Instant Uptake 1-µm 5-µm 1-µm 5-µm 1-µm 5-µm
1 2.4E-01 8.1E-04 4.4E-04 4.8E-04 1.1E-04 8.7E-04 1.7E-04 2 3.8E-01 6.8E-04 3.8E-04 3.9E-04 9.2E-05 7.1E-04 1.5E-04 5 1.3E+00 3.9E-03 3.1E-03 2.6E-03 7.8E-04 4.7E-03 1.3E-03 7 2.0E+00 1.4E-02 1.7E-02 1.2E-02 4.7E-03 2.1E-02 7.5E-03
14 3.2E+00 7.4E-02 2.1E-01 3.7E-01 4.1E-01 6.7E-01 6.8E-01 30 4.9E+00 9.2E-02 2.8E-01 4.8E-01 5.5E-01 8.7E-01 9.1E-01 60 7.4E+00 1.4E-01 4.2E-01 4.8E-01 5.8E-01 8.7E-01 9.5E-01 90 9.2E+00 2.1E-01 6.1E-01 5.2E-01 6.1E-01 9.5E-01 9.9E-01
180 1.3E+01 6.8E-01 2.0E+00 5.6E-01 6.8E-01 1.0E+00 1.1E+00 365 2.1E+01 1.8E+01 1.2E+01 7.3E-01 8.9E-01 1.4E+00 1.4E+00 730 3.8E+01 3.5E+01 3.8E+01 1.2E+00 1.5E+00 2.2E+00 2.4E+00
1,825 5.2E+01 5.5E+01 5.4E+01 5.2E+00 6.2E+00 1.0E+01 1.1E+01 3,600 5.6E+01 5.9E+01 5.7E+01 3.9E+01 4.0E+01 1.1E+02 1.1E+02 7,300 6.1E+01 5.9E+01 6.5E+01 1.0E+02 8.9E+01 6.3E+02 3.9E+02
18,250 8.7E+01 8.9E+01 8.9E+01 1.4E+02 1.3E+02 3.7E+02 2.7E+02
1.0E-05
1.0E-04
1.0E-03
1.0E-02
1.0E-01
1.0E+00
1.0E+01
1.0E+02
1.0E+03
1 10 100 1000 10000 100000
Days Post Intake
Com
mitt
ed E
ffect
ive
Dos
e Eq
uiva
lent
(rem
) Uptake1-um Class W5-um Class W1-um Class Y5-um Class Y1-um Super Y5-um Super Y5-rem Dose Limit
Figure 8.37. Minimum Detectable Committed Effective Doses for 20-Year Aged Fuel-Grade Plutonium Based on Detection of 0.2 dpm/d 239Pu in Feces

Issued: January 31, 2003 PNNL-MA-860 Chapter 8.0 Page 8.67
Table 8.50. Minimum Detectable Committed Effective Dose Equivalent (rem) for 40-Year Aged Fuel-Grade Plutonium Based on Detection of 0.2 dpm/d 239Pu in Feces
Class W Inhalation Class Y Inhalation Super Class Y Inhalation Days Post
Intake Instant Uptake 1-µm 5-µm 1-µm 5-µm 1-µm 5-µm
1 2.5E-01 8.3E-04 4.5E-04 5.1E-04 1.1E-04 9.0E-04 1.8E-04 2 4.0E-01 7.0E-04 3.8E-04 4.1E-04 9.6E-05 7.3E-04 1.5E-04 5 1.3E+00 4.0E-03 3.2E-03 2.7E-03 8.2E-04 4.9E-03 1.3E-03 7 2.0E+00 1.5E-02 1.8E-02 1.2E-02 4.9E-03 2.2E-02 7.7E-03
14 3.3E+00 7.6E-02 2.2E-01 3.9E-01 4.3E-01 6.9E-01 7.0E-01 30 5.0E+00 9.5E-02 2.8E-01 5.1E-01 5.8E-01 9.0E-01 9.3E-01 60 7.6E+00 1.5E-01 4.3E-01 5.1E-01 6.1E-01 9.0E-01 9.7E-01 90 9.6E+00 2.2E-01 6.2E-01 5.5E-01 6.3E-01 9.8E-01 1.0E+00
180 1.3E+01 7.0E-01 2.0E+00 6.0E-01 7.1E-01 1.1E+00 1.2E+00 365 2.2E+01 1.9E+01 1.2E+01 7.7E-01 9.3E-01 1.4E+00 1.5E+00 730 4.0E+01 3.7E+01 3.8E+01 1.3E+00 1.5E+00 2.3E+00 2.4E+00
1,825 5.4E+01 5.7E+01 5.5E+01 5.5E+00 6.5E+00 1.1E+01 1.1E+01 3,600 5.8E+01 6.1E+01 5.9E+01 4.1E+01 4.2E+01 1.2E+02 1.2E+02 7,300 6.3E+01 6.1E+01 6.6E+01 1.1E+02 9.3E+01 6.5E+02 4.0E+02
18,250 9.0E+01 9.2E+01 9.0E+01 1.5E+02 1.3E+02 3.8E+02 2.7E+02
1.0E-05
1.0E-04
1.0E-03
1.0E-02
1.0E-01
1.0E+00
1.0E+01
1.0E+02
1.0E+03
1 10 100 1000 10000 100000
Days Post Intake
Com
mitt
ed E
ffect
ive
Dos
e Eq
uiva
lent
(rem
)
Uptake1-um Class W5-um Class W1-um Class Y5-um Class Y1-um Super Y5-um Super Y5-rem Dose Limit
Figure 8.38. Minimum Detectable Committed Effective Doses for 40-Year Aged Fuel-Grade Plutonium Based on Detection of 0.2 dpm/d 239Pu in Feces

PNNL-MA-860 Chapter 8.0 Issued: January 31, 2003 Page 8.68
Table 8.51. Minimum Detectable Committed Bone Surface Dose Equivalent (rem) for 10-Year Aged Weapons-Grade Plutonium Based on Detection of 0.2 dpm/d 239Pu in Feces
Class W Inhalation Class Y Inhalation Days Post
Intake Instant Uptake 1-µm 5-µm 1-µm 5-µm
1 2.8E+00 9.1E-03 5.0E-03 3.0E-03 8.2E-04 2 4.4E+00 7.7E-03 4.2E-03 2.4E-03 7.0E-04 5 1.4E+01 4.3E-02 3.5E-02 1.6E-02 6.0E-03 7 2.3E+01 1.6E-01 2.0E-01 7.1E-02 3.6E-02
14 3.6E+01 8.3E-01 2.4E+00 2.3E+00 3.1E+00 30 5.6E+01 1.0E+00 3.1E+00 3.0E+00 4.2E+00 60 8.5E+01 1.6E+00 4.8E+00 3.0E+00 4.4E+00 90 1.1E+02 2.4E+00 6.9E+00 3.2E+00 4.6E+00
180 1.5E+02 7.7E+00 2.2E+01 3.5E+00 5.2E+00 365 2.4E+02 2.1E+02 1.4E+02 4.5E+00 6.8E+00 730 4.4E+02 4.0E+02 4.2E+02 7.5E+00 1.1E+01
1,825 6.0E+02 6.2E+02 6.1E+02 3.2E+01 4.7E+01 3,600 6.4E+02 6.6E+02 6.5E+02 2.4E+02 3.1E+02 7,300 7.0E+02 6.6E+02 7.3E+02 6.2E+02 6.8E+02
18,250 1.0E+03 1.0E+03 1.0E+03 8.7E+02 9.7E+02
1.0E-04
1.0E-03
1.0E-02
1.0E-01
1.0E+00
1.0E+01
1.0E+02
1.0E+03
1 10 100 1000 10000 100000
Days Post Intake
Com
mitt
ed D
ose
Equi
vale
nt (r
em)
Uptake1-um Class W5-um Class W1-um Class Y5-um Class Y50-rem Dose Limit
Figure 8.39. Minimum Detectable Bone Surface Doses for 10-Year Aged Weapons-Grade Plutonium Based on Detection of 0.2 dpm/d 239Pu in Feces

Issued: January 31, 2003 PNNL-MA-860 Chapter 8.0 Page 8.69
Table 8.52. Minimum Detectable Committed Bone Surface Dose Equivalent (rem) for 20-Year Aged Weapons-Grade Plutonium Based on Detection of 0.2 dpm/d 239Pu in Feces
Class W Inhalation Class Y Inhalation Days Post
Intake Instant Uptake 1-µm 5-µm 1-µm 5-µm
1 2.9E+00 9.3E-03 5.1E-03 3.1E-03 8.2E-04 2 4.5E+00 7.9E-03 4.3E-03 2.5E-03 7.1E-04 5 1.5E+01 4.5E-02 3.6E-02 1.7E-02 6.0E-03 7 2.3E+01 1.6E-01 2.0E-01 7.4E-02 3.6E-02
14 3.7E+01 8.6E-01 2.4E+00 2.3E+00 3.2E+00 30 5.7E+01 1.1E+00 3.2E+00 3.1E+00 4.3E+00 60 8.7E+01 1.6E+00 4.9E+00 3.1E+00 4.5E+00 90 1.1E+02 2.4E+00 7.0E+00 3.3E+00 4.7E+00
180 1.5E+02 7.9E+00 2.3E+01 3.6E+00 5.3E+00 365 2.4E+02 2.1E+02 1.4E+02 4.7E+00 6.8E+00 730 4.5E+02 4.1E+02 4.3E+02 7.8E+00 1.1E+01
1,825 6.1E+02 6.4E+02 6.2E+02 3.3E+01 4.8E+01 3,600 6.6E+02 6.8E+02 6.6E+02 2.5E+02 3.1E+02 7,300 7.1E+02 6.8E+02 7.5E+02 6.4E+02 6.8E+02
18,250 1.0E+03 1.0E+03 1.0E+03 9.1E+02 9.8E+02
1.0E-04
1.0E-03
1.0E-02
1.0E-01
1.0E+00
1.0E+01
1.0E+02
1.0E+03
1.0E+04
1 10 100 1000 10000 100000
Days Post Intake
Com
mitt
ed D
ose
Equi
vale
nt(r
em)
Uptake1-um Class W5-um Class W1-um Class Y5-um Class Y50-rem Dose Limit
Figure 8.40. Minimum Detectable Bone Surface Doses for 20-Year Aged Weapons-Grade Plutonium Based on Detection of 0.2 dpm/d 239Pu in Feces

PNNL-MA-860 Chapter 8.0 Issued: January 31, 2003 Page 8.70
Table 8.53. Minimum Detectable Committed Bone Surface Dose Equivalent (rem) for 40-Year Aged Weapons-Grade Plutonium Based on Detection of 0.2 dpm/d 239Pu in Feces
Class W Inhalation Class Y Inhalation Days Post
Intake Instant Uptake 1-µm 5-µm 1-µm 5-µm
1 2.9E+00 9.4E-03 5.2E-03 3.1E-03 8.1E-04 2 4.5E+00 8.0E-03 4.4E-03 2.5E-03 7.0E-04 5 1.5E+01 4.5E-02 3.7E-02 1.7E-02 5.9E-03 7 2.3E+01 1.6E-01 2.0E-01 7.5E-02 3.5E-02
14 3.7E+01 8.6E-01 2.5E+00 2.4E+00 3.1E+00 30 5.7E+01 1.1E+00 3.2E+00 3.1E+00 4.2E+00 60 8.7E+01 1.6E+00 4.9E+00 3.1E+00 4.4E+00 90 1.1E+02 2.5E+00 7.1E+00 3.4E+00 4.6E+00
180 1.5E+02 8.0E+00 2.3E+01 3.7E+00 5.2E+00 365 2.5E+02 2.2E+02 1.4E+02 4.7E+00 6.7E+00 730 4.5E+02 4.1E+02 4.4E+02 7.9E+00 1.1E+01
1,825 6.1E+02 6.5E+02 6.3E+02 3.4E+01 4.7E+01 3,600 6.6E+02 6.9E+02 6.7E+02 2.5E+02 3.1E+02 7,300 7.1E+02 6.9E+02 7.6E+02 6.5E+02 6.7E+02
18,250 1.0E+03 1.0E+03 1.0E+03 9.2E+02 9.6E+02
1.0E-04
1.0E-03
1.0E-02
1.0E-01
1.0E+00
1.0E+01
1.0E+02
1.0E+03
1.0E+04
1 10 100 1000 10000 100000
Days Post Intake
Com
mitt
ed D
ose
Equi
vale
nt(r
em)
Uptake1-um Class W5-um Class W1-um Class Y5-um Class Y50-rem Dose Limit
Figure 8.41. Minimum Detectable Bone Surface Doses for 40-Year Aged Weapons-Grade Plutonium Based on Detection of 0.2 dpm/d 239Pu in Feces

Issued: January 31, 2003 PNNL-MA-860 Chapter 8.0 Page 8.71
Table 8.54. Minimum Detectable Committed Bone Surface Dose Equivalent (rem) for 10-Year Aged Fuel-Grade Plutonium Based on Detection of 0.2 dpm/d 239Pu in Feces
Class W Inhalation Class Y Inhalation Days Post
Intake Instant Uptake 1-µm 5-µm 1-µm 5-µm
1 4.3E+00 1.4E-02 7.6E-03 4.7E-03 1.2E-03 2 6.8E+00 1.2E-02 6.4E-03 3.8E-03 1.1E-03 5 2.2E+01 6.6E-02 5.4E-02 2.5E-02 9.0E-03 7 3.5E+01 2.4E-01 3.0E-01 1.1E-01 5.3E-02
14 5.6E+01 1.3E+00 3.6E+00 3.6E+00 4.7E+00 30 8.6E+01 1.6E+00 4.8E+00 4.7E+00 6.3E+00 60 1.3E+02 2.4E+00 7.3E+00 4.7E+00 6.6E+00 90 1.6E+02 3.6E+00 1.0E+01 5.1E+00 6.9E+00
180 2.3E+02 1.2E+01 3.4E+01 5.5E+00 7.8E+00 365 3.7E+02 3.2E+02 2.1E+02 7.2E+00 1.0E+01 730 6.8E+02 6.1E+02 6.4E+02 1.2E+01 1.7E+01
1,825 9.2E+02 9.5E+02 9.3E+02 5.1E+01 7.1E+01 3,600 1.0E+03 1.0E+03 9.9E+02 3.8E+02 4.6E+02 7,300 1.1E+03 1.0E+03 1.1E+03 9.8E+02 1.0E+03
18,250 1.5E+03 1.5E+03 1.5E+03 1.4E+03 1.5E+03
1.0E-03
1.0E-02
1.0E-01
1.0E+00
1.0E+01
1.0E+02
1.0E+03
1.0E+04
1 10 100 1000 10000 100000
Days Post Intake
Com
mitt
ed D
ose
Equi
vale
nt (r
em)
Uptake1-um Class W5-um Class W1-um Class Y5-um Class Y50-rem Dose Limit
Figure 8.42. Minimum Detectable Bone Surface Doses for 10-Year Aged Fuel-Grade Plutonium Based on Detection of 0.2 dpm/d 239Pu in Feces

PNNL-MA-860 Chapter 8.0 Issued: January 31, 2003 Page 8.72
Table 8.55. Minimum Detectable Committed Bone Surface Dose Equivalent (rem) for 20-Year Aged Fuel-Grade Plutonium Based on Detection of 0.2 dpm/d 239Pu in Feces
Class W Inhalation Class Y Inhalation Days Post
Intake Instant Uptake 1-µm 5-µm 1-µm 5-µm
1 4.5E+00 1.5E-02 8.1E-03 4.9E-03 1.3E-03 2 7.1E+00 1.3E-02 6.8E-03 4.0E-03 1.1E-03 5 2.3E+01 7.1E-02 5.7E-02 2.7E-02 9.4E-03 7 3.6E+01 2.6E-01 3.2E-01 1.2E-01 5.6E-02
14 5.9E+01 1.4E+00 3.9E+00 3.8E+00 4.9E+00 30 9.0E+01 1.7E+00 5.1E+00 4.9E+00 6.7E+00 60 1.4E+02 2.6E+00 7.7E+00 4.9E+00 6.9E+00 90 1.7E+02 3.9E+00 1.1E+01 5.3E+00 7.3E+00
180 2.4E+02 1.3E+01 3.6E+01 5.8E+00 8.2E+00 365 3.9E+02 3.4E+02 2.2E+02 7.5E+00 1.1E+01 730 7.1E+02 6.5E+02 6.8E+02 1.3E+01 1.8E+01
1,825 9.6E+02 1.0E+03 9.9E+02 5.3E+01 7.4E+01 3,600 1.0E+03 1.1E+03 1.0E+03 4.0E+02 4.8E+02 7,300 1.1E+03 1.1E+03 1.2E+03 1.0E+03 1.1E+03
18,250 1.6E+03 1.6E+03 1.6E+03 1.5E+03 1.5E+03
1.0E-03
1.0E-02
1.0E-01
1.0E+00
1.0E+01
1.0E+02
1.0E+03
1.0E+04
1 10 100 1000 10000 100000
Days Post Intake
Com
mitt
ed D
ose
Equi
vale
nt(r
em)
Uptake1-um Class W5-um Class W1-um Class Y5-um Class Y50-rem Dose Limit
Figure 8.43. Minimum Detectable Bone Surface Doses for 20-Year Aged Fuel-Grade Plutonium Based on Detection of 0.2 dpm/d 239Pu in Feces

Issued: January 31, 2003 PNNL-MA-860 Chapter 8.0 Page 8.73
Table 8.56. Minimum Detectable Committed Bone Surface Dose Equivalent (rem) for 40-Year Aged Fuel-Grade Plutonium Based on Detection of 0.2 dpm/d 239Pu in Feces
Class W Inhalation Class Y Inhalation Days Post
Intake Instant Uptake 1-µm 5-µm 1-µm 5-µm
1 4.6E+00 1.5E-02 8.3E-03 4.9E-03 1.4E-03 2 7.3E+00 1.3E-02 7.0E-03 4.0E-03 1.2E-03 5 2.4E+01 7.3E-02 5.9E-02 2.7E-02 1.0E-02 7 3.8E+01 2.7E-01 3.3E-01 1.2E-01 5.9E-02
14 6.1E+01 1.4E+00 4.0E+00 3.7E+00 5.2E+00 30 9.3E+01 1.7E+00 5.2E+00 4.9E+00 7.1E+00 60 1.4E+02 2.7E+00 8.0E+00 4.9E+00 7.4E+00 90 1.8E+02 4.0E+00 1.1E+01 5.3E+00 7.7E+00
180 2.4E+02 1.3E+01 3.7E+01 5.8E+00 8.7E+00 365 4.0E+02 3.5E+02 2.3E+02 7.5E+00 1.1E+01 730 7.3E+02 6.7E+02 7.0E+02 1.2E+01 1.9E+01
1,825 1.0E+03 1.0E+03 1.0E+03 5.3E+01 7.9E+01 3,600 1.1E+03 1.1E+03 1.1E+03 4.0E+02 5.1E+02 7,300 1.2E+03 1.1E+03 1.2E+03 1.0E+03 1.1E+03
18,250 1.7E+03 1.7E+03 1.7E+03 1.4E+03 1.6E+03
1.0E-03
1.0E-02
1.0E-01
1.0E+00
1.0E+01
1.0E+02
1.0E+03
1.0E+04
1 10 100 1000 10000 100000
Days Post Intake
Com
mitt
ed D
ose
Equi
vale
nt(r
em)
Uptake1-um Class W5-um Class W1-um Class Y5-um Class Y50-rem Dose Limit
Figure 8.44. Minimum Detectable Bone Surface Doses for 40-Year Aged Fuel-Grade Plutonium Based on Detection of 0.2 dpm/d 239Pu in Feces

PNNL-MA-860 Chapter 8.0 Issued: January 31, 2003 Page 8.74
8.4.6 Recommended Bioassay Monitoring Program The recommended periodic bioassay-monitoring program for plutonium is to perform annual in vivo lung measurements and annual plutonium-in-urine assessments. Annual chest counts provide a reasonable capability of demonstrating compliance with the 50-rem deterministic dose limit for the bone surfaces as the most limiting intake condition for class Y inhalations, and also are likely to be capable of demonstrating compliance for inhalation of super class Y based on the effective dose equivalent as the most restrictive dose limit. More frequent chest counting is not particularly effective in lowering the MDD unless it is performed immediately after an intake. Annual urine sampling provides capability for demonstrating compliance with both deterministic and stochastic dose limits for instantaneous uptake and inhalations of class W material. Substantially more frequent urine sampling can lower the MDD for instantaneous uptakes or class W inhalations; however, the improvement in sensitivity is not necessarily commensurate with the added cost (e.g., going from annual to quarterly urine samples quadruples the cost but only improves the MDD by a little over a factor of 2). Routine fecal sampling could provide some improvements for class Y inhalation monitoring, however the attendant difficulties with collection (worker inconvenience), analysis (a very difficult matrix to analyze), and interpretation (potential interference from minor ingestion) suggest that fecal sampling is best applied to special investigations. These recommendations do not provide the high degree of sensitivity for internal dose estimation available for fission products. The lack of sensitivity is due to the much higher dose per unit intake associated with tenaciously retained alpha-emitting radionuclides as compared with beta- and gamma-emitting fission products. Because of the lack of sensitivity of periodic bioassay, special bioassay monitoring as a supplement to the routine program should be promptly initiated by workplace indications of potential internal exposure to plutonium. When adequate measurements are made promptly after a suspected intake, good sensitivity to potential dose can be obtained.
8.4.7 Special Bioassay Monitoring If a potential intake of plutonium is suspected, special bioassay monitoring should be quickly initiated. Typically this monitoring should include same-day in vivo measurements, overnight or first-day urine collection, and early fecal sample collection. The early fecal samples are particularly important for relatively insoluble

Issued: January 31, 2003 PNNL-MA-860 Chapter 8.0 Page 8.75
forms of plutonium (class Y and super Y) because in vivo and urine sample measurements are relatively insensitive to these intakes. An early single voiding urine sample may also be warranted for determining the need for potential dose-reduction therapy. If DTPA chelation therapy was administered, then a total urine sample collection is recommended to reduce any uncertainties associated with sample normalization. Total urine sample collection should be continued until the excretion pattern is established. How many special bioassay measurements to obtain is a matter of professional judgment, factoring in the potential significance of the exposure, the appropriate types of measurements, worker inconvenience, cost, and the degree of confidence required in the assessment. Generally, if an initial chest count shows detectable lung activity, a next-day follow-up chest count should be performed to monitor early lung clearance. Additional counts are warranted if detection continues. Total fecal sample collections for the first week allow for complete observation of the early fecal clearance pattern and permit a higher degree of confidence in the intake estimate than does a single sample. Because the general early fecal clearance pattern is not significantly different for inhalation class W or Y, the fecal-based intake estimate needs to be coupled with at least one early urine sample representing a period concurrent with at least one fecal sample to allow for a determination of inhalation class based on the ratio of fecal to urine excretion. The extent of this collection protocol can pose substantial inconvenience to the worker and can be costly. Such inconvenience and cost may be justified when doses are considered relatively high (e.g., greater than 500- to 1000-mrem committed effective dose equivalent). At lower doses, reliance on more limited measurements (e.g., one or two fecal samples and a urine sample) and standard assumptions of the source material and ICRP Reference Man biokinetic behavior may be appropriate.
8.4.8 Bioassay Monitoring Capability for Workers with Known Plutonium Depositions The capability of a bioassay program is directly dependent upon the magnitude of an identifiable increase in a bioassay measurement. When a worker has a positive baseline bioassay level due to a previous intake, the ability to detect a subsequent increase in the bioassay level from an additional intake is more dependent on the variability of current bioassay levels and less dependent on analytical capability. In other words, to be detected, subsequent intakes must result in increases in bioassay measurements that exceed the baseline “noise” level. Guidance concerning the minimum detectable dose from potential additional intakes must be developed on a case-by-case basis. Appropriate adjustments to measurement frequencies can then be determined based on the potential undetected dose. As an

PNNL-MA-860 Chapter 8.0 Issued: January 31, 2003 Page 8.76
approximate rule-of-thumb, a single bioassay measurement will probably have to be at least twice the baseline level to be readily recognized, due to the substantial variability in single bioassay measurements on individual people. For many situations, this may imply that a normally detectable intake may not be detectable on top of a pre-existing internal plutonium deposition. Like most rules-of-thumb, this is only a rough suggestion; cases of significance must be addressed individually.
8.5 Assessment of Internal Dose The following subsections discuss two general approaches to internal dosimetry and highlight some applications and caveats associated with different types of bioassay data. The most typical method used for plutonium internal dosimetry is intake assessment using fecal, urine, and in vivo data, as available. This method has been used for most Hanford assessments since the early 1990s. Prior to that the predominant method was a deposition assessment based primarily on urine data. It is a good practice to compare estimates based on different bioassay data sets for the same intake.
8.5.1 Intake Assessment An intake of plutonium can be estimated by fitting the bioassay data to the appropriate retention or excretion function, using manual or computerized techniques. For a single data point, the intake can be estimated by dividing the measured excretion by the value of the retention function for the appropriate day after intake represented by the sample in a manner similar to Equation 2.5. Values for the retention function can be obtained from those tabulated in this chapter, or directly from running the CINDY computer code. For multiple data points, the CINDY code provides a choice of fitting routines, or a manually determined fit of the data to the expected function can be performed. Once the intake is calculated, appropriate internal doses may be calculated by applying the dose coefficients of this chapter to Equation 2.10 or 2.11. The CINDY computer code may also be used to directly calculate internal doses, and is particularly appropriate for complex cases. In addition to their use for dose calculations, intakes calculated by the above techniques may also be compared with intake estimates based on air sample results. When bioassay data are not available or not sufficiently sensitive, air sample results may be the basis for estimating intake.

Issued: January 31, 2003 PNNL-MA-860 Chapter 8.0 Page 8.77
8.5.2 Deposition Assessment Deposition assessment involves determining the amount of material deposited in a body or tissue compartment of interest. Whereas the term intake includes all material taken into the body regardless of its subsequent fate, deposition is a more limited quantity that excludes material not retained (e.g., that immediately exhaled) and material not systemically absorbed (e.g., material cleared to the GI tract and excreted in feces without absorption). The HIDP coined the term presystemic deposition in the mid-1980s to precisely define what was being evaluated and avoid terms that had developed generic, nebulous, or varied meanings (e.g., deposition, uptake, burden). In addition, the term deposition was gaining preference in the field of internal dosimetry as a process term associated with the respiratory tract, rather than a retained quantity. The HIDP defined presystemic deposition as the total radioactivity that will ultimately translocate into the transfer compartment from a metabolically isolated pool; in other words, the activity ultimately reaching the blood. Historically at Hanford, this was the quantity compared with the maximum permissible body burden (MPBB) of 0.04 µCi (239Pu) listed in National Bureau of Standards Handbook 69 (NBS 1959), NCRP 22 (1959), and ICRP 2 (1959). It is related to, but significantly different from intake, lung deposition, long-term lung burden, and instantaneous body burden (or retained quantity). Activity is deposited in presystemic compartments at the time of intake. From there, systemic uptake may be essentially instantaneous (as with a readily transportable wound intake), or it may occur gradually over an extended period of time (as in the case of an inhalation of class Y material). Transfer from the presystemic compartment into systemic circulation is assumed to be governed by linear first-order kinetics, and can be described in terms of a transfer rate constant. The computer program PUCALC was written to evaluate alternate values of the transfer rate and presystemic deposition, based on the urinary excretion data. The program describes the urinary excretion of plutonium for user-selected values for the transfer rate and presystemic deposition. Additional information on PUCALC is available from the HIDP and the Hanford Radiation Records Historical File. It must be remembered that the presystemic deposition may be only part of the initial deposition in the body. In the case of the lung, the ICRP 30-lung model predicts that the presystemic deposition represents about one-third of the total deposition in the slowly clearing compartments of the lung. The total long-term lung

PNNL-MA-860 Chapter 8.0 Issued: January 31, 2003 Page 8.78
deposition must be considered when assessing lung doses. Experience with wounds has shown that a significant fraction of slowly transportable activity can become bound up in tissue at the wound site or captured by lymph nodes and is essentially walled-off or permanently isolated from the transfer compartment. Whether this might represent a true isolation, or merely an extremely slow transfer rate, is a matter of some speculation. The need to determine localized tissue deposits for potentially small wound areas from slowly transportable plutonium must be decided on a case-by-case basis.
8.5.3 Applications of Fecal Data Fecal data can be used in two ways for plutonium assessments. First, it can provide isotopic composition information for use with other bioassay and monitoring data. Secondly, it can be used in conjunction with a biokinetic model to estimate intake or initial depositions in various compartments of the respiratory tract. Caution must be exercised in interpreting fecal data because a slight ingestion intake can significantly bias inhalation intake estimates. There is no way to differentiate inhalation from ingestion intakes by early fecal data. Follow-up fecal samples somewhat removed in time from the intake (2 to 4 weeks or more) may be helpful in determining if observed fecal activity is from lung clearance or ingestion clearance. Fecal excretion is also highly dependent on particle size, with larger sizes being more readily excreted in feces. Early fecal sampling is typically the most sensitive bioassay indicator of plutonium intake. Experience with Hanford cases suggests that the first fecal sample following an intake is likely to bias inhalation intake estimates high due to possible concurrent ingestion of large, nonrespirable particles. Undue emphasis should not be placed on the first fecal sample when other data appear to contradict it. For this reason, collection of multiple fecal samples is a good practice.
8.5.4 Applications of Urine Data Urine sampling is the simplest and most accepted excreta sampling method by workers, however it is not particularly sensitive to low-level intakes. It is most appropriate for instantaneous uptake (wound) and class W inhalations, and as a tool to compare with fecal samples to determine the inhalation class of an intake. Urine sample data are generally not considered a good basis for estimating initial lung depositions; however, they can be helpful and occasionally may be the only data available. For known inhalation exposures, the presystemic deposition estimated using the technique described in the preceding section can provide an indication of initial

Issued: January 31, 2003 PNNL-MA-860 Chapter 8.0 Page 8.79
lung deposition. By using the presystemic deposition estimate as the ultimate quantity to be translocated into the transfer compartment, the compartment fractions of the ICRP 30 respiratory tract model can be used to estimate initial deposition in the various compartments. For example, the initial deposition in the long-term pulmonary region compartments (ICRP 30 lung model compartments e, g, and h) can be estimated by attributing the slowly transportable presystemic deposition to pulmonary compartments e and h, and then multiplying that value by the ratio of the total long-term compartment fractions to the fraction in the presystemic compartments as follows:
he
hge0 FF
FFF)he(UP
+
++×+= ∞ (8.2)
where P0 is the initial long-term pulmonary deposition, U∞(e+h) is the slowly transportable presystemic deposition, and Fe, Fg, Fh are ICRP 30 lung model compartment deposition fractions.
8.5.5 Applications of In Vivo Data Chest counting data for plutonium is subject to some significant interpretation pitfalls, especially when it shows 241Am detection over very long periods. Evaluations of chest count data must consider the potential for interference from activity deposited in other organs (particularly the skeleton and liver), as well as the specific chest-wall thickness of the individual. In addition, 241Am ingrowth over time can complicate the determination of actual retention. The HIDP has developed the AMERIN computer code to assist with case evaluations as a tool to identify an 241Am biological clearance rate consistent with observed ingrowth in a single compartment. This tool is particularly applicable to long-term lung retention of 241Pu and 241Am. Initial lung depositions can be estimated based on direct in vivo measurements, fecal data, urine data, or a combination of such data. When there is direct knowledge, or a reasonable assumption, of the isotopic composition of a plutonium mixture, direct in vivo measurement of 241Am in the lung can be used to evaluate lung depositions. A series of detectable 241Am measurements can be used to establish the effective lung clearance rate, and the plutonium depositions can be estimated by activity ratios relative to 241Am. In analyzing long-term lung measurement data, consideration must be given to the potential impact of the ingrowth of 241Am from 241Pu. This requires that the clearance rate of the 241Am relative to that of 241Pu be known. Laboratory animal research data have indicated that early clearance of plutonium mixtures from the lung may be enriched

PNNL-MA-860 Chapter 8.0 Issued: January 31, 2003 Page 8.80
in 241Am relative to the intake composition. This has been attributed to a more rapidly clearing component of the 241Am that is initially deposited in the lung along with the plutonium. Once this initially soluble 241Am has been cleared, the observed clearance rate for the remaining 241Am will be similar to that of the host matrix material, i.e., plutonium (Eidson 1980). Lung measurement results are also useful as an appropriate upper bound estimate for use with other intake estimates.
8.5.6 Assessing Organ and Effective Dose Equivalents The organs of primary interest for plutonium dose evaluations are the bone surface, red marrow, liver, and gonads. The lung is also an organ of interest for inhalations. Other organs or tissues may be of interest depending on the nature of an intake. For example, the dose to a specific lymph node or small volume of tissue may be of academic interest as the result of a wound intake of slowly transportable materials, even though doses to such tissues are not considered doses of record for compliance purposes. Such cases can be dealt with as they arise and are beyond the general scope of this technical basis. Plutonium reaching the transfer compartment is assumed to be distributed to the liver, bone surfaces, and the gonads according to the ICRP 30 Part 4 biokinetic model. Once deposited in these tissues, the ICRP 30 Part 4 clearance rates are assumed to apply. Thus, for calculating organ doses, the ICRP 30 Part 4 organ-retention functions and dosimetry factors are normally used. Because plutonium cannot be effectively measured in the systemic organs, and because plutonium and americium may not behave similarly after reaching the systemic organs, caution must be exercised in using measurements of americium in systemic organs for plutonium dose calculations based on the isotope ratios existing at the time of intake. Isotope ratios can change with time due to the different solubility rates and retention characteristics of plutonium and americium. However, americium measurements can be used for americium dose calculations. Once the magnitude of an intake, presystemic deposition, or initial lung deposition has been determined, organ dose equivalents and the effective dose equivalent can be assessed using hand-calculation techniques or computer codes. The HIDP uses the CINDY computer code to aid in dose calculations. More detailed explanations and a copy of the code are maintained in the Hanford Radiation Protection Historical Files.

Issued: January 31, 2003 PNNL-MA-860 Chapter 8.0 Page 8.81
8.6 Management of Internal Contamination Cases This section discusses the diagnostic procedures, therapeutic actions, and long-term monitoring of internal depositions.
8.6.1 Diagnostic Procedures The diagnosis of an intake involves a combination of workplace monitoring to identify on-the-job potential intakes and bioassay measurements to confirm and quantify internal contamination. The primary method of identifying potential intakes is by workplace monitoring, such as personal contamination surveys, nasal smear analyses, air sample results, or workers’ identifications of unusual conditions. These techniques provide qualitative screening to alert radiation protection staff to potential internal exposure, rather than absolute confirmation that exposure has or has not occurred. For example, activity detected on nasal smears is usually an indication of an inhalation intake; however, the absence of activity does not necessarily mean that an intake did not occur. The absence of nasal smear activity following an inhalation intake can be explained by a sufficient delay between the time of intake and the collection of nasal smears to allow for complete clearance of activity from the nares. The ICRP 30 respiratory tract model indicates that a delay of as little as 30 to 60 minutes may be adequate for this in some cases. Alternatively, some individuals are mouth-breathers, whose noses are partially or completely bypassed in the respiratory process, hence no activity may be deposited in the nares, despite the occurrence of an inhalation intake. Particle size can also significantly affect nasal deposition and clearance. Once a worker has been identified as having incurred a potential intake, the initial diagnostic measurements are arranged. These may include a chest count, wound count, single voiding (spot) urine sample analysis, first-day fecal sampling, and overnight urine sampling. The purpose of these initial procedures is to provide an order-of-magnitude estimate of the potential internal exposure and dose. Initial diagnostic measurements are usually sufficient for final evaluations only when all results collectively rule out the possibility of an intake. In reality, initial measurements are not generally expected to do this, and follow-up measurements are necessary. Follow-up diagnostic measurements may include additional urine and fecal samples, chest counts, liver counts, head counts, and lymph node counts. These analyses aid in determining the magnitude,

PNNL-MA-860 Chapter 8.0 Issued: January 31, 2003 Page 8.82
location, and retention characteristics of the deposited material. In some cases, blood samples or tissue specimens may also be appropriate. In addition, workplace or clothing contamination analyses, air sample analyses, particle size analyses, and/or solubility analyses may be performed to more clearly define the physical and radiological characteristics of the material to which the worker was exposed. It is the responsibility of the exposure evaluator, working closely with contractor radiation protection staff, to determine the appropriate diagnostic protocols. Scheduling of follow-up measurements will normally be done by the appropriate contractor radiation protection staff.
8.6.2 Therapeutic Actions Therapeutic actions for potential internal contamination includes the use of decorporation agents, catharsis, and surgical excision. For the purposes of this discussion, the normal skin decontamination procedures of Hanford contractors are not considered therapeutic actions, although it is acknowledged that these procedures can be quite effective in preventing the intake of radioactivity. The decision to undertake one or more of these therapeutic actions is the responsibility of the participating HEHF Occupational Medicine care provider with the concurrence of the patient. The exposure evaluator will provide advice and consultation to the physician and patient regarding the potential dose implications and efficacy of alternative actions. Guidance for the methods of therapy can be found in NCRP Report 65 (1980) and in the “Guidebook for the Treatment of Accidental Internal Radionuclide Contamination of Workers” (Bhattacharyya et al. 1992). Guidance for circumstances under which therapy may be warranted is contained in PNL-MA-552,(a) but was established as a good practice based on experience rather than a detailed technical analysis. Decorporation therapy, also referred to as chelation therapy, involves the chemical removal of radioactivity from the bloodstream through drug administration. The drug DTPA has U.S. Food and Drug Administration approval as an investigational new drug for use in removing plutonium and other heavy metals from the body. Under the investigational new drug category, the patient must provide
(a) Pacific Northwest National Laboratory (PNNL). Hanford Internal Dosimetry Project Manual.
PNNL-MA-552, Richland, Washington. (Internal manual.) Available URL: http://www.pnl.gov/eshs/pub/pnnl552.html

Issued: January 31, 2003 PNNL-MA-860 Chapter 8.0 Page 8.83
informed consent to HEHF before the drug can be administered. Other drugs are also available to HEHF Occupational Medicine, but none has demonstrated the efficacy of DTPA for plutonium chelation. The decision to administer DTPA is usually made based on workplace indicators suggesting the likelihood of a significant uptake. Urinalysis is required to determine the actual efficacy of treatment. When DTPA is indicated, special emergency processing of a single void urine sample should be performed to determine if additional (i.e., extended) therapy might be warranted. Professional judgment is required on the part of the medical and exposure evaluator staff to determine if continued therapy is warranted. DTPA chelation therapy can enhance urine excretion of plutonium by up to a factor of 100 or more for highly soluble forms of plutonium. For insoluble forms, it is relatively ineffective. Because of this wide range of effectiveness, dosimetric interpretation of the urine data of a person undergoing chelation therapy is problematic. Bihl (1994) has suggested a dose-averted method for interpreting urine data. The historical practice at Hanford was to base final dosimetry on urine samples obtained long after the excretion enhancement effect of DTPA had passed (typically 30 to 100 days following therapy). Catharsis involves accelerating the passage of material through the GI tract by means of laxative drugs or physical means such as an enema. Catharsis has potential value in reducing the adsorption of material into the blood stream from the GI tract and in reducing the dose to the GI tract organs from material passing through the GI tract. These measures are not generally considered for occupational exposures to plutonium, because the GI tract adsorption of plutonium is so slight, and the dose to the GI tract organs is usually an insignificant fraction of the total effective dose. Surgical excision following wounds can be extremely effective in reducing the potential uptake, particularly when coupled with decorporation therapy. Minor excisions are usually performed at the Emergency Decontamination Facility (EDF) by HEHF Occupational Medicine staff, assisted by PNNL exposure evaluation and radiation protection personnel.
8.6.3 Long-Term Monitoring of Internal Depositions Once an internal dosimetry evaluation has been completed, it may be recommended that the worker be placed on a specialized long-term bioassay monitoring schedule. The reasons for this are twofold: first, long-term follow-up monitoring results that are consistent with the projected results verify the conclusions of the evaluation. Second, if long-term results are projected to be detectable, and the

PNNL-MA-860 Chapter 8.0 Issued: January 31, 2003 Page 8.84
worker returns to plutonium work, then the capability of a routine bioassay monitoring program to detect an additional intake may be affected. This latter point is addressed in greater detail in Section 8.4.8. Specialized bioassay monitoring programs may be required for workers with known internal depositions of plutonium. These programs may include head counts, liver counts, periodic chest counts, and urine samples. In some cases fecal sampling may also be desired. It is the responsibility of the HIDP to recommend appropriate long-term bioassay monitoring to the contractor dosimetry or radiation protection organization that has the responsibility for acting on these recommendations.
8.7 References Bhattacharyya, M. H., B. D. Breitenstein, H. Metivier, B. A. Muggenburg, G. N. Stradling, and V. Volf. 1992. “Guidebook for the treatment of accidental internal radionuclide contamination of workers.” Rad. Prot. Dosim. 41:1. Bihl, D. E. 1994. “A dose-averted approach to intervention levels for intakes of plutonium.” Health Phys. 66(Supplement):S72. Bihl, D. E., T. P. Lynch, E. H. Carbaugh, and M. J. Sula. 1988. Methods to Improve Routine Bioassay Monitoring for Freshly Separated, Poorly Transported Plutonium. PNL-6695, Pacific Northwest Laboratory, Richland, Washington. Carbaugh, E. H., D. E. Bihl, and M. J. Sula. 1991. “Long-term follow-up of HAN-1, an acute plutonium oxide inhalation case.” Rad. Prot. Dosim. 38(1/3):99-104. Eidson, A. F. 1980. Comparison of Physical Chemical Properties of Powders and Respirable Aerosols of Industrial Mixed Uranium and Plutonium Oxide Fuels. NUREG/CR-1736, U.S. Nuclear Regulatory Commission, Washington, D.C. Foster, P. P. 1991. “Study of a plutonium oxide fuel inhalation case.” Rad. Prot. Dosim. 38(1-3):141-146. Griffith, R. V., P. N. Dean, A. L. Anderson, and J. C. Fisher. 1978. “Fabrication of a Tissue-Equivalent Torso Phantom for Intercalibration of In-Vivo Transuranic-Nuclide Counting Facilities.” In Advances in Radiation Monitoring, Proceedings of an International Atomic Energy Agency conference. International Atomic Energy Agency, Vienna, Austria.

Issued: January 31, 2003 PNNL-MA-860 Chapter 8.0 Page 8.85
Healy, J. W. 1957. “Estimation of plutonium lung burden by urine analysis.” Am. Ind. Hyg. Assoc. Qrtrly 18(3):261-266. International Commission on Radiological Protection (ICRP). 1959. Report of Committee II on permissible dose for internal radiation. ICRP publication 2, Pergamon Press, New York. International Commission on Radiological Protection (ICRP). 1969. Evaluation of radiation doses to body tissues from internal contamination due to occupational exposure. ICRP publication 10, Pergamon Press, New York. International Commission on Radiological Protection (ICRP). 1972. The metabolism of compounds of plutonium and other nuclides. ICRP publication 19, Pergamon Press, New York. International Commission on Radiological Protection (ICRP). 1974. Report of task group on Reference Man. ICRP publication 23, Pergamon Press, New York, New York. International Commission on Radiological Protection (ICRP). 1977. “Recommendations of the international commission on radiological protection.” (ICRP publication 26). Annals of the ICRP, 1:3. Pergamon Press, New York. International Commission on Radiological Protection (ICRP). 1979. “Limits for intakes of radionuclides by workers.” (ICRP publication 30, part 1 and supplements). Annals of the ICRP, 2:3-4 and 3:1-4. Pergamon Press, New York. International Commission on Radiological Protection (ICRP). 1983. “Radionuclide transformations: Energy and intensity of emissions.” (ICRP publication 38). Annals of the ICRP, Volumes 11-13. Pergamon Press, New York. International Commission on Radiological Protection (ICRP). 1986. “The metabolism of plutonium and related elements.” (ICRP publication 48). Annals of the ICRP, 16:2-3. Pergamon Press, New York. International Commission on Radiological Protection (ICRP). 1988. “Limits for intakes of radionuclides by workers: an addendum.” (ICRP publication 30, part 4). Annals of the ICRP, 19:4. Pergamon Press, New York.

PNNL-MA-860 Chapter 8.0 Issued: January 31, 2003 Page 8.86
International Commission on Radiological Protection (ICRP). 1989. “Age-dependent doses to members of the public from intake of radionuclides: Part 1.” (ICRP publication 56). Annals of the ICRP, 20:2. Pergamon Press, New York. International Commission on Radiological Protection (ICRP). 1993. “Age-dependent doses to members of the public from intake of radionuclides: Part 2 ingestion dose coefficients.” (ICRP publication 67). Annals of the ICRP, 23:3-4. Pergamon Press, NewYork. International Commission on Radiological Protection (ICRP). 1994a. “Human respiratory tract model for radiological protection.” (ICRP publication 66). Annals of the ICRP, 24:1-3. Pergamon Press, New York. International Commission on Radiological Protection (ICRP). 1994b. “Dose coefficients for intakes of radionuclides by workers.” (ICRP publication 68). Annals of the ICRP, 24:4. Pergamon Press, New York. International Commission on Radiological Protection (ICRP). 1997. “Individual monitoring for internal exposure of workers.” (ICRP publication 78). Annals of the ICRP, 27:3-4. Pergamon Press, New York. Ibrahim, S. A., F. W. Whicker, S. K. Reuss, R. D. Whicker, P. L Chapman, and M. P. Krahenbuhl. 1999. “Plutonium excretion in urine of residents living near the Rocky Flats Environmental Technology Site.” Health Phys. 76(4)368-379. Jones, S. R. 1985. “Derivation and validation of a urinary excretion function for plutonium applicable over tens of years post intake.” Rad. Prot. Dosim. 11(1):19-27. Kathren, R. L. 1994. “Toward improved biokinetic models for actinides: The United States Transuranium and Uranium Registries, a Twenty-Five Year Report.” Rad. Prot. Dosim. 53:1-4(219-227). La Bone, T. R., E. H. Carbaugh, W. C. Griffith, R. A. Guilmette, and K. W. Skrable. 1992. Evaluation of Savannah River Site Internal Dosimetry Registry Case 665(U). ESH-HPT-920178, Westinghouse Savannah River Company, Aiken, South Carolina. Langham, W. H. 1956. “Determination of internally deposited radioactive isotopes from excretion analysis.” Am. Ind. Hyg. Assoc. Qrtrly. 17(3):305-318.

Issued: January 31, 2003 PNNL-MA-860 Chapter 8.0 Page 8.87
Langham, W. H., S. H. Basset, P. S. Harris, and R. E. Carter. 1950. “Distribution and excretion of plutonium administered to man.” LA-1151, Los Alamos Scientific Laboratory, Los Alamos, New Mexico. Reprinted in Health Phys. 38:1031-1060. McInroy, J. F., E. E. Campbell, W. D. Moss, G. L. Tietjen, B. C. Eutsler, and H. A. Boyd. 1979 “Plutonium in autopsy tissue: A revision and updating of data reported in LA-4875.” Health Phys. 37(1):1-136. McInroy, J. F., H. A. Boyd, and B. C. Eutsler. 1981. “Deposition and retention of plutonium in the United States general population.” In Actinides in Man and Animals, ed. M. Wrenn, pp. 161-181. R. D. Press, Salt Lake City, Utah. Moody, J. C., G. N. Stradling, and A. R. Britcher. 1994. “Biokinetics of three industrial plutonium nitrate materials: Implications for human exposure.” Rad. Prot. Dosim. 53:1-4(169-172). Moss, W. D., and M. A. Gautier. 1985. Additional Short-Term Plutonium Urinary Excretion Data from the 1945-1947 Plutonium Injection Studies. Occupational Health and Environmental Research 1983: Health, Safety, and Environment Division. LA-10365-PR, Los Alamos National Laboratory, Los Alamos, New Mexico. National Bureau of Standards (NBS). 1959. Maximum Permissible Body Burdens and Maximum Permissible Concentrations of Radionuclides in Air and Water for Occupational Exposure. Handbook 69, U.S. Department of Commerce, Washington, D.C. National Council on Radiation Protection and Measurements (NCRP). 1959. Maximum Permissible Body Burdens and Maximum Permissible Concentrations of Radionuclides in Air and in Water for Occupational Exposure. NCRP Report No. 22, Bethesda, Maryland. National Council on Radiation Protection and Measurements (NCRP). 1980. Management of Persons Accidentally Contaminated with Radionuclides. NCRP Report No. 65, Bethesda, Maryland. National Council on Radiation Protection and Measurements (NCRP). 1985. General Concepts for the Dosimetry of Internally Deposited Radionuclides. NCRP Report No. 84, Bethesda, Maryland.

PNNL-MA-860 Chapter 8.0 Issued: January 31, 2003 Page 8.88
Nelson, I. C., V. W. Thomas, Jr., and R. L. Kathren. 1993. “Plutonium in South-Central Washington State autopsy tissue samples—1970-1975.” Health Phys. 65(4):422-428. Rittman, P. D. 1984. Seven Health Physics Calculator Programs for the HP-41CV. RHO-HS-ST-5 P, Rockwell Hanford Operations, Richland, Washington. Rundo, J., P. M. Starzyk, J. Sedlet, R. P. Larsen, R. D. Oldham, and J. J. Robinson. 1976. “The excretion rate and retention of plutonium 10,000 days after acquisition.” In Diagnosis and Treatment of Incorporated Radionuclide. International Atomic Energy Agency, Vienna, Austria. Stradling, G. N., and J. W. Stather. 1989. “The use of animal experiments for assessing annual limits on intake and interpreting chest-monitoring data for workers exposed to industrial actinide-bearing dusts.” Health Phys. 57: Supplement 1:221-228. Strenge, D. L., R. A. Kennedy, M. J. Sula, and J. R. Johnson. 1992. Code for Internal Dosimetry (Cindy Version 1.2), Part 1: Conceptual Representation. PNL-7493 Pt. 1, Rev. 1. Pacific Northwest National Laboratory, Richland, Washington. Sula, M. J., R. L. Kathren, D. E. Bihl, and E. H. Carbaugh. 1987. Comparison of Premortem and Postmortem Estimates of Plutonium in the Skeleton and Liver of Six Individuals. PNL-SA-14714, Pacific Northwest National Laboratory, Richland, Washington. Sula, M. J., E. H. Carbaugh, and D. E. Bihl. 1989. Technical Basis for Internal Dosimetry at Hanford. PNL-6866, Pacific Northwest Laboratory, Richland, Washington. Sula, M. J., E. H. Carbaugh, and D. E. Bihl. 1991. Technical Basis for Internal Dosimetry at Hanford. PNL-6866 Revision 1, Pacific Northwest National Laboratory, Richland, Washington. U.S. Department of Energy (DOE). 1992. Radiological Control Manual. DOE/EH-0256T, Washington, D.C. U.S. Department of Energy (DOE). 1998. Guide of Good Practices for Occupational Radiological Protection in Plutonium Facilities. DOE-STD-1128-98, Washington, D.C. Available URL: http://tis.eh.doe.gov/whs/rhmwp/pluton.pdf

Issued: January 31, 2003 PNNL-MA-860 Chapter 8.0 Page 8.89
Wrenn, M. E., N. P. Singh, and Y. H. Xue. 1994. “Urinary excretion of 239Pu by the general population: Measurement technique and results.” Rad. Prot. Dosim. 53:1-4(81-84).

9.0 Americium
This chapter provides technical information on the sources and characteristics of americium and summarizes the technical basis for its internal dosimetry at Hanford. Dosimetry methods used are based on the concepts of ICRP 48 (1986) and ICRP 67 (1993), as implemented using the CINDY computer code (Strenge et al. 1992).
9.1 Sources and Characteristics Americium at Hanford can be found as the ingrown 241Am progeny of 241Pu in a plutonium mixture or as a separated 241Am isotope that exists singly or in combination with other separated isotopes in waste mixtures. In addition, 243Am has been used in some PNNL facilities as a research isotope. The 241Am existing as an ingrown progeny in a plutonium mixture is typically a small fraction of the mass of the mixture. Consequently, it is assumed to be trapped in a plutonium matrix and exhibits the basic solubility and biokinetic characteristics of plutonium, rather than of pure americium. Ingrown 241Am is typically encountered at plutonium facilities such as most of the Plutonium Finishing Plant (PFP [234-5Z Building]), the Plutonium-Uranium Extraction (PUREX) Plant (202-A), the 233-S Building, or research facilities such as the former Critical Mass Laboratory (209-E). Separated 241Am can also be encountered at PFP because chemical separation of 241Am from plutonium was a routine process at the Plutonium Reclamation Facility (PRF, 236-Z) or the 242-Z facility and the 241Am product was handled in PFP. The 242-Z facility was the site of the 1976 americium column explosion, which resulted in extensive contamination of the facility and its subsequent physical isolation from routine entry. Separated 241Am is also a trace contaminant in many of the 200-Area tank farm waste mixtures. During routine waste management activities, the trace americium was part of an intimately mixed waste slurry from the fuel processing facilities that was pumped into the waste tanks. With time, the slurry separated into a sludge at the bottom of the tank and a supernate liquid above the sludge. The trace americium was retained primarily in the supernate, along with 137Cs, while the sludge retained the majority of the trace plutonium and 90Sr. Subsequent supernate concentration activities produced salt cake that could also retain the trace 241Am. It is not likely that tank farm waste would contain separated 241Am as a pure isotope; it can be anticipated that it would be accompanied by much larger quantities of fission product activity.
Issued: January 31, 2003 PNNL-MA-860 Chapter 9.0 Page 9.1

Pure isotopes of 241Am and 243Am can be found in analytical laboratory standard solutions and in pure isotope research applications. The environmental levels of 241Am from worldwide nuclear weapons testing fallout can be considered insignificant with regard to potential interferences with worker or workplace monitoring. The isotope has also found significant application as a sealed source for ionization in commercially manufactured smoke detectors, with the typical smoke detector containing about 1 µCi of 241Am, but there have not been indications that loss of containment has occurred with these sources. Radiological decay data for 241Am and 243Am are shown in Table 9.1. The data were taken directly from, or calculated based on, information contained in ICRP 38 (1983).
9.2 Biokinetic Behavior This section discusses the inhalation transportability class, internal distribution and retention, and the urinary and fecal excretion of americium. This discussion relates to pure 241Am compounds or mixtures in which the 241Am component represents a predominant fraction of the mixture mass (e.g., 50% or more). Where americium is entrapped within a plutonium matrix as an ingrown progeny, it is assumed to behave characteristically with the plutonium matrix, and those properties are described in Chapter 8.0.
Table 9.1. Radiological Decay Data for Americium
Physical Half-Life Decay Constant Specific Activity
Isotope Principal Decay Mode,
Energy, and Yield Years Days Year-1 Day-1 Ci/g
241Am
Alpha 5.486 MeV, 85.2%
Gamma 59.54 keV, 35.7%
432.2 1.58E+05 1.60E-03 4.39E-06 3.43
243Am
Alpha 5.276 MeV, 87.9%
Gamma 74.67 keV, 66.0%
7380 2.69E+06 9.39E-05 2.57E-07 0.181
9.2.1 Transportability Class All compounds of americium are assigned transportability class W by ICRP 48 (1986). The limited number of Hanford cases involving 241Am compounds has supported this assignment.
PNNL-MA-860 Chapter 9.0 Issued: January 31, 2003 Page 9.2

The new respiratory tract model of ICRP 66 (1994a) assigned absorption type M to all forms of americium (ICRP 68 [1994b]; ICRP 78 [1997]).
9.2.2 Gastrointestinal Uptake to Blood (f1 Factor) The fractional uptake to blood from the GI tract is assumed to be 5×10⁻⁴, as recommended in ICRP publications 67 (1993) and 78 (1997). This value was reduced from the 10-3 value used in earlier ICRP publications based on human studies discussed in ICRP 67, which became available in the late 1980s and early 1990s. The 5×10⁻⁴ value applies to both inhalation and ingestion intakes.
9.2.3 Distribution and Retention in Systemic Organs and Tissues The choice of models for use by the HIDP is constrained somewhat by the tools routinely used by the program. For internal dose calculations, the main computer code used by the HIDP is the CINDY computer code (Strenge et al. 1992). It uses the ICRP 30 and ICRP 48 format for its models (simple first-order kinetics) for defining metabolically significant organs and tissues. CINDY allows for adjustment of the organ partition fractions and clearance half-times for those organs and tissues, but does not accommodate the addition of new organs and tissues or alternate model forms, such as the recycling models used in more recent ICRP publications (e.g., ICRP 67, [1993]). Thus, the HIDP has examined the ICRP recommendations as well as other published models and adopted a modified ICRP 48 (1986) model to approximate the dose to the liver, which would be calculated using the ICRP 67 recycling model. The basic ICRP 48 model for distribution and retention of americium in the body is described as follows. For dissolved (ionic form) americium reaching the transfer compartment (i.e., the blood stream), this ICRP model distributes 50% to the bone with a clearance half-time of 50 years, and 30% to the liver with a clearance half-time of 20 years. The activity deposited in bone is assumed to be deposited uniformly over bone surfaces of both cortical and trabecular bone, where it remains until decayed or excreted. A small fraction is permanently retained in the gonads (0.035% for testes and 0.011% for ovaries). The remaining 20% are assumed to go directly to excretion or short-term holdup in other body tissues.
Issued: January 31, 2003 PNNL-MA-860 Chapter 9.0 Page 9.3

The Hanford adaptation of this model to americium is identical to the ICRP 48 description with the exception that the liver clearance half-time is reduced to 9 years. The logic for this modification is described in the following paragraphs. The ICRP 48 model for americium metabolic distribution and retention was identical to that for plutonium, but the report noted that limited human data suggested an americium deposition in liver smaller than plutonium and with a shorter liver half-time. It concluded that for purposes of radiation protection, it was reasonable to use the same model. That position was retained in ICRP 30 Part 4 (1988a) but the partitioning between skeleton and liver was changed to 45% in each, consistent with ICRP 30 Part 1 (1979) and ICRP 19 (1972). A departure from the simple first-order kinetics form of modeling (sum of single exponentials) to a recycling form of model occurred with ICRP 56 (1989). Two significant changes with regard to americium also occurred with that model shift. First, the skeleton-to-liver partition was changed to 30:50 (reversed from the ICRP 48 partition). Secondly, it was noted that an apparent (i.e., externally viewed) liver half-time of 2 to 8 years was appropriate. In ICRP 67 (1993) the recycling model was refined, with some additional significant differences between the plutonium and americium retention. Notably, the liver model demonstrated substantially faster clearance of 2 to 3 years as an “externally viewed half-time” for the first few years, then stabilizing to a relatively constant liver burden at decades post uptake due to the skeleton feedback to blood. The rapid clearance from the liver in the early years, combined with subsequent absorption by the skeleton of the early liver clearance to the blood resulted in an effective skeleton buildup in the first 5 years to a level approximating 50% of the initial uptake. Based on this shift, the HIDP concluded that the original partition of 50% skeleton and 30% liver was a reasonable model approximation. The United States Transuranium and Uranium Registries (USTUR) is a DOE-funded research entity chartered to collect human data for the verification, refinement, or development of radiation protection standards. Data obtained and analyzed by the Registries suggested much smaller retention in liver than ICRP 30 Part 4, and an additional muscle component. Kathren (1994) published a USTUR model for americium that split the initial uptake fraction as follows: 45% to the skeleton (half-time of 50 years), 25% to the liver (half-time of 2.5 years), 20% to the muscle (half-time of 10 years), and 10% to the rest of the body and direct excretion (half-time of 10 years). Both the ICRP 67 and the USTUR models for the bone surfaces showed long retention, comparable to that of ICRP 30 Part 4 and ICRP 48. The use of the ICRP 48 uptake fraction of 50% to the bone with a 50-year clearance half-time was consistent with the ICRP 67 and USTUR models
PNNL-MA-860 Chapter 9.0 Issued: January 31, 2003 Page 9.4

and was retained for Hanford applications. This was also consistent with Hanford practices since 1988. The ambiguity in the data discussions and interpretations by ICRP 48, ICRP 30 Part 4, ICRP 56, and ICRP 67 suggests that either a 45% or 50% fraction can adequately represent the bone uptake. Because the recent modeling efforts of both the ICRP and the USTUR suggested substantially less retention in the liver than predicted by ICRP 48 and ICRP 30 Part 4, the HIDP sought to incorporate these conclusions into this technical basis. As a benchmark, the HIDP obtained the results of the integrated retention of the ICRP 67 liver model using Matlab/Simulink™(a) and then iteratively solved several single exponential component models to approximate the integrated retention. Thus, by using the single exponential liver model in the CINDY computer code, committed liver dose equivalents calculated by CINDY would be similar to those calculated using the ICRP 67 recycling model. The result of this analysis was the choice of a liver uptake fraction of 30% having a clearance half-time of 9 years. Figure 9.1 illustrates the differences in these models with regard to liver retention. The curve showing a two-component Matlab™ fit to ICRP 67 represents a close approximation to the americium liver retention illustrated in ICRP 67 that was developed using the actual recycling model. By comparison, the ICRP 30 Part 4 and ICRP 48 curves show significantly greater retention, and the USTUR model shows significantly less retention. The ICRP 67 integral equivalent curve demonstrates retention both greater and less than ICRP 67 depending on the time post uptake; however, the ICRP 67 integral equivalent curve represents the same number of transformations over 50 years (i.e., the retention function integrated over 50 years) as the ICRP 67 recycling model, approximated in the figure by the Matlab™ fit curve. In summary, the distribution and retention model used by the HIDP for intakes of americium is a modified ICRP 48 model. It assumes that for americium reaching the bloodstream, 50% is taken up by the bone surfaces from which it clears with a 50-year half-time, and 30% is taken up by the liver from which it clears with a 9-year half-time. A small fraction is permanently retained in the gonads (0.035% for testes and 0.011% for ovaries). The remaining 20% is assumed to
(a) Matlab and Simulink are registered trademarks of The MathWorks, Inc., Natick, Massachusetts. Issued: January 31, 2003 PNNL-MA-860 Chapter 9.0 Page 9.5

0.0000
0.1000
0.2000
0.3000
0.4000
0.5000
0.6000
0 10 20 30 40 50 60
Years after Injection
Frac
tion
Rem
aini
ng
USTUR
ICRP 30 Part 4
ICRP67 Integral Equivalent 2 Component Matlab Fitto ICRP 67ICRP 48
Figure 9.1. Liver Retention for Americium - Model Comparison go directly to excretion or short-term holdup in other body tissues. For the purposes of dosimetry, this fraction is considered to be an insignificant contributor to effective dose equivalent (relative to bone marrow, liver, and gonadal contributions).
9.2.4 Urinary Excretion
In ICRP publication 54 (1988b), it was noted that there were few reports of americium excretion in humans. For that report, americium excretion used the same excretion function as for plutonium. Based on that recommendation, the HIDP uses the Jones excretion function for plutonium, as implemented using the CINDY computer code. The Jones function models urinary excretion of plutonium following systemic uptake as a four-component exponential function. Jones emphasized that his function was an empirical fit to human data and should not be interpreted as modeling retention in specifically identifiable compartments. Thus, its application at Hanford is limited to estimating uptake and predicting excretion based on uptake. Further discussion on the Jones function can be found in Section 8.2.4 of the Plutonium Chapter of this manual.
PNNL-MA-860 Chapter 9.0 Issued: January 31, 2003 Page 9.6

The Jones function is a four-component exponential sum, mathematically defined as follows:
(9.1) ( )
t0000284.05t00380.05
t0442.04t558.03u
e1042.1e1055.8
e1039.2e1075.4te−−−−
−−−−
×+×
+×+×=
where eu(t) is the fraction of uptake to blood excreted in urine, and t is the days post uptake (note: t = 0 is time of uptake; t = 1 represents the first 24 hours following uptake; t = 2 represents the second day post uptake; etc.). As a possible alternative to the Jones function, a historical model used at Hanford is described here. The 1976 americium column explosion at the Hanford 242-Z facility resulted in several workers incurring acute inhalation exposures to americium nitrate. An excretion model developed by Rosen, Cohen, and Wrenn (1972) from baboon data was applied by Hanford internal dosimetrists to the workers exposed in this case, although only the most highly exposed worker was reported in the open literature (Robinson et al. 1983). The Rosen model is described by the following power function:
t036.0qEu 3.10
−×= (9.2) where Eu = 241Am excretion via urine on day t, q0 is the initial systemic burden, and t is the day post intake. The HIDP will use the Jones function for americium intakes and bioassay projection unless data suggest the Rosen model or another model provides a better fit for specific cases.
9.2.5 Fecal Excretion The excretion of bile to the GI tract provides a pathway for systemic excretion of americium to feces from the liver. Few data are available to quantify this pathway relative to urine, however the assumption of an equal amount excreted from the systemic compartment by way of feces and urine is not uncommon and is assumed at Hanford. For inhalation intakes, the fecal excretion is dominated by clearance from the respiratory tract for the first year.
9.3 Internal Dosimetry Factors This section contains factors that are useful in making internal dosimetry calculations. The factors included in this section are derived from CINDY and incorporate the models and assumptions described in the preceding section. Their application is intended for those circumstances where such assumptions are appropriate or more specific information is
Issued: January 31, 2003 PNNL-MA-860 Chapter 9.0 Page 9.7

lacking. Variation from these factors is appropriate if sufficient data are available. The factors shown are for 241Am, however there is no significant dosimetric difference between 241Am and 243Am.
9.3.1 Intake Retention and Excretion Fractions The intake retention (or excretion) fraction expresses the fraction of intake retained in a particular compartment or excreted by a particular pathway (urine or feces) at a given time post intake. Although excretion implies elimination rather than retention, conventional models include excretion compartments under the general term retention and use the term “intake retention fraction” (IRF) to describe both. IRFs for various times post intake are tabulated as described below for 241Am. Lung retention fractions for the class W inhalations of 1-µm and 5-µm-AMAD particles of 241Am are listed in Table 9.2 and plotted in Figure 9.2. Urine excretion fractions for an instantaneous uptake, acute inhalations, and acute ingestions of 241Am are listed in Table 9.3 and plotted in Figure 9.3. Corresponding values for fecal excretion are listed in Table 9.4 and plotted in Figure 9.4. Values for days other than those tabulated here can be obtained by interpolation between the tabulated data, or by obtaining the values directly from CINDY.
9.3.2 Dose Coefficients Dose coefficients, expressed as committed dose equivalent per unit activity of intake (rem per nanocurie of acute intake) are a convenient shortcut to estimating doses based on standard assumptions when the magnitude of an intake is known or assumed. Acute intake dose coefficients have been tabulated for instantaneous uptake, class W inhalation (for both 1-µm and 5-µm-AMAD particle sizes), and for ingestion. The dose coefficients shown in Table 9.5 were derived by the CINDY computer code using the previously described models.
9.3.3 Comparison of Published Dosimetry Factors A comparison of dosimetry factors, including dose coefficients, ALIs, and DACs published in several sources is shown in Table 9.6. For Hanford applications, the DAC values of 10 CFR 835 Appendix A, are required for use to control facility operations.
PNNL-MA-860 Chapter 9.0 Issued: January 31, 2003 Page 9.8

Table 9.2. Lung Retention Fractions for Class W Inhalation of 241Am
Days Post Intake 1-µm AMAD 5-µm AMAD
0 3.3E-01 1.7E-01 1 2.1E-01 7.5E-02 2 1.8E-01 6.3E-02 5 1.5E-01 5.1E-02 7 1.4E-01 4.9E-02
14 1.3E-01 4.4E-02 30 1.0E-01 3.6E-02 60 7.0E-02 2.5E-02 90 4.8E-02 1.7E-02
180 1.5E-02 5.3E-03 365 1.4E-03 4.8E-04 730 1.1E-05 3.9E-06
0.001
0.010
0.100
1.000
0 50 100 150 200 250 300 350 400
Days Post Intake
Frac
tion
of In
take
Ret
aine
d
1-um Class W5-um Class W
Figure 9.2. 241Am Lung Retention
Issued: January 31, 2003 PNNL-MA-860 Chapter 9.0 Page 9.9

Table 9.3. Urine Excretion Fractions for 241Am Intakes
Inhalation Days Post Intake
Instant Uptake Ingestion 1-µm Class W 5-µm Class W
1 3.1E-03 1.7E-06 2.2E-04 3.5E-04 2 1.9E-03 1.0E-06 1.4E-04 2.2E-04 5 5.8E-04 3.1E-07 4.6E-05 6.9E-05 7 3.7E-04 1.9E-07 3.1E-05 4.4E-05
14 2.3E-04 1.1E-07 2.2E-05 2.8E-05 30 1.5E-04 7.7E-08 1.7E-05 2.0E-05 60 9.9E-05 5.0E-08 1.3E-05 1.4E-05 90 7.9E-05 4.0E-08 1.1E-05 1.1E-05
180 5.7E-05 2.9E-08 8.3E-06 8.1E-06 365 3.5E-05 1.8E-08 4.8E-06 4.9E-06 730 1.9E-05 9.6E-09 2.4E-06 2.6E-06
1,825 1.3E-05 6.7E-09 1.6E-06 1.8E-06 3,650 1.3E-05 6.3E-09 1.5E-06 1.7E-06 7,300 1.1E-05 5.6E-09 1.3E-06 1.5E-06
18,250 7.8E-06 3.9E-09 9.4E-07 1.0E-06
1.E-08
1.E-07
1.E-06
1.E-05
1.E-04
1.E-03
1.E-02
1 10 100 1000 10000 100000
Days Post Intake
Frac
tion
of In
take
Exc
rete
d
Instant UptakeIngestion1-um Class W5-um Class W
Figure 9.3. 241Am Urine Excretion Fractions
PNNL-MA-860 Chapter 9.0 Issued: January 31, 2003 Page 9.10

Table 9.4. Fecal Excretion Fractions for 241Am Intakes
Inhalation Days Post Intake
Instant Uptake Ingestion 1-µm Class W 5-µm Class W
1 3.1E-03 4.7E-01 1.1E-01 2.2E-01 2 1.9E-03 2.8E-01 1.3E-01 2.6E-01 5 5.8E-04 1.8E-02 2.3E-02 3.1E-02 7 3.7E-04 2.5E-03 6.3E-03 5.6E-03
14 2.3E-04 2.4E-06 1.2E-03 4.6E-04 30 1.5E-04 7.7E-08 9.6E-04 3.5E-04 60 9.9E-05 5.0E-08 6.3E-04 2.3E-04 90 7.9E-05 4.0E-08 4.2E-04 1.6E-04
180 5.7E-05 2.9E-08 1.3E-04 4.9E-05 365 3.5E-05 1.8E-08 1.4E-05 8.1E-06 730 1.9E-05 9.6E-09 2.5E-06 2.6E-06
1,825 1.3E-05 6.7E-09 1.6E-06 1.8E-06 3,650 1.3E-05 6.3E-09 1.5E-06 1.7E-06 7,300 1.1E-05 5.6E-09 1.3E-06 1.5E-06
18,250 7.8E-06 3.9E-09 9.4E-07 1.0E-06
1.E-08
1.E-07
1.E-06
1.E-05
1.E-04
1.E-03
1.E-02
1.E-01
1.E+00
1 10 100 1000 10000 100000
Days Post Intake
Frac
tion
of In
take
Exc
rete
d
Instant UptakeIngestion1-um Class W5-um Class W
Figure 9.4. 241Am Fecal Excretion Fractions
Issued: January 31, 2003 PNNL-MA-860 Chapter 9.0 Page 9.11

Table 9.5. Committed Dose Coefficients for Acute Intakes of 241Am (rem/nCi)
Class W Inhalation Organ or Tissue
Instantaneous Uptake
Ingestion f1 = 5E-04 1-µm 5-µm
Effective 3.5E+00 1.8E-03 4.3E-01 4.6E-01 Bone Surface 7.5E+01 3.7E-02 9.0E+00 9.9E+00 Red Marrow 5.9E+00 2.9E-03 7.0E-01 7.7E-01 Liver 4.3E+00 2.2E-03 5.2E-01 5.7E-01 Lung 8.5E-05 4.4E-08 6.7E-02 2.4E-02 Gonads 1.0E+00 5.0E-04 1.2E-01 1.3E-01
Table 9.6. Comparison of Dosimetric Factors for 241Am
Reference Source
Class W Inhalation 1-µm
AMAD
Class W Inhalation 5-µm
AMAD Soluble Ingestion Dose Coefficients
CINDY (hE,50) 0.43 rem/nCi 1.2E-04 Sv/Bq
0.46 rem/nCi 1.2E-04 Sv/Bq
0.0018 rem/nCi 4.9E-07 Sv/Bq
ICRP 54 (hE,50) 1.2E-04 Sv/Bq (0.44 rem/nCi) NA NA
EPA Federal Guidance Report No. 11 (hE,50)
1.20E-04 Sv/Bq (0.44 rem/nCi) NA 9.84E-07 Sv/Bq
(3.64E-03 rem/nCi)
ICRP 68 [e(50)] 3.9E-05 Sv/Bq (0.14 rem/nCi)
2.7E-05 Sv/Bq (0.10 rem/nCi)
2.0E-07 Sv/Bq (7.4E-04 rem/nCi)
Bone Surface DAC
10 CFR 835, App. A 2E-12 µCi/ml and 8E-02 Bq/m3 NA NA
EPA Federal Guidance Report No. 11
3E-12 µCi/ml and 1E-07 Bq/m3 NA NA
ICRP 30, ICRP 54 1E-01 Bq/m3 NA NA Annual Limit on Intake, ALI (Bone Surface) Calculated from 10 CFR 835 DAC
4.8E-03 µCi/ml and 190 Bq
NA NA
ICRP 30, ICRP 54 2E+02 Bq NA 3E+04 Bq EPA Federal Guidance Report No. 11
2.0E-04 MBq and 0.006 µCi
NA 0.03 MBq and 0.8 µCi
NA = not applicable
PNNL-MA-860 Chapter 9.0 Issued: January 31, 2003 Page 9.12

9.3.4 Derived Reference Levels Derived screening, investigation, and compliance levels (based on committed effective dose equivalents of 10-mrem, 100-mrem, and a committed bone surface dose equivalent of 50,000 mrem, respectively) have been calculated for 1-µm and 5-µm class W inhalations of pure 241Am. The urine excretion levels are shown in Table 9.7 and chest count levels are shown in Table 9.8. These levels are sufficiently low that, from a practical standpoint, any detected result is likely to result in investigation and dose assessment. This is particularly the case because 241Am at Hanford is usually used as an indicator of potential plutonium intake.
9.4 Bioassay for Americium This section discusses the general techniques and applicability of bioassay monitoring and describes the capabilities of excreta sample bioassay and in vivo measurements. General recommendations are also provided for routine bioassay monitoring for americium. Techniques are similar for both 241Am and 243Am.
9.4.1 Excreta Bioassay Techniques for Americium The typical urine sampling practice is to collect a urine sample over a specified time interval and perform a chemical separation for americium using an added tracer to determine the chemical yield of the process. This technique is followed by electroplating and quantitative alpha spectrometry. Where the analyte is 241Am, the tracer added to the chemical process is 243Am. If the analyte is 243Am, a 241Am tracer is added. Because of the tracers used, if a worker is to be monitored for both 241Am and 243Am, two samples will have to be collected and analyzed (or alternatively, a single sample must be split prior to adding the tracer and two different analyses performed.) Fecal sample analysis follows a process similar to urine sample analysis. Less sensitive, rapid analytical procedures are available for special circumstances. These procedures can be executed and results obtained in substantially shorter times than the routine procedure, but they are less sensitive. Their use is primarily for diagnostic bioassay of suspected internal contamination related to unplanned exposures (incidents). The decision to use such procedures involves considering the probability and potential magnitude of the exposure. Of particular interest as an alternative to the electroplating and alpha spectrometry procedure is direct counting of the low-energy 241Am
Issued: January 31, 2003 PNNL-MA-860 Chapter 9.0 Page 9.13

Table 9.7. 241Am Reference Levels and Urine Excretion Derived Reference Levels for
Class W Inhalation
10-mrem HE,50Screening Level
100-mrem HE,50Investigation Level
50-rem HT,50Compliance Level
1-µm 5-µm 1-µm 5-µm 1-µm 5-µm Intake (nCi) 2.3E-02 2.2E-02 2.3E-01 2.2E-01 5.6E+00 5.1E+00
Derived Screening Level
(dpm/d) Derived Investigation Level
(dpm/d) Derived Compliance Level
(dpm/d) Days Post Intake 1-µm 5-µm 1-µm 5-µm 1-µm 5-µm
1 1.1E-02 1.7E-02 1.1E-01 1.7E-01 2.7E+00 3.9E+00 2 7.2E-03 1.1E-02 7.2E-02 1.1E-01 1.7E+00 2.5E+00 5 2.4E-03 3.3E-03 2.4E-02 3.3E-02 5.7E-01 7.7E-01 7 1.6E-03 2.1E-03 1.6E-02 2.1E-02 3.8E-01 4.9E-01
14 1.1E-03 1.4E-03 1.1E-02 1.4E-02 2.7E-01 3.1E-01 30 8.8E-04 9.7E-04 8.8E-03 9.7E-03 2.1E-01 2.2E-01 60 6.7E-04 6.8E-04 6.7E-03 6.8E-03 1.6E-01 1.6E-01 90 5.7E-04 5.3E-04 5.7E-03 5.3E-03 1.4E-01 1.2E-01
180 4.3E-04 3.9E-04 4.3E-03 3.9E-03 1.0E-01 9.1E-02 365 2.5E-04 2.4E-04 2.5E-03 2.4E-03 5.9E-02 5.5E-02 730 1.2E-04 1.3E-04 1.2E-03 1.3E-03 3.0E-02 2.9E-02
1825 8.3E-05 8.7E-05 8.3E-04 8.7E-04 2.0E-02 2.0E-02 3650 7.7E-05 8.2E-05 7.7E-04 8.2E-04 1.9E-02 1.9E-02 7300 6.7E-05 7.2E-05 6.7E-04 7.2E-04 1.6E-02 1.7E-02
18250 4.9E-05 4.8E-05 4.9E-04 4.8E-04 1.2E-02 1.1E-02
Table 9.8. 241Am Reference Levels and Chest Count Derived Reference Levels for Class W Inhalation
10-mrem HE,50
Screening Level 100-mrem HE,50
Investigation Level 50-rem HT,50
Compliance Level 1-µm 5-µm 1-µm 5-µm 1-µm 5-µm
Intake (nCi) 2.3E-02 2.2E-02 2.3E-01 2.2E-01 5.6E+00 5.1E+00
Derived Screening Level
(nCi) Derived Investigation Level
(nCi) Derived Compliance Level
(nCi) Days Post Intake 1-µm 5-µm 1-µm 5-µm 1-µm 5-µm
0 7.7E-03 3.7E-03 7.7E-02 3.7E-02 1.8E+00 8.6E-01 1 4.9E-03 1.6E-03 4.9E-02 1.6E-02 1.2E+00 3.8E-01 2 4.2E-03 1.4E-03 4.2E-02 1.4E-02 1.0E+00 3.2E-01 5 3.5E-03 1.1E-03 3.5E-02 1.1E-02 8.3E-01 2.6E-01 7 3.3E-03 1.1E-03 3.3E-02 1.1E-02 7.8E-01 2.5E-01
14 3.0E-03 9.6E-04 3.0E-02 9.6E-03 7.2E-01 2.2E-01 30 2.3E-03 7.8E-04 2.3E-02 7.8E-03 5.6E-01 1.8E-01 60 1.6E-03 5.4E-04 1.6E-02 5.4E-03 3.9E-01 1.3E-01 90 1.1E-03 3.7E-04 1.1E-02 3.7E-03 2.7E-01 8.6E-02
180 3.5E-04 1.2E-04 3.5E-03 1.2E-03 8.3E-02 2.7E-02 365 3.3E-05 1.0E-05 3.3E-04 1.0E-04 7.8E-03 2.4E-03 730 2.6E-07 8.5E-08 2.6E-06 8.5E-07 6.1E-05 2.0E-05
PNNL-MA-860 Chapter 9.0 Issued: January 31, 2003 Page 9.14

photon using a germanium detector. This protocol is substantially less sensitive than the alpha spectrometry, but is not subject to the difficulties associated with americium chemical separation. This analysis is an appropriate quick-turnaround emergency analysis procedure that could be used as an indicator for a plutonium intake based on fecal sampling and reasonable knowledge of the americium-to-plutonium ratio. The contractual detection limits for americium in urine or feces can be found in the radiochemistry bioassay laboratory statement of work (available from the HIDP) and in the Hanford Internal Dosimetry Project Manual (PNL-MA-552).(a)
The minimum detectable intakes based on a 0.02 dpm/d urinalysis sensitivity are shown in Table 9.9. The committed effective and bone surface dose equivalents associated with those intakes are shown in Tables 9.10 and 9.11, respectively. Figures 9.5 and 9.6 show graphical presentations of the minimum detectable doses. Corresponding data based on a 0.8 dpm/d fecal analysis sensitivity, are shown in Tables 9.12 through 9.14 and Figures 9.7 and 9.8. Table 9.9. Minimum Detectable Intakes (nCi) for 241Am Based on
Detection of 0.02 dpm/d 241Am in Urine
Class W Inhalation Days Post Intake
Instant Uptake Ingestion 1-µm 5-µm
1 2.9E-03 5.3E+00 4.1E-02 2.6E-02 2 4.7E-03 9.0E+00 6.4E-02 4.1E-02 5 1.6E-02 2.9E+01 2.0E-01 1.3E-01 7 2.4E-02 4.7E+01 2.9E-01 2.0E-01
14 3.9E-02 8.2E+01 4.1E-01 3.2E-01 30 6.0E-02 1.2E+02 5.3E-01 4.5E-01 60 9.1E-02 1.8E+02 6.9E-01 6.4E-01 90 1.1E-01 2.3E+02 8.2E-01 8.2E-01
180 1.6E-01 3.1E+02 1.1E+00 1.1E+00 365 2.6E-01 5.0E+02 1.9E+00 1.8E+00 730 4.7E-01 9.4E+02 3.8E+00 3.5E+00
1825 6.9E-01 1.3E+03 5.6E+00 5.0E+00 3650 6.9E-01 1.4E+03 6.0E+00 5.3E+00 7300 8.2E-01 1.6E+03 6.9E+00 6.0E+00
18250 1.2E+00 2.3E+03 9.6E+00 9.0E+00
(a) Pacific Northwest National Laboratory (PNNL). Hanford Internal Dosimetry Project Manual. PNNL-
MA-552, Richland, Washington. (Internal manual.) Available URL: http://www.pnl.gov/eshs/pub/pnnl552.html
Issued: January 31, 2003 PNNL-MA-860 Chapter 9.0 Page 9.15

Table 9.10. Minimum Detectable Committed Effective Dose Equivalent (rem) for 241Am Based on Detection of 0.02 dpm/d 241Am in Urine
Class W Inhalation Days Post
Intake Instant Uptake Ingestion 1-µm 5-µm
1 1.0E-02 9.5E-03 1.8E-02 1.2E-02 2 1.7E-02 1.6E-02 2.8E-02 1.9E-02 5 5.4E-02 5.2E-02 8.4E-02 6.0E-02 7 8.5E-02 8.5E-02 1.2E-01 9.4E-02
14 1.4E-01 1.5E-01 1.8E-01 1.5E-01 30 2.1E-01 2.1E-01 2.3E-01 2.1E-01 60 3.2E-01 3.2E-01 3.0E-01 3.0E-01 90 4.0E-01 4.1E-01 3.5E-01 3.8E-01
180 5.5E-01 5.6E-01 4.7E-01 5.1E-01 365 9.0E-01 9.0E-01 8.1E-01 8.5E-01 730 1.7E+00 1.7E+00 1.6E+00 1.6E+00
1825 2.4E+00 2.4E+00 2.4E+00 2.3E+00 3650 2.4E+00 2.6E+00 2.6E+00 2.4E+00 7300 2.9E+00 2.9E+00 3.0E+00 2.8E+00
18250 4.0E+00 4.2E+00 4.1E+00 4.1E+00
1.0E-03
1.0E-02
1.0E-01
1.0E+00
1.0E+01
1 10 100 1000 10000 100000
Days Post Intake
Com
mitt
ed E
ffect
ive
Dos
e Eq
uiva
lent
(rem
)
Instant UptakeIngestion1-um Class W 5-um Class W5-rem Dose Limit
Figure 9.5. Minimum Detectable Committed Effective Dose Equivalent (rem) for 241Am Based on Detection of 0.02 dpm/d 241Am in Urine
PNNL-MA-860 Chapter 9.0 Issued: January 31, 2003 Page 9.16

Table 9.11. Minimum Detectable Bone Surfaces Dose Equivalent (rem) for 241Am Based on Detection of 0.02 dpm/d 241Am in Urine
Class W Inhalation Days Post Intake
Instant Uptake Ingestion 1-µm 5-µm
1 2.2E-01 2.0E-01 3.7E-01 2.5E-01 2 3.6E-01 3.3E-01 5.8E-01 4.1E-01 5 1.2E+00 1.1E+00 1.8E+00 1.3E+00 7 1.8E+00 1.8E+00 2.6E+00 2.0E+00
14 2.9E+00 3.0E+00 3.7E+00 3.2E+00 30 4.5E+00 4.3E+00 4.8E+00 4.5E+00 60 6.8E+00 6.7E+00 6.2E+00 6.4E+00 90 8.6E+00 8.3E+00 7.4E+00 8.1E+00
180 1.2E+01 1.1E+01 9.8E+00 1.1E+01 365 1.9E+01 1.9E+01 1.7E+01 1.8E+01 730 3.6E+01 3.5E+01 3.4E+01 3.4E+01
1825 5.2E+01 5.0E+01 5.1E+01 5.0E+01 3650 5.2E+01 5.3E+01 5.4E+01 5.2E+01 7300 6.1E+01 6.0E+01 6.2E+01 5.9E+01
18250 8.7E+01 8.5E+01 8.6E+01 8.9E+01
1.0E-01
1.0E+00
1.0E+01
1.0E+02
1 10 100 1000 10000 100000
Days Post Intake
Com
mitt
ed B
one
Surf
ace
Dos
e Eq
uiva
lent
(rem
)
Instant UptakeIngestion1-um Class W5-um Class W50-rem Dose Limit
Figure 9.6. Minimum Detectable Bone Surfaces Dose Equivalent (rem) for 241Am Based on Detection of 0.02 dpm/d 241Am in Urine
Issued: January 31, 2003 PNNL-MA-860 Chapter 9.0 Page 9.17

Table 9.12. Minimum Detectable Intakes (nCi) for 241Am Based on Detection of 0.8 dpm/d 241Am in Feces
Class W Inhalation Days Post
Intake Instant Uptake Ingestion 1-µm 5-µm
1 1.2E-01 7.7E-04 3.3E-03 1.6E-03 2 1.9E-01 1.3E-03 2.8E-03 1.4E-03 5 6.2E-01 2.0E-02 1.6E-02 1.2E-02 7 9.7E-01 1.4E-01 5.7E-02 6.4E-02
14 1.6E+00 1.5E+02 3.0E-01 7.8E-01 30 2.4E+00 4.7E+03 3.8E-01 1.0E+00 60 3.6E+00 7.2E+03 5.7E-01 1.6E+00 90 4.6E+00 9.0E+03 8.6E-01 2.3E+00
180 6.3E+00 1.2E+04 2.8E+00 7.4E+00 365 1.0E+01 2.0E+04 2.6E+01 4.4E+01 730 1.9E+01 3.8E+04 1.4E+02 1.4E+02
1825 2.8E+01 5.4E+04 2.3E+02 2.0E+02 3650 2.8E+01 5.7E+04 2.4E+02 2.1E+02 7300 3.3E+01 6.4E+04 2.8E+02 2.4E+02
18250 4.6E+01 9.2E+04 3.8E+02 3.6E+02 9.4.2 In Vivo Bioassay Techniques for Americium
In vivo measurement of americium is available for both 241Am and 243Am, though it is not routinely performed for 243Am. Hanford in vivo measurements for americium include chest counts, skeleton measurements by head counting, liver counts, and wound counts. Brief descriptions of the measurements are contained in Section 8.4.3 of the Plutonium Chapter of this manual. Minimum detectable activities for these measurements are described in the Hanford In Vivo Monitoring Program Manual (PNL-MA-574)(a) and the Hanford Internal Dosimetry Program Manual (PNL-MA-552).(b)
The minimum detectable intakes of 241Am and associated committed doses as determined by detection of 0.16 nCi 241Am by chest counting are described in Table 9.15 and illustrated in Figure 9.9.
(a) Pacific Northwest National Laboratory (PNNL). Hanford In Vivo Monitoring Program Manual. PNNL-
MA-574, Richland, Washington. (Internal manual.) (b) Pacific Northwest National Laboratory (PNNL). Hanford Internal Dosimetry Project Manual. PNNL-
MA-552, Richland, Washington. (Internal manual.) Available URL: http://www.pnl.gov/eshs/pub/pnnl552.html
PNNL-MA-860 Chapter 9.0 Issued: January 31, 2003 Page 9.18

Table 9.13. Minimum Detectable Committed Effective Dose Equivalent (rem) for 241Am Based on Detection of 0.8 dpm/d 241 Am in Feces
Class W Inhalation Days Post
Intake Instant Uptake Ingestion 1-µm 5-µm
1 4.1E-01 1.4E-06 1.4E-03 7.5E-04 2 6.6E-01 2.3E-06 1.2E-03 6.4E-04 5 2.2E+00 3.6E-05 6.7E-03 5.3E-03 7 3.4E+00 2.6E-04 2.5E-02 3.0E-02
14 5.5E+00 2.7E-01 1.3E-01 3.6E-01 30 8.4E+00 8.4E+00 1.6E-01 4.7E-01 60 1.3E+01 1.3E+01 2.5E-01 7.2E-01 90 1.6E+01 1.6E+01 3.7E-01 1.0E+00
180 2.2E+01 2.2E+01 1.2E+00 3.4E+00 365 3.6E+01 3.6E+01 1.1E+01 2.0E+01 730 6.6E+01 6.8E+01 6.2E+01 6.4E+01
1825 9.7E+01 9.7E+01 9.7E+01 9.2E+01 3650 9.7E+01 1.0E+02 1.0E+02 9.8E+01 7300 1.1E+02 1.2E+02 1.2E+02 1.1E+02
18250 1.6E+02 1.7E+02 1.6E+02 1.7E+02
1.0E-06
1.0E-05
1.0E-04
1.0E-03
1.0E-02
1.0E-01
1.0E+00
1.0E+01
1.0E+02
1.0E+03
1 10 100 1000 10000 100000
Days Post Intake
Com
mitt
ed E
ffect
ive
Dos
e Eq
uiva
lent
(rem
)
Instant UptakeIngestion1-um Class W 5-um Class W5-rem Dose Limit
Figure 9.7. Minimum Detectable Committed Effective Doses for 241Am Based on Detection of 0.8 dpm/d 241Am in Feces
Issued: January 31, 2003 PNNL-MA-860 Chapter 9.0 Page 9.19

Table 9.14. Minimum Detectable Committed Bone Surface Dose Equivalents (rem) for 241Am Based on Detection of 0.8 dpm/d 241Am in Feces
Class W Inhalation Days Post
Intake Instant Uptake Ingestion 1-µm 5-µm
1 8.7E+00 2.8E-05 2.9E-02 1.6E-02 2 1.4E+01 4.8E-05 2.5E-02 1.4E-02 5 4.7E+01 7.4E-04 1.4E-01 1.2E-01 7 7.3E+01 5.3E-03 5.1E-01 6.4E-01
14 1.2E+02 5.6E+00 2.7E+00 7.8E+00 30 1.8E+02 1.7E+02 3.4E+00 1.0E+01 60 2.7E+02 2.7E+02 5.1E+00 1.6E+01 90 3.4E+02 3.3E+02 7.7E+00 2.2E+01
180 4.7E+02 4.6E+02 2.5E+01 7.3E+01 365 7.7E+02 7.4E+02 2.3E+02 4.4E+02 730 1.4E+03 1.4E+03 1.3E+03 1.4E+03
1825 2.1E+03 2.0E+03 2.0E+03 2.0E+03 3650 2.1E+03 2.1E+03 2.2E+03 2.1E+03 7300 2.5E+03 2.4E+03 2.5E+03 2.4E+03
18250 3.5E+03 3.4E+03 3.5E+03 3.6E+03
1.0E-05
1.0E-04
1.0E-03
1.0E-02
1.0E-01
1.0E+00
1.0E+01
1.0E+02
1.0E+03
1.0E+04
1 10 100 1000 10000 100000
Days Post Intake
Com
mitt
ed B
one
Surf
ace
Dos
e Eq
uiva
lent
(rem
)
Instant UptakeIngestion1-um Class W 5-um Class W50-rem Dose Limit
Figure 9.8. Minimum Detectable Committed Bone Surface Doses for 241Am Based on Detection of 0.8 dpm/d 241Am in Feces
PNNL-MA-860 Chapter 9.0 Issued: January 31, 2003 Page 9.20

Table 9.15. Minimum Detectable Intakes and Committed Doses for Class W Inhalation of 241Am Based on Detection of 0.16 nCi 241Am by Chest Counting
Minimum Detectable Values for 1-µm AMAD Particles
Minimum Detectable Values for 5-µm AMAD Particles
Days Post Intake
Intake (nCi)
Effective Dose (rem)
Bone Surface Dose (rem)
Intake (nCi)
Effective Dose (rem)
Bone Surface Dose (rem)
0 4.8E-01 2.1E-01 4.4E+00 9.4E-01 4.3E-01 9.3E+00 1 7.6E-01 3.3E-01 6.9E+00 2.1E+00 9.8E-01 2.1E+01 2 8.9E-01 3.8E-01 8.0E+00 2.5E+00 1.2E+00 2.5E+01 5 1.1E+00 4.6E-01 9.6E+00 3.1E+00 1.4E+00 3.1E+01 7 1.1E+00 4.9E-01 1.0E+01 3.3E+00 1.5E+00 3.2E+01
14 1.2E+00 5.3E-01 1.1E+01 3.6E+00 1.7E+00 3.6E+01 30 1.6E+00 6.9E-01 1.4E+01 4.4E+00 2.0E+00 4.4E+01 60 2.3E+00 9.8E-01 2.1E+01 6.4E+00 2.9E+00 6.3E+01 90 3.3E+00 1.4E+00 3.0E+01 9.4E+00 4.3E+00 9.3E+01
180 1.1E+01 4.6E+00 9.6E+01 3.0E+01 1.4E+01 3.0E+02 365 1.1E+02 4.9E+01 1.0E+03 3.3E+02 1.5E+02 3.3E+03 730 1.5E+04 6.3E+03 1.3E+05 4.1E+04 1.9E+04 4.1E+05
1.0E+04
1.0E+03
Com
mitt
ed D
ose
Equi
vale
nt (r
em)
1.0E+02
1.0E+01
1-um Effective 1.0E+00 1-um Bone Surfaces
5-um Effective 5-um Bone Surfaces50-rem Dose Limit
1.0E-01 0 50 100 350 150 200 250 300 400
Days Post Intake
Figure 9.9. Minimum Detectable Committed Doses for 241Am Based on
Detection of 0.16 nCi 241Am in the Lung
Issued: January 31, 2003 PNNL-MA-860 Chapter 9.0 Page 9.21

9.4.3 Recommended Periodic Bioassay Monitoring Protocol Based on Tables 9.10 and 9.11, an annual urine-sampling program is recommended for monitoring intakes of pure 241Am. Such a program is capable of demonstrating regulatory compliance with both stochastic and deterministic dose limits, but is not capable of demonstrating compliance with administrative control levels of 500-mrem committed effective dose equivalent or lower. More frequent urinalysis can provide some improvement in sensitivity, but primary reliance must be placed on prompt detection of potential intakes by workplace indicators and special bioassay monitoring to provide low-level dosimetry. Annual chest counting is appropriate as an augmentation, particularly when 241Am is used as an indicator for plutonium.
9.4.4 Special Monitoring for Suspected Intakes Special bioassay monitoring for suspected inhalation or ingestion intakes should include a chest count, urine sample, and at least one (preferably two or more) fecal samples. If these measurements are obtained within the first 3 to 5 days, committed effective dose equivalents in the range of a few millirem can be detected. For potential wound intakes, special bioassay should consist of a wound count and a urine sample. Fecal sampling is not necessary for wound dosimetry, however data on the fecal excretion following a wound can provide information that may be valuable for improving americium metabolic models.
9.4.5 Bioassay Monitoring Capability for Workers with Known Americium Depositions The capability of a bioassay program is directly dependent upon the magnitude of an identifiable increase in a bioassay measurement. When a worker has a detectable baseline bioassay level due to a previous intake, the ability to detect a subsequent increase in the bioassay level from an additional intake is more dependent on the variability of current bioassay levels and less dependent on analytical capability. In other words, to be detected, subsequent intakes must result in increases in bioassay measurements that exceed the baseline or background “noise” level. Guidance concerning the potential dose from potentially undetected intakes must be developed on a case-by-case basis. Appropriate adjustments to measurement frequencies can then be determined based on the potential undetected dose. As an approximate rule-of-thumb, a single bioassay measurement will probably have to be at least twice the baseline level to be readily recognized, due to the substantial variability in single bioassay measurements on individual people. For many situations, this may imply that a normally detectable intake may not be detectable on top
PNNL-MA-860 Chapter 9.0 Issued: January 31, 2003 Page 9.22

of a pre-existing internal plutonium deposition. Like most rules-of-thumb, this is only a rough suggestion; cases of significance must be addressed individually.
9.5 Assessment of Internal Dose Assessments of internal dose for americium rely on evaluations of intake or deposition. Current practice for such evaluations is to perform an intake assessment. Prior to 1988, the common Hanford approach was a deposition assessment based on urine data. For significant cases, it may be possible to directly measure americium retention in the organ or tissue of interest using in vivo monitoring. In such cases, individual-specific retention parameters are appropriate for dosimetry.
9.5.1 Intake Assessment An americium intake can be estimated by fitting the bioassay data to the appropriate retention or excretion function, using manual or computerized techniques. For a single data point, the intake can be estimated by dividing the measured excretion by the value of the retention function for the appropriate day after intake represented by the sample in a manner similar to Equation 2.5. Values for the retention function can be obtained from those tabulated in this chapter, or directly from running the CINDY computer code. For multiple data points, the CINDY code provides a choice of fitting routines, or a manually determined fit of the data to the expected function can be performed. Once the intake is calculated, appropriate internal doses may be calculated by applying the dose coefficients of this chapter to Equations 2.10 or 2.11. The CINDY computer code may also be used to directly calculate internal doses, and is particularly appropriate for complex cases.
9.5.2 Deposition Assessment Deposition assessment involves determining the amount of material deposited in a body or tissue compartment of interest. Whereas the term “intake” includes all material taken into the body regardless of its subsequent fate, “deposition” is a more limited quantity that excludes material not retained (e.g., material that is immediately exhaled) and material not systemically absorbed (e.g., material cleared to the GI tract and excreted in feces without absorption). The HIDP coined the term “presystemic deposition” in the mid-1980s to precisely define what was being evaluated and avoid terms that had developed generic, ill-defined, or varied meanings (e.g., deposition, uptake, burden). In addition, the term “deposition” was gaining preference in the field of internal dosimetry as a process term associated with the respiratory tract, rather than a retained quantity. The HIDP defined presystemic deposition as the total radioactivity that will ultimately translocate into the transfer
Issued: January 31, 2003 PNNL-MA-860 Chapter 9.0 Page 9.23

compartment from a metabolically isolated pool; in other words, the activity ultimately reaching the blood. Historically at Hanford, this was the quantity compared with the MPBB of 0.05 µCi (241Am) as listed in ICRP 2 (1959). It is related to, but significantly different from intake, lung deposition, long-term lung burden, and instantaneous body burden (or retained quantity). Activity is deposited in presystemic compartments at the time of intake. From there, systemic uptake may be essentially instantaneous or it may occur gradually over an extended period of time. Transfer from the presystemic compartment into systemic circulation is assumed to be governed by linear first-order kinetics, and can be described in terms of a transfer rate constant. A urine excretion function such as described in Section 9.2.4 is typically used to estimate the presystemic deposition.
9.5.3 Assessing Organ and Effective Dose Equivalents The organs of primary interest for americium dose evaluations are the bone surface, red marrow, liver, and gonads. The lung is also an organ of general interest for inhalations, even though its contribution to effective dose for class W intakes is relatively insignificant. Other organs or tissues may be of interest depending on the nature of an intake. For example, the dose to a specific lymph node or small volume of tissue as the result of a wound intake of slowly transportable materials may be of academic interest, but is not a regulatory concern. Such cases can be dealt with as they arise and are beyond the general scope of this technical basis. Once the magnitude of an intake, presystemic deposition, or initial lung deposition has been determined, organ dose equivalents and the effective dose equivalent can be assessed using hand-calculation techniques or computer codes. The HIDP uses the CINDY computer code to aid in dose calculations. More detailed explanations and copies of the code are maintained in the Hanford Radiation Protection Historical Files. The tabulated dose coefficients of Section 9.3 are useful for hand calculations.
PNNL-MA-860 Chapter 9.0 Issued: January 31, 2003 Page 9.24

9.6 Management of Internal Contamination Cases This section discusses the diagnostic procedures, therapeutic actions, and long-term monitoring of internal depositions.
9.6.1 Diagnostic Procedures The diagnosis of an intake involves a combination of workplace monitoring to identify on-the-job potential intakes and bioassay measurements to confirm and quantify internal contamination. The primary method of identifying potential intakes is by workplace monitoring, such as personal contamination surveys, nasal smear analyses, air sample results, or workers’ identifications of unusual conditions. These techniques provide qualitative screening to alert radiation protection staff about potential internal exposure, rather than absolute confirmation that exposure has or has not occurred. For example, activity detected on nasal smears is usually an indication of an inhalation intake; however, the absence of activity does not necessarily mean that an intake did not occur. The absence of nasal smear activity following an inhalation intake can be explained by a sufficient delay between the time of intake and the collection of nasal smears to allow for complete clearance of activity from the nares. The ICRP 30 (1979) respiratory tract model indicates that a delay of as little as 30 to 60 minutes may be adequate for this in some cases. Alternatively, some individuals are mouth-breathers, whose noses are partially or completely bypassed in the respiratory process, hence no activity may be deposited in the nares, despite the occurrence of an inhalation intake. Particle size can also significantly affect nasal deposition and clearance. Once a worker has been identified as having incurred a potential intake, the initial diagnostic measurements are arranged. These may include a chest count, wound count, single voiding (spot) urine sample analysis, first-day fecal sampling, and overnight urine sampling. The purpose of these initial procedures is to provide an order-of-magnitude estimate of the potential internal exposure and dose. Initial diagnostic measurements are usually sufficient for final evaluations only when all results collectively rule out the possibility of an intake. In reality, initial measurements are not generally expected to do this, and follow-up measurements are necessary. Follow-up diagnostic measurements may include additional urine and fecal samples, chest counts, liver counts, head counts, and lymph node counts. These analyses aid in determining the magnitude, location, and retention characteristics of the deposited material. In some cases, blood samples or tissue specimens may also be appropriate. In addition, workplace or clothing contamination analyses, air sample analyses,
Issued: January 31, 2003 PNNL-MA-860 Chapter 9.0 Page 9.25

particle size analyses, and/or solubility analyses may be performed to more clearly define the physical and radiological characteristics of the material to which the worker was exposed. It is the responsibility of the exposure evaluator, working closely with contractor radiation protection staff, to determine the appropriate diagnostic protocols. Scheduling of follow-up measurements will normally be done by the appropriate contractor radiation protection staff.
9.6.2 Therapeutic Actions Therapeutic actions for potential internal contamination include the use of decorporation agents, catharsis, and surgical excision. For the purposes of this discussion, the normal skin decontamination procedures of Hanford contractors are not considered therapeutic actions, although it is acknowledged that these procedures can be quite effective in preventing the intake of radioactivity. The decision to undertake one or more of these therapeutic actions is the responsibility of the participating HEHF Occupational Medicine care provider with the concurrence of the patient. The exposure evaluator will provide advice and consultation to the physician and patient regarding the potential dose implications and efficacy of alternative actions. Guidance for the methods of therapy can be found in NCRP Report No. 65 (1980) and in the “Guidebook for the Treatment of Accidental Internal Radionuclid Contamination of Workers” (Bhattacharyya et al. 1992). Guidance for circumstances under which therapy may be warranted is contained in PNL-MA-552, but was established as a good practice based on experience rather than a detailed technical analysis. Decorporation therapy is also referred to as chelation therapy, and involves the chemical removal of radioactivity from the bloodstream through drug administration. The drug diethylenetriaminepenta-acetic acid (DTPA) has U.S. Food and Drug Administration approval as an investigational new drug for use in removing americium. Under the investigational new drug category, the patient must provide informed consent to HEHF before the drug may be administered. Decorporation therapy significantly enhances urinary excretion of americium, a point that must be considered when interpreting urine samples affected by therapy. ICRP 78 (1997) suggests that urinary excretion may be increased by as much as a factor of 50.
PNNL-MA-860 Chapter 9.0 Issued: January 31, 2003 Page 9.26

Following the 1976 americium column explosion at the 242-Z facility, the most exposed worker received extensive therapy using DTPA (Breitenstein 1983; Robinson et al. 1983). This therapy is generally recognized as having been life-saving, owing to the dose to the liver that was averted by the DTPA. Without the DTPA therapy it is generally considered that doses would have been sufficiently high as to ultimately result in liver failure. There was no evidence of liver disorder either during or following the DTPA therapy. Catharsis involves accelerating the passage of material through the GI tract by means of laxative drugs or physical means such as an enema. Catharsis has potential value in reducing the adsorption of material into the bloodstream from the GI tract and in reducing the dose to the GI tract organs from material passing through the GI tract. These measures are not generally considered for occupational exposures to americium, because the GI tract adsorption of americium is slight, and the dose to the GI tract organs is an insignificant fraction of the total effective dose. Surgical excision following wounds can be extremely effective in reducing the potential uptake, particularly when coupled with decorporation therapy. Minor excisions are usually performed at the Emergency Decontamination Facility (EDF) by HEHF Occupational Medicine staff, assisted by a PNNL exposure evaluation and radiation protection personnel.
9.6.3 Long-Term Monitoring of Internal Depositions Once an internal dosimetry evaluation has been completed, it may be recommended that the worker be placed on a specialized long-term bioassay monitoring schedule. The reasons for this are twofold: first, long-term follow-up monitoring results that are consistent with the projected results verify the conclusions of the evaluation. Second, if long-term results are projected to be detectable, and the worker returns to americium work, then the capability of a routine bioassay monitoring program to detect an additional intake may be affected. This issue must be addressed on an individual-specific basis.
9.7 References 10 CFR 835. 1998. U.S. Department of Energy. “Occupational Radiation Protection.” U.S. Code of Federal Regulations.
Issued: January 31, 2003 PNNL-MA-860 Chapter 9.0 Page 9.27

Bhattacharyya, M. H., B. D. Breitenstein, H. Metivier, B. A. Muggenburg, G. N. Stradling, and V. Volf. 1992. “Guidebook for the treatment of accidental internal radionuclide contamination of workers.” Rad. Prot. Dosim. 41:1. Breitenstein, B. D. 1983. “1976 Hanford americium exposure incident: Medical management and chelation therapy.” Health Phys. 45:4(855-866). International Commission on Radiological Protection (ICRP). 1959. Report of Committee II on permissible dose for internal radiation. ICRP publication 2, Pergamon Press, New York. International Commission on Radiological Protection (ICRP). 1972. The Metabolism of compounds of plutonium and other nuclides. ICRP publication 19, Pergamon Press, New York. International Commission on Radiological Protection (ICRP). 1979. “Limits for intakes of radionuclides by workers.” (ICRP publication 30, part 1). Annals of the ICRP, 2:3-4, Pergamon Press, New York. International Commission on Radiological Protection (ICRP). 1983. “Radionuclide transformations: Energy and intensity of emissions.” (ICRP publication 38). Annals of the ICRP, 11-13, Pergamon Press, New York. International Commission on Radiological Protection (ICRP). 1986. “The metabolism of plutonium and related elements.” (ICRP publication 48). Annals of the ICRP, 16:2-3, Pergamon Press, New York. International Commission on Radiological Protection (ICRP). 1988a. “Limits for intakes of radionuclides by workers: An addendum,” (ICRP publication 30, part 4). Annals of the ICRP, 19:4, Pergamon Press, New York. International Commission on Radiological Protection (ICRP). 1988b. “Individual monitoring for intakes of radionuclides by workers: Design and interpretation.” (ICRP publication 54). Annals of the ICRP, 19:1-3, Pergamon Press, New York. International Commission on Radiological Protection (ICRP). 1989. “Age-dependent doses to members of the public from intake of radionuclides: Part 1.” (ICRP publication 56). Annals of the ICRP, 20:2, Pergamon Press, New York.
PNNL-MA-860 Chapter 9.0 Issued: January 31, 2003 Page 9.28

International Commission on Radiological Protection (ICRP). 1993. “Age-dependent doses to members of the public from intake of radionuclides: Part 2 ingestion dose coefficients.” (ICRP publication 67). Annals of the ICRP, 23:3-4, Pergamon Press, New York. International Commission on Radiological Protection (ICRP). 1994a. “Human respiratory tract model for radiological protection.” (ICRP publication 66). Annals of the ICRP, 24:1-3, Pergamon Press, New York. International Commission on Radiological Protection (ICRP). 1994b. “Dose coefficients for intakes of radionuclides by workers.” (ICRP publication 68). Annals of the ICRP, 24:4, Pergamon Press, New York. International Commission on Radiological Protection (ICRP). 1997. “Individual monitoring for internal exposure of workers.” (ICRP publication 78). Annals of the ICRP, 27:3-4, Pergamon Press, New York. Kathren, R. L. 1994. “Toward improved biokinetic models for actinides: The United States Transuranium and Uranium Registries, a twenty-five year report.” Rad. Prot. Dosim. 53:1-4(219-227). National Council on Radiation Protection and Measurements (NCRP). 1980. Management of Persons Accidentally Contaminated with Radionuclides. NCRP Report No. 65, Bethesda, Maryland. Robinson, B., K. R. Heid, T. L. Aldridge, and R. D. Glenn. 1983. “1976 Hanford americium exposure incident: organ burden and radiation dose estimates.” Health Phys. 45:4(911-921). Rosen, J., N. Cohen, and M. E. Wrenn. 1972. “Short-term metabolism of 241Am in the adult baboon.” Health Phys. 22(621-626). Strenge, D. L., R. A. Kennedy, M. J. Sula, and J. R. Johnson. 1992. Code for Internal Dosimetry (Cindy Version 1.2), Part 1: Conceptual Representation. PNL-7493 Pt. 1, Rev. 1, Pacific Northwest National Laboratory, Richland, Washington. U.S. Environmental Protection Agency (EPA). 1988. Limiting Values of Radionuclide Intake and Air Concentration and Dose Conversion Factors for Inhalation, Submersion, and Ingestion. Federal Guidance Report No. 11, EPA-520/1-88-020, Washington, D.C.
Issued: January 31, 2003 PNNL-MA-860 Chapter 9.0 Page 9.29

10.0 Other Transuranic Elements
This chapter provides technical information on the transuranic elements (other than plutonium and americium) that have been identified as warranting Hanford technical basis analysis. Initially, neptunium is the only element so identified. As other elements are identified, this chapter will be expanded with subsections devoted to each element. Dosimetry methods used are based on the concepts of ICRP 30 (1979), ICRP 48 (1986) and ICRP 67 (1993), as implemented using the CINDY computer code (Strenge et al. 1992).
10.1 Neptunium
Neptunium has posed very limited internal dosimetry issues at Hanford, due in large part to its very low specific activity relative to plutonium. The slight mass impurities of plutonium typically found with neptunium usually are much more dosimetrically significant because of their much higher specific activity. The following discussions lead to adoption of an internal dosimetry program for neptunium based on ICRP 30 and ICRP 48 concepts. Compared with more recent ICRP publications discussed below, this is a program likely to be conservative by a factor of 10 to 100. However, the CINDY code cannot accommodate the newer ICRP models. The lack of significant neptunium exposure at Hanford and the conservativeness of the ICRP 30 and 48 models suggest that additional Hanford resources need not be allocated to neptunium internal dosimetry at this time.
10.1.1 Sources and Characteristics
Neptunium at Hanford might be found at the Redox Plant (202-S), 233-S, the PUREX Plant (202-A), chemistry labs, or as a trace contaminant in waste products or fuel. The only isotope likely to be of significant dosimetric concern as a result of current Hanford activities is 237Np. Radiological decay data for 237Np are shown in Table 10.1. The data were taken directly from, or calculated based on information contained in ICRP 38 (1983).
10.1.2 Biokinetic Behavior This section discusses the inhalation transportability class, internal distribution and retention, and the urinary and fecal excretion of neptunium.
Issued: January 31, 2003 PNNL-MA-860 Chapter 10.0 Page 10.1

Table 10.1. Radiological Decay Data for Neptunium
Physical Half-Life Decay Constant Specific Activity
Isotope
Principal Decay Mode,
Energy and Yield Years Days Year-1 Day-1 Ci/g
237Np
Alpha 4.772 MeV, 25% 4.789 MeV, 47.1%
Gamma 86.5 keV, 12.6%
2.14E+06 7.81E+08 3.24E-07 8.87E-10 7.02E-04
Transportability Class
All compounds of neptunium are assigned transportability class W by ICRP 48 (1986). The new respiratory tract model of ICRP 66 (1994) assigned absorption type M to all forms of neptunium (ICRP 68 [1994], ICRP 78 [1997]).
Gastrointestinal Uptake to Blood (f1 Factor) The fractional uptake to blood from the gastrointestinal (GI) tract is assumed to be 5Η10-4, as recommended in ICRP publications 67 and 78. This value was reduced from the 10-3 value used in earlier ICRP publications based on human studies published by Popplewell, Harrison, and Ham (1991) and discussed in ICRP 67. The 5Η10-4
value applies to both inhalation and ingestion intakes.
Distribution and Retention in Systemic Organs and Tissues The choice of models for use by the HIDP is constrained somewhat by the tools routinely used by the program. For internal dose calculations, the main computer code used by the HIDP is the CINDY computer code (Strenge et al. 1992), which uses basic ICRP 30 and 48 format models (simple first-order kinetics) for defining metabolically significant organs and tissues but allows adjustment of the organ partitioning and clearance half-times for those organs and tissues. CINDY does not accommodate the addition of new organs and tissues or alternate model forms, such as the recycling models used in more recent ICRP publications (e.g., ICRP 67). The basic ICRP 30 Part 4 (1988) model (based on data presented in ICRP 48) is used by Hanford for distribution and retention of neptunium in the body, and is described as follows. For dissolved (ionic form) neptunium reaching the transfer compartment (i.e., the blood stream), this ICRP model distributes 75% to the bone with a
PNNL-MA-860 Chapter 10.0 Issued: January 31, 2003 Page 10.2

clearance half-time of 50 years, and 15% to the liver with a clearance half-time of 20 years. The activity deposited in bone is assumed to be deposited uniformly over bone surfaces of both cortical and trabecular bone, where it remains until decayed or excreted. A small fraction is permanently retained in the gonads (0.035% for testes and 0.011% for ovaries). The remaining 10% is assumed to go directly to excretion or short-term holdup in other body tissues. A departure from the simple first-order kinetics form of modeling (sum of single exponentials) to a recycling form of model occurred with ICRP 56 (1989), which was further refined in ICRP 67. Some significant changes with regard to neptunium biokinetics also occurred with those model shifts. The skeleton uptake was changed from the 75% in ICRP 48 to 50% in ICRP 56, and then to 45% in ICRP 67. The liver uptake fraction was reduced from 15% in ICRP 48 to 10% in both ICRP 56 and 67. The concept of retention half-time is somewhat lost with recycling models, however, an “externally viewed” or apparent half-time can be stated for some applications. ICRP 56 suggested such a liver half-time of about 3 to 15 years, which was reinforced in ICRP 67. This liver half-time is much faster than plutonium, and somewhat faster than americium. The long apparent skeleton half-time of ICRP 48 did not appear to be significantly reduced. ICRP 56 and 67 also attributed small uptake fractions to long-term retention in soft tissues (2% with a 100-year half-time), with a total of another 3 to 5% having short-term soft tissue retention. As much as 30 to 35% of the neptunium in circulation in the blood may go to direct urinary excretion. These modeling changes, combined with the new tissue weighting factors of ICRP 60 (1990), resulted in a much lower effective dose coefficient than the one derived using the ICRP 30 and ICRP 48 models. These newer recycling models and the associated lower dose coefficients are not being adopted by the HIDP at this time due to the lack of a routine dosimetry code to implement them, the relative insignificance of neptunium to Hanford dosimetry with the older, more conservative models, and the mandatory tissue weighting factors of 10 CFR 835.
Urinary and Fecal Excretion of Neptunium Actual data for neptunium excretion are limited and there is substantial variation in models. Neither ICRP 30 Part 4, ICRP 48, nor ICRP 54 directly addressed urinary or fecal excretion of neptunium. Lessard et al. (1987) used a fractional split of 0.5 to urine and 0.5 to feces for excretion and calculated urine and fecal excretion fractions based on ICRP 30 Part 2 (1981). The CINDY computer code incorporates a general ICRP 30 model for excretion,
Issued: January 31, 2003 PNNL-MA-860 Chapter 10.0 Page 10.3

based on the initial fraction going directly to excretion and the long-term clearance from liver and skeleton going directly to excretion with a user-established ratio for the urine-to-fecal paths. In ICRP 78, urine and fecal excretion fractions were tabulated based on the ICRP 67 recycling model. Injection (instant uptake) and ingestion fractions were tabulated only for the first 10 days post intake. Fractions for 5-µm-AMAD particle inhalation of Type M 237Np compounds were tabulated out to 365 days post intake. The ICRP 67 model has a much larger fraction (32%) going directly to urine excretion from the blood, with fecal excretion representing only a few percent. These models give substantially different results. Based on the ICRP 67 discussion of urinary excretion, the HIDP has adopted a 90% urinary excretion pathway for excretion of metabolized neptunium, and incorporates this into a CINDY computer code urine-to-fecal split of 90:10. This modeling results in a substantial underestimate of urine excretion fractions compared with values tabulated in ICRP 67. The application of these fractions to actual bioassay data would result in substantially higher estimates of intake compared with the use of ICRP 67. The CINDY model used by Hanford is considered adequate for basic program design and interpretation of early data. Caution in its application to actual intakes is advised because of the relatively large discrepancy between the various models and the lack of human data to support them.
10.1.3 Internal Dosimetry Factors This section contains factors that are useful in making internal dosimetry calculations. The factors included in this section are derived from the CINDY computer code and incorporate the models and assumptions described in the preceding sections. Their application is intended for those circumstances where such assumptions are appropriate or more specific information is lacking. Variation from these factors is appropriate if sufficient data are available.
Intake Retention and Excretion Fractions
The intake retention (or excretion) fraction expresses the fraction of intake retained in a particular compartment or excreted by a particular pathway (urine or feces) at a given time post intake. Although excretion implies elimination rather than retention, conventional models include excretion compartments under the general term retention and use the term “intake retention fraction” (IRF) to describe both. IRFs for various times post intake are tabulated as described below for 237Np.
PNNL-MA-860 Chapter 10.0 Issued: January 31, 2003 Page 10.4

Lung retention fractions for the class W inhalations of 1-µm- and 5-µm-AMAD particles of 237Np are tabulated in Table 10.2 and plotted in Figure 10.1. Urine excretion fractions for an instantaneous uptake, acute inhalations, and acute ingestions of 237Np are shown in Table 10.3 and plotted in Figure 10.2. Corresponding values for fecal excretion are shown in Table 10.4 and plotted in Figure 10.3. Values for days other than those tabulated here can be obtained by interpolation between the tabulated data, or by obtaining the values directly from CINDY.
Dose Coefficients Dose coefficients, expressed as committed dose equivalent per unit activity of intake (rem per nanocurie of acute intake), are a conven-ient shortcut to estimating doses based on standard assumptions when the magnitude of an intake is known or assumed. Acute intake dose coefficients have been tabulated for instantaneous uptake, class W inhalation (for both 1-µm- and 5-µm-AMAD particle sizes), and ingestion. The dose coefficients shown in Table 10.5 were derived by the CINDY computer code using the previously described models.
Comparison of Published Dosimetry Factors A comparison of 237Np dosimetry factors, including dose coeffici-ents, annual limits on intake (ALIs), and derived air concentrations (DACs) published in several sources is shown in Table 10.6. For Hanford applications, the DAC values of 10 CFR 835 Appendix A are typically used to control facility operations. As noted in the previous discussion on neptunium biokinetics, the dose coefficients used by Hanford are approximately an order of magnitude more conservative than the recent recommendations of the ICRP (1993; 1994b; 1997), due primarily to the significant impact of changing from the ICRP 48 metabolic model to that of ICRP 67.
10.1.4 Derived Reference Levels Derived screening, investigation, and regulatory compliance levels (based on committed effective dose equivalents of 10-mrem, 100-mrem, and committed bone surface dose equivalent of 50,000 mrem, respectively) have been calculated for 1-µm and 5-µm class W inhalations of pure 237Np. The urine excretion levels are shown in Table 10.7 and chest count levels are shown in Table 10.8. These levels are sufficiently low that, from a practical standpoint, any detected result is likely to result in investigation and dose assessment.
Issued: January 31, 2003 PNNL-MA-860 Chapter 10.0 Page 10.5

Table 10.2. Lung Retention Fractions for Class W Inhalation of 237Np
Days Post Intake 1-µm AMAD 5-µm AMAD0 3.3E-01 1.7E-01 1 2.1E-01 7.5E-02 2 1.8E-01 6.3E-02 5 1.5E-01 5.1E-02 7 1.4E-01 4.9E-02
14 1.3E-01 4.4E-02 30 1.0E-01 3.6E-02 60 7.0E-02 2.5E-02 90 4.8E-02 1.7E-02
180 1.5E-02 5.3E-03 365 1.4E-03 4.8E-04 730 1.1E-05 3.9E-06
1825 NA NA
0.001
0.010
0.100
1.000
0 50 100 150 200 250 300 350 400
Days Post Intake
Frac
tion
of In
take
Ret
aine
d
1-um Class W5-um Class W
Figure 10.1. 237Np Lung Retention
PNNL-MA-860 Chapter 10.0 Issued: January 31, 2003 Page 10.6

Table 10.3. Urine Excretion Fractions for 237Np Intakes
Class W Inhalation Days Post Intake
Instant Uptake Ingestion 1-µm 5-µm
1 1.6E-02 1.6E-05 1.2E-03 1.9E-03 2 1.0E-03 1.0E-06 1.2E-04 1.4E-04 5 3.9E-05 1.9E-08 4.8E-05 2.0E-05 7 3.8E-05 1.9E-08 4.7E-05 2.0E-05
14 3.8E-05 1.9E-08 4.4E-05 1.9E-05 30 3.8E-05 1.9E-08 3.8E-05 1.7E-05 60 3.8E-05 1.9E-08 3.0E-05 1.4E-05 90 3.8E-05 1.9E-08 2.3E-05 1.1E-05
180 3.8E-05 1.9E-08 1.1E-05 7.4E-06 365 3.8E-05 1.9E-08 5.3E-06 5.2E-06 730 3.7E-05 1.8E-08 4.5E-06 4.9E-06
1825 3.5E-05 1.7E-08 4.2E-06 4.6E-06 3650 3.1E-05 1.6E-08 3.8E-06 4.1E-06 7300 2.6E-05 1.3E-08 3.1E-06 3.4E-06
18250 1.5E-05 7.5E-09 1.8E-06 2.0E-06
1.E-09
1.E-08
1.E-07
1.E-06
1.E-05
1.E-04
1.E-03
1.E-02
1 10 100 1000 10000 100000
Days Post Intake
Frac
tion
of In
take
Exc
rete
d
Instant UptakeIngestion1-um Class W5-um Class W
Figure 10.2. 237Np Urine Excretion Fractions
Issued: January 31, 2003 PNNL-MA-860 Chapter 10.0 Page 10.7

Table 10.4. Fecal Excretion Fractions for 237Np Intakes
Class W Inhalation Days Post Intake
Instant Uptake Ingestion 1-µm 5-µm
1 1.8E-03 4.7E-01 1.1E-01 2.2E-01 2 1.2E-04 2.8E-01 1.3E-01 2.6E-01 5 4.3E-06 1.8E-02 2.3E-02 3.1E-02 7 4.3E-06 2.5E-03 6.3E-03 5.6E-03
14 4.3E-06 2.3E-06 1.2E-03 4.3E-04 30 4.3E-06 2.1E-09 9.4E-04 3.3E-04 60 4.3E-06 2.1E-09 6.2E-04 2.2E-04 90 4.3E-06 2.1E-09 4.1E-04 1.5E-04
180 4.2E-06 2.1E-09 1.2E-04 4.2E-05 365 4.2E-06 2.1E-09 9.6E-06 3.8E-06 730 4.1E-06 2.0E-09 5.5E-07 5.6E-07
1825 3.9E-06 1.9E-09 4.6E-07 5.1E-07 3650 3.5E-06 1.7E-09 4.2E-07 4.6E-07 7300 2.9E-06 1.4E-09 3.5E-07 3.8E-07
18250 1.7E-06 8.4E-10 2.0E-07 2.2E-07
1.0E-10
1.0E-09
1.0E-08
1.0E-07
1.0E-06
1.0E-05
1.0E-04
1.0E-03
1.0E-02
1.0E-01
1.0E+00
1 10 100 1000 10000 100000
Days Post Intake
Frac
tion
of In
take
Exc
rete
d
Instant UptakeIngestion1-um Class W5-um Class W
Figure 10.3. 237Np Fecal Excretion Fractions
PNNL-MA-860 Chapter 10.0 Issued: January 31, 2003 Page 10.8

Table 10.5. Committed Dose Coefficients for Acute Intakes of 237Np (rem/nCi)
Class W Inhalation Organ or Tissue
InstantaneousUptake
Ingestion f1=5E-04 1-µm 5-µm
Effective 4.5E+00 2.3E-03 5.5E-01 6.0E-01 Bone Surface 1.0E+02 5.1E-02 1.2E+01 1.3E+01 Red Marrow 8.1E+00 4.1E-03 9.7E-01 1.1E+00 Liver 3.6E+00 1.8E-03 4.3E-01 4.8E-01 Lung 5.7E-04 2.8E-07 5.9E-02 2.1E-02 Gonads 9.2E-01 4.6E-04 1.1E-01 1.2E-01
Table 10.6. Comparison of Dosimetric Factors for 237Np
Reference Source
Class W Inhalation
1-µm AMAD
Class W Inhalation
5-µm AMAD Soluble Ingestion Dose Coefficients CINDY (hE,50) 0.55 rem/nCi
1.5E-04 Sv/Bq 0.60 rem/nCi 1.6E-04 Sv/Bq
0.0023 rem/nCi 6.2E-07Sv/Bq
ICRP-30 Part 4 (hE,50) 1.3E-04 Sv/Bq NA 1.1E-06 Sv/Bq EPA Federal Guidance Report No.11 (hE,50)
1.46E-04 Sv/Bq (0.54 rem/nCi)
NA 1.20E-06 Sv/Bq (4.44E-03 rem/nCi
ICRP-68 [e(50)] 2.1E-05 Sv/Bq (0.078 rem/nCi)
1.5E-05 Sv/Bq (0.056 rem/nCi)
1.1E-07 Sv/Bq (4.1E-04 rem/nCi)
Bone Surface DAC 10 CFR 835, App. A 2E-12 µCi/ml and
9E-02 Bq/m3NA NA
EPA Federal Guidance Report No. 11
2E-12 µCi/ml and 6E-08 MBq/m3
NA NA
ICRP-30 Part 4 6E-02 Bq/ m3 NA NA Annual Limit on Intake, ALI (Bone Surface) Calculated from 10 CFR 835 DAC
4.8E-03 µCi and 216 Bq
NA NA
ICRP-30, ICRP-54 2E+02 Bq NA 2E+04 Bq EPA Federal Guidance Report No. 11
2.0E-04 MBq and 0.004 µCi
NA 0.02 MBq and 0.5 µCi
NA = not applicable
Issued: January 31, 2003 PNNL-MA-860 Chapter 10.0 Page 10.9

Table 10.7. 237Np Urine Excretion Reference Levels and Derived Reference Levels for Class W Inhalation
10-mrem HE,50
Screening Level 100-mrem HE,50
Investigation Level
50-rem Bone Surface Dose Limit
Compliance Level 1-µm 5-µm 1-µm 5-µm 1-µm 5-µm Inhalation
Intake (nCi): 1.8E-02 1.7E-02 1.8E-01 1.7E-01 4.2E+00 3.8E+00
Derived Screening Level
(dpm/d)
Derived Investigation Level
(dpm/d)
Derived Compliance Level
(dpm/d) Days Post
Intake 1-µm 5-µm 1-µm 5-µm 1-µm 5-µm 1 4.8E-02 7.0E-02 4.8E-01 7.0E-01 1.1E+01 1.6E+01 2 4.8E-03 5.2E-03 4.8E-02 5.2E-02 1.1E+00 1.2E+00 5 1.9E-03 7.4E-04 1.9E-02 7.4E-03 4.4E-01 1.7E-01 7 1.9E-03 7.4E-04 1.9E-02 7.4E-03 4.3E-01 1.7E-01
14 1.8E-03 7.0E-04 1.8E-02 7.0E-03 4.1E-01 1.6E-01 30 1.5E-03 6.3E-04 1.5E-02 6.3E-03 3.5E-01 1.5E-01 60 1.2E-03 5.2E-04 1.2E-02 5.2E-03 2.8E-01 1.2E-01 90 9.3E-04 4.1E-04 9.3E-03 4.1E-03 2.1E-01 9.4E-02
180 4.4E-04 2.7E-04 4.4E-03 2.7E-03 1.0E-01 6.3E-02 365 2.1E-04 1.9E-04 2.1E-03 1.9E-03 4.9E-02 4.4E-02 730 1.8E-04 1.8E-04 1.8E-03 1.8E-03 4.2E-02 4.2E-02
1825 1.7E-04 1.7E-04 1.7E-03 1.7E-03 3.9E-02 3.9E-02 3650 1.5E-04 1.5E-04 1.5E-03 1.5E-03 3.5E-02 3.5E-02 7300 1.3E-04 1.3E-04 1.3E-03 1.3E-03 2.9E-02 2.9E-02
18250 7.3E-05 7.4E-05 7.3E-04 7.4E-04 1.7E-02 1.7E-02 10.1.5 Bioassay for 237Np
This section discusses the general techniques and applicability of bioassay monitoring and describes the capabilities of excreta sample bioassay and in vivo measurements. General recommendations are also provided for routine bioassay monitoring for 237Np. Because 237Np is rarely found as a truly pure isotope, but usually has trace amounts of plutonium in it, the recommended bioassay program includes a discussion of the impact of these trace amounts with regard to bioassay.
PNNL-MA-860 Chapter 10.0 Issued: January 31, 2003 Page 10.10

Table 10.8. 237Np Chest Count Reference Levels and Derived Reference Levels for Class W Inhalation
10-mrem HE,50
Screening Level 100-mrem HE,50
Investigation Level
50-rem Bone Surface Dose Limit
Compliance Level 1-µm 5-µm 1-µm 5-µm 1-µm 5-µm Inhalation
Intake (nCi): 1.8E-02 1.7E-02 1.8E-01 1.7E-01 4.2E+00 3.8E+00
Derived Screening Level (nCi)
Derived Investigation Level (nCi)
Derived Compliance Level (nCi)
Days Post Intake 1-µm 5-µm 1-µm 5-µm 1-µm 5-µm
0 6.0E-03 2.8E-03 6.0E-02 2.8E-02 1.4E+00 6.5E-01 1 3.8E-03 1.3E-03 3.8E-02 1.3E-02 8.8E-01 2.9E-01 2 3.3E-03 1.1E-03 3.3E-02 1.1E-02 7.5E-01 2.4E-01 5 2.7E-03 8.5E-04 2.7E-02 8.5E-03 6.3E-01 2.0E-01 7 2.5E-03 8.2E-04 2.5E-02 8.2E-03 5.8E-01 1.9E-01
14 2.4E-03 7.3E-04 2.4E-02 7.3E-03 5.4E-01 1.7E-01 30 1.8E-03 6.0E-04 1.8E-02 6.0E-03 4.2E-01 1.4E-01 60 1.3E-03 4.2E-04 1.3E-02 4.2E-03 2.9E-01 9.6E-02 90 8.7E-04 2.8E-04 8.7E-03 2.8E-03 2.0E-01 6.5E-02
180 2.7E-04 8.8E-05 2.7E-03 8.8E-04 6.3E-02 2.0E-02 365 2.5E-05 8.0E-06 2.5E-04 8.0E-05 5.8E-03 1.8E-03 730 2.0E-07 6.5E-08 2.0E-06 6.5E-07 4.6E-05 1.5E-05
Excreta Bioassay Techniques for 237Np
The typical urine sampling practice is to collect a urine sample over a specified time interval and perform a chemical separation using an added tracer to determine the chemical yield of the process. This technique is followed by electroplating and quantitative alpha spectrometry. Fecal sample analysis follows a process similar to urine sample analysis. Less sensitive, rapid analytical procedures are available for special circumstances. These procedures can be executed and results obtained in substantially shorter times than the routine procedure, but they are less sensitive. Their use is primarily for diagnostic bioassay of suspected internal contamination related to unplanned exposures (incidents). The decision to use such procedures involves consider-ing the probability and potential magnitude of the exposure.
Issued: January 31, 2003 PNNL-MA-860 Chapter 10.0 Page 10.11

The contractual detection limits for 237Np in urine or feces can be found in the radiochemistry bioassay laboratory statement of work (available from the HIDP) and in the Hanford Internal Dosimetry Project Manual (PNL-MA-552).(a)
The minimum detectable intakes based on a 0.02 dpm/d urinalysis sensitivity are shown in Table 10.9. The committed effective and bone surface dose equivalents associated with those intakes are shown in Tables 10.10 and 10.11, respectively, and Figures 10.4 and 10.5 show graphical presentations of the minimum detectable doses. Corresponding data based on a 0.1-dpm/d fecal analysis sensitivity, are shown in Tables 10.12 through 10.14 and plotted in Figures 10.6 and 10.7.
Table 10.9. Minimum Detectable Intakes (nCi) for 237Np Based on Detection of 0.02 dpm/d 237Np in Urine
Class W Inhalation Days Post
Intake Instant Uptake Ingestion 1-µm 5-µm
1 5.6E-04 5.6E-01 7.5E-03 4.7E-03 2 9.0E-03 9.0E+00 7.5E-02 6.4E-02 5 2.3E-01 4.7E+02 1.9E-01 4.5E-01 7 2.4E-01 4.7E+02 1.9E-01 4.5E-01
14 2.4E-01 4.7E+02 2.0E-01 4.7E-01 30 2.4E-01 4.7E+02 2.4E-01 5.3E-01 60 2.4E-01 4.7E+02 3.0E-01 6.4E-01 90 2.4E-01 4.7E+02 3.9E-01 8.2E-01
180 2.4E-01 4.7E+02 8.2E-01 1.2E+00 365 2.4E-01 4.7E+02 1.7E+00 1.7E+00 730 2.4E-01 5.0E+02 2.0E+00 1.8E+00
1825 2.6E-01 5.3E+02 2.1E+00 2.0E+00 3650 2.9E-01 5.6E+02 2.4E+00 2.2E+00 7300 3.5E-01 6.9E+02 2.9E+00 2.6E+00
18250 6.0E-01 1.2E+03 5.0E+00 4.5E+00
(a) Pacific Northwest National Laboratory (PNNL). Hanford Internal Dosimetry Project Manual.
PNNL-MA-552, Richland, Washington. (Internal manual.) Available URL: http://www.pnl.gov/eshs/pub/pnnl552.html
PNNL-MA-860 Chapter 10.0 Issued: January 31, 2003 Page 10.12

Table 10.10. Minimum Detectable Committed Effective Dose Equivalent (rem) for 237Np Based on Detection of 0.02 dpm/d 237Np in Urine
Class W Inhalation Days Post
Intake Instant Uptake Ingestion 1-µm 5-µm
1 2.5E-03 1.3E-03 4.1E-03 2.8E-03 2 4.1E-02 2.1E-02 4.1E-02 3.9E-02 5 1.0E+00 1.1E+00 1.0E-01 2.7E-01 7 1.1E+00 1.1E+00 1.1E-01 2.7E-01
14 1.1E+00 1.1E+00 1.1E-01 2.8E-01 30 1.1E+00 1.1E+00 1.3E-01 3.2E-01 60 1.1E+00 1.1E+00 1.7E-01 3.9E-01 90 1.1E+00 1.1E+00 2.2E-01 4.9E-01
180 1.1E+00 1.1E+00 4.5E-01 7.3E-01 365 1.1E+00 1.1E+00 9.3E-01 1.0E+00 730 1.1E+00 1.2E+00 1.1E+00 1.1E+00
1825 1.2E+00 1.2E+00 1.2E+00 1.2E+00 3650 1.3E+00 1.3E+00 1.3E+00 1.3E+00 7300 1.6E+00 1.6E+00 1.6E+00 1.6E+00
18250 2.7E+00 2.8E+00 2.8E+00 2.7E+00
1.0E-03
1.0E-02
1.0E-01
1.0E+00
1.0E+01
1 10 100 1000 10000 100000
Days Post Intake
Com
mitt
ed E
ffect
ive
Dos
e Eq
uiva
lent
(rem
)
Instant UptakeIngestion1-um Class W 5-um Class W5-rem Dose Limit
Figure 10.4. Minimum Detectable Committed Effective Doses for 237Np Based on Detection of 0.02 dpm/d in Urine
Issued: January 31, 2003 PNNL-MA-860 Chapter 10.0 Page 10.13

Table 10.11. Minimum Detectable Committed Bone Surfaces Dose Equivalent (rem) for 237Np Based on Detection of 0.02 dpm/d 237Np in Urine
Class W Inhalation Days Post
Intake Instant Uptake Ingestion 1-µm 5-µm
1 5.6E-02 2.9E-02 9.0E-02 6.2E-02 2 9.0E-01 4.6E-01 9.0E-01 8.4E-01 5 2.3E+01 2.4E+01 2.3E+00 5.9E+00 7 2.4E+01 2.4E+01 2.3E+00 5.9E+00
14 2.4E+01 2.4E+01 2.5E+00 6.2E+00 30 2.4E+01 2.4E+01 2.8E+00 6.9E+00 60 2.4E+01 2.4E+01 3.6E+00 8.4E+00 90 2.4E+01 2.4E+01 4.7E+00 1.1E+01
180 2.4E+01 2.4E+01 9.8E+00 1.6E+01 365 2.4E+01 2.4E+01 2.0E+01 2.3E+01 730 2.4E+01 2.6E+01 2.4E+01 2.4E+01
1825 2.6E+01 2.7E+01 2.6E+01 2.5E+01 3650 2.9E+01 2.9E+01 2.8E+01 2.9E+01 7300 3.5E+01 3.5E+01 3.5E+01 3.4E+01
18250 6.0E+01 6.1E+01 6.0E+01 5.9E+01
1.0E-02
1.0E-01
1.0E+00
1.0E+01
1.0E+02
1.0E+03
1 10 100 1000 10000 100000
Days Post Intake
Com
mitt
ed B
one
Surf
ace
Dos
e Eq
uiva
lent
(rem
)
Instant UptakeIngestion1-um Class W5-um Class W50-rem Dose Limit
Figure 10.5. Minimum Detectable Committed Bone Surface Doses for 237Np Based on Detection of
0.02 dpm/d in Urine
PNNL-MA-860 Chapter 10.0 Issued: January 31, 2003 Page 10.14

Table 10.12. Minimum Detectable Intakes (nCi) for 237Np Based on Detection of 0.1 dpm/d 237Np in Feces
Class W Inhalation Days Post
Intake Instant Uptake Ingestion 1-µm 5-µm
1 2.5E-02 9.6E-05 4.1E-04 2.0E-04 2 3.8E-01 1.6E-04 3.5E-04 1.7E-04 5 1.0E+01 2.5E-03 2.0E-03 1.5E-03 7 1.0E+01 1.8E-02 7.2E-03 8.0E-03
14 1.0E+01 2.0E+01 3.8E-02 1.0E-01 30 1.0E+01 2.1E+04 4.9E-02 1.4E-01 60 1.0E+01 2.1E+04 7.3E-02 2.0E-01 90 1.0E+01 2.1E+04 1.1E-01 3.0E-01
180 1.1E+01 2.1E+04 3.8E-01 1.1E+00 365 1.1E+01 2.1E+04 4.7E+00 1.2E+01 730 1.1E+01 2.3E+04 8.2E+01 8.0E+01
1825 1.2E+01 2.4E+04 9.8E+01 8.8E+01 3650 1.3E+01 2.6E+04 1.1E+02 9.8E+01 7300 1.6E+01 3.2E+04 1.3E+02 1.2E+02
18250 2.6E+01 5.4E+04 2.3E+02 2.0E+02 In Vivo Bioassay Techniques for 237Np
In vivo measurement of 237Np is not routinely performed at Hanford. It can be accomplished by measuring the low-energy x-rays from 237Np, but is more effectively accomplished by measuring the 233Pa progeny of 237Np. The gamma emissions from 233Pa (e.g., the 312-keV photon having a 36% intensity) are a reasonable indicator for 237Np in secular equilibrium with 233Pa. The equilibrium condition is reached in a few tens of days. Hanford does not have a ready calibration in place for these in vivo measurements, however, chest counting for 233Pa can be accomplished if it is required, with a MDA in the range of 0.25 nCi. Because routine in vivo measurements for this nuclide are not being performed and a formal MDA has not been established, a minimum detectable dose analysis is not provided.
Recommended Periodic Bioassay Monitoring Protocol Based on Tables 10.11 and 10.12, an annual urine sampling program is recommended for monitoring intakes of pure 237Np. Such a program is capable of demonstrating regulatory compliance with both stochastic and deterministic dose limits, but is not capable of
Issued: January 31, 2003 PNNL-MA-860 Chapter 10.0 Page 10.15

Table 10.13. Minimum Detectable Committed Effective Dose Equivalent (rem) for 237Np Based on Detection of 0.1 dpm/d 237Np in Feces
Class W Inhalation Days Post
Intake Instant Uptake Ingestion 1-µm 5-µm
1 1.1E-01 2.2E-07 2.3E-04 1.2E-04 2 1.7E+00 3.7E-07 1.9E-04 1.0E-04 5 4.7E+01 5.8E-06 1.1E-03 8.7E-04 7 4.7E+01 4.1E-05 3.9E-03 4.8E-03
14 4.7E+01 4.5E-02 2.1E-02 6.3E-02 30 4.7E+01 4.9E+01 2.7E-02 8.2E-02 60 4.7E+01 4.9E+01 4.0E-02 1.2E-01 90 4.7E+01 4.9E+01 6.0E-02 1.8E-01
180 4.8E+01 4.9E+01 2.1E-01 6.4E-01 365 4.8E+01 4.9E+01 2.6E+00 7.1E+00 730 4.9E+01 5.2E+01 4.5E+01 4.8E+01
1825 5.2E+01 5.5E+01 5.4E+01 5.3E+01 3650 5.8E+01 6.1E+01 5.9E+01 5.9E+01 7300 7.0E+01 7.4E+01 7.1E+01 7.1E+01
18250 1.2E+02 1.2E+02 1.2E+02 1.2E+02
1.0E-07
1.0E-06
1.0E-05
1.0E-04
1.0E-03
1.0E-02
1.0E-01
1.0E+00
1.0E+01
1.0E+02
1.0E+03
1 10 100 1000 10000 100000
Days Post Intake
Com
mitt
ed E
ffect
ive
Dos
e Eq
uiva
lent
(rem
)
Instant UptakeIngestion1-um Class W 5-um Class W5-rem Dose Limit
Figure 10.6. Minimum Detectable Committed Effective Doses for 237Np Based on Detection of
0.1 dpm/d in Feces PNNL-MA-860 Chapter 10.0 Issued: January 31, 2003 Page 10.16

Table 10.14. Minimum Detectable Committed Bone Surface Dose Equivalents (rem) for 237Np Based on Detection of 0.1 dpm/d 237Np in Feces
Class W Inhalation Days Post
Intake Instant Uptake Ingestion 1-µm 5-µm
1 2.5E+00 4.9E-06 4.9E-03 2.7E-03 2 3.8E+01 8.2E-06 4.2E-03 2.3E-03 5 1.0E+03 1.3E-04 2.4E-02 1.9E-02 7 1.0E+03 9.2E-04 8.6E-02 1.0E-01
14 1.0E+03 1.0E+00 4.5E-01 1.4E+00 30 1.0E+03 1.0E+03 5.9E-01 1.8E+00 60 1.0E+03 1.0E+03 8.7E-01 2.7E+00 90 1.0E+03 1.0E+03 1.3E+00 3.9E+00
180 1.1E+03 1.1E+03 4.5E+00 1.4E+01 365 1.1E+03 1.1E+03 5.6E+01 1.5E+02 730 1.1E+03 1.1E+03 9.8E+02 1.0E+03
1825 1.2E+03 1.2E+03 1.2E+03 1.1E+03 3650 1.3E+03 1.4E+03 1.3E+03 1.3E+03 7300 1.6E+03 1.6E+03 1.5E+03 1.5E+03
18250 2.6E+03 2.7E+03 2.7E+03 2.7E+03
1.0E-05
1.0E-04
1.0E-03
1.0E-02
1.0E-01
1.0E+00
1.0E+01
1.0E+02
1.0E+03
1.0E+04
1.0E+05
1 10 100 1000 10000 100000
Days Post Intake
Com
mitt
ed B
one
Surf
ace
Dos
e Eq
uiva
lent
(rem
)
Instant UptakeIngestion1-um Class W 5-um Class W50-rem Dose Limit
Figure 10.7. Minimum Detectable Committed Bone Surface Doses for 237Np Based on Detection of 0.1 dpm/d in Feces
Issued: January 31, 2003 PNNL-MA-860 Chapter 10.0 Page 10.17

demonstrating compliance with administrative control levels of 500-mrem committed effective dose equivalent or lower. More frequent urinalysis can provide some improvement in sensitivity, but primary reliance must be placed on prompt detection of potential intakes by workplace indicators and special bioassay monitoring to provide low-level dosimetry. Uncertainties about the appropriate urine excretion function for 237Np suggest periodic monitoring should not cover periods longer than 1 year. Actual experience with 237Np facilities at Hanford and Savannah River has shown that very slight mass impurities of plutonium in a neptunium mixture can eliminate the need for neptunium bioassay. The plutonium impurities have a much higher specific activity than 237Np, and although of little mass significance, they shift the activity ratio to that of a plutonium mixture (i.e., by mass the mixture is essentially all neptunium, by activity it is essentially all plutonium). Hanford practice (as recommended in the Hanford Internal Dosimetry Program Manual, PNL-MA-552, Section 5.4)(a) suggests that a radionuclide or mixture of nuclides contributing more than 25% to the 100-mrem committed effective dose equivalent criterion for requiring bioassay monitoring should be considered for specific bioassay. Radionuclides do not require specific bioassay if they are adequately monitored by indicator nuclides for a reference mixture. For 237Np historically found at Hanford, the trace mass of plutonium in the mixture resulted in a sufficiently high presence of plutonium radionuclides that for bioassay monitoring purposes, plutonium bioassay was sufficient. Conceptually, this can be demonstrated by examining the activity and mass ratios for plutonium and 237Np resulting in 237Np contributing 25% of the total committed effective dose equivalent. This analysis was performed using the dose coefficient for 237Np and several combinations of plutonium (from Chapter 8) and results are shown in Table 10.15. From Table 10.15, the summary statements below can be concluded: • If the Pu alpha-to-237Np activity ratio exceeds 6:1 for 1-µm
particles (15:1 for 5-µm particles), Np bioassay is not needed. • If the 237Np mass purity of the mixture exceeds 95% for 1-µm
particles (90% for 5-µm particles), then Np bioassay should be considered. Alternatively, if the plutonium mass impurity in the mixture exceeds 5% by weight for 1-µm particles (10% for 5-µm
(a) Pacific Northwest National Laboratory (PNNL). Hanford Internal Dosimetry Project Manual.
PNNL-MA-552, Richland, Washington. (Internal manual.) Available URL: http://www.pnl.gov/eshs/pub/pnnl552.html
PNNL-MA-860 Chapter 10.0 Issued: January 31, 2003 Page 10.18

particles), then Np bioassay is not likely to be needed. Mixture activity or isotopic characterization should be performed at these levels to aid in the determination of need for bioassay.
Special Monitoring for Suspected Intakes
Special bioassay monitoring for suspected inhalation or ingestion intakes should include a prompt chest count, a urine sample, and at least one (preferably two or more) fecal samples. If these measure-ments are obtained within the first 3 to 5 days, committed effective dose equivalents in the range of a few millirem to tens of mrem should be detectable.
Table 10.15. Activity and Mass Ratios for Plutonium and 237Np Mixtures Resulting in 237Np Contributing 25% of the Total Committed Effective Dose Equivalent
Pu:Np Alpha Activity Ratio Np:Pu Mass Ratio Np Component Wt%
Pu Component 1-µm 5-µm 1-µm 5-µm 1-µm 5-µm Class W 238Pu 4.1 4.2 5905 5819 99.98% 99.98% Class Y 238Pu 5.7 15.0 4281 1624 99.98% 99.94% Class W 239Pu(a) 3.8 3.8 24 24 95.93% 95.93% Class Y 239Pu(a) 5.3 13.8 17 6 94.32% 86.47% Class W 20-yr Weapons Grade 3.5 3.8 39 36 97.48% 97.31% Class Y 20-yr Weapons Grade 4.7 12.9 29 11 96.64% 91.34% Class W 20-yr Fuel Grade 3.3 3.4 7 7 87.14% 86.82% Class Y 20-yr Fuel Grade 4.7 12.0 5 2 82.59% 65.08% (a) For pure 239Pu only. The presence of 240Pu will increase the mass numbers by approximately
10-20% For potential wound intakes, special bioassay should consist of a wound count and a urine sample. Fecal sampling is not necessary for wound dosimetry; however, data on the fecal excretion following a wound can provide information which may be valuable to improving metabolic models.
10.1.6 Assessment of Internal Dose Assessments of internal dose for neptunium rely on evaluations of intake based on urine, fecal, or in vivo data. For significant cases, it may be possible to directly measure neptunium retention in the organ or tissue of interest using in vivo monitoring. In such cases, individual-specific retention parameters are appropriate for dosimetry.
Issued: January 31, 2003 PNNL-MA-860 Chapter 10.0 Page 10.19

Intake Assessment An intake can be estimated by fitting the bioassay data to the appropriate retention or excretion function, using manual or compu-terized techniques. For a single data point, the intake can be estimated by dividing the measured excretion by the value of the retention function for the appropriate day after intake represented by the sample in a manner similar to Equation 2.5. Values for the retention function can be obtained from those tabulated in this chapter, or directly from running the CINDY computer code. For multiple data points, the CINDY computer code provides a choice of fitting routines, or a manually determined fit of the data to the expected function can be performed. Once the intake is calculated, appropriate internal doses may be calculated by applying the dose coefficients of this chapter to Equations 2.10 or 2.11. The CINDY computer code may also be used to directly calculate internal doses and is particularly appropriate for complex cases.
Assessing Organ and Effective Dose Equivalents The organs of primary interest for 237Np dose evaluations are the bone surface, red marrow, liver, and gonads. The lung is also an organ of general interest for inhalations, even though its contribution to effective dose for class W intakes is relatively insignificant. Other organs or tissues may be of interest depending on the nature of an intake. For example, the dose to a specific lymph node or small volume of tissue may be of academic interest as the result of a wound intake of slowly transportable materials, even though doses to such tissues are not of regulatory concern. Such cases can be dealt with as they arise and are beyond the general scope of this technical basis. Once the magnitude of an intake has been determined, organ dose equivalents and the effective dose equivalent can be assessed using hand-calculation techniques or computer codes. The HIDP uses the CINDY computer codes to aid in dose calculations. More detailed explanations and copies of the codes are maintained in the Hanford Radiation Protection Historical Files. The tabulated dose coefficients of Table 10.5 are useful for hand calculations.
10.1.7 Management of Internal Contamination Cases This section discusses the diagnostic procedures, therapeutic actions, and long-term monitoring of internal depositions.
PNNL-MA-860 Chapter 10.0 Issued: January 31, 2003 Page 10.20

Diagnostic Procedures The diagnosis of an intake involves a combination of workplace monitoring to identify on-the-job potential intakes and bioassay measurements to confirm and quantify internal contamination. The primary method of identifying potential intakes is by workplace monitoring, such as personal contamination surveys, nasal smear analyses, air sample results, or workers' identifications of unusual conditions. These techniques provide qualitative screening to alert radiation protection staff to potential internal exposure, rather than absolute confirmation that exposure has or has not occurred. For example, activity detected on nasal smears is usually an indication of an inhalation intake; however, the absence of activity does not necessarily mean that an intake did not occur. The absence of nasal smear activity following an inhalation intake can be explained by a sufficient delay between the time of intake and the collection of nasal smears to allow for complete clearance of activity from the nares. The ICRP 30 (1979) respiratory tract model indicates that a delay of as little as 30 to 60 minutes may be adequate for this in some cases. Alternatively, some individuals are mouth-breathers, whose noses are partially or completely bypassed in the respiratory process, hence no activity may be deposited in the nares, despite the occurrence of an inhalation intake. Particle size can also significantly affect nasal deposition and clearance. Once a worker has been identified as having incurred a potential intake, the initial diagnostic measurements are arranged. These may include a chest count, wound count, single voiding (spot) urine sample analysis, first-day fecal sampling, and overnight urine sampling. The purpose of these initial procedures is to provide an order-of-magnitude estimate of the potential internal exposure and dose. Initial diagnostic measurements are usually sufficient for final evaluations only when all results collectively rule out the possibility of an intake. In reality, initial measurements are not generally expected to do this, and follow-up measurements are necessary. Follow-up diagnostic measurements may include additional urine and fecal samples, chest counts, liver counts, head counts, and lymph node counts. These analyses aid in determining the magnitude, location, and retention characteristics of the deposited material. In some cases, blood samples or tissue specimens may also be appro-priate. In addition, workplace or clothing contamination analyses, air sample analyses, particle size analyses, and/or solubility analyses may also be performed to more clearly define the physical and radiological characteristics of the material to which the worker was exposed.
Issued: January 31, 2003 PNNL-MA-860 Chapter 10.0 Page 10.21

It is the responsibility of the exposure evaluator, working closely with contractor radiation protection staff, to determine the appropriate diagnostic protocols. Scheduling of follow-up measurements will normally be done by the appropriate contractor radiation protection staff.
Therapeutic Actions Therapeutic actions for potential internal contamination include the use of decorporation agents, catharsis, and surgical excision. For the purposes of this discussion, the normal skin decontamination procedures of Hanford contractors are not considered therapeutic actions, although it is acknowledged that these procedures can be quite effective in preventing the intake of radioactivity. The decision to undertake one or more of these therapeutic actions is the respon-sibility of the participating HEHF Occupational Medicine care provider with the concurrence of the patient. The exposure evaluator will provide advice and consultation to the physician and patient regarding the potential dose implications and efficacy of alternative actions. Guidance for the methods of therapy can be found in NCRP Report 65 (1980) and in the “Guidebook for the Treatment of Accidental Internal Radionuclide Contamination of Workers” (Bhattacharyya et al. 1992). Guidance for circumstances under which therapy may be warranted is contained in PNL-MA-552, but was established as a good practice based on experience rather than a detailed technical analysis. Decorporation therapy is also referred to as chelation therapy, and involves the chemical removal of radioactivity from the bloodstream through drug administration. Both the “Guidebook for the Treatment of Accidental Internal Radionuclide Contamination of Workers” and NCRP 65 identify DTPA as the principal therapeutic agent, however NCRP 65 cautions that it might not be effective. The drug DTPA has U.S. Food and Drug Administration approval as an investigational new drug for removal of actinides. The investigational new drug status of DTPA requires that it can only be administered by an authorized user (e.g., HEHF) and that the patient must provide informed consent prior to its administration. Decorporation therapy may significantly enhance urinary excretion of neptunium, a point that must be considered when interpreting urine samples affected by therapy. Human data for chelation enhancement factors for neptunium are not available, however, the caution regarding its effectiveness suggests that a factor somewhat less than the 50 used for americium would be appropriate. Catharsis involves accelerating the passage of material through the GI tract by means of laxative drugs or physical means such as an enema. Catharsis has potential value in reducing the adsorption of
PNNL-MA-860 Chapter 10.0 Issued: January 31, 2003 Page 10.22

material into the bloodstream from the GI tract and in reducing the dose to the GI tract organs from material passing through the GI tract. These measures are not generally considered for occupational exposures to neptunium, because the GI tract adsorption of neptun-ium is slight, and the dose to the GI tract organs is an insignificant fraction of the total effective dose. Surgical excision following wounds can be extremely effective in reducing the potential internal deposition, particularly when coupled with decorporation therapy. Minor excisions are usually performed at the Emergency Decontamination Facility by HEHF Occupational Medicine staff, assisted by a PNNL exposure evaluator and radiation protection personnel.
Long-Term Monitoring of Internal Depositions
Once an internal dosimetry evaluation has been completed, it may be recommended that the worker be placed on a specialized long-term bioassay monitoring schedule. The reasons for this are twofold: first, long-term follow-up monitoring results that are consistent with the projected results verify the conclusions of the evaluation. Second, if long-term results are projected to be detectable, and the worker returns to neptunium work, then the capability of a routine bioassay monitoring program to detect an additional intake may be affected. This issue must be addressed on an individual-specific basis.
10.1.8 References
10 CFR 835. 1993. U.S. Department of Energy, “Occupational Radiation Protection.” U.S. Code of Federal Regulations. Bhattacharyya, M. H., B. D. Breitenstein, H. Metivier, B. A. Muggenburg, G. N. Stradling, and V. Volf. 1992. “Guidebook for the treatment of accidental internal radionuclide contamination of workers.” Rad. Prot. Dosim. 41:1. International Commission on Radiological Protection (ICRP). 1979a. “Limits for intakes of radionuclides by workers.” (ICRP publication 30, part 1). Annals of the ICRP, 2:3-4, Pergamon Press, New York. International Commission on Radiological Protection (ICRP). 1981. “Limits for intakes of radionuclides by workers.” (ICRP publication 30, part 2). Annals of the ICRP, 4:3-4, Pergamon Press, New York.
Issued: January 31, 2003 PNNL-MA-860 Chapter 10.0 Page 10.23

International Commission on Radiological Protection (ICRP). 1983. “Radionuclide transformations: Energy and intensity of emissions.” (ICRP publication 38). Annals of the ICRP, Volumes 11-13, Pergamon Press, New York. International Commission on Radiological Protection (ICRP). 1986. “The metabolism of plutonium and related elements.” (ICRP publication 48). Annals of the ICRP, 16:2-3, Pergamon Press, New York. International Commission on Radiological Protection (ICRP). 1988. “Limits for intakes of radionuclides by workers: an addendum.” (ICRP publication 30, part 4). Annals of the ICRP, 19:4, Pergamon Press, New York. International Commission on Radiological Protection (ICRP). 1989. “Age-dependent doses to members of the public from intake of radionuclides: Part 1.” (ICRP publication 56). Annals of the ICRP, 20:2, Pergamon Press, New York. International Commission on Radiological Protection (ICRP). 1990. “1990 Recommendations of the international commission on radiological protection.” (ICRP publication 60). Annals of the ICRP, 21:1-3, Pergamon Press, New York. International Commission on Radiological Protection (ICRP). 1993. “Age-dependent doses to members of the public from intake of radionuclides: Part 2 ingestion dose coefficients.” (ICRP publication 67). Annals of the ICRP, 23:3-4, Pergamon Press, New York. International Commission on Radiological Protection (ICRP). 1994a. “Human respiratory tract model for radiological protection.” (ICRP publication 66). Annals of the ICRP, 24:1-3, Pergamon Press, New York. International Commission on Radiological Protection (ICRP). 1994b. “Dose coefficients for intakes of radionuclides by workers.” (ICRP publication 68). Annals of the ICRP, 24:4, Pergamon Press, New York. International Commission on Radiological Protection (ICRP). 1997. “Individual monitoring for internal exposure of workers. (ICRP publication 78). Annals of the ICRP, 27:3-4, Pergamon Press, New York.
PNNL-MA-860 Chapter 10.0 Issued: January 31, 2003 Page 10.24

Lessard, E. T., X. Yihua, K. W. Skrable, G. E. Chabot, C. S. French, T. R. La Bone, J. R. Johnson, D. R. Fisher, R. Belanger, and J. L. Lipsztein. 1987. Interpretation of Bioassay Measurements. NUREG/CR-4884, U.S. Nuclear Regulatory Commission, Washington, D.C. National Council on Radiation Protection and Measurements (NCRP). 1980. Management of Persons Accidentally Contaminated with Radionuclides. NCRP Report No. 65, Bethesda, Maryland. Popplewell, D. S., J. D. Harrison, and G. J. Ham. 1991. “Gastrointestinal absorption of neptunium and curium in humans.” Health Phys. 60(6) 797-805 Strenge, D. L., R. A. Kennedy, M. J. Sula, and J. R. Johnson. 1992. Code for Internal Dosimetry (Cindy Version 1.2), Part 1: Conceptual Representation. PNL-7493 Pt. 1, Rev. 1, Pacific Northwest National Laboratory, Richland, Washington.
Issued: January 31, 2003 PNNL-MA-860 Chapter 10.0 Page 10.25

Issued: September 12, 2000 PNNL-MA-860 Chapter 11.0 Page 11.1
11.0 Cobalt-60 and Corrosion Products
This chapter provides background on the sources, characteristics, and biokinetic behavior of 60Co and other corrosion product radionu-clides and summarizes the technical basis used for their internal dosimetry at Hanford.
11.1 Sources and Characteristics of Corrosion Product Radionuclides
Corrosion product radionuclides are created by neutron activation of reactor components such as piping or fuel element cladding. The principal sources of corrosion product radionuclides at Hanford are the old reactor facilities, such as N Reactor (operated until 1986); however, FFTF can also be a source. In addition, corrosion products can be found in workers who have had intakes at other nuclear facilities, notably nuclear power plants or naval shipyards servicing nuclear-powered vessels. Corrosion product radionuclides are generally high-energy gamma-emitters; therefore, bioassay monitoring can be readily accomplished by whole body counting. Historically, fresh corrosion product radionuclides, regardless of origin, were usually a mixture of several radionuclides. The predominant radionuclide was usually 60Co, with 58Co, 54Mn, and 59Fe as the other significant constituents in a fresh mixture. Other radionuclides were often present in trace amounts, but they were generally of little dosimetric consequence. The relative abundance of the radionuclides varied from facility to facility. However, given the time elapsed since operation of the reactors at Hanford, the short-lived corrosion products have decayed away, leaving 60Co as the nuclide of concern. Radiological decay data for the common corrosion products are shown in Table 11.1.
Table 11.1. Radiological Data for Common Corrosion Products
Isotope Half-Life Decay Constant Specific Activity (Ci/g)
60Co 5.27 y 1.31E-01 y-1 1.13E+03 58Co 70.8 d 9.79E-03 d-1 3.17E+04 54Mn 313 d 2.21E-03 d-1 7.69E+03 59Fe 44.5 d 1.56E-02 d-1 4.95E+04
A detailed characterization of these corrosion products during N Reactor operations was performed by Weetman and DeHaven (1982a; 1982b). This work indicated that airborne particulates containing corrosion product radionuclides could be characterized by a lognormal distribution with an AMAD ranging from 0.5 µm to

PNNL-MA-860 Chapter 11.0 Issued: September 12, 2000 Page 11.2
2.5 µm. Unless specific information is available, the assumption of a 1-µm-AMAD particulate is recommended for evaluations of internal exposure. This recommendation runs counter to the 5-µm-AMAD particle size used elsewhere in this manual. For mixtures containing corrosion product radionuclides, the pulmonary retention of the individual radionuclides is probably influenced by the contaminant carrier matrix; thus, pulmonary retention for all of the radionuclides within a single carrier matrix may be similar. Oxides characteristically represent the least transportable form of an element in the lung. For purposes of a priori calculations of expected dose from intake, the transportability class for the oxide form of the radionuclide is assumed. Neverthe-less, retrospective assessment of internal dose following an intake should be based on actual observed retention in the lung.
11.2 Biokinetic Behavior of Corrosion Product Radionuclides The biokinetic behavior of corrosion product radionuclides in the body is influenced by the physical and chemical properties of the host matrix, as well as the individual elements composing the matrix. Thus, the actual behavior of the material following intake is dependent on numerous complex and competing factors. Although there have been numerous historical cases involving inhalation intakes of corrosion products at Hanford, the intakes involved have been too small to enable the specific radionuclide versus host matrix characteristics to be accurately described. The approach taken here regarding assumptions for distribution and retention of corrosion product radionuclides is to assume that the radionuclide behaves according to the most insoluble form established for the element in ICRP 30 (1979) unless sufficient in vivo data are available and the intake is of sufficient magnitude (e.g., potentially above 100 mrem) to warrant evaluation of individual-specific retention.
11.2.1 Transportability Class
ICRP 30 establishes default inhalation classes W and Y for cobalt, and classes D and W for both manganese and iron. The CINDY computer code (Strenge et al. 1992) implements the biokinetic models described in ICRP 30 and is used to assess expected bioassay compartment quantities following intakes of the corrosion products. The biokinetic parameters of CINDY can also be modified to provide a better agreement between observed and expected bioassay compartment values.

Issued: September 12, 2000 PNNL-MA-860 Chapter 11.0 Page 11.3
The new ICRP 66 lung model (ICRP 1994a) introduced the concept of lung absorption type as a replacement for the ICRP 30 inhalation class. Table 11.2 shows both the ICRP 30 inhalation class and the absorption type tabulated in ICRP publications 68 and 78 (ICRP 1994b; 1997).
Table 11.2. Lung Absorption and GI Uptake Factors for Corrosion Product Elements
Isotope Chemical Form Inhalation
Class(a) Lung Absorption
Type (b) GI Uptake, f1 (b)
Oxides, hydroxides, halides, nitrates, Y S 0.05 Co
All other compounds W M 0.1 Oxides, hydroxides,
halides, nitrates, W M 0.1 Mn All other compounds D F 0.1 Oxides, hydroxides,
halides W M 0.1 Fe All other compounds D F 0.1
(a) Based on ICRP 30. (b) Based on ICRP 68 and 78.
Because corrosion products are typically oxides, the oxide form of these elements is assumed for Hanford internal dosimetry unless other information is available. Consequently, the default inhalation classes for Hanford intakes of corrosion products are class Y for cobalt and W for manganese and iron.
11.2.2 Gastrointestinal Uptake to Blood (f1 Factor)
The gastrointestinal uptake (f1) factors for the corrosion products discussed in this section are shown in Table 11.2. No changes were made in the uptake factors between ICRP publication 30 and publications 67 (1993) and 78 for insoluble forms. The uptake factor for moderately insoluble forms of cobalt increased from 0.05 to 0.1. The extent of absorption of iron by the GI tract depends on a number of factors, including the amount of iron in the diet, its chemical form, the body’s iron needs, and the presence of interfering substances in the diet.
11.2.3 Biokinetic Models Cobalt
The ICRP 30 Part 1 (1979) model for cobalt is used by the HIDP. This model was also used in ICRP publication 78. Of the cobalt entering the blood stream, half (0.5) is excreted directly with a

PNNL-MA-860 Chapter 11.0 Issued: September 12, 2000 Page 11.4
half-time of 0.5 days, with the remaining half (0.5) distributed in the body. Of the amount distributed in the body, 10% is assumed to go to the liver and the remaining 90% is distributed throughout the rest of the body. The material deposited in body organs (other than lung) is removed from the organs at several rates. In the absence of reten-tion data on a case-specific basis, the ICRP recommends that the following retention half-lives be applied to the material in the liver and rest of body:
Fraction Retained Biological Half-Life, Days 0.6 6 0.2 60 0.2 800
Because the retention characteristics are considered to be the same for the liver as for the rest of the body, the relative distribution can be assumed to be constant at 10% in the liver and 90% in all other body tissues (except lung). Excretion from the systemic compartment is assumed to be fractionated to urine (0.7) and feces (0.3), as assumed by ICRP publication 54 (1988).
Manganese The HIDP uses the ICRP 30 Part 1 (1979) model for manganese entering the blood stream. It assumes distribution among bone surfaces, liver compartments, and all other soft tissue compartments as follows: Compartment Fraction Retained Biological Half-Life, Days Bone Surfaces 0.35 40 Liver 1 0.10 4 Liver 2 0.15 40 Soft Tissue 1 0.2 4 Soft Tissue 2 0.2 40 ICRP publication 54 noted that there were no reliable data on systemic excretion of manganese, thus it is assumed that systemic excretion is evenly split between urine and feces.
Iron The ICRP 30 Part 2 (1980) model for iron entering the blood stream, distributes it according to the following fractionation:
Tissue Fraction Biological Half-Life, Days Liver 0.08 2,000 Spleen 0.013 2,000 Rest of Body 0.907 2,000

Issued: September 12, 2000 PNNL-MA-860 Chapter 11.0 Page 11.5
Regardless of the site of deposition, iron is assumed to have a biological half-life of 2000 days, so the above organ distribution can be assumed to remain fixed following intake. ICRP has not provided any recommended fractionation for the systemic excretion of iron, thus it is assumed that systemic excretion is evenly split between urine and feces.
11.3 Internal Dosimetry Factors for Corrosion Products This section contains factors that are useful in making internal dosimetry calculations. The factors included in this section are derived from the CINDY computer code and incorporate the models and assumptions of the preceding sections. Their application is intended for circumstances where such assumptions are appropriate or more specific information is lacking. Variation from these factors is appropriate if sufficient data are available.
11.3.1 Whole Body Retention for Corrosion Products The whole body retention fractions for ingestion and inhalation of oxides of 60Co, 54Mn, and 59Fe are shown in Table 11.3, 11.4, and 11.5, respectively. The fractions are based on inhalation of 1-µm- and 5-µm-AMAD particle sizes for class Y 60Co, class W 54Mn, and class W 59Fe. Two particle sizes are addressed because the 1-µm particle size is the Hanford default value (based on Hanford facility air sample data discussed previously), and the 5-µm particle size is now recommended by the ICRP. Excretion fractions have not been provided because whole body counting data are typically used for these nuclides and retention can be directly determined. Retention or excretion fractions for other forms of these radionuclides can be calculated using the CINDY code.
11.3.2 Dose Coefficients Dose coefficients, expressed as committed dose equivalent per unit activity of intake (e.g., rem/nCi), are a convenient shortcut to estimating doses based on standard assumptions when the magnitude of an intake is known. Acute intake dose coefficients have been tabulated for selected exposure scenarios. The scenarios include the inhalation of 1-µm- and 5-µm-AMAD particles as the Hanford default and ICRP 66 default particle sizes, respectively, and ingestion. Chemical forms tabulated are the oxide forms, considered the most likely to be encountered. For all of these scenario condi-tions the most limiting dose coefficients are for the committed effective dose equivalent. Those dose coefficients are listed in Table 11.6.

PNNL-MA-860 Chapter 11.0 Issued: September 12, 2000 Page 11.6
Table 11.3. Whole Body Retention for 60Co
Days Post Intake
Inhalation 1-µµm-AMAD
Class Y
Inhalation 5-µµm-AMAD
Class Y Ingestion f1=0.05
0 6.3E-01 9.1E-01 1.0E+00 1 5.8E-01 8.0E-01 7.1E-01 2 4.2E-01 5.0E-01 3.3E-01 5 1.9E-01 1.1E-01 3.6E-02 7 1.7E-01 7.6E-02 1.9E-02
14 1.5E-01 6.5E-02 1.3E-02 30 1.5E-01 6.0E-02 8.9E-03 60 1.4E-01 5.6E-02 7.1E-03 90 1.4E-01 5.3E-02 6.2E-03
180 1.2E-01 4.6E-02 4.6E-03 365 9.4E-02 3.6E-02 3.3E-03 730 5.9E-02 2.2E-02 2.0E-03
1825 1.6E-02 6.2E-03 5.3E-04 3600 3.0E-03 1.1E-03 6.1E-05 7300 3.1E-04 1.1E-04 6.5E-07
18250 5.3E-06 1.9E-06 1.2E-12
Table 11.4. Whole Body Retention for 54Mn
Days Post Intake
Inhalation 1-µµm-AMAD
Class W
Inhalation 5-µµm-AMAD
Class W Ingestion
f1=0.1 0 6.3E-01 9.1E-01 1.0E+00 1 5.9E-01 8.2E-01 7.3E-01 2 4.6E-01 5.7E-01 3.8E-01 5 2.6E-01 2.3E-01 9.4E-02 7 2.3E-01 1.9E-01 7.3E-02
14 1.9E-01 1.5E-01 5.7E-02 30 1.5E-01 1.1E-01 3.9E-02 60 9.8E-02 6.7E-02 2.2E-02 90 6.3E-02 4.1E-02 1.2E-02
180 1.7E-02 9.2E-03 2.1E-03 365 1.2E-03 5.0E-04 5.6E-05 730 5.1E-06 1.9E-06 4.5E-08

Issued: September 12, 2000 PNNL-MA-860 Chapter 11.0 Page 11.7
Table 11.5. Whole Body Retention for 59Fe
Days Post Intake
Inhalation 1-µµm-AMAD
Class W
Inhalation 5-µµm-AMAD
Class W Ingestion
f1=0.1 0 6.3E-01 9.1E-01 1.0E+00 1 5.8E-01 8.2E-01 7.2E-01 2 4.6E-01 5.7E-01 3.7E-01 5 2.6E-01 2.5E-01 1.1E-01 7 2.3E-01 2.2E-01 9.2E-02
14 2.0E-01 1.9E-01 8.0E-02 30 1.5E-01 1.4E-01 6.2E-02 60 8.3E-02 8.7E-02 3.9E-02 90 4.8E-02 5.3E-02 2.4E-02
180 1.1E-02 1.2E-02 5.8E-03 365 5.4E-04 6.6E-04 3.1E-04 730 1.7E-06 2.1E-06 9.8E-07
Table 11.6. Dose Coefficients (he,50) for Corrosion Products (rem/nCi)
Radionuclide Inhalation
1-µµm-AMAD Inhalation
5-µµm-AMAD Ingestion
60Co 2.0E-04
(Class Y) 7.9E-05
(Class Y) 1.0E-05 (f1=0.05)
54Mn 6.0E-06
(Class W) 4.2E-06
(Class W) 2.1E-06 (f1=0.1)
59Fe 1.2E-05
(Class W) 1.0E-05
(Class W) 5.9E-06 (f1=0.1)
Organs of significance (i.e., those contributing greater than 10% of the committed effective dose equivalent) can be determined from the CINDY code based on actual intake assessment data.
11.3.3 Comparison of Published Dosimetry Factors A comparison of selected dosimetry factors for 60Co is shown in Table 11.7. Similar comparisons with 54Mn and 59Fe have been omitted because of the lack of a Hanford source for these materials at this time. Their potential interest is mainly of a historical nature.
11.3.4 Derived Reference Levels Derived reporting, investigation, and dose limit compliance levels (based on committed effective dose equivalents of 10-mrem, 100-mrem, and 5,000 mrem, respectively) have been calculated for

PNNL-MA-860 Chapter 11.0 Issued: September 12, 2000 Page 11.8
Table 11.7. Comparison of Dosimetric Factors for 60Co
Reference Source Class Y Inhalation
1-µµm-AMAD Class Y Inhalation
5-µµm-AMAD Soluble Ingestion
(f1 = 0.05) Dose Coefficients
CINDY [hE,50] 2.0E-04 mrem/nCi 5.4E-08 Sv/Bq
7.9E-05 rem/nCi 2.1E-08 Sv/Bq
1.0E-05 rem/nCi 2.7E-09 Sv/Bq
ICRP 54 [hE,50] 4.1E-08 Sv/Bq (1.5E-04 rem/nCi) NA NA
EPA Federal Guidance Report No.11 [hE,50]
5.91E-08 Sv/Bq (2.19E-04 rem/nCi) NA
7.28E-09 Sv/Bq (2.69E-05 rem/nCi)
ICRP 68 [e(50)]
2.9E-08 Sv/Bq (1.1E-04 rem/nCi) Type S
1.7E-08 Sv/Bq (6.3E-05 rem/nCi) Type S
2.5E-09 Sv/Bq (9.3E-06 rem/nCi)
Stochastic DAC
10 CFR 835, App. A 1E-08 µCi/ml and 5E+02 Bq/m3 NA NA
EPA Federal Guidance Report No. 11
1E-08 µCi/ml and 5E-04 MBq/m3 NA NA
ICRP 30, ICRP 54 5E+02 Bq/ m3 NA NA Stochastic Annual Limit on Intake, ALI Calculated from 10 CFR 835 DAC
19 µCi and 7.2E+05 Bq NA NA
ICRP 30 1E+06 Bq NA 1E+06 Bq ICRP 54 1E+06 Bq NA NA EPA Federal Guidance Report No. 11 1 MBq and 30 µCi NA 7 MBq and 200 µCi NA = not applicable
60Co oxides. These levels are shown in Table 11.8 for 1-µm-AMAD class Y inhalation, Table 11.9 for 5-µm-AMAD class Y inhalation, and Table 11.10 for ingestion.
11.4 Bioassay for Corrosion Products This section discusses the bioassay methods, capabilities, and protocols for corrosion products.
11.4.1 Bioassay Methods and Capabilities In vivo and excreta measurements are the bioassay methods used in monitoring for corrosion product radionuclides. All of the radio-nuclides included in this section are gamma-emitters and can be measured directly using in vivo techniques. Whole body counting, using either sodium-iodide or coaxial germanium detectors, is the in vivo technique typically applied for bioassay of these nuclides.

Issued: September 12, 2000 PNNL-MA-860 Chapter 11.0 Page 11.9
Table 11.8. 60Co Whole Body Reference Levels for 1-µm-AMAD Class Y Inhalation
10-mrem HE,50 Reporting Level
100-mrem HE,50
Investigation Level
5-rem HE,50 Compliance Level
Inhalation Intake (nCi) 5.0E+01 5.0E+02 2.5E+04
Days Post Intake
Derived Reporting Level
(nCi)
Derived Investigation Level (nCi)
Derived Compliance Level
(nCi) 0 3.2E+01 3.2E+02 1.6E+04 1 2.9E+01 2.9E+02 1.5E+04 2 2.1E+01 2.1E+02 1.1E+04 5 9.5E+00 9.5E+01 4.8E+03 7 8.5E+00 8.5E+01 4.3E+03
14 7.5E+00 7.5E+01 3.8E+03 30 7.5E+00 7.5E+01 3.8E+03 60 7.0E+00 7.0E+01 3.5E+03 90 7.0E+00 7.0E+01 3.5E+03
180 6.0E+00 6.0E+01 3.0E+03 365 4.7E+00 4.7E+01 2.4E+03 730 3.0E+00 3.0E+01 1.5E+03
1825 8.0E-01 8.0E+00 4.0E+02 3650 1.5E-01 1.5E+00 7.5E+01 7300 1.6E-02 1.6E-01 7.8E+00
18250 2.7E-04 2.7E-03 1.3E-01
Table 11.9. 60Co Whole Body Reference Levels for 5-µm-AMAD Class Y Inhalation
10-mrem HE,50 Reporting Level
100-mrem HE,50
Investigation Level
5-rem HE,50 Compliance Level
Inhalation Intake (nCi) 1.3E+02 1.3E+03 6.3E+04
Days Post Intake
Derived Reporting Level
(nCi)
Derived Investigation Level (nCi)
Derived Compliance Level
(nCi) 0 1.2E+02 1.2E+03 5.8E+04 1 1.0E+02 1.0E+03 5.1E+04 2 6.3E+01 6.3E+02 3.2E+04 5 1.4E+01 1.4E+02 7.0E+03 7 9.6E+00 9.6E+01 4.8E+03
14 8.2E+00 8.2E+01 4.1E+03 30 7.6E+00 7.6E+01 3.8E+03 60 7.1E+00 7.1E+01 3.5E+03 90 6.7E+00 6.7E+01 3.4E+03
180 5.8E+00 5.8E+01 2.9E+03 365 4.6E+00 4.6E+01 2.3E+03 730 2.8E+00 2.8E+01 1.4E+03
1825 7.8E-01 7.8E+00 3.9E+02 3650 1.4E-01 1.4E+00 7.0E+01 7300 1.4E-02 1.4E-01 7.0E+00
18250 2.4E-04 2.4E-03 1.2E-01

PNNL-MA-860 Chapter 11.0 Issued: September 12, 2000 Page 11.10
Table 11.10. 60Co Whole Body Reference Levels for Ingestion (f1 = 0.05)
10-mrem HE,50 Reporting Level
100-mrem HE,50
Investigation Level
5-rem HE,50 Compliance Level
Inhalation Intake (nCi) 1.0E+03 1.0E+04 5.0E+05
Days Post Intake Whole Body IRF
Derived Reporting Level
(nCi)
Derived Investigation Level (nCi)
Derived Compliance Level
(nCi) 0 1.0E+00 1.0E+03 1.0E+04 5.0E+05 1 7.1E-01 7.1E+02 7.1E+03 3.6E+05 2 3.3E-01 3.3E+02 3.3E+03 1.7E+05 5 3.6E-02 3.6E+01 3.6E+02 1.8E+04 7 1.9E-02 1.9E+01 1.9E+02 9.5E+03
14 1.3E-02 1.3E+01 1.3E+02 6.5E+03 30 8.9E-03 8.9E+00 8.9E+01 4.5E+03 60 7.1E-03 7.1E+00 7.1E+01 3.6E+03 90 6.2E-03 6.2E+00 6.2E+01 3.1E+03
180 4.6E-03 4.6E+00 4.6E+01 2.3E+03 365 3.3E-03 3.3E+00 3.3E+01 1.7E+03 730 2.0E-03 2.0E+00 2.0E+01 1.0E+03
1825 5.3E-04 5.3E-01 5.3E+00 2.7E+02 3650 6.1E-05 6.1E-02 6.1E-01 3.1E+01 7300 6.5E-07 6.5E-04 6.5E-03 3.3E-01
18250 1.2E-12 1.2E-09 1.2E-08 6.0E-07
Because the radionuclides are easily detectable using in vivo measurement, excreta measurements are not required in most intake situations, unless there is concern for other radionuclides such as strontium or plutonium, which are not readily measurable by in vivo techniques. Measurement of radionuclides in early fecal excretion can be used as a means for establishing the relative radionuclide distribution in a corrosion product mixture; however, analysis of a nasal or appropriate surface contamination smear sample is preferred if the elements present may exhibit different absorption characteristics in the GI tract. Tables 11.11, 11.12, and 11.13 describe the nominal Hanford minimum detectable intakes and minimum detectable committed effective dose equivalents for class Y inhalations and ingestion of 60Co. The MDAs associated with the Hanford bioassay measure-ments are below those routinely used at many nuclear power plant facilities. Thus, it is possible that corrosion product activity detected by baseline Hanford measurements can be related to previously undetected intakes performed at facilities with less-sensitive MDAs.

Issued: September 12, 2000 PNNL-MA-860 Chapter 11.0 Page 11.11
Table 11.11. 60Co Minimum Detectable Intakes and Doses (HE,50) for 1-µm-AMAD Class Y Inhalation
NaI System(a) Minimum Detectable
Coax Ge System(b) Minimum Detectable
Days Post Intake Intake (nCi) Dose (mrem)(c) Intake (nCi) Dose (mrem)(c)
0 2.1 0.4 1.0 0.2 1 2.2 0.4 1.0 0.2 2 3.1 0.6 1.4 0.3 5 6.8 1.4 3.2 0.6 7 7.6 1.5 3.5 0.7
14 8.7 1.7 4.0 0.8 30 8.7 1.7 4.0 0.8 60 9.3 1.9 4.3 0.9 90 9.3 1.9 4.3 0.9
180 11 2.2 5.0 1.0 365 14 2.8 6.4 1.3 730 22 4.4 10 2.0
1825 81 16 37 7.5 3600 430 87 200 40 7300 4200 840 1900 390
(a) Based on MDA of 1.3 nCi (b) Based on MDA of 0.6 nCi (c) Dose values less than 1 mrem are rounded to the nearest tenth.
Table 11.12. 60Co Minimum Detectable Intakes and Doses (HE,50) for 5-µm-AMAD Class Y Inhalation
NaI System(a) Minimum
Detectable Coax Ge System(b)
Minimum Detectable Days Post Intake Intake (nCi) Dose (mrem)(c) Intake (nCi) Dose (mrem)(c)
0 1.4 0.1 0.7 0.1 1 1.6 0.1 0.8 0.1 2 2.6 0.2 1.2 0.1 5 12 0.9 5.5 0.4 7 17 1.4 7.9 0.6
14 20 1.6 9.2 0.7 30 22 1.7 10 0.8 60 23 1.8 11 0.8 90 25 1.9 11 0.9
180 28 2.2 13 1.0 365 36 2.9 17 1.3 730 59 4.7 27 2.2
1825 210 17 97 7.6 3600 1200 93 550 43 7300 12,000 930 5500 430
(a) Based on MDA of 1.3 nCi (b) Based on MDA of 0.6 nCi (c) Dose values less than 1 mrem are rounded to the nearest tenth.

PNNL-MA-860 Chapter 11.0 Issued: September 12, 2000 Page 11.12
Table 11.13. 60Co Minimum Detectable Intakes and Doses (HE,50) for Ingestion(a)
NaI System(b) Minimum Detectable
Coax Ge System(c) Minimum Detectable
Days Post Intake Intake (nCi) Dose (mrem)(d) Intake (nCi) Dose (mrem)(d)
0 1.3 0.0 0.6 0.0 1 1.8 0.0 0.8 0.0 2 3.9 0.0 1.8 0.0 5 36 0.4 17 0.2 7 68 0.7 32 0.3
14 100 1.0 46 0.5 30 150 1.5 67 0.7 60 180 1.8 85 0.8 90 210 2.1 97 1.0
180 280 2.8 130 1.3 365 390 3.9 180 1.8 730 650 6.5 300 3.0
1825 2500 25 1100 11 3600 21,000 210 9800 98
(a) Based on f1 = 0.05. (b) Based on MDA of 1.3 nCi. (c) Based on MDA of 0.6 nCi. (d) Dose values less than 1 mrem are rounded to nearest tenth.
11.4.2 Routine Bioassay Monitoring Protocol
Routine monitoring for gamma-emitting corrosion products is best accomplished by periodic whole body counting. With 60Co as the predominant corrosion product, Tables 11.8 through 11.10 show that minimum detectable doses of 10 mrem can be achieved with annual whole body counts having an MDA of 3 nCi. Such an MDA is readily achievable with the Hanford preview counter—a standup NaI detector system. Definitive measurements using the coaxial germanium detector system are preferred for identification and quantification of gamma-emitting nuclides due to the much higher resolution of that system and a lower MDA. Consequently, initial detection of a gamma-emitter such as 60Co on the NaI system should be followed by a verification count on the coaxial germanium system, preferably immediately following the initial measurement, while the subject is still at the IVRRF. If, at very low indicated activities, a follow-up measurement is not obtained or a contractor wishes to waive the follow-up measurement, dose equivalents can be calculated based on the single initial count. Although the accuracy of a single count performed using the preview counter is somewhat less than that obtained using germanium detector systems, this higher uncertainty is not of much significance at low doses.

Issued: September 12, 2000 PNNL-MA-860 Chapter 11.0 Page 11.13
11.4.3 Special Monitoring for Suspected Intakes An in vivo examination should be performed following any indica-tion of an intake of activated corrosion product radionuclides. However, unless the intake appears to be of such a magnitude that medical treatment to aid removal of the material from the body is considered, the exam may be scheduled as convenient, within several days of the intake without significant loss of sensitivity to intake detection. All radionuclides potentially involved in the exposure should be considered during the follow-up investigation. The interpretation of in vivo measurements shortly after intake may be complicated by early transport of material through the lung and GI tract. Measurements performed after about 5 days post intake are more appropriate for dose evaluation. Long-term follow-up bioassay measurements should be considered to monitor internal radioactivity levels and establish individual-specific retention characteristics.
11.5 Assessment of Internal Dose The assessment of internal dose equivalent from corrosion products is accomplished by evaluating in vivo measurement results. Assess-ments of internal dose equivalents for intakes of mixtures of corrosion product radionuclides must consider the contribution of all radionuclides present in the mixture. The variability of the corrosion product mixtures and their change in composition with time due to radioactive decay precludes the establishment of a generic mixture. The committed effective dose equivalent is calculated for any intake confirmed by special bioassay measurements, and for periodic measurements that exceed the screening levels contained in the Hanford Internal Dosimetry Program Manual.(a) Committed dose equivalents to specific organs and tissues are determined based on the criteria also presented in the Hanford Internal Dosimetry Program Manual. Several methods exist to evaluate in vivo results in order to assess the internal dose equivalent. The simplest method, and the one recommended for initial evaluation of in vivo results, as well as for final evaluations when doses are low, involves fitting the in vivo measurement data to the expected internal activity using the biokinetic model prescribed by the ICRP in publication 30. This model is implemented using CINDY. Assumptions that are used for this evaluation are 1) that the material is in its most insoluble form; 2) that the intake date, if unknown, is assumed to be the midpoint of
(a) Pacific Northwest National Laboratory. 1999. Hanford Internal Dosimetry Program Manual.
PNL-MA-552, Richland, Washington. (Internal manual.) Available URL: http://www.pnl.gov/eshs/pub/pnnl552.htm

PNNL-MA-860 Chapter 11.0 Issued: September 12, 2000 Page 11.14
the period during which the intake could have occurred; and 3) that the intake consisted of inhalation of an aerosol with 1-µm-AMAD particles. Data fitting is performed using CINDY. Alternatively, a hand calculation can be performed using the factors tabulated in this chapter. If the intake could potentially result in a committed effective dose equivalent exceeding 100 mrem, then an investigation should be performed to determine the radionuclide composition of the involved corrosion product mixture and to assess the dose equivalent from all radionuclides present in the mixture. Additional in vivo measure-ments to confirm the assumed retention function, or to develop a case-specific retention function, should also be performed. Observed in vivo retention of corrosion product radionuclides should be used in place of the ICRP biokinetic model for evaluations of internal doses that potentially exceed 100 mrem or when sufficient in vivo data are available for such an analysis. This can be accomplish-ed by modifying distribution and retention parameters in CINDY to achieve better agreement between the model and the observed in vivo measurement data. Modifications to default model parameters must be documented in the internal dose assessment report.
11.6 Management of Internal Contamination Cases Historically, during reactor operations, activated corrosion product radionuclides were the most common type of internal exposure at Hanford. However, exposures were minor and there is no known instance in which special therapeutic measures were applied for mitigative purposes. Various options exist for treatment to remove corrosion product radionuclides from the body. These generally involve measures to minimize absorption into the blood, including stomach lavage and administration of purgatives, emetics, or phytates. Use of chelating agents may also be considered in signifi-cant exposure cases. A primary consideration for all mitigatory actions is prompt response because the effectiveness of treatment decreases rapidly with time post intake. Occupational Medicine at HEHF should be notified immediately upon indication of a severe intake of corrosion product radionuclides.

Issued: September 12, 2000 PNNL-MA-860 Chapter 11.0 Page 11.15
11.7 References 10 CFR 835. 1998. U.S. Department of Energy. “Occupational Radiation Protection.” U.S. Code of Federal Regulations. International Commission on Radiological Protection (ICRP). 1979. “Limits for intakes of radionuclides by workers.” (ICRP publication 30, part 1). Annals of the ICRP, 2:3-4, Pergamon Press, New York. International Commission on Radiological Protection (ICRP). 1980. “Limits for intakes of radionuclides by workers.” (ICRP publication 30, part 2). Annals of the ICRP, 4:3-4, Pergamon Press, New York. International Commission on Radiological Protection (ICRP). 1988. “Individual monitoring for intakes of radionuclides by workers: Design and interpretation.” (ICRP publication 54). Annals of the ICRP, 19:1-3, Pergamon Press, New York. International Commission on Radiological Protection (ICRP). 1993. “Age-dependent doses to members of the public from intake of radionuclides: Part 2 ingestion dose coefficients.” (ICRP publication 67). Annals of the ICRP, 23:3-4, Pergamon Press, New York. International Commission on Radiological Protection (ICRP). 1994a. “Human respiratory tract model for radiological protection.” (ICRP publication 66). Annals of the ICRP, 24:1-3, Pergamon Press, New York. International Commission on Radiological Protection (ICRP). 1994b. “Dose coefficients for intakes of radionuclides by workers.” (ICRP publication 68). Annals of the ICRP, 24:4, Pergamon Press, New York. International Commission on Radiological Protection (ICRP). 1997. “Individual monitoring for internal exposure of workers.” (ICRP publication 78). Annals of the ICRP, 27:3-4, Pergamon Press, New York. Strenge, D. L., R. A. Kennedy, M. J. Sula, and J. R. Johnson. 1992. Code for Internal Dosimetry (Cindy Version 1.2), Part 1: Conceptual Representation. PNL-7493 Pt. 1, Rev. 1, Pacific Northwest National Laboratory, Richland, Washington.

PNNL-MA-860 Chapter 11.0 Issued: September 12, 2000 Page 11.16
U.S. Environmental Protection Agency (EPA). 1988. Limiting Values of Radionuclide Intake and Air Concentration and Dose Conversion Factors for Inhalation, Submersion, and Ingestion. Federal Guidance Report No. 11, EPA-520/1-88-020, Washington, D.C. Weetman, R. A., and H. W. DeHaven. 1982a. Characterization of Airborne Radionuclides in UNC Facilities. UNI-2164, UNC Nuclear Industries, Richland, Washington. Weetman, R. A., and H. W. DeHaven. 1982b. Characterization of Surface Contamination in UNC Facilities. UNI-2137, UNC Nuclear Industries, Richland, Washington.

Issued: September 12, 2000 PNNL-MA-860 Chapter 12.0 Page 12.1
12.0 Iodine
Radioiodines generated or used at Hanford have included isotopes with half-lives ranging from minutes to millions of years in various physical and chemical forms. With the time that has elapsed since operation of Hanford production reactors and the FFTF, the short-lived radioiodines have all decayed away, leaving only 129I as a waste contaminant. Laboratory use of short-lived radioiodines may still occur. This chapter provides information on the sources, characteris-tics, and biokinetics of radioiodine and summarizes the technical basis used for its internal dosimetry at Hanford.
12.1 Sources and Characteristics of Radioiodine
At Hanford the radioiodines of principal interest are 131I, associated with reactor operations, 129I, associated with waste management, and 125I, associated with biological experimentation. Radiological decay data for these nuclides are shown in Table 12.1.
Table 12.1. Radiological Data for Radioiodines
Isotope Half-Life Decay
Constant Specific
Activity (Ci/g) 131I 8.0 d 8.7E-02 d-1 1.24E+05 129I 1.57E+07 y 4.4E-8 y-1 1.76E-04 125I 60 d 1.2E-02 d-1 1.73E+04
Historically, radioiodines were generated in large quantities during the operation of production and research reactors, however with those reactors either permanently shut down or in long-term standby, the only current source of onsite fission product radioiodine at Hanford is the Energy Northwest power reactor, Columbia Generating Station. Iodine-131 is considered the most significant radioiodine from an internal exposure standpoint. Several other radioactive isotopes of iodine are generated by the fission process; however, with the exception of the long-lived 129I, the others are short-lived and of potential interest only during or within several days of reactor operation. Iodine-129 has, for practical purposes, an infinite half-life and is contained in irradiated fuel and associated separations and waste management facilities. However, unless concentrated by some means such as in the PUREX air treatment system, it is present in negligibly small quantities.

PNNL-MA-860 Chapter 12.0 Issued: September 12, 2000 Page 12.2
The main source for 131I, which has been measured in Hanford workers in recent years, has been nonoccupational medical administrations for either diagnostic or therapeutic purposes. Patients receiving such administrations lose 131I by normal pathways including urine excretion and exhalation. The magnitude of medical administrations can easily result in small quantities of 131I being absorbed by caregivers, family members, or those in close contact with patients, even after patients are released from a hospital. Iodine-125 is not generated at Hanford, but it is purchased for use in various biological research experiments. Thus, its use is generally limited to biology laboratories operated by PNNL. Quantities of the isotope in use at one time are generally limited to amounts that could not result in significant internal exposures.
12.2 Biokinetic Behavior
The distribution and retention models described in ICRP 30 (1979) and ICRP 54 (1988) are used by Hanford to predict the uptake, retention, and resulting doses following an intake of a radioiodine.
12.2.1 Transportability Class In its publication 30, the ICRP assigned inhalation class D to all forms of iodine, and this category is used for Hanford dosimetry. A new respiratory tract model (ICRP 1994a) established lung absorption types as a replacement for the inhalation class of ICRP 30. The more recent ICRP publications 68 (1994b) and 78 (1997) assign absorption type F to all iodine compounds except elemental iodine vapor, which is assigned absorption class SR-1. The use of the SR-1 class would result in a 100% respiratory tract deposition and uptake of iodine from an inhalation intake instead of the 63% described by ICRP 30. These more recent concepts are not adopted at this time, awaiting suitable analytical tools for Hanford data analysis.
12.2.2 Gastrointestinal Uptake to Blood (f1 Factor) The gastrointestinal uptake (f1) factor for all forms of iodine is 1.0. This value is the same for ICRP 30 and 54 models, and the more recent ICRP 67 (1993), 68, and 78 models.
12.2.3 Biokinetic Model The ICRP 30 and 54 metabolic model describes the deposition and retention of iodine in systemic compartments of the body and is

Issued: September 12, 2000 PNNL-MA-860 Chapter 12.0 Page 12.3
essentially the same model described by Riggs (1952). Of the iodine entering the systemic compartment, a fraction, 0.3, is assumed to be translocated to the thyroid, while the remainder (0.7) is assumed to go directly to excretion. Iodine in the thyroid is assumed to be retained with a biological half-life of 80 days and to be lost from the thyroid in the form of organic iodine. Organic iodine is assumed to be uniformly distributed among all organs and tissues of the body other than the thyroid and to be retained there with a biological half-life of 12 days. One-tenth of this organic iodine is then assumed to go directly to fecal excretion and the rest is assumed to be returned to the transfer compartment as inorganic iodine. This recycling to the transfer compartment gives an effective (i.e., apparent) half-life in the thyroid of 120 days. The above model was implemented using the computer code CINDY (Strenge et al. 1992). For simplicity, ICRP 54 (1988) provides a thyroid retention function that effectively provides expected thyroid quantities following uptake, and that can be easily incorporated into hand calculations:
120/t693.011/t693.024.0/t693.0thyroid e31.0e018.0e33.0)t(R −−− ++= (12.1)
where t is in days post uptake. For class D material, translocation from the lung to the blood is rapid and the above equation will provide an accurate thyroid retention value for the model after several days following acute inhalation.
12.3 Internal Dosimetry Factors for Radioiodines This section contains factors that are useful in making internal dosimetry calculations. The factors are derived from the CINDY code and incorporate the models and assumptions of the preceding sections. Their application is intended for circumstances where such assumptions are appropriate or more specific information is lacking. Variation from these factors is appropriate if sufficient data are available.
12.3.1 Retention and Excretion of Radioiodine Retention and excretion fractions can be readily calculated using the CINDY code. Factors for the total body, thyroid, and urine have been calculated based on ingestion and inhalation of 1-µm- and 5-µm-AMAD particles. These factors are shown in Table 12.2 for 131I, Table 12.3 for 129I, and Table 12.4 for 125I. Because the GI tract uptake factor is 1.0, the ingestion-based retention and excretion fractions can be used to approximate an injection (wound) intake.
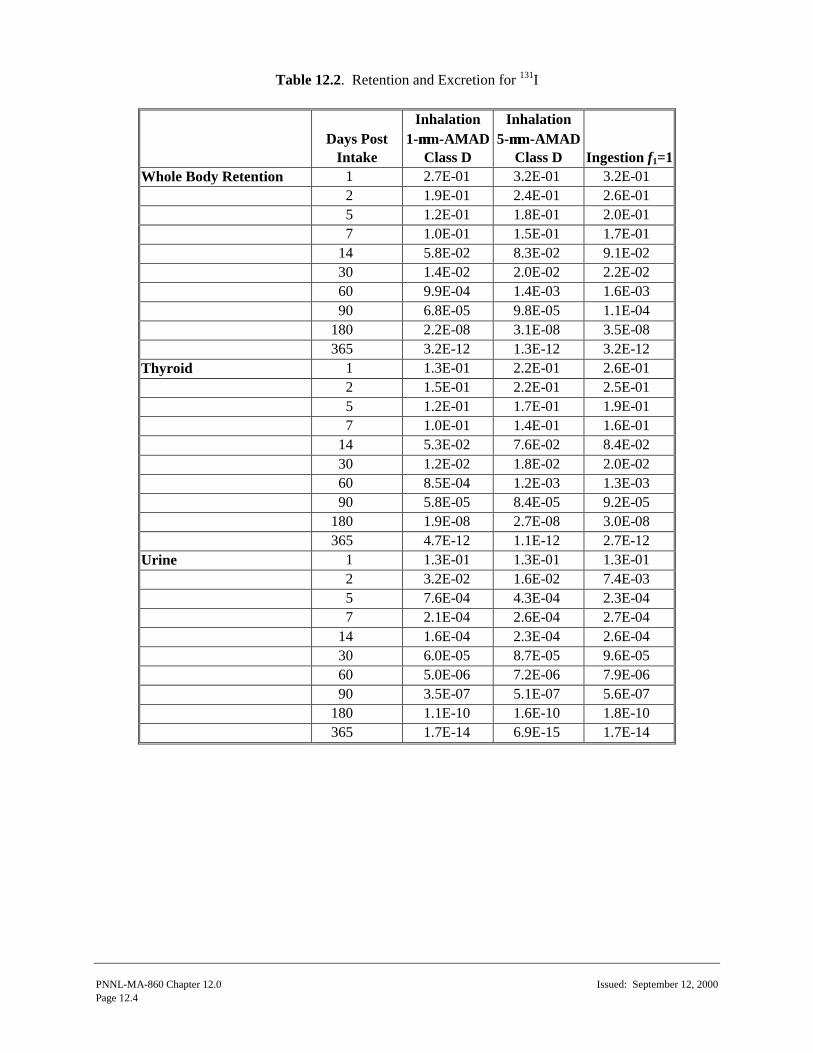
PNNL-MA-860 Chapter 12.0 Issued: September 12, 2000 Page 12.4
Table 12.2. Retention and Excretion for 131I
Days Post
Intake
Inhalation 1-µµm-AMAD
Class D
Inhalation 5-µµm-AMAD
Class D Ingestion f1=1 Whole Body Retention 1 2.7E-01 3.2E-01 3.2E-01
2 1.9E-01 2.4E-01 2.6E-01 5 1.2E-01 1.8E-01 2.0E-01 7 1.0E-01 1.5E-01 1.7E-01 14 5.8E-02 8.3E-02 9.1E-02 30 1.4E-02 2.0E-02 2.2E-02 60 9.9E-04 1.4E-03 1.6E-03 90 6.8E-05 9.8E-05 1.1E-04 180 2.2E-08 3.1E-08 3.5E-08 365 3.2E-12 1.3E-12 3.2E-12
Thyroid 1 1.3E-01 2.2E-01 2.6E-01 2 1.5E-01 2.2E-01 2.5E-01 5 1.2E-01 1.7E-01 1.9E-01 7 1.0E-01 1.4E-01 1.6E-01 14 5.3E-02 7.6E-02 8.4E-02 30 1.2E-02 1.8E-02 2.0E-02 60 8.5E-04 1.2E-03 1.3E-03 90 5.8E-05 8.4E-05 9.2E-05 180 1.9E-08 2.7E-08 3.0E-08 365 4.7E-12 1.1E-12 2.7E-12
Urine 1 1.3E-01 1.3E-01 1.3E-01 2 3.2E-02 1.6E-02 7.4E-03 5 7.6E-04 4.3E-04 2.3E-04 7 2.1E-04 2.6E-04 2.7E-04 14 1.6E-04 2.3E-04 2.6E-04 30 6.0E-05 8.7E-05 9.6E-05 60 5.0E-06 7.2E-06 7.9E-06 90 3.5E-07 5.1E-07 5.6E-07 180 1.1E-10 1.6E-10 1.8E-10 365 1.7E-14 6.9E-15 1.7E-14

Issued: September 12, 2000 PNNL-MA-860 Chapter 12.0 Page 12.5
Table 12.3. Retention and Excretion for 129I
Days Post
Intake
Inhalation 1-µµm-AMAD
Class D
Inhalation 5-µµm-AMAD
Class D Ingestion f1=1 Whole Body Retention 1 3.0E-01 3.4E-01 3.5E-01
2 2.2E-01 2.9E-01 3.0E-01 5 1.9E-01 2.7E-01 3.0E-01 7 1.9E-01 2.7E-01 3.0E-01 14 1.8E-01 2.7E-01 2.9E-01 30 1.7E-01 2.5E-01 2.7E-01 60 1.5E-01 2.1E-01 2.3E-01 90 1.2E-01 1.8E-01 1.9E-01 180 7.1E-02 1.0E-01 1.1E-01 365 2.3E-02 3.3E-02 3.7E-02 730 2.5E-03 3.6E-03 4.0E-03
Thyroid 1 1.4E-01 2.4E-01 2.8E-01 2 1.7E-01 2.6E-01 2.9E-01 5 1.8E-01 2.6E-01 2.9E-01 7 1.8E-01 2.6E-01 2.8E-01 14 1.7E-01 2.4E-01 2.7E-01 30 1.5E-01 2.2E-01 2.4E-01 60 1.3E-01 1.8E-01 2.0E-01 90 1.0E-01 1.5E-01 1.7E-01 180 6.2E-02 8.7E-02 9.6E-02 365 2.0E-02 2.8E-02 3.1E-02 730 2.1E-03 3.1E-03 3.4E-03
Urine 1 1.3E-01 1.4E-01 1.4E-01 2 3.7E-02 1.9E-02 8.7E-03 5 1.1E-03 6.5E-04 3.5E-04 7 3.7E-04 4.6E-04 4.8E-04 14 5.1E-04 7.5E-04 8.3E-04 30 7.3E-04 1.1E-03 1.2E-03 60 7.4E-04 1.1E-03 1.2E-03 90 6.4E-04 9.2E-04 1.0E-03 180 3.7E-04 5.3E-04 5.9E-04 365 1.2E-04 1.7E-04 1.9E-04 730 1.3E-05 1.9E-05 2.1E-05

PNNL-MA-860 Chapter 12.0 Issued: September 12, 2000 Page 12.6
Table 12.4. Retention and Excretion for 125I
Days Post
Intake
Inhalation 1-µµm-AMAD
Class D
Inhalation 5-µµm-AMAD
Class D Ingestion f1=1 Whole Body Retention 1 2.9E-01 3.4E-01 3.5E-01
2 2.1E-01 2.8E-01 3.0E-01 5 1.8E-01 2.6E-01 2.8E-01 7 1.7E-01 2.5E-01 2.8E-01 14 1.6E-01 2.3E-01 2.5E-01 30 1.2E-01 1.8E-01 1.9E-01 60 7.3E-02 1.1E-01 1.2E-01 90 4.4E-02 6.3E-02 6.9E-02 180 9.0E-03 1.3E-02 1.4E-02 365 3.5E-04 5.0E-04 5.6E-04
Thyroid 1 1.4E-01 2.4E-01 2.7E-01 2 1.7E-01 2.6E-01 2.9E-01 5 1.7E-01 2.5E-01 2.7E-01 7 1.7E-01 2.4E-01 2.6E-01 14 1.4E-01 2.1E-01 2.3E-01 30 1.1E-01 1.6E-01 1.7E-01 60 6.3E-02 9.1E-02 1.0E-01 90 3.7E-02 5.4E-02 5.9E-02 180 7.7E-03 1.1E-02 1.2E-02 365 3.0E-04 4.3E-04 4.7E-04
Urine 1 1.4E-01 1.4E-01 1.4E-01 2 3.6E-02 1.9E-02 8.5E-03 5 1.1E-03 6.1E-04 3.3E-04 7 3.4E-04 4.3E-04 4.5E-04 14 4.4E-04 6.4E-04 7.1E-04 30 5.2E-04 7.5E-04 8.3E-04 60 3.7E-04 5.3E-04 5.9E-04 90 2.3E-04 3.3E-04 3.6E-04 180 4.7E-05 6.8E-05 7.2E-05 365 1.8E-06 2.6E-06 2.9E-06

Issued: September 12, 2000 PNNL-MA-860 Chapter 12.0 Page 12.7
12.3.2 Dose Coefficients Dose coefficients, expressed as committed dose equivalent per unit activity of intake (e.g., rem/nCi), are a convenient shortcut for estimating doses based on standard assumptions when the magnitude of an intake is known. Acute intake dose coefficients have been calculated using CINDY and are tabulated for selected exposure scenarios in Table 12.5.
Table 12.5. Committed Dose Coefficients for Radioiodines (rem/nCi)
Class D Inhalation Radionuclide Organ 1-µµm-AMAD 5-µµm-AMAD
Ingestion f1 = 1
131I Effective 3.1E-05 4.5E-05 4.9E-05 Thyroid 1.0E-03 1.5E-03 1.6E-03
129I Effective 1.6E-04 2.2E-04 2.5E-04 Thyroid 5.2E-03 7.5E-03 8.2E-03
125I Effective 2.2E-05 3.2E-05 3.6E-05 Thyroid 7.4E-04 1.1E-03 1.2E-03 The thyroid is the principally exposed organ following an intake of radioiodine and can be considered to be the only organ contributing to the effective dose equivalent for radioiodines. Because of the low weighting factor for the thyroid (wt = 0.03), the limiting dose from a regulatory standpoint is the nonstochastic limit of 50 rem/yr.
12.3.3 Comparison of Published Dosimetry Factors A comparison of selected dosimetry factors for 131I (as the most common radioiodine) is shown in Table 12.6.
12.3.4 Derived Reference Levels Derived reporting and investigation levels (based on committed effective dose equivalents of 10 mrem and 100 mrem, respectively) and dose limit compliance levels (based on 50 rem to the thyroid) have been derived for inhalation of class D 1-µm- and 5-µm-AMAD particles, and for ingestion. Tabulations are provided in Table 12.7 for 131I, Table 12.8 for 129I, and Table 12.9 for 125I. Examination of these tables shows that for each of the three nuclides, the value of each bioassay considered (whole body, thyroid, urine) is similar after a few days, regardless of the type of intake. Thus, from a practical standpoint, the derived reference levels for a 1-µm inhalation, a 5-µm inhalation, and an ingestion are sufficiently close to suggest that a single value can be used for any of them. For purposes of

PNNL-MA-860 Chapter 12.0 Issued: September 12, 2000 Page 12.8
Table 12.6. Comparison of Dosimetric Factors for Soluble 131I
Reference Source Class D Inhalation
1-µµm-AMAD Class D Inhalation
5-µµm-AMAD Soluble Ingestion
f1 = 1 Dose Coefficients Effective CINDY [hE,50] 3.1E-05 rem/nCi 4.5E-05 rem/nCi 4.9E-05 rem/nCi
ICRP 54 [hE,50] 8.8E-09 Sv/Bq (3.3E-05 rem/nCi) NA NA
EPA Federal Guidance Report No. 11 [hE,50]
8.89E-09 Sv/Bq (3.29E-05 rem/nCi) NA
1.44E-08 Sv/Bq (5.33E-05 rem/nCi)
ICRP 68 [e(50)] 7.6E-09 Sv/Bq (2.8E-05 rem/nCi)
1.1E-08 Sv/Bq (4.1E-05 rem/nCi)
2.2E-08 Sv/Bq (8.1E-05 rem/nCi)
Thyroid CINDY [hE,50] 1.0E-03 rem/nCi 1.5E-03 rem/nCi 1.6E-03 rem/nCi
ICRP 54 [hE,50] 2.9E-07 Sv/Bq (1.1E-03 rem/nCi) NA NA
EPA Federal Guidance Report No. 11 [hE,50]
2.92E-07 Sv/Bq (1.08E-03 rem/nCi) NA
4.76E-07 Sv/Bq (1.76E-03 rem/nCi)
DAC (Thyroid)
10 CFR 835, App. A 2E-08 µCi/ml and 7E+02 Bq/m3 NA NA
EPA Federal Guidance Report No. 11
2E-08 µCi/ml and 7E-04 MBq/m3 NA NA
ICRP 30, ICRP 54 7E+02 Bq/m3 NA NA Annual Limit on Intake, ALI (Thyroid) Calculated from 10 CFR 835 DAC
48 µCi and 1.7E+06 Bq NA NA
ICRP 30 2E+06 Bq NA 1E+06 Bq EPA Federal Guidance Report No. 11 2 MBq and 50 µCi NA 1 MBq and 30 µCi NA = not applicable

Issued: September 12, 2000
PN
NL-M
A-860 C
hapter 12.0
Page 12.9
Table 12.7. Reference Levels and Derived Reference Levels for 131I
10-mrem HE,50 Reporting Level 100-mrem HE,50 Investigation Level 50-mrem Ht,50 Compliance Level
Days Post Intake 1-µµm
Inhalation 5-µµm
Inhalation Ingestion 1-µµm
Inhalation 5-µµm
Inhalation Ingestion 1-µµm
Inhalation 5-µµm
Inhalation Ingestion Intake (nCi) 3.2E+02 2.2E+02 2.0E+02 3.2E+03 2.2E+03 2.0E+03 5.0E+04 3.3E+04 3.1E+04 Whole Body Count Bioassay (nCi)
1 8.7E+01 7.1E+01 6.5E+01 8.7E+02 7.1E+02 6.5E+02 1.4E+04 1.1E+04 1.0E+04 2 6.1E+01 5.3E+01 5.3E+01 6.1E+02 5.3E+02 5.3E+02 9.5E+03 8.0E+03 8.1E+03 5 3.9E+01 4.0E+01 4.1E+01 3.9E+02 4.0E+02 4.1E+02 6.0E+03 6.0E+03 6.3E+03 7 3.2E+01 3.3E+01 3.5E+01 3.2E+02 3.3E+02 3.5E+02 5.0E+03 5.0E+03 5.3E+03
14 1.9E+01 1.8E+01 1.9E+01 1.9E+02 1.8E+02 1.9E+02 2.9E+03 2.8E+03 2.8E+03 30 4.5E+00 4.4E+00 4.5E+00 4.5E+01 4.4E+01 4.5E+01 7.0E+02 6.7E+02 6.9E+02 60 3.2E-01 3.1E-01 3.3E-01 3.2E+00 3.1E+00 3.3E+00 5.0E+01 4.7E+01 5.0E+01 90 2.2E-02 2.2E-02 2.2E-02 2.2E-01 2.2E-01 2.2E-01 3.4E+00 3.3E+00 3.4E+00
180 7.1E-06 6.9E-06 7.1E-06 7.1E-05 6.9E-05 7.1E-05 1.1E-03 1.0E-03 1.1E-03 365 1.0E-09 2.9E-10 6.5E-10 1.0E-08 2.9E-09 6.5E-09 1.6E-07 4.3E-08 1.0E-07
Thyroid Count Bioassay (nCi) 1 4.2E+01 4.9E+01 5.3E+01 4.2E+02 4.9E+02 5.3E+02 6.5E+03 7.3E+03 8.1E+03 2 4.8E+01 4.9E+01 5.1E+01 4.8E+02 4.9E+02 5.1E+02 7.5E+03 7.3E+03 7.8E+03 5 3.9E+01 3.8E+01 3.9E+01 3.9E+02 3.8E+02 3.9E+02 6.0E+03 5.7E+03 5.9E+03 7 3.2E+01 3.1E+01 3.3E+01 3.2E+02 3.1E+02 3.3E+02 5.0E+03 4.7E+03 5.0E+03
14 1.7E+01 1.7E+01 1.7E+01 1.7E+02 1.7E+02 1.7E+02 2.7E+03 2.5E+03 2.6E+03 30 3.9E+00 4.0E+00 4.1E+00 3.9E+01 4.0E+01 4.1E+01 6.0E+02 6.0E+02 6.3E+02 60 2.7E-01 2.7E-01 2.7E-01 2.7E+00 2.7E+00 2.7E+00 4.3E+01 4.0E+01 4.1E+01 90 1.9E-02 1.9E-02 1.9E-02 1.9E-01 1.9E-01 1.9E-01 2.9E+00 2.8E+00 2.9E+00
180 6.1E-06 6.0E-06 6.1E-06 6.1E-05 6.0E-05 6.1E-05 9.5E-04 9.0E-04 9.4E-04 365 1.5E-09 2.4E-10 5.5E-10 1.5E-08 2.4E-09 5.5E-09 2.4E-07 3.7E-08 8.4E-08
Urine Bioassay (dmp/d) 1 9.3E+04 6.4E+04 5.9E+04 9.3E+05 6.4E+05 5.9E+05 1.4E+07 9.6E+06 9.0E+06 2 2.3E+04 7.9E+03 3.4E+03 2.3E+05 7.9E+04 3.4E+04 3.6E+06 1.2E+06 5.1E+05 5 5.4E+02 2.1E+02 1.0E+02 5.4E+03 2.1E+03 1.0E+03 8.4E+04 3.2E+04 1.6E+04 7 1.5E+02 1.3E+02 1.2E+02 1.5E+03 1.3E+03 1.2E+03 2.3E+04 1.9E+04 1.9E+04
14 1.1E+02 1.1E+02 1.2E+02 1.1E+03 1.1E+03 1.2E+03 1.8E+04 1.7E+04 1.8E+04 30 4.3E+01 4.3E+01 4.3E+01 4.3E+02 4.3E+02 4.3E+02 6.7E+03 6.4E+03 6.7E+03 60 3.6E+00 3.6E+00 3.6E+00 3.6E+01 3.6E+01 3.6E+01 5.6E+02 5.3E+02 5.5E+02 90 2.5E-01 2.5E-01 2.5E-01 2.5E+00 2.5E+00 2.5E+00 3.9E+01 3.8E+01 3.9E+01
180 7.9E-05 7.9E-05 8.2E-05 7.9E-04 7.9E-04 8.2E-04 1.2E-02 1.2E-02 1.2E-02 365 1.2E-08 3.4E-09 7.7E-09 1.2E-07 3.4E-08 7.7E-08 1.9E-06 5.1E-07 1.2E-06

NN
L-MA
-860 Chapter 12.0
Issued: Septem
ber 12, 2000 Page 12.10
Table 12.8. Reference Levels and Derived Reference Levels for 129I
10-mrem HE,50 Reporting Level 100-mrem HE,50 Investigation Level 50-mrem Ht,50 Compliance Level
Days Post Intake 1-µµm
Inhalation 5-µµm
Inhalation Ingestion 1-µµm
Inhalation 5-µµm
Inhalation Ingestion 1-µµm
Inhalation 5-µµm
Inhalation Ingestion Intake (nCi) 6.3E+01 4.5E+01 4.0E+01 6.3E+02 4.5E+02 4.0E+02 9.6E+03 6.7E+03 6.1E+03 Whole Body Count Bioassay (nCi)
1 1.9E+01 1.5E+01 1.4E+01 1.9E+02 1.5E+02 1.4E+02 2.9E+03 2.3E+03 2.1E+03 2 1.4E+01 1.3E+01 1.2E+01 1.4E+02 1.3E+02 1.2E+02 2.1E+03 1.9E+03 1.8E+03 5 1.2E+01 1.2E+01 1.2E+01 1.2E+02 1.2E+02 1.2E+02 1.8E+03 1.8E+03 1.8E+03 7 1.2E+01 1.2E+01 1.2E+01 1.2E+02 1.2E+02 1.2E+02 1.8E+03 1.8E+03 1.8E+03
14 1.1E+01 1.2E+01 1.2E+01 1.1E+02 1.2E+02 1.2E+02 1.7E+03 1.8E+03 1.8E+03 30 1.1E+01 1.1E+01 1.1E+01 1.1E+02 1.1E+02 1.1E+02 1.6E+03 1.7E+03 1.6E+03 60 9.4E+00 9.5E+00 9.2E+00 9.4E+01 9.5E+01 9.2E+01 1.4E+03 1.4E+03 1.4E+03 90 7.5E+00 8.2E+00 7.6E+00 7.5E+01 8.2E+01 7.6E+01 1.2E+03 1.2E+03 1.2E+03
180 4.4E+00 4.5E+00 4.4E+00 4.4E+01 4.5E+01 4.4E+01 6.8E+02 6.7E+02 6.7E+02 365 1.4E+00 1.5E+00 1.5E+00 1.4E+01 1.5E+01 1.5E+01 2.2E+02 2.2E+02 2.3E+02
Thyroid Count Bioassay (nCi) 1 8.8E+00 1.1E+01 1.1E+01 8.8E+01 1.1E+02 1.1E+02 1.3E+03 1.6E+03 1.7E+03 2 1.1E+01 1.2E+01 1.2E+01 1.1E+02 1.2E+02 1.2E+02 1.6E+03 1.7E+03 1.8E+03 5 1.1E+01 1.2E+01 1.2E+01 1.1E+02 1.2E+02 1.2E+02 1.7E+03 1.7E+03 1.8E+03 7 1.1E+01 1.2E+01 1.1E+01 1.1E+02 1.2E+02 1.1E+02 1.7E+03 1.7E+03 1.7E+03
14 1.1E+01 1.1E+01 1.1E+01 1.1E+02 1.1E+02 1.1E+02 1.6E+03 1.6E+03 1.6E+03 30 9.4E+00 1.0E+01 9.6E+00 9.4E+01 1.0E+02 9.6E+01 1.4E+03 1.5E+03 1.5E+03 60 8.1E+00 8.2E+00 8.0E+00 8.1E+01 8.2E+01 8.0E+01 1.3E+03 1.2E+03 1.2E+03 90 6.3E+00 6.8E+00 6.8E+00 6.3E+01 6.8E+01 6.8E+01 9.6E+02 1.0E+03 1.0E+03
180 3.8E+00 4.0E+00 3.8E+00 3.8E+01 4.0E+01 3.8E+01 5.9E+02 5.8E+02 5.9E+02 365 1.3E+00 1.3E+00 1.2E+00 1.3E+01 1.3E+01 1.2E+01 1.9E+02 1.9E+02 1.9E+02
Urine Bioassay (dmp/d) 1 1.9E+04 1.4E+04 1.2E+04 1.9E+05 1.4E+05 1.2E+05 3.0E+06 2.1E+06 1.9E+06 2 5.1E+03 1.9E+03 7.7E+02 5.1E+04 1.9E+04 7.7E+03 7.9E+05 2.8E+05 1.2E+05 5 1.5E+02 6.6E+01 3.1E+01 1.5E+03 6.6E+02 3.1E+02 2.3E+04 9.6E+03 4.7E+03 7 5.1E+01 4.6E+01 4.3E+01 5.1E+02 4.6E+02 4.3E+02 7.9E+03 6.8E+03 6.5E+03
14 7.1E+01 7.6E+01 7.4E+01 7.1E+02 7.6E+02 7.4E+02 1.1E+04 1.1E+04 1.1E+04 30 1.0E+02 1.1E+02 1.1E+02 1.0E+03 1.1E+03 1.1E+03 1.6E+04 1.6E+04 1.6E+04 60 1.0E+02 1.1E+02 1.1E+02 1.0E+03 1.1E+03 1.1E+03 1.6E+04 1.6E+04 1.6E+04 90 8.9E+01 9.3E+01 8.9E+01 8.9E+02 9.3E+02 8.9E+02 1.4E+04 1.4E+04 1.4E+04
180 5.1E+01 5.3E+01 5.2E+01 5.1E+02 5.3E+02 5.2E+02 7.9E+03 7.8E+03 8.0E+03 365 1.7E+01 1.7E+01 1.7E+01 1.7E+02 1.7E+02 1.7E+02 2.6E+03 2.5E+03 2.6E+03

Issued: September 12, 2000
PN
NL-M
A-860 C
hapter 12.0
Page 12.11
Table 12.9. Reference Levels and Derived Reference Levels for 125I
10-mrem HE,50 Reporting Level 100-mrem HE,50 Investigation Level 50-mrem Ht,50 Compliance Level
Days Post Intake 1-µµm
Inhalation 5-µµm
Inhalation Ingestion 1-µµm
Inhalation 5-µµm
Inhalation Ingestion 1-µµm
Inhalation 5-µµm
Inhalation Ingestion Intake (nCi) 4.5E+02 3.1E+02 2.8E+02 4.5E+03 3.1E+03 2.8E+03 6.8E+04 4.5E+04 4.2E+04 Whole Body Count Bioassay (nCi)
1 1.3E+02 1.1E+02 9.7E+01 1.3E+03 1.1E+03 9.7E+02 2.0E+04 1.5E+04 1.5E+04 2 9.5E+01 8.8E+01 8.3E+01 9.5E+02 8.8E+02 8.3E+02 1.4E+04 1.3E+04 1.3E+04 5 8.2E+01 8.1E+01 7.8E+01 8.2E+02 8.1E+02 7.8E+02 1.2E+04 1.2E+04 1.2E+04 7 7.7E+01 7.8E+01 7.8E+01 7.7E+02 7.8E+02 7.8E+02 1.1E+04 1.1E+04 1.2E+04
14 7.3E+01 7.2E+01 6.9E+01 7.3E+02 7.2E+02 6.9E+02 1.1E+04 1.0E+04 1.0E+04 30 5.5E+01 5.6E+01 5.3E+01 5.5E+02 5.6E+02 5.3E+02 8.1E+03 8.2E+03 7.9E+03 60 3.3E+01 3.4E+01 3.3E+01 3.3E+02 3.4E+02 3.3E+02 4.9E+03 5.0E+03 5.0E+03 90 2.0E+01 2.0E+01 1.9E+01 2.0E+02 2.0E+02 1.9E+02 3.0E+03 2.9E+03 2.9E+03
180 4.1E+00 4.1E+00 3.9E+00 4.1E+01 4.1E+01 3.9E+01 6.1E+02 5.9E+02 5.8E+02 365 1.6E-01 1.6E-01 1.6E-01 1.6E+00 1.6E+00 1.6E+00 2.4E+01 2.3E+01 2.3E+01
Thyroid Count Bioassay (nCi) 1 6.4E+01 7.5E+01 7.5E+01 6.4E+02 7.5E+02 7.5E+02 9.5E+03 1.1E+04 1.1E+04 2 7.7E+01 8.1E+01 8.1E+01 7.7E+02 8.1E+02 8.1E+02 1.1E+04 1.2E+04 1.2E+04 5 7.7E+01 7.8E+01 7.5E+01 7.7E+02 7.8E+02 7.5E+02 1.1E+04 1.1E+04 1.1E+04 7 7.7E+01 7.5E+01 7.2E+01 7.7E+02 7.5E+02 7.2E+02 1.1E+04 1.1E+04 1.1E+04
14 6.4E+01 6.6E+01 6.4E+01 6.4E+02 6.6E+02 6.4E+02 9.5E+03 9.5E+03 9.6E+03 30 5.0E+01 5.0E+01 4.7E+01 5.0E+02 5.0E+02 4.7E+02 7.4E+03 7.3E+03 7.1E+03 60 2.9E+01 2.8E+01 2.8E+01 2.9E+02 2.8E+02 2.8E+02 4.3E+03 4.1E+03 4.2E+03 90 1.7E+01 1.7E+01 1.6E+01 1.7E+02 1.7E+02 1.6E+02 2.5E+03 2.5E+03 2.5E+03
180 3.5E+00 3.4E+00 3.3E+00 3.5E+01 3.4E+01 3.3E+01 5.2E+02 5.0E+02 5.0E+02 365 1.4E-01 1.3E-01 1.3E-01 1.4E+00 1.3E+00 1.3E+00 2.0E+01 2.0E+01 2.0E+01
Urine Bioassay (dmp/d) 1 1.4E+05 9.7E+04 8.6E+04 1.4E+06 9.7E+05 8.6E+05 2.1E+07 1.4E+07 1.3E+07 2 3.6E+04 1.3E+04 5.2E+03 3.6E+05 1.3E+05 5.2E+04 5.4E+06 1.9E+06 7.9E+05 5 1.1E+03 4.2E+02 2.0E+02 1.1E+04 4.2E+03 2.0E+03 1.7E+05 6.2E+04 3.1E+04 7 3.4E+02 3.0E+02 2.8E+02 3.4E+03 3.0E+03 2.8E+03 5.1E+04 4.3E+04 4.2E+04
14 4.4E+02 4.4E+02 4.4E+02 4.4E+03 4.4E+03 4.4E+03 6.6E+04 6.5E+04 6.6E+04 30 5.4E+02 5.2E+02 5.1E+02 5.4E+03 5.2E+03 5.1E+03 8.1E+04 7.6E+04 7.7E+04 60 3.7E+02 3.7E+02 3.6E+02 3.7E+03 3.7E+03 3.6E+03 5.6E+04 5.3E+04 5.5E+04 90 2.3E+02 2.3E+02 2.2E+02 2.3E+03 2.3E+03 2.2E+03 3.5E+04 3.3E+04 3.3E+04
180 4.7E+01 4.7E+01 4.4E+01 4.7E+02 4.7E+02 4.4E+02 7.1E+03 6.9E+03 6.7E+03 365 1.8E+00 1.8E+00 1.8E+00 1.8E+01 1.8E+01 1.8E+01 2.7E+02 2.6E+02 2.7E+02

PNNL-MA-860 Chapter 12.0 Issued: September 12, 2000 Page 12.12
bioassay program design and data evaluation, the 5-µm inhalation-derived reference levels are used at Hanford as a standard against which routine monitoring data can be compared. The choice of the 5-µm inhalation was made in large part based on the use of 5-µm-AMAD particle sizes for most aerosols at Hanford, and as a reasonable compromise between values for 1-µm-AMAD particles and ingestion. A point of interest regarding 129I is that the mass of pure 129I corresponding to a compliance level intake of 6,100 nCi (i.e., the whole body retention at time zero) is 34 mg, which exceeds the iodine mass of 12 mg contained in the Reference Man total body (ICRP 1975). Thus, it is likely that a retained intake of 129I, which might result in a dose exceeding the 50-rem thyroid dose limit, is physiologically impossible. This does not hold true for the short half-life radioiodines.
12.4 Bioassay for Radioiodines In vivo measurements and a routine monitoring program for radioiodine isotopes are the main bioassay considerations.
12.4.1 Bioassay Methods and Capabilities Radioiodine isotopes can be easily detected by in vivo measure-ments. Iodine-131 can be readily detected using the NaI-detector-based preview counter or the coaxial germanium detector system. However, because these are not nuclides in routine use at Hanford, they are not part of the standard library of nuclides for which in vivo measurement results are routinely calculated. The spectrum peak search routine, performed for each measurement, will find them if they are present above the peak search MDA, which is less sensitive than the library search MDA. Nominal 131I MDA values for the peak search routine are about 15 nCi for the preview counter and about 2 nCi for the coaxial system. Because of their low-energy photon emissions, 125I and 129I can only be measured using the intrinsic germanium (IG) detector systems in the thyroid-counting configuration. Nominal MDAs for thyroid counting are 0.1 nCi for 131I and 0.8 nCi for 125I and 129I. The minimum detectable intakes and associated minimum detectable doses (committed effective dose equivalents) based on the nominal MDAs are shown in Table 12.10 for 131I and Table 12.11 for 129I and 125I.

Issued: September 12, 2000
PN
NL-M
A-860 C
hapter 12.0
Page 12.13
Table 12.10. 131I Minimum Detectable Intakes and Doses (HE,50 and Thyroid HT,50) for 5-µm-AMAD Class D Inhalation
NaI System(a) Minimum Detectable
Coax Ge System(b) Minimum Detectable
Planar Ge System(c) Minimum Detectable
Days Post Intake Intake (nCi)
HE,50 (mrem)
HT,50 (mrem) Intake (nCi)
HE,50 (mrem)
HT,50 (mrem) Intake (nCi)
HE,50 (mrem)
HT,50 (mrem)
1 4.7E+01 2.1 70 6.3E+00 0.3 9.4 4.5E-01 0.02 0.7 2 6.3E+01 2.8 94 8.3E+00 0.4 13 4.5E-01 0.02 0.7 5 8.3E+01 3.8 130 1.1E+01 0.5 17 5.9E-01 0.03 0.9 7 1.0E+02 4.5 150 1.3E+01 0.6 20 7.1E-01 0.03 1.1
14 1.8E+02 8.1 270 2.4E+01 1.1 36 1.3E+00 0.06 2.0 30 7.5E+02 34 1100 1.0E+02 4.5 150 5.6E+00 0.25 8.3 60 1.1E+04 4.8E+02 1.6E+04 1.4E+03 64 2100 8.3E+01 3.8 130 90 1.5E+05 6.9E+03 2.3E+05 2.0E+04 9.2E+02 3.1E+04 1.2E+03 54 1800
180 4.8E+08 2.2E+07 7.3E+08 6.5E+07 2.9E+06 9.7E+07 3.7E+06 1.7E+05 5.6E+06 (a) Based on MDA of 15 nCi, whole body count (b) Based on MDA of 2 nCi, whole body count (c) Based on MDA of 0.1 nCi, thyroid count

PNNL-MA-860 Chapter 12.0 Issued: September 12, 2000 Page 12.14
Table 12.11. 129I and 125I Minimum Detectable Intakes and Doses (HE,50 and Thyroid HT,50) for 5-µm-AMAD Class D Inhalation
Iodine-129
Minimum Detectable Iodine-125
Minimum Detectable Days Post Intake Intake (nCi) HE,50 (mrem) HT,50 (mrem) Intake (nCi) HE,50 (mrem) HT,50 (mrem)
1 3.3 0.73 25 3.3 0.11 3.7 2 3.1 0.68 23 3.1 0.10 3.4 5 3.1 0.68 23 3.2 0.10 3.5 7 3.1 0.68 23 3.3 0.11 3.7
14 3.3 0.73 25 3.8 0.12 4.2 30 3.6 0.80 27 5.0 0.16 5.5 60 4.4 1.0 33 8.8 0.28 9.7 90 5.3 1.2 40 15 0.47 16
180 9 2.0 69 73 2.3 80 365 29 6.3 210 1900 60 2000 730 2100 84.0 2900 NA NA NA
(a) Based on MDA of 0.8 nCi for planar germanium system thyroid count NA = not applicable.
Radioiodine bioassay programs at Hanford are based on in vivo measurements. Urine sample analysis using a gamma spectrum analysis protocol (Hanford MDA of 10 dpm/l) can also be used for radioiodines. However, the ease and convenience of in vivo measurements at Hanford makes urinalysis the less preferred method.
12.4.2 Routine Bioassay Monitoring Protocol It is recommended that routine bioassay measurements be performed at intervals not exceeding four to five effective half-lives of the radionuclide because of uncertainties associated with the assumed retention characteristics. Based on that recommendation and the minimum detectable doses listed in Tables 12.10 and 12.11, the measurement frequency for the minimum recommended routine monitoring program for workers potentially exposed to 131I, 125I, or 129I, is monthly, semiannually, and annually, respectively. If the coaxial germanium system is used for 131I bioassay, bimonthly measurements (i.e., every 2 months) provide adequate sensitivity. A supplemental approach to routine bioassay monitoring for radioiodines is to perform a workplace thyroid screening measure-ment shortly after completion of the iodine-related work. If there is any indication of radioiodine detection, then a more timely thyroid count can be performed using the high-resolution systems.

Issued: September 12, 2000 PNNL-MA-860 Chapter 12.0 Page 12.15
If a radioiodine isotope is detected in a routine measurement, follow-up measurements to confirm the intake should be performed. The measurements should preferably be performed immediately following the initial measurement while the subject is at the whole body counting facility. The use of the high-resolution germanium detectors for follow-up measurements is preferred in order to accurately quantify the thyroid deposition.
12.4.3 Special Monitoring for Suspected Intakes Thyroid counts should be performed to assess the significance of an acute intake of radioiodine. The deposition of iodine in the thyroid following an acute intake is not instantaneous; rather, buildup of iodine in the thyroid will occur over a period of about 3 days follow-ing the intake. Results of thyroid counts obtained within a day or so of an intake may thus underestimate the maximum retained quantity that will be achieved following the exposure. Measurements made 2 to 3 days post intake will likely provide the best indication of the maximum retained quantity in the thyroid from the intake. If significant quantities of short-lived radioiodines are possibly associated with an exposure, then in vivo measurements should be performed within a day of the intake. The measurements should be made using a germanium detector to achieve optimum resolution. Follow-up counts, if needed, should be performed. Data from facility monitoring may be used to identify the relative activities of the various radioiodines present at the time of intake. Caution should be exercised when analyzing in vivo data for short-lived iodine isotopes to ensure that activity within the thyroid and not external contamination is being measured.
12.5 Assessment of Internal Dose Radioiodines can be detected and quantified in the thyroid using in vivo techniques. Measurement of 125I and 129I requires the use of the planar germanium counting system for thyroid counting. Thyroid counts are sufficiently sensitive to enable detection of activity in the thyroid at levels below that of any dosimetric consequence (see Tables 12.10 and 12.11). Thus, dose-based screening levels for thyroid assessments may be appropriate (e.g., a screening level based on 10-mrem committed effective dose equivalent provides assurance that significant doses do not go unassessed). Routine whole body counting or thyroid counting can be used for 131I. Several methods exist to evaluate in vivo results to assess the internal dose equivalent. The simplest method, and one that is recommended for initial evaluation of in vivo results as well as for final evaluations

PNNL-MA-860 Chapter 12.0 Issued: September 12, 2000 Page 12.16
when doses are low, involves fitting the in vivo measurement data to the expected internal activity using the biokinetic model prescribed in this chapter. Data-fitting is performed using CINDY. Alternatively, a hand calculation can be performed using the factors tabulated in this chapter. Assumptions that are used for this evaluation are that 1) the material is inhaled in class D form, 2) the intake date, if unknown, is assumed to be the midpoint of the period during which the intake could have occurred, and 3) the intake consisted of the inhalation of an aerosol with an AMAD of 5 µm. Observed in vivo retention should be used in place of the ICRP biokinetic model for evaluations of internal doses that potentially exceed a 100-mrem committed effective dose equivalent when sufficient in vivo data are available for such an analysis.
12.6 Management of Internal Contamination Cases In an accident exposure situation, iodine will likely be taken in by inhalation, ingestion, and absorption through the skin. If the iodine is very soluble, it will reach the thyroid relatively quickly; however, maximum thyroid activity may not occur until 2 or 3 days post intake. Thus, thyroid counts performed shortly after intake may underestimate the maximum deposition. Also of concern for in vivo measurements made shortly after intake are contributions to the count from radioiodine located outside the body or in other regions of the body. However, if thyroid measurements are made with a collimated germanium detector, these interferences can most likely be reduced to negligible levels. The adult thyroid gland is considered to be a relatively radioresistant organ (weighting factor = 0.03) with respect to the risk of fatal malignancies. However, thyroid nodules, cancer, and hypothyroid-ism are all associated with radiation exposure to the thyroid. The intervention therapy recommended by both NCRP Report 65 (1980) and Bhattacharyya et al. (1992) is immediate administration of 300-mg KI or NaI tablets, regardless of the route of exposure, and daily administrations for 7 to 14 days (to prevent recycling back into the thyroid) as a mitigative action following a large intake. For individ-uals receiving greater than a 100-rem dose equivalent to the thyroid, an estimate of residual thyroid function should be made within 2 or 3 months after exposure (NCRP 1980). Occupational Medicine (at HEHF) should be immediately notified of a potentially severe intake of radioiodine.

Issued: September 12, 2000 PNNL-MA-860 Chapter 12.0 Page 12.17
12.7 References
10 CFR 835. 1998. U.S. Department of Energy. “Occupational Radiation Protection.” U.S. Code of Federal Regulations. Bhattacharyya, M. H., B. D. Breitenstein, H. Metivier, B. A. Muggenburg, G. N. Stradling, and V. Volf. 1992. “Guidebook for the treatment of accidental internal radionuclide contamination of workers.” Rad. Prot. Dosim. 41:1. International Commission on Radiological Protection (ICRP). 1975. Report of task group on Reference Man. ICRP publication 23, Pergamon Press, New York. International Commission on Radiological Protection (ICRP). 1979. “Limits for intakes of radionuclides by workers.” (ICRP publication 30, Part 1 and supplements). Annals of the ICRP, 2:3-4, Pergamon Press, New York. International Commission on Radiological Protection (ICRP). 1988. “Individual monitoring for intakes of radionuclides by workers: Design and interpretation.” (ICRP publication 54). Annals of the ICRP, 19:1-3, Pergamon Press, New York. International Commission on Radiological Protection (ICRP). 1993. “Age-dependent doses to members of the public from intake of radionuclides: Part 2 ingestion dose coefficients.” (ICRP publication 67). Annals of the ICRP, 23:3-4, Pergamon Press, New York. International Commission on Radiological Protection (ICRP). 1994a. “Human respiratory tract model for radiological protection.” (ICRP publication 66). Annals of the ICRP, 24:1-3, Pergamon Press, New York. International Commission on Radiological Protection (ICRP). 1994b. “Dose coefficients for intakes of radionuclides by workers.” (ICRP publication 68). Annals of the ICRP, 24:4, Pergamon Press, New York. International Commission on Radiological Protection (ICRP). 1997. “Individual monitoring for internal exposure of workers.” (ICRP publication 78). Annals of the ICRP, 27:3-4, Pergamon Press, New York.

PNNL-MA-860 Chapter 12.0 Issued: September 12, 2000 Page 12.18
National Council on Radiation Protection and Measurements (NCRP). 1980. Management of Persons Accidentally Contaminated with Radionuclides. NCRP Report No. 65, Bethesda, Maryland. Riggs, D. S. 1952. “Quantitative aspects of iodine metabolism in man.” Pharmacology Review 4:284-370. Strenge, D. L., R. A. Kennedy, M. J. Sula, and J. R. Johnson. 1992. Code for Internal Dosimetry (Cindy Version 1.2), Part 1: Conceptual Representation. PNL-7493 Pt. 1, Rev. 1, Pacific Northwest National Laboratory, Richland, Washington. U.S. Environmental Protection Agency (EPA). 1988. Limiting Values of Radionuclide Intake and Air Concentration and Dose Conversion Factors for Inhalation, Submersion, and Ingestion. Federal Guidance Report No. 11, EPA-520/1-88-020, Washington, D.C.

Issued: September 12, 2000 PNNL-MA-860 Chapter 13.0 Page 13.1
13.0 Europium
This chapter provides technical information on the sources, characteristics, biokinetics, and dosimetry of 152Eu, 154Eu, and 155Eu, which are the principal europium radionuclides of concern from an internal exposure standpoint at Hanford.
13.1 Sources and Characteristics Europium-154 and 155Eu have been produced historically at Hanford by the N Reactor through neutron activation of samarium oxide marbles used in the reactor’s safety system. The samarium oxide marbles were replaced in 1978 with marbles made of boron carbide; however, a few of the old samarium oxide marbles remained lodged in the graphite block moderator and continued to be activated during operation of the reactor until its shutdown in 1986. Europium-152 has been found in coolant pipes of some of the old production reactors. Its exact source has not been determined, but it has been speculated that it might result from activation of stable 151Eu from naturally occurring or fission-product sources. Data are provided for 152Eu, although this has not historically been considered a major nuclide of concern in these facilities. Radiological decay data for these isotopes are given in Table 13.1.
Table 13.1. Radiological Data for Hanford Europiums
Isotope Half-Life
(y) Decay Constant
(y1) Specific
Activity (Ci/g) 152Eu 13.33 0.052 176 154Eu 8.8 0.079 263 155Eu 4.96 0.14 463
Based on numerous measurements made at various N Reactor locations (Weetman and DeHaven 1982), a particle size of 0.5-µm-AMAD should be assumed, unless specific particle size data are available. This particle size is in contrast to the 1-µm-AMAD particle size assumed by ICRP publication 30 (1979) and the 5-µm-AMAD particle size recommended by ICRP publication 66 (1994a).

PNNL-MA-860 Chapter 13.0 Issued: September 12, 2000 Page 13.2
The principal locations where exposures to europium radionuclides may occur are the 100-N Area and the waste management facilities in the 200 Areas where contaminated waste from N Reactor is handled.
13.2 Biokinetic Behavior of Europium The biokinetic behavior of europium is addressed in the following sections.
13.2.1 Transportability Class ICRP 30 Part 3 (1981) recommends that all compounds of europium (including nitrates, chlorides, and oxides) be assigned to inhalation class W. Some experience at Hanford has suggested that europium oxide may occasionally be more tenaciously retained in the lung than would be expected for a class W material. However, at this time data are insufficient to establish a case for class Y europium at Hanford. The new ICRP 66 lung model (ICRP 1994a) introduced the concept of lung absorption type as a replacement for the ICRP 30 inhalation class. Based on data tabulated in ICRP 68 (1994b), all forms of europium are assigned absorption type M. The default assumption for Hanford europium exposures is inhalation class W, per the ICRP 30 recommendation.
13.2.2 Gastrointestinal Uptake to Blood (f1 Factor) Citing a range of 2E-04 to 3E-03, the GI uptake factor (f1) for europium was taken by ICRP 30 (1981) to be 1E-03. More recently, ICRP 68 used 5E-04, without highlighting a reason for the change. This choice has been promulgated by the International Atomic Energy Agency in its Basic Safety Standards (IAEA 1996). Although a clear scientific justification for the change has not been identified, the HIDP uses the more recent ICRP recommendation of 5E-04. This value lies within the range originally cited, and it appears to be the current scientific consensus.
13.2.3 Biokinetic Model According to the ICRP 30 Part 3 (1981) model, europium entering the bloodstream is deposited and tenaciously retained in the liver and on bone surfaces. The distribution of europium entering the blood is given by ICRP 30 as follows:

Issued: September 12, 2000 PNNL-MA-860 Chapter 13.0 Page 13.3
Organ/Tissue Fraction Retained Biological Half-Life (days)
Liver 0.4 3500 Bone Surfaces 0.4 3500 Kidney 0.06 10 Direct Excretion 0.14
13.3 Internal Dosimetry Factors for Europium
This section contains factors that are useful in making internal dosimetry calculations. The factors included are derived from the CINDY computer code and incorporate the models and assumptions of the preceding sections. Their application is intended for circum-stances where such assumptions are appropriate or more specific information is lacking. Variation from these factors is appropriate if sufficient data are available.
13.3.1 Retention of Europium
Selected retention fractions for 152Eu and 154Eu in the whole body and bone and 155Eu in the lung and bone are listed in Table 13.2 for inhal-ation intakes and Table 13.3 for ingestion intakes. Fractions have been tabulated for a 0.5-µm-AMAD aerosol class W inhalation as the default Hanford assumption based on the previously described char-acterization work. Fractions are also tabulated for a 5-µm-AMAD aerosol inhalation as the standard ICRP inhalation aerosol. Although the larger particle size is not normally used for Hanford europium intakes, particle size growth with time is possible due to oxidation in the ambient environment. The organs and tissues selected for tabulation are those of greatest interest to routine and special bioassay measurements.
13.3.2 Dose Coefficients Dose coefficients, expressed as committed dose equivalent per unit activity of intake (e.g., rem/nCi of intake), are a convenient shortcut to estimating doses based on standard assumptions when the magni-tude of intake is known. Acute intake dose coefficients have been compiled in Table 13.4 for selected exposure scenarios, based on calculations using the CINDY code. The scenarios include the inhalation of class W 0.5-µm- and 5-µm-AMAD particles as the Hanford default and ICRP 66 default particle sizes, respectively, and ingestion. For all of these scenarios, the most limiting dose coefficients are for the committed effective dose equivalent. Dose coefficients for organs or tissues that contribute approximately 10% or more to the committed effective dose equivalent are also shown.

PNNL-MA-860 Chapter 13.0 Issued: September 12, 2000 Page 13.4
Table 13.2. Fractional Retention of Inhalation Class W Europium Particle Size: 0.5-µµm
Days Post Intake
152Eu Whole Body
152Eu Bone(a)
154Eu Whole Body
154Eu Bone(a)
155Eu Lung
155Eu Bone(a)
0 5.9E-01 2.1E-03 5.9E-01 2.1E-03 4.1E-01 2.1E-03 1 5.5E-01 2.1E-02 5.5E-01 2.1E-02 3.0E-01 2.1E-02 2 4.6E-01 2.3E-02 4.6E-01 2.3E-02 2.5E-01 2.3E-02 5 2.8E-01 2.4E-02 2.8E-01 2.4E-02 2.0E-01 2.4E-02 7 2.5E-01 2.4E-02 2.5E-01 2.4E-02 1.9E-01 2.4E-02
14 2.3E-01 2.6E-02 2.3E-01 2.6E-02 1.8E-01 2.6E-02 30 2.1E-01 3.0E-02 2.1E-01 3.0E-02 1.4E-01 3.0E-02 60 1.7E-01 3.5E-02 1.7E-01 3.5E-02 9.6E-02 3.5E-02 90 1.4E-01 3.9E-02 1.4E-01 3.9E-02 6.4E-02 3.8E-02
180 1.1E-01 4.4E-02 1.1E-01 4.4E-02 2.0E-02 4.2E-02 365 9.1E-02 4.5E-02 8.9E-02 4.3E-02 1.7E-03 4.1E-02 730 8.0E-02 4.0E-02 7.5E-02 3.8E-02 1.2E-05 3.3E-02
1825 5.5E-02 2.7E-02 4.8E-02 2.4E-02 insig. 1.8E-02 3650 2.9E-02 1.5E-02 2.3E-02 1.1E-02 insig. 6.1E-03 7300 8.5E-03 4.3E-03 5.0E-03 2.5E-03 insig. 7.3E-04
18250 2.0E-04 1.0E-04 5.3E-05 2.7E-05 insig. 1.3E-06 Particle Size: 5-µµm Days Post
Intake
152Eu Whole Body
152Eu Bone(a)
154Eu Whole Body
154Eu Bone(a)
155Eu Lung
155Eu Bone(a)
0 9.1E-01 4.4E-03 9.1E-01 4.4E-03 1.5E-01 4.4E-03 1 8.1E-01 4.3E-02 8.1E-01 4.3E-02 7.5E-02 4.3E-02 2 5.4E-01 4.6E-02 5.4E-01 4.6E-02 6.3E-02 4.6E-02 5 1.8E-01 4.6E-02 1.8E-01 4.6E-02 5.1E-02 4.6E-02 7 1.5E-01 4.6E-02 1.5E-01 4.6E-02 4.9E-02 4.6E-02
14 1.4E-01 4.6E-02 1.4E-01 4.6E-02 4.4E-02 4.6E-02 30 1.3E-01 4.7E-02 1.3E-01 4.7E-02 3.6E-02 4.7E-02 60 1.2E-01 4.8E-02 1.2E-01 4.8E-02 2.4E-02 4.7E-02 90 1.1E-01 4.9E-02 1.1E-01 4.8E-02 1.6E-02 4.8E-02
180 1.0E-01 4.9E-02 1.0E-01 4.8E-02 4.9E-02 4.7E-02 365 9.4E-02 4.7E-02 9.1E-02 4.5E-02 4.2E-04 4.3E-02 730 8.3E-02 4.1E-02 7.8E-02 3.9E-02 3.0E-06 3.5E-02
1825 5.7E-02 2.8E-02 5.0E-02 2.5E-02 insig. 1.8E-02 3650 3.1E-02 1.5E-02 2.3E-02 1.2E-02 insig. 6.4E-03 7300 8.3E-03 4.4E-03 5.2E-03 2.6E-03 insig. 7.6E-04
18250 2.1E-04 1.1E-04 5.5E-05 2.8E-05 insig. 1.3E-06 (a) Fractional retention in the liver is the same as the fractional retention in the bone.

Issued: September 12, 2000 PNNL-MA-860 Chapter 13.0 Page 13.5
Table 13.3. Fractional Retention of Ingested Europium
Days Post Intake
152Eu Whole Body
152Eu Bone(a)
154Eu Whole Body
154Eu Bone(a)
155Eu Bone(a)
0 1.0E+00 2.4E-07 1.0E+00 2.4E-07 2.4E-07 1 7.1E-01 1.8E-04 7.1E-01 1.8E-04 1.8E-04 2 3.2E-01 2.0E-04 3.2E-01 2.0E-04 2.0E-04 5 1.9E-02 2.0E-04 1.9E-02 2.0E-04 2.0E-04 7 2.9E-03 2.0E-04 2.9E-03 2.0E-04 2.0E-04
14 4.1E-04 2.0E-04 4.1E-04 2.0E-04 2.0E-04 30 4.0E-04 2.0E-04 4.0E-04 2.0E-04 2.0E-04 60 3.9E-04 2.0E-04 3.9E-04 2.0E-04 1.9E-04 90 3.9E-04 1.9E-04 3.9E-04 1.9E-04 1.9E-04
180 3.8E-04 1.9E-04 3.7E-04 1.9E-04 1.8E-04 365 3.5E-04 1.8E-04 3.4E-04 1.7E-04 1.6E-04 730 3.1E-04 1.6E-04 3.0E-04 1.5E-04 1.3E-04
1825 2.1E-04 1.1E-04 1.9E-04 9.4E-05 6.9E-05 3650 1.2E-04 5.8E-05 8.8E-05 4.4E-05 2.4E-05 7300 3.3E-05 1.7E-05 1.9E-05 9.7E-06 2.9E-06
18250 8.0E-07 4.0E-07 2.1E-07 1.0E-07 5.0E-09 (a) Fractional retention in the liver is the same as fractional retention in bone.
Table 13.4. Committed Dose Coefficients for Europium (rem/nCi acute intake)
Class W Inhalation
Isotope Organ 0.5-µµm-AMAD 5-µµm-AMAD Ingestion f1 = 5E-04
Instant Uptake
152Eu Effective 2.2E-04 2.1E-04 4.7E-06 1.6E-03 Liver 1.3E-03 1.4E-03 insig. 1.0E-02 Bone Surface 9.3E-04 9.8E-04 insig. 7.4E-03 Red Marrow 3.1E-04 3.2E-04 insig. 2.4E-03 Lung 2.7E-04 1.5E-04 insig. insig. Lower Large Intestine insig. insig. 3.7E-05 insig. Upper Large Intestine insig. insig. 1.5E-05 insig.
154Eu Effective 3.0E-04 2.8E-04 7.5E-06 2.1E-03 Liver 1.6E-03 1.7E-03 insig. 1.3E-02 Bone Surface 2.0E-03 2.1E-03 insig. 1.6E-02 Red Marrow 4.1E-04 4.3E-04 insig. 3.3E-03 Lung 3.8E-04 1.7E-04 insig. insig. Lower Large Intestine insig. insig. 6.7E-05 insig.
155Eu Effective 4.5E-05 4.2E-05 1.3E-06 3.0E-04 Liver 1.8E-04 2.0E-04 insig. 1.5E-03 Bone Surface 5.7E-04 6.0E-04 insig. 4.6E-03 Red Marrow 5.6E-05 5.9E-05 insig. 4.5E-04 Lung 6.1E-05 1.9E-05 insig. insig. Lower Large Intestine insig. insig. 1.3E-05 insig.

PNNL-MA-860 Chapter 13.0 Issued: September 12, 2000 Page 13.6
13.3.3 Comparison of Published Dosimetry Factors A comparison of selected dosimetry factors for 154Eu, the most restrictive of the Hanford europium isotopes, is shown in Table 13.5.
Table 13.5. Comparison of Dosimetric Factors for 154Eu
Reference Source Class W Inhalation 0.5 or 1-µµm AMAD
Class W Inhalation 5-µµm-AMAD
Ingestion (f1 = 5E-04)
Dose Coefficients
CINDY (hE,50)
3.0E-04 rem/nCi 8.1E-08 Sv/Bq (Based on 0.5-µm-AMAD particles)
2.8E-04 rem/nCi 7.6E-08 Sv/Bq
7.5E-06 rem/nCi 2.0E-09 Sv/Bq
EPA Federal Guidance Report No.11 (hE,50)
7.73E-08 Sv/Bq (2.86E-04 rem/nCi) (Based on 1-µm-AMAD particles) NA
2.58E-09 Sv/Bq (9.55E-06 rem/nCi)
ICRP 68 [e(50)]
5.0E-08 Sv/Bq (1.8E-04 rem/nCi) Type S, based on 1-µm-AMAD particles)
3.5E-08 Sv/Bq (1.3E-04 rem/nCi) Type M
2.0E-09 Sv/Bq (7.4E-06 rem/nCi)
Stochastic DAC
10 CFR 835, App. A 8E-09 µCi/ml and 3E+02 Bq/m3 NA NA
EPA Federal Guidance Report No. 11
8E-09 µCi/ml and 3E-04 MBq/m3 NA NA
ICRP 30, ICRP 54 3E+02 Bq/m3 NA NA Stochastic Annual Limit on Intake, ALI Calculated from 10 CFR 835 DAC
19 µCi and 7.2E+05 Bq NA NA
ICRP 30 7E+05 Bq NA 2E+07 Bq EPA Federal Guidance Report No. 11
0.7 MBq and 20 µCi NA
20 MBq and 500 µCi
NA = not applicable. 13.3.4 Derived Reference Levels
Derived reporting, investigation, and dose limit compliance levels (based on committed effective dose equivalents of 10-mrem, 100-mrem, and 5,000 mrem, respectively) have been calculated for

Issued: September 12, 2000 PNNL-MA-860 Chapter 13.0 Page 13.7
152Eu, 154Eu, and 155Eu, as pure isotopes, for whole body and skeleton bioassays. Derived levels for 152Eu are shown in Table 13.6, for 154Eu in Table 13.7, and for 155Eu in Table 13.8.
13.4 Bioassay for Europium This section discusses bioassay methods, capabilities, and protocols for europium.
13.4.1 Bioassay Methods and Capabilities The europium isotopes of concern at Hanford (152Eu, 154Eu, and 155Eu) are readily measured by in vivo bioassay techniques. Europium intakes can also be detected and assessed through collection and analysis of urine and fecal samples. However, because in vivo measurements provide a direct and sensitive method for assessing internal depositions of europium radionuclides, excreta measurements are generally not necessary. The recommended bioassay programs for europium are based on in vivo measurements. Nominal minimum detectable activities for in vivo measurements are shown in Table 13.9. Europium-154 is the predominant long-lived europium radioisotope in europium mixtures at Hanford. During the operating lifetime of N Reactor, the 154Eu:155Eu activity ratio was about 2.0. Since the 1986 shutdown of N Reactor, this ratio should gradually increase due to the longer half-life of 154Eu, now that europium is no longer produced. Because 154Eu is also more easily detectable in vivo than 155Eu, it is the best indicator of an intake of europium radionuclides. Whole body counting for 154Eu is conveniently performed using the NaI-detector preview counter, however the high-resolution large-volume coaxial germanium detector system should be used for quantitative determinations if detection is indicated on the NaI system. Europium-155 is more difficult to detect in vivo because its predominant gamma emission falls in the low-energy noise region of the standard whole body count. It can be detected in the skeleton or lungs using the low-energy planar germanium detector systems. The total body content of 155Eu cannot be directly measured with the Hanford whole body counter. It can be estimated by establishing a 155Eu:154Eu ratio, using chest or skeleton counts, and then applying that ratio to the 154Eu whole body count result. Skeleton counting would provide a more sensitive ratio for 155Eu estimation.

PNN
L-MA
-860 Chapter 13.0
Issued: Septem
ber 12, 2000 Page 13.8
Table 13.6. Reference Levels and Derived Reference Levels for 152Eu
10-mrem HE,50 Reporting Level 100-mrem HE,50 Investigation Level 5,000-mrem Ht,50 Compliance Level
Days Post Intake 0.5-µµm
Inhalation 5-µµm
Inhalation Ingestion 0.5-µµm
Inhalation 5-µµm
Inhalation Ingestion 0.5-µµm
Inhalation 5-µµm
Inhalation Ingestion Intake (nCi) 4.5E+01 4.8E+01 2.1E+03 4.5E+02 4.8E+02 2.1E+04 2.3E+04 2.4E+04 1.1E+06 Whole Body Count Bioassay (nCi)
0 2.7E+01 4.3E+01 2.1E+03 2.7E+02 4.3E+02 2.1E+04 1.3E+04 2.2E+04 1.1E+06 1 2.5E+01 3.9E+01 1.5E+03 2.5E+02 3.9E+02 1.5E+04 1.2E+04 1.9E+04 7.5E+05 2 2.1E+01 2.6E+01 6.8E+02 2.1E+02 2.6E+02 6.8E+03 1.0E+04 1.3E+04 3.4E+05 5 1.3E+01 8.6E+00 4.0E+01 1.3E+02 8.6E+01 4.0E+02 6.4E+03 4.3E+03 2.0E+04 7 1.1E+01 7.1E+00 6.2E+00 1.1E+02 7.1E+01 6.2E+01 5.7E+03 3.6E+03 3.1E+03
14 1.0E+01 6.7E+00 8.7E-01 1.0E+02 6.7E+01 8.7E+00 5.2E+03 3.3E+03 4.3E+02 30 9.5E+00 6.2E+00 8.5E-01 9.5E+01 6.2E+01 8.5E+00 4.8E+03 3.1E+03 4.2E+02 60 7.7E+00 5.7E+00 8.3E-01 7.7E+01 5.7E+01 8.3E+00 3.9E+03 2.9E+03 4.1E+02 90 6.4E+00 5.2E+00 8.3E-01 6.4E+01 5.2E+01 8.3E+00 3.2E+03 2.6E+03 4.1E+02
180 5.0E+00 4.8E+00 8.1E-01 5.0E+01 4.8E+01 8.1E+00 2.5E+03 2.4E+03 4.0E+02 365 4.1E+00 4.5E+00 7.4E-01 4.1E+01 4.5E+01 7.4E+00 2.1E+03 2.2E+03 3.7E+02 730 3.6E+00 4.0E+00 6.6E-01 3.6E+01 4.0E+01 6.6E+00 1.8E+03 2.0E+03 3.3E+02
Skeleton Bioassay (nCi) 0 9.5E-02 2.1E-01 5.1E-04 9.5E-01 2.1E+00 5.1E-03 4.8E+01 1.0E+02 2.5E-01 1 9.5E-01 2.0E+00 3.8E-01 9.5E+00 2.0E+01 3.8E+00 4.8E+02 1.0E+03 1.9E+02 2 1.0E+00 2.2E+00 4.3E-01 1.0E+01 2.2E+01 4.3E+00 5.2E+02 1.1E+03 2.1E+02 5 1.1E+00 2.2E+00 4.3E-01 1.1E+01 2.2E+01 4.3E+00 5.4E+02 1.1E+03 2.1E+02 7 1.1E+00 2.2E+00 4.3E-01 1.1E+01 2.2E+01 4.3E+00 5.4E+02 1.1E+03 2.1E+02
14 1.2E+00 2.2E+00 4.3E-01 1.2E+01 2.2E+01 4.3E+00 5.9E+02 1.1E+03 2.1E+02 30 1.4E+00 2.2E+00 4.3E-01 1.4E+01 2.2E+01 4.3E+00 6.8E+02 1.1E+03 2.1E+02 60 1.6E+00 2.3E+00 4.3E-01 1.6E+01 2.3E+01 4.3E+00 7.9E+02 1.1E+03 2.1E+02 90 1.8E+00 2.3E+00 4.0E-01 1.8E+01 2.3E+01 4.0E+00 8.9E+02 1.2E+03 2.0E+02
180 2.0E+00 2.3E+00 4.0E-01 2.0E+01 2.3E+01 4.0E+00 1.0E+03 1.2E+03 2.0E+02 365 2.0E+00 2.2E+00 3.8E-01 2.0E+01 2.2E+01 3.8E+00 1.0E+03 1.1E+03 1.9E+02 730 1.8E+00 2.0E+00 3.4E-01 1.8E+01 2.0E+01 3.4E+00 9.1E+02 9.8E+02 1.7E+02

Issued: September 12, 2000
PN
NL-M
A-860 C
hapter 13.0
Page 13.9
Table 13.7. Reference Levels and Derived Reference Levels for 154Eu
10-mrem HE,50 Reporting Level 100-mrem HE,50 Investigation Level 5,000-mrem Ht,50 Compliance Level
Days Post Intake 0.5-µµm
Inhalation 5-µµm
Inhalation Ingestion 0.5-µµm
Inhalation 5-µµm
Inhalation Ingestion 0.5-µµm
Inhalation 5-µµm
Inhalation Ingestion Intake (nCi) 3.3E+01 3.6E+01 1.3E+03 3.3E+02 3.6E+02 1.3E+04 1.7E+04 1.8E+04 6.7E+05 Whole Body Count Bioassay (nCi)
0 2.0E+01 3.2E+01 1.3E+03 2.0E+02 3.2E+02 1.3E+04 9.9E+03 1.6E+04 6.7E+05 1 1.8E+01 2.9E+01 9.5E+02 1.8E+02 2.9E+02 9.5E+03 9.2E+03 1.4E+04 4.7E+05 2 1.5E+01 1.9E+01 4.3E+02 1.5E+02 1.9E+02 4.3E+03 7.7E+03 9.7E+03 2.1E+05 5 9.3E+00 6.4E+00 2.5E+01 9.3E+01 6.4E+01 2.5E+02 4.7E+03 3.2E+03 1.3E+04 7 8.3E+00 5.4E+00 3.9E+00 8.3E+01 5.4E+01 3.9E+01 4.2E+03 2.7E+03 1.9E+03
14 7.7E+00 5.0E+00 5.5E-01 7.7E+01 5.0E+01 5.5E+00 3.8E+03 2.5E+03 2.7E+02 30 7.0E+00 4.6E+00 5.3E-01 7.0E+01 4.6E+01 5.3E+00 3.5E+03 2.3E+03 2.7E+02 60 5.7E+00 4.3E+00 5.2E-01 5.7E+01 4.3E+01 5.2E+00 2.8E+03 2.1E+03 2.6E+02 90 4.7E+00 3.9E+00 5.2E-01 4.7E+01 3.9E+01 5.2E+00 2.3E+03 2.0E+03 2.6E+02
180 3.7E+00 3.6E+00 4.9E-01 3.7E+01 3.6E+01 4.9E+00 1.8E+03 1.8E+03 2.5E+02 365 3.0E+00 3.2E+00 4.5E-01 3.0E+01 3.2E+01 4.5E+00 1.5E+03 1.6E+03 2.3E+02 730 2.5E+00 2.8E+00 4.0E-01 2.5E+01 2.8E+01 4.0E+00 1.3E+03 1.4E+03 2.0E+02
Skeleton Bioassay (nCi) 0 7.0E-02 1.6E-01 3.2E-04 7.0E-01 1.6E+00 3.2E-03 3.5E+01 7.9E+01 1.6E-01 1 7.0E-01 1.5E+00 2.4E-01 7.0E+00 1.5E+01 2.4E+00 3.5E+02 7.7E+02 1.2E+02 2 7.7E-01 1.6E+00 2.7E-01 7.7E+00 1.6E+01 2.7E+00 3.8E+02 8.2E+02 1.3E+02 5 8.0E-01 1.6E+00 2.7E-01 8.0E+00 1.6E+01 2.7E+00 4.0E+02 8.2E+02 1.3E+02 7 8.0E-01 1.6E+00 2.7E-01 8.0E+00 1.6E+01 2.7E+00 4.0E+02 8.2E+02 1.3E+02
14 8.7E-01 1.6E+00 2.7E-01 8.7E+00 1.6E+01 2.7E+00 4.3E+02 8.2E+02 1.3E+02 30 1.0E+00 1.7E+00 2.7E-01 1.0E+01 1.7E+01 2.7E+00 5.0E+02 8.4E+02 1.3E+02 60 1.2E+00 1.7E+00 2.7E-01 1.2E+01 1.7E+01 2.7E+00 5.8E+02 8.6E+02 1.3E+02 90 1.3E+00 1.7E+00 2.5E-01 1.3E+01 1.7E+01 2.5E+00 6.5E+02 8.6E+02 1.3E+02
180 1.5E+00 1.7E+00 2.5E-01 1.5E+01 1.7E+01 2.5E+00 7.3E+02 8.6E+02 1.3E+02 365 1.4E+00 1.6E+00 2.3E-01 1.4E+01 1.6E+01 2.3E+00 7.2E+02 8.1E+02 1.1E+02 730 1.3E+00 1.4E+00 2.0E-01 1.3E+01 1.4E+01 2.0E+00 6.3E+02 7.0E+02 1.0E+02

PNN
L-MA
-860 Chapter 13.0
Issued: Septem
ber 12, 2000 Page 13.10
Table 13.8. Reference Levels and Derived Reference Levels for 155Eu
10-mrem HE,50 Reporting Level 100-mrem HE,50 Investigation Level 5,000-mrem Ht,50 Compliance Level
Days Post Intake 0.5-µµm
Inhalation 5-µµm
Inhalation Ingestion 0.5-µµm
Inhalation 5-µµm
Inhalation Ingestion 0.5-µµm
Inhalation 5-µµm
Inhalation Ingestion Intake (nCi) 2.2E+02 2.4E+02 7.7E+03 2.2E+03 2.4E+03 7.7E+04 1.1E+05 1.2E+05 3.9E+06 Skeleton Bioassay (nCi)
0 4.7E-01 1.0E+00 1.8E-03 4.7E+00 1.0E+01 1.8E-02 2.3E+02 5.2E+02 9.2E-01 1 4.7E+00 1.0E+01 1.4E+00 4.7E+01 1.0E+02 1.4E+01 2.3E+03 5.1E+03 6.9E+02 2 5.1E+00 1.1E+01 1.5E+00 5.1E+01 1.1E+02 1.5E+01 2.6E+03 5.5E+03 7.7E+02 5 5.3E+00 1.1E+01 1.5E+00 5.3E+01 1.1E+02 1.5E+01 2.7E+03 5.5E+03 7.7E+02 7 5.3E+00 1.1E+01 1.5E+00 5.3E+01 1.1E+02 1.5E+01 2.7E+03 5.5E+03 7.7E+02
14 5.8E+00 1.1E+01 1.5E+00 5.8E+01 1.1E+02 1.5E+01 2.9E+03 5.5E+03 7.7E+02 30 6.7E+00 1.1E+01 1.5E+00 6.7E+01 1.1E+02 1.5E+01 3.3E+03 5.6E+03 7.7E+02 60 7.8E+00 1.1E+01 1.5E+00 7.8E+01 1.1E+02 1.5E+01 3.9E+03 5.6E+03 7.3E+02 90 8.4E+00 1.1E+01 1.5E+00 8.4E+01 1.1E+02 1.5E+01 4.2E+03 5.7E+03 7.3E+02
180 9.3E+00 1.1E+01 1.4E+00 9.3E+01 1.1E+02 1.4E+01 4.7E+03 5.6E+03 6.9E+02 365 9.1E+00 1.0E+01 1.2E+00 9.1E+01 1.0E+02 1.2E+01 4.6E+03 5.1E+03 6.2E+02 730 7.3E+00 8.3E+00 1.0E+00 7.3E+01 8.3E+01 1.0E+01 3.7E+03 4.2E+03 5.0E+02

Issued: September 12, 2000 PNNL-MA-860 Chapter 13.0 Page 13.11
Table 13.9. Hanford In Vivo Measurement Detection Capability for 152Eu, 154Eu, and 155Eu, nCi
Measurement Type Organ/Tissue 152Eu 154Eu 155Eu
NaI Preview Count Whole Body 20(a) 3.7(b) NA Coaxial Germanium Count Whole Body 5.5(a) 1.7(b) NA Chest Count Lung 0.4(a) 0.3(a) 0.6(a) Skull Count Skeleton 0.8(a) 0.5(a) 1.0(a) (a) Not part of routine library. Estimated based on peak search
algorithm. (b) From In Vivo Monitoring Project Manual, PNL-MA-574. NA = not applicable. Europium-152 is not part of the routine whole body count library search algorithm, but is detectable by the peak search algorithm at whole body count levels of about 20 nCi. Special measurements of lung, skeleton, or liver content may be desired to establish individual-specific patterns of distribution and retention. Because europium is a liver- and bone-seeking radio-nuclide, chest counts performed more than several weeks after intake may be detecting activity in the liver, the bones of the chest, and the lung, in any combination. Therefore, any quantification of lung activity should consider the contribution from the bones and the liver. Skeleton activity is estimated from a head count. A correction factor can then be derived for obtaining lung activity from a chest count. These calculations are performed by the In Vivo Measure-ment Program staff. Likewise, the presence of europium in the liver must also be considered for its potential impact on a chest count. Minimum detectable committed effective dose equivalents for 154Eu, based on whole body counting, are shown in Table 13.10 (0.5-µm-AMAD inhalation), Table 13.11 (5-µm-AMAD inhalation), and 13.12 (ingestion). Corresponding values for 152Eu are shown in Tables 13.13, 13.14, and 13.15.
13.4.2 Routine Bioassay Monitoring Protocol Routine bioassay monitoring for europium at Hanford can be accomplished by whole body counting. From Table 13.10, it is apparent that annual whole body counting for 154Eu using the NaI preview counter provides sufficient sensitivity for detecting inhala-tion intakes resulting in doses well below 100 mrem, even when an equal amount of 155Eu is included with 154Eu at the time of intake. The minimum detectable dose from ingestion of a mixture of 154Eu

PNNL-MA-860 Chapter 13.0 Issued: September 12, 2000 Page 13.12
Table 13.10. 154Eu Minimum Detectable Intakes and Doses (HE,50) for 0.5-µm-AMAD Class W Inhalation
NaI System(a) Minimum
Detectable Coax Ge System(b) Minimum
Detectable Days Post Intake Intake (nCi) Dose (mrem) Intake (nCi) Dose (mrem)
0 6.3 1.9 2.9 0.9 1 6.7 2.0 3.1 0.9 2 8.0 2.4 3.7 1.1 5 13 4.0 6.1 1.8 7 15 4.4 6.8 2.0
14 16 4.8 7.4 2.2 30 18 5.3 8.1 2.4 60 22 6.5 10 3.0 90 26 7.9 12 3.6
180 34 10 15 4.6 365 42 12 19 5.7 730 49 15 23 6.8
1825 77 23 35 11 3600 161 48 74 22 7300 740 220 340 100
(a) Based on MDA of 3.7 nCi. (b) Based on MDA of 1.7 nCi.
Table 13.11. 154Eu Minimum Detectable Intakes and Doses (HE,50)
for 5-µm-AMAD Class W Inhalation
NaI System(a) Minimum Detectable
Coax Ge System(b) Minimum Detectable
Days Post Intake Intake (nCi) Dose (mrem) Intake (nCi) Dose (mrem) 0 4.1 1.1 1.9 0.5 1 4.6 1.3 2.1 0.6 2 6.9 1.9 3.1 0.9 5 21 5.8 9.4 2.6 7 25 6.9 11 3.2
14 26 7.4 12 3.4 30 28 8.0 13 3.7 60 31 8.6 14 4.0 90 34 9.4 15 4.3
180 37 10 17 4.8 365 41 11 19 5.2 730 47 13 22 6.1
1825 74 21 34 10 3600 160 45 74 21 7300 710 200 330 92
(a) Based on MDA of 3.7 nCi. (b) Based on MDA of 1.7 nCi.

Issued: September 12, 2000 PNNL-MA-860 Chapter 13.0 Page 13.13
Table 13.12. 154Eu Minimum Detectable Intakes and Doses (HE,50) for Ingestion
NaI System(a) Minimum
Detectable Coax Ge System(b) Minimum
Detectable Days Post Intake Intake (nCi) Dose (mrem) Intake (nCi) Dose (mrem)
0 3.7E+00 <0.1 1.7E+00 <0.1 1 5.2E+00 <0.1 2.4E+00 <0.1 2 1.2E+01 0.1 5.3E+00 <0.1 5 1.9E+02 1.5 8.9E+01 0.7 7 1.3E+03 10 5.9E+02 4.4
14 9.0E+03 68 4.1E+03 31 30 9.3E+03 69 4.3E+03 32 60 9.5E+03 71 4.4E+03 33 90 9.5E+03 71 4.4E+03 33
180 1.0E+04 75 4.6E+03 34 365 1.1E+04 82 5.0E+03 38 730 1.2E+04 93 5.7E+03 43
1825 1.9E+04 150 8.9E+03 67 3600 4.2E+04 320 1.9E+04 140 7300 1.9E+05 1500 8.9E+04 670
(a) Based on MDA of 3.7 nCi. (b) Based on MDA of 1.7 nCi.
Table 13.13. 152Eu Minimum Detectable Intakes and Doses (HE,50)
for 0.5-µm-AMAD Class W Inhalation
NaI System(a) Minimum Detectable
Coax Ge System(b) Minimum Detectable
Days Post Intake Intake (nCi) Dose (mrem) Intake (nCi) Dose (mrem) 0 3.4E+01 7.5 9.3E+00 2.1 1 3.6E+01 8.0 1.0E+01 2.2 2 4.3E+01 9.6 1.2E+01 2.6 5 7.1E+01 16 2.0E+01 4.3 7 8.0E+01 18 2.2E+01 4.8
14 8.7E+01 19 2.4E+01 5.3 30 9.5E+01 21 2.6E+01 5.8 60 1.2E+02 26 3.2E+01 7.1 90 1.4E+02 31 3.9E+01 8.6
180 1.8E+02 40 5.0E+01 11 365 2.2E+02 48 6.0E+01 13 730 2.5E+02 55 6.9E+01 15
1825 3.6E+02 80 1.0E+02 22 3600 6.9E+02 1.5E+02 1.9E+02 42 7300 2.4E+03 5.2E+02 6.5E+02 1.4E+02
(a) Based on MDA of 20 nCi. (b) Based on MDA of 5.5 nCi.

PNNL-MA-860 Chapter 13.0 Issued: September 12, 2000 Page 13.14
Table 13.14. 152Eu Minimum Detectable Intakes and Doses (HE,50) for 5-µm-AMAD Class W Inhalation
NaI System(a) Minimum
Detectable Coax Ge System(b) Minimum
Detectable Days Post Intake Intake (nCi) Dose (mrem) Intake (nCi) Dose (mrem)
0 2.2E+01 4.6 6.0E+00 1.3 1 2.5E+01 5.2 6.8E+00 1.4 2 3.7E+01 7.8 1.0E+01 2.1 5 1.1E+02 23 3.1E+01 6.4 7 1.3E+02 28 3.7E+01 7.7
14 1.4E+02 30 3.9E+01 8.3 30 1.5E+02 32 4.2E+01 8.9 60 1.7E+02 35 4.6E+01 9.6 90 1.8E+02 38 5.0E+01 11
180 2.0E+02 42 5.5E+01 12 365 2.1E+02 45 5.9E+01 12 730 2.4E+02 51 6.6E+01 14
1825 3.5E+02 74 9.6E+01 20 3600 6.5E+02 140 1.8E+02 37 7300 2.4E+03 510 6.6E+02 140
(a) Based on MDA of 20 nCi. (b) Based on MDA of 5.5 nCi.
Table 13.15. 152Eu Minimum Detectable Intakes and Doses (HE,50)
for Ingestion
NaI System(a) Minimum Detectable
Coax Ge System(b) Minimum Detectable
Days Post Intake Intake (nCi) Dose (mrem) Intake (nCi) Dose (mrem) 0 2.0E+01 0.1 5.5E+00 <0.1 1 2.8E+01 0.1 7.7E+00 <0.1 2 6.3E+01 0.3 1.7E+01 0.1 5 1.1E+03 4.9 2.9E+02 1.4 7 6.9E+03 32 1.9E+03 8.9
14 4.9E+04 230 1.3E+04 63 30 5.0E+04 240 1.4E+04 65 60 5.1E+04 240 1.4E+04 66 90 5.1E+04 240 1.4E+04 66
180 5.3E+04 250 1.4E+04 68 365 5.7E+04 270 1.6E+04 74 730 6.5E+04 300 1.8E+04 83
1825 9.5E+04 450 2.6E+04 120 3600 1.7E+05 780 4.6E+04 220 7300 6.1E+05 2800 1.7E+05 780
(a) Based on MDA of 20 nCi. (b) Based on MDA of 5.5 nCi.

Issued: September 12, 2000 PNNL-MA-860 Chapter 13.0 Page 13.15
and 155Eu, as monitored by an annual whole body count, is also less than 100-mrem, assuming a ratio of 154Eu:155Eu of 4.7 in 2000. Annual whole body counting with the NaI preview counter is also sufficient for 152Eu, even though that nuclide would be found by the less sensitive peak search routine rather than a library search. The fact that the source of 152Eu appears to be different from 154,155Eu suggests that concurrent exposure to all three nuclides seems unlikely. Routine bioassay monitoring for 155Eu is not required because its presence can be inferred from the detection of 154Eu, which is the more predominant nuclide due to its longer radioactive half-life. A supplemental skeleton count to establish the 155Eu:154Eu ratio would allow determination of the total body content of 155Eu. This measurement is warranted for an initial detection of 154Eu on a whole body count, but need not be a routine bioassay. Routine measurements in which a europium radionuclide is detected should be confirmed by follow-up in vivo measurements. The recommended protocol is to use high-resolution germanium detector whole body counting to confirm the identity and magnitude of activity indicated by the preview counter. Because of the adequate sensitivity of whole body counting, routine chest and skeleton measurements are not generally warranted for intake or dose assessment unless unusual retention or distribution is suspected.
13.4.3 Special Bioassay for Suspected Intakes An in vivo whole body examination should be performed following a suspected intake. However, unless the exposure appears to be of such magnitude that actions to hasten the removal of the material from the body are considered, the initial examination can be at the earliest convenient time during normal working hours. A measure-ment of the chest or skeleton is warranted to establish the 155Eu:154Eu ratio. Because there is much movement of inhaled material in the body during the first hours following an inhalation intake, early in vivo measurements should be considered semi-quantitative. Where early measurements suggest that the committed effective dose equivalent might exceed 100 mrem, follow-up measurements should be performed after about 5 days to allow for early clearance of material via the GI tract. Likewise, specialized measurements to estimate clearance rates from specific organs (i.e., chest counts and skeleton counts) should also be delayed until early GI tract clearance is complete.

PNNL-MA-860 Chapter 13.0 Issued: September 12, 2000 Page 13.16
13.5 Assessment of Internal Dose The assessment of internal dose equivalent from europium is accom-plished by evaluating in vivo measurement results. Assessments must consider the contribution of all radionuclides present in the mixture. For mixtures of 154Eu and 155Eu, the activity ratio should be established based on in vivo (e.g., skeleton) measurements of the two nuclides or determined from an isotopic analysis of a characteristic sample of the material. If the intake occurred many years before the measurements, decay correction must be made to determine the composition at the time of intake. Alternatively, if 155Eu measure-ment data are not available, the amount of 155Eu can be approximated from 154Eu by back-calculating the 154Eu value by radioactive decay correction from the time of intake to the reactor shutdown calendar year 1986 (a time when the 154Eu:155Eu ratio was approximately 2:1 [Weetman and DeHaven, 1982]), dividing the 154Eu 1986 value by 2 (to account for the 2:1 ratio), and then decaying the resulting 155Eu 1982 activity value to the time of intake. The committed effective dose equivalent is calculated for confirmed occupational intakes from incidents discovered promptly in the workplace. A 10-mrem screening level is applied to possible detections as part of routine bioassay monitoring. Committed dose equivalents to specific organs and tissues are determined based on the criteria also presented in the Hanford Internal Dosimetry Program Manual.(a) Several methods exist to evaluate in vivo results in order to assess the internal dose equivalent. The simplest method, and the one recommended for initial evaluation of in vivo results, as well as for final evaluations when doses are low, involves fitting the in vivo measurement data to the expected internal activity using the biokinetic model prescribed by the ICRP in publication 30. This model is implemented using CINDY. For this evaluation, it is assumed that the material is in its most insoluble form; that the intake date, if unknown, is the midpoint of the period during which the intake could have occurred; and that the intake consisted of an inhalation of a class W aerosol with 0.5-µm-AMAD particles. Data-fitting is performed using CINDY. Alternatively, a hand calculation can be performed using the factors tabulated in this chapter. If the intake could potentially result in a committed effective dose equivalent exceeding 100 mrem, then an investigation should be performed to determine the radionuclide composition of the involved mixture and to assess the dose equivalent from all radionuclides
(a) Pacific Northwest National Laboratory. 1999. Hanford Internal Dosimetry Program Manual.
PNL-MA-552, Richland, Washington. (Internal manual.) Available URL: http://www.pnl.gov/eshs/pub/pnnl552.htm

Issued: September 12, 2000 PNNL-MA-860 Chapter 13.0 Page 13.17
present in the mixture. Additional in vivo measurements to confirm the assumed retention function, or to develop a case-specific reten-tion function, should also be performed. Observed in vivo retention of europium should be used in place of the ICRP biokinetic model for evaluations of internal doses that potentially exceed 100 mrem or when sufficient in vivo data are available for such an analysis. This can be accomplished by modify-ing distribution and retention parameters in CINDY to achieve better agreement between the model and the observed in vivo measurement data. Modifications to default model parameters must be document-ed in the internal dose assessment report.
13.6 Management of Internal Contamination Cases Although, historically, there have been intakes involving europium radionuclides at Hanford, in no case have the intakes resulted in significant internal doses relative to occupational exposure limits. Because europium radionuclides are no longer produced, the concentrations of europium radionuclides at Hanford are slowly diminishing. In vivo measurements performed following a potential intake provide an initial indication of the significance of an intake, although external contamination and rapid translocation of the material through the body may interfere with the accuracy of the measure-ment. If a significant intake is indicated, then various mitigative actions are possible (NCRP 1980; Bhattacharyya et al. 1992). Purgatives or laxatives, as well as enemas or colonic irrigations, may reduce the residence time of the radionuclide in the GI tract, thereby reducing absorption by the blood. Antacids may reduce the absorp-tion rate from the GI tract. Once absorbed, diethylene triamine penta acetate (DTPA) may be considered as a chelating agent. All of these mitigative actions require prescription by medical authority. HEHF Occupational Medicine should be notified immediately upon indica-tion of a severe intake potentially requiring mitigative action.
13.7 References Bhattacharyya, M. H., B. D. Breitenstein, H. Metivier, B. A. Muggenburg, G. N. Stradling, and V. Volf. 1992. “Guidebook for the treatment of accidental internal radionuclide contamination of workers.” Rad. Prot. Dosim. 41:1.

PNNL-MA-860 Chapter 13.0 Issued: September 12, 2000 Page 13.18
International Atomic Energy Agency (IAEA). 1996. International Basic Safety Standards for Protection Against Ionizing Radiation and for the Safety of Radiation Sources. Safety Series No. 115, Vienna, Austria. International Commission on Radiological Protection (ICRP). 1979. “Limits for intakes of radionuclides by workers.” (ICRP publication 30, part 1). Annals of the ICRP, 2:3-4, Pergamon Press, New York. International Commission on Radiological Protection (ICRP). 1981a. “Limits for intakes of radionuclides by workers.” (ICRP publication 30, part 3). Annals of the ICRP, 6:2-3, Pergamon Press, New York. International Commission on Radiological Protection (ICRP). 1994a. “Human respiratory tract model for radiological protection.” (ICRP publication 66). Annals of the ICRP, 24:1-3, Pergamon Press, New York. International Commission on Radiological Protection (ICRP). 1994b. “Dose coefficients for intakes of radionuclides by workers.” (ICRP publication 68). Annals of the ICRP, 24:4, Pergamon Press, New York. National Council on Radiation Protection and Measurements (NCRP). 1980. Management of Persons Accidentally Contaminated with Radionuclides. NCRP Report No. 65, Bethesda, Maryland. Weetman, R. A. and H. W. DeHaven. 1982. Characterization of Airborne Radionuclides in UNC Facilities. UNI-2164, UNC Nuclear Industries, Richland, Washington.

A Level 1 Heading
THIS PAGE CONTAINS A LEVEL 1 HEADING WHICH ACTIVATES THE APPENDIX LETTER IN THE PAGE NUMBER. THE HEADING 1 STYLE MUST BE
MODIFIED IN ORDER TO CHANGE THE APPENDIX LETTER.
PLEASE RECYCLE THIS PAGE.

Appendix A
Glossary
Issued: September 30, 2000 PNNL-MA-860 Appendix A Supersedes: New Page A.1
Appendix A
Glossary
This glossary is a limited compilation of specialized terms used in this manual which are pertinent to internal dosimetry and, in particular, the Hanford Internal Dosimetry Program. It is not intended to be a general glossary of health physics or internal dosimetry definitions. For more detailed compilations or cross references for health physics definitions, see 10 CFR 835.2, the U.S Department of Energy Internal Dosimetry Program Guide (DOE 1999a), and the DOE Internal Dosimetry Standard (DOE 1999b). Most terms used in this manual are generally consistent with standard technical usage by the International Commission on Radiological Protection (ICRP), National Council on Radiation Protection and Measurements, Health Physics Society, DOE, and the Nuclear Regulatory Commission.
absorption type an ICRP 66 respiratory tract model concept describing the relative
speed of dissolution and translocation to blood of material within the respiratory tract. It is related to the physical chemistry of the material. The ICRP 66 model defines three absorption types: type F (fast solubilization), type M (moderate rate of solubilization), and type S (slow solubilization).
bioassay the determination of kinds, quantities, and, in some cases, locations
of radioactive material in the human body, whether by direct (in vivo) measurement or by indirect analysis of material removed or excreted from the body.
burden the instantaneous quantity of material in an organ or tissue of interest
(e.g., lung, bone surfaces, whole body, wound site). Same as retained quantity.
committed dose equivalent, HT,50 dose equivalent to an organ or tissue calculated for a 50-year period following an acute intake or onset of chronic intake. It does not include contributions from external dose.

PNNL-MA-860 Appendix A Issued: September 30, 2000 Page A.2 Supersedes: New
committed effective dose the effective dose equivalent calculated for a 50-year period equivalent, HT,50 following an acute intake or onset of chronic intake. It does not
include contributions from external dose. DAC-hours the time- and concentration-integrated exposure to airborne
radioactivity. Exposure to 1 DAC-hour implies the equivalent of one hour exposure to air at the DAC value.
decision level The quantity of material in a measurement above which the analyte
is interpeted as being present (i.e., analyte is detected). See Appendix B for discussion.
decorporation The chemical acceleration of the removal of radioactive atoms from
the body using chelating agents, which bind the atoms and cause them to be excreted.
deposition 1) process of material being initially retained from an intake, 2) the
material initially deposited at an entry site, 3) Hanford historical usage: the total input to an organ or tissue for a specified period of time. See also systemic deposition.
derived reference levels bioassay measurement values corresponding to retention or excretion
associated with an intake of the reference level. Derived reference levels are discussed in Section 2.12 of this manual and provided for nuclides in the respective chapters.
detection level a general term relating to the smallest amount of material detectable
as a function of the measurement method and instrument background. (The precise way that detection level has been used at Hanford has changed over the years. At times it has been defined as the minimum detectable activity, and at other times it has been defined as the decision level.)
inhalation class an ICRP 30 respiratory tract model concept describing the relative
rate of clearance from the pulmonary region of the lungs. ICRP 30 defined three inhalation classes for materials, class D (clearance half-time less than 10 days), class W (10 to 100 days), and class Y (greater than 100 days). Hanford has described a super-Y class as having a nominal clearance half-time of 10,000 days.
injection any means whereby the radioactive material is placed in direct
contact with the blood, excluding through the lung or gastrointestinal tract.

Issued: September 30, 2000 PNNL-MA-860 Appendix A Supersedes: New Page A.3
instantaneous uptake material translocated from a point of intake to the blood with essentially no delay. In concept, a direct injection to the blood.
intake The amount of a radionuclide that enters the body. For inhalation, it
is the material inhaled (including material that is subsequently exhaled). For material absorbed through the intact skin, it is the amount absorbed through the skin. For a wound or abraded skin, it is the amount absorbed through the skin; for practical purposes, it does not include material on the skin near the wound or material in the wound that is easily and promptly washed away. However, it does include material that is later removed by medical treatment if the time from deposition to treatment is deemed long enough to allow some material to reach the systemic circulation prior to treatment. Intake is independent of time.
in vivo refers to measuring radioactivity directly in a living organism. In
vivo is synonymous with the word “direct” when used in the phrase “direct bioassay.”
minimum detectable the smallest activity of a radionuclide in a sample (or organ) that wil activity, MDA be detected with a specified level of confidence. See Appendix B for
details. presystemic deposition a mathematical or schematic component (or components) of the
deposition at the entry site that is available for translocation to the blood. It excludes material that is permanently retained at the entry site or by the lymph system.
preview counter a standup whole body counter consisting of five NaI detectors. It is
the principal counter used for routine whole body counts and incident screening counts, provided good resolution of photopeaks is not needed.
reference level Hanford usage: a magnitude of intake used as a basis for some
action (see derived reference level). Reference levels are discussed in Section 2.12 of this manual and provided for nuclides in the respective chapters.
retained quantity synonymous with burden. retention the retained quantity (or burden) as a fraction of the uptake or intake.
It can apply to any organ, tissue, system of tissues (e.g., gastrointestinal or respiratory tracts) or to the whole body.

PNNL-MA-860 Appendix A Issued: September 30, 2000 Page A.4 Supersedes: New
systemic deposition Hanford historical usage: activity retained for an extended period of time in all systemic organs and tissue. Differs from uptake in that activity that stays in the transfer compartment and is ultimately excreted without going to systemic organs (for instance, because of chelation) is included in the term uptake but not in the term systemic deposition.
transfer compartment a mathematical or schematic representation of the blood circulation
system through which radioactive material is transported to organs, tissues, or excretion.
transportable material that is transferred from the site of initial deposition to the
blood. As applied to material in the lung, readily transportable material would be considered inhalation class D, whereas poorly transportable material would be inhalation class Y. It is generally equivalent to the term “soluble” as applied to human physiology, but it is not necessarily equivalent to chemical solubility in aqueous solutions.
transportability class Generic term used at Hanford to designate the respiratory tract
inhalation class or absorption type . uptake quantity of a radionuclide taken up by the systemic circulation or a
specified organ or tissue via the blood. Uptake can occur by direct injection into the blood, by absorption from compartments in the respiratory or gastrointestinal tracts, or by absorption through the skin or through wounds in the skin.
References 10 CFR 835.2. 1999. U.S. Department of Energy, “Occupational
Radiation Protection, Definitions.” U.S. Code of Federal Regulations.
U.S. Department of Energy (DOE). 1999a. Internal Dosimetry
Program Guide for Use with Title 10, Code of Federal Regulations, Part 835, Occupational Radiation Protection. DOE G 441.1-3, Washington, D.C.
U.S. Department of Energy (DOE). 1999b. Internal Dosimetry
Standard. DOE-STD-1121-98, Washington, D.C.

B Level 1 Heading
THIS PAGE CONTAINS A LEVEL 1 HEADING WHICH ACTIVATES THE APPENDIX LETTER IN THE PAGE NUMBER. THE HEADING 1 STYLE MUST BE
MODIFIED IN ORDER TO CHANGE THE APPENDIX LETTER.
PLEASE RECYCLE THIS PAGE.

Appendix B
Statistical Methods for Internal Dosimetry

Issued: September 30, 2000 PNNL-MA-860 Appendix B Supersedes: New Page B.1
Appendix B
Statistical Methods for Internal Dosimetry
The Hanford Internal Dosimetry Program (HIDP) uses statistical methods to interpret bioassay data. Some of the principal statistical methods used by the HIDP are described in this appendix, including those used to 1) determine when a sample result indicates the pres-ence of something (i.e., when the analyte is detected), 2) describe the overall capability of the bioassay method for continual assurance of detection of the analyte, 3) normalize data, and 4) fit data to retention or excretion functions to calculate intake. An additional issue is the determination that a detected analyte is significantly different from the normal presence of that analyte in a sample due to natural back-ground. This latter item is particularly important for uranium in urine and is discussed in that context in Chapter 7.0. The HIDP follows the concepts of critical level for decision, Lc, (also called the decision level, DL) and minimum detectable amount (or activity) MDA (also called detection level, Ld, or lower limit of detection, LLD in various publications), as described by Currie (1968; 1984), Brodsky (1986), the Health Physics Society (HPS 1996), and many others.
B.1 Decision Level The Lc is the parameter that is used to indicate that an analyte has been detected. The Lc is dependent on the probability of obtaining false positive results (i.e., the probability of a type I error) that one is willing to accept. Decision levels for in vivo measurements are determined as described in the In Vivo Monitoring Program Manual.(a) Decision levels for excreta samples are described below. Until April 2000, the decision levels by which excreta samples containing elevated quantities of radioactive material were identified were all specified in the contract with the analytical laboratory as absolute activity values. The contract specified an upper bound for
(a) Pacific Northwest National Laboratory (PNNL). In Vivo Monitoring Project Manual.
PNNL-MA-574, Richland, Washington. (Internal manual.)

PNNL-MA-860 Appendix B Issued: September 30, 2000 Page B.2 Supersedes: New
the MDA for each analysis—called the contract limit, CL—and established the decision level at one-half the CL. For most alpha spectrometry analyses the CL was 0.02 dpm per sample. The deci-sion level was applied to the activity result, rather than the count data. The detection criterion was therefore insensitive to sample specific variables such as chemical yield and detector efficiency. In order to select a better procedure, an investigation of the American National Standard HPS N13.30 (1996) and other proposed decision level equations was initiated. The investigation concluded that the N13.30 equation significantly underestimates the number of false positive results (MacLellan 2000). The maximum number of false positive results peaks at about one background count during the counting period, but remains significant up to an expected 100 counts. The N13.30 equation answers the question, “How large a net count will be expected, less than ‘alpha’ percent of the time, for a given background count rate if there is no activity in the sample?” An equation proposed by Altshuler and Pasternack (1963) was found to be far superior:
α++α
α=∆bn8
2k1
bn8k
bn2k1 (B.1)
where )1 is the decision level, kα is the false positive error term, and nb is the background count. That equation answers the question “How much activity can be in a sample, and the confidence interval for the net count still include zero?” The decision level obtained from the Altshuler and Pasternack equation remains unbiased down to an expected three counts during the counting period. For alpha spectrometry analyses, the concept of the Altshuler and Pasternack equation was adopted for the Hanford bioassay program, but an additional simplification was incorporated. Although the form of the equation investigated previously calculates the decision level based only on the number of expected background counts, the original form of the equation used in the derivation equates the decision level with a multiple of the standard deviations estimate of a net count value ()1). That is, the decision level is derived from the following equation: bn21kbngnk1 +∆α=+α=∆ (B.2)

Issued: September 30, 2000 PNNL-MA-860 Appendix B Supersedes: New Page B.3
where (ng + nb) is used as the estimate of the net count variance, ng is the gross count, and nb is the background count. Equation B.1 was derived by solving Equation B.2 for )1. Hanford denotes the decision level by Lc, rather than the )1 used in Equations B.1 and B.2. Equations B.1 and B.2 are based on counts, however, the Hanford bioassay contract requires an estimate of the total propagated uncertainty (TPU) for each result reported. A sample specific decision level has been implemented based on the TPU. Rather than using Equation B.1, Hanford alpha spectrometry decision levels are set from Equation B.2, substituting the TPU for the radical. A k∀ value of 2 was chosen in order to maintain the average decision level near historic levels. The decision level, Lc, then takes the following simple form: TPU2Lc ×= (B.3) Any sample result that is equal to or greater than the Lc is considered positive, i.e., the analyte has been detected. It is inherent in this method that when dealing with large numbers of samples some samples containing no activity will be declared positive. Using the above criteria, about two percent of the results are expected to be false positives assuming a normal distribution of the net count.
B.2 Minimum Detectable Amount The minimum detectable amount (or activity), MDA, provides a statement of the overall capability of the bioassay method to provide continual assurance of analyte detection. The MDA is a function of the probabilities of both false positive and false negative (type II error) results. For excreta bioassay results, the probability of each kind of error is set at 5%. The MDA is determined annually from analysis of blank samples, using the methods of HPS N13.30 (1996). Annual MDAs are compared with values set by contract with the bioassay laboratory. (The MDAs must be less than contractual detection levels or corrective action is required.) It is the contractual detection levels that are referenced throughout this document because only the contractual detection levels are enforceable and are generally applicable over long periods of time. At any time though, actual MDAs are usually somewhat lower than the contractual detection levels quoted in this document.

PNNL-MA-860 Appendix B Issued: September 30, 2000 Page B.4 Supersedes: New
Determinations of in vivo measurement MDAs are described in the In Vivo Monitoring Program Manual.(a)
B.3 Normalization of Excreta Bioassay Data Excreta bioassay data may be normalized differently according to the type of the sample. Generally, urine data are normalized to total 24-hour excretion based on the sampling protocol. Total urine sampling for 24 hours does not require normalization, however, that protocol is generally not convenient for workers. Thus, an approxi-mate 24-hour sample is generally used. The approximate 24-hour sample protocol (historically referred to as a “simulated 24-hour collection”) involves collecting all urine voided between one-half to one hour before retiring at night through the first voiding after getting up in the morning, this done for two consecutive nights. Provided the sample is collected properly, a total or approximate 24-hour urine sample result is used as is; no further normalization is done. An overnight sample is considered to represent approximately 12 hours of urine collection, and is normalized by doubling the result. Alternate normalization methods are described in Chapter 2.0, and may be used if they are more appropriate for the actual data.
B.4 Treatment of Recounted Data Before Using It with Once-Counted Samples
Results from samples that have been recounted should not be used directly with results from once-counted samples in analysis programs such as CINDY. The best estimate of the mean value of the recounted sample and the best estimate of the uncertainty of the mean value need to be determined first so that each sample has only one value. The mean value (xavg) should be determined by the following formula for a weighted average:
∑
∑
=
== n
1i2i
n
1i2i
i
avg
s1sx
x (n is usually 2 or 3) (B.4)
(a) Pacific Northwest National Laboratory (PNNL). In Vivo Monitoring Project Manual.
PNNL-MA-574, Richland, Washington. (Internal manual.)

Issued: September 30, 2000 PNNL-MA-860 Appendix B Supersedes: New Page B.5
where xi is each measurement result and si is the total propagated uncertainty associated with the measurement. The best estimate of the uncertainty of the mean value should be determined by the following formula for a weighted uncertainty:
∑=
= n
1i2i
avg
s1
1s (B.5)
This approach provides consistency in the way recounted sample data are used in dose assessments, and prevents recounted data from acquiring unwarranted weight relative to once-counted data for curve-fitting purposes.
B.5 Curve-Fitting Techniques When multiple data of a similar nature (e.g., urine results) are obtained following an intake, some kind of curve fit is performed to fit an appropriate retention or excretion function to the data. The CINDY computer code (Strenge et al. 1992) is most commonly used for the fitting of data, and the fitting algorithms available in that code are briefly discussed in Appendix D. A recent study has shown that the “average of the slopes” fit method in CINDY is preferred if the predominant variance comes from the biology and not sample analysis (Skrable 2000). Alternatively, simple data fits may be accomplished using one of the following techniques. The weighted least-squares fit is appropriate when two results of the measurement process are known—the result itself (whether zero, negative, or positive), xi, and its variance, σ2—and when the variances are all determined in the same manner. The weighting factor is the inverse of the sum of the variances. The intake is given by
∑
∑
=
=
σ
σ=n
1i2i
2i
n
1i2i
ii
r
rx
I (B.6)

PNNL-MA-860 Appendix B Issued: September 30, 2000 Page B.6 Supersedes: New
where ri is the value of the fractional retention or excretion function at the same time after intake as the sample result xi (Bevington 1969). Use of the weighted least-squares fit avoids having the calculation of intake or uptake dominated by a few large data points that may have poor precision, such as a hastily analyzed urine sample collected shortly after an intake. If the variances are unknown, are known to be equal, or were determined differently (such as counting uncertainty versus total propagated uncertainty), then the unweighted (or uniform weighting) least-squares fit is appropriate for use. The unweighted least-squares fit is represented by Equation B.6 when all variances are set equal to one, or as shown below:
∑
∑
=
== n
1i
2i
i
n
1ii
r
rxI (B.7)
Data that are listed only as “less than” some value are difficult to use in a mathematical fitting technique. At times, the HIDP has arbitrar-ily set the value for the measurement as one-half of the less-than value for use in least-squares fitting techniques. This does not work well if too many of the data are less-than values. If there are many less-than values and a few well-known data, then the dosimetrist may need to use only the well-known data in the least-squares fitting technique, making sure that the best fit does not seem unreasonable with regard to the many less-than data. An “eye-ball” fit consists of plotting a line through a data set and graphically extracting the required intercepts and slope. This approach involves subjective judgment by the dosimetrist and is not an objective statistical fit. An “eye-ball” fit may be necessary if too many data are “less-than” values or if the analytical sensitivity varied greatly from datum to datum. Caution must be used in exercising eye-ball fits, because the quality of data obtained will vary depending on the type of axis (linear, logarithmic). In all cases, outliers, or data that are not relevant to the equation being fit, should not be included in a fitting technique. Examples would include urine data influenced by diethylene triamine penta

Issued: September 30, 2000 PNNL-MA-860 Appendix B Supersedes: New Page B.7
acetic acid (DTPA) therapy or a datum with a very high less-than result. The assessment should document which data are being ignored and why.
B.6 References Altshuler, B., and B. Pasternack. 1963. “Statistical measures of the lower limit of detection of a radioactivity counter.” Health Phys. 9:293-298. Bevington, P. R. 1969. Data Reduction and Error Analysis for the Physical Sciences, pp. 69-73. McGraw-Hill Book Company, New York, New York. Brodsky, A. 1986. Accuracy and Detection Limits for Bioassay Measurements in Radiation Protection. NUREG-1156, U.S. Nuclear Regulatory Commission, Washington D.C. Currie, L. A. 1968. “Limits for qualitative detection and quantitative determination.” Analytical Chemistry 40(3):586-593. Currie, L. A. 1984. Lower Limit of Detection: Definition and Elaboration of a Proposed Position for Radiological Effluent and Environmental Measurements. NUREG/CR-4007, U.S. Nuclear Regulatory Commission, Washington D.C. Health Physics Society (HPS). 1996. Performance Criteria for Radiobioassay. HPS N13.30-1996. An American National Standard approved by American National Standards Institute, Health Physics Society, McLean, Virginia. MacLellan, J. A. 2000. Hanford’s Decision Level for Alpha Spectrometry Bioassay Analyses Based on the Sample Specific Total Propagated Uncertainty . PNNL-SA-33598, Pacific Northwest National Laboratory, Richland, Washington. Skrable, K. 2000. “Variance models for estimating intakes from bioassay data.” HPS Newsletter, XXVIII (4):18-20. Health Physics Society, MacLean, Virginia. Strenge, D. L., R. A. Kennedy, M. J. Sula, and J. R. Johnson. 1992. Code for Internal Dosimetry (CINDY Version 1.2), Part 1: Conceptual Representation. PNL-7493 Pt. 1, Rev. 1., Pacific Northwest National Laboratory, Richland, Washington.

C Level 1 Heading
THIS PAGE CONTAINS A LEVEL 1 HEADING WHICH ACTIVATES THE APPENDIX LETTER IN THE PAGE NUMBER. THE HEADING 1 STYLE MUST BE
MODIFIED IN ORDER TO CHANGE THE APPENDIX LETTER.
PLEASE RECYCLE THIS PAGE.

Appendix C
Biokinetic Models

Issued: September 30, 2000 PNNL-MA-860 Appendix C Page C.1
Appendix C
Biokinetic Models
Biokinetic models are used to describe the initial deposition, and subsequent movement and retention of material throughout the body. The Hanford Internal Dosimetry Program (HIDP) seeks to use realistic and generally accepted, peer-reviewed biokinetic models to the extent practicable. The specific models used for various elements are detailed in the various chapters of this manual. General models applicable to any element include the respiratory tract and gastrointestinal (GI) tract models, which are described in this appendix.
C.1 ICRP Respiratory Tract Model
The HIDP uses the International Commission on Radiological Protection (ICRP) publication 30 (1979) Respiratory Tract Model shown in Figure C.1. The deposition fractions, DN-P, DT-B, and DP, as given in Figure C.1, apply to an aerosol with an activity median aerodynamic diameter (AMAD) of 1 µm. Figure C.2, also from ICRP 30, shows how the deposition fractions vary as a function of AMAD. Deposition fractions for particle sizes other than 1 µm may be estimated from Figure C.2, may be obtained from Table C.1, or may be determined using the CINDY computer code. From Figure C.2, it is evident that DN-P and DP change with particle size, whereas DT-B is essentially constant at 0.08 over the respirable particle size range.
Other respiratory tract models of interest include the ICRP 66 human respiratory tract model (ICRP 1994) and the National Council on Radiation Protection and Measurements Report No. 125 model (NCRP 1997). Although the ICRP 66 model has received considerable international acceptance for both technical and regulatory applications, the HIDP has not sufficiently evaluated the tool for implementation.

PNNL-MA-860 Appendix C Issued: September 30, 2000 Page C.2
Figure C.1. Mathematical Model Used to Describe Clearance from the Respiratory System (The values
for the removal half-times, Ta-j and compartmental fractions, Fa-j, are given in the tabular portion of the figure for each of the three classes of retained materials. The values given for DN-P, DT-B, and DP [left column] are the regional depositions for an aerosol with an AMAD of 1 µm. The schematic drawing identifies the various clearance pathways from compartments a-j in the four respiratory regions, nasal passages [N-P], tracheal-bronchial tree [T-B], pulmonary [P], and lymph nodes [L].)

Issued: September 30, 2000 PNNL-MA-860 Appendix C Page C.3
Figure C.2. Deposition of Dust in the Respiratory System (The percentage of activity or mass of an
aerosol that is deposited in the N-P, T-B, and P regions is given in relation to the AMAD. The model is intended for use with aerosol distributions with AMADs between 0.2 and 10 µm and with geometric standard deviations of less then 4.5. Provisional estimates of deposition further extending the size range are given by the dashed lines. For an unusual distribution with an AMAD of greater than 20 µm, complete deposition in the N-P region can be assumed. The model does not apply to aerosols with AMADs of less than 0.1 µm.)

PNNL-MA-860 Appendix C Issued: September 30, 2000 Page C.4
Table C.1. Deposition Fractions as a Function of Aerosol AMAD(a)
Deposition Fractions AMAD, µm N-P(b) P(c)
0.2 0.050 0.50 0.3 0.088 0.43 0.4 0.13 0.38 0.5 0.16 0.34 0.6 0.19 0.32 0.7 0.23 0.30 0.9 0.26 0.28 1.0 0.30 0.25 2.0 0.50 0.17 3.0 0.61 0.13 4.0 0.69 0.10 5.0 0.74 0.088 6.0 0.78 0.076 7.0 0.81 0.067 8.0 0.84 0.060 9.0 0.86 0.055
10.0 0.87 0.050 (a) From NUREG/CR-1962, p. 25 (Eckerman, Watson,
and Ford 1981). The deposition fraction for the T-B region is 0.08, independent of AMAD.
(b) N-P = nasal-passage region. (c) P = pulmonary region.
C.2 The Gastrointestinal Tract Model
The HIDP uses the ICRP 30 (1979) GI Tract Model shown in Figure C.3. The model is integral to the CINDY computer code. The fraction of material passing through the GI tract that is absorbed into the blood is defined as the f1 factor and specific values are reported in the various radioelement chapters of this manual. This model assumes that uptake to blood within the GI tract only occurs from the small intestine (SI). An absorption rate to the blood from the GI tract can be calculated as follows:
1
SI1f1
fB −
λ=λ (C.1)
where λSI is assumed to be 6 d-1.

Issued: September 30, 2000 PNNL-MA-860 Appendix C Page C.5
Figure C.3. Biokinetic Model for the Gastrointestinal Tract (From ICRP 30 [1979]) C.3 Fecal Sampling Model
Fecal sampling can be a valuable aid for estimating the magnitude of an inhalation intake. Through application of the lung and GI tract models (ICRP 1979), estimates can be made of the expected daily fecal excretion following an inhalation intake. For class W and class Y radionuclides, the expected fecal excretion can be divided into two components: that which represents rapid clearance from the respiratory tract and that which represents longer-term clearance from the pulmonary region of the lung. Measurement of the quantity of a class W or Y radionuclide excreted via feces in the rapid clearance phase (first few days following an intake) can provide an early estimate of intake that is often more sensitive than other

PNNL-MA-860 Appendix C Issued: September 30, 2000 Page C.6
bioassay measurements. This estimate may be especially helpful for class Y radionuclides with little absorption from the GI tract and for which in vivo counting is difficult, e.g., class Y forms of plutonium, uranium, and 147Pm. Additionally, fecal sampling during the rapid clearance phase may be helpful with more readily transported forms when the use of therapeutic methods invalidates the use of normal systemic retention or excretion models, e.g., during chelation therapy.
Figure C.4 shows the expected daily fecal excretion as a fraction of intake of 1-µm-AMAD particles for class W (curve A) and class Y (curve B) material for which radioactive decay, uptake from the GI tract, and systemic excretion to the GI tract are negligible (from NUREG/CR-4884 [Lessard et al. 1987] using 239Pu as the model). Nearly half of the intake is excreted via feces in the first 5 days, which makes fecal sampling a very sensitive indicator of intake at that time. Excretion during the next 5 to 10 days decreases rapidly, and the daily excretion beyond about 15 days is relatively constant, representing the slowly clearing component from the pulmonary region. Note that excretion during the rapid clearance phase is
Figure C.4. Daily Fecal Excretion of Plutonium as a Fraction of Inhalation Intake for Three Intake Scenarios (all 1-µm-AMAD particle size)
A – inhalation of 1 unit of class W plutonium B – inhalation of 1 unit of class Y plutonium C – inhalation of 1 unit and ingestion of 1 unit of class Y plutonium

Issued: September 30, 2000 PNNL-MA-860 Appendix C Page C.7
relatively independent of inhalation class, and that excretion after about 10 days is unaffected by ingestion that may have occurred along with the inhalation.
Table C.2 lists fecal excretion fractions and accumulated fractional excretion during the rapid clearance phase for the material described in the above paragraph (Lessard et al. 1987). Use of the accumulated fecal excretion data in Table C.2 may be preferred over use of the daily fractional excretion data because of the difficulty in collecting (or at least in knowing that you have collected) a day’s excretion. (See below for pitfalls discussion of this problem.) Because of problems discussed below, fecal sampling is best used in combina-tion with other bioassay measurements. When the quality of data from the other bioassay measurements is good, e.g., the data are not near the detection level or are not biased by the effects of medica-tion, then preference should be given to estimates of intake from the other bioassay measurements. However, for moderately or poorly absorbed radionuclides, fecal sampling during the first few days after an inhalation intake is a very sensitive indicator. The extent of use of fecal sampling depends on the expected severity of the intake. For intakes that are estimated (based on workplace monitoring) to result in a committed effective dose equivalent of less than 100 mrem, or for situations where confirmation that an intake did not occur is desired, two fecal samples collected from 24 to 72 hours after the potential intake are recommended. If the samples show significant detectable activity (e.g., implying a dose greater than 100-mrem), additional bioassay measurements should be
Table C.2. Fraction of Intake Excreted via Feces Following an Acute
Inhalation of Poorly Absorbed Material(a)
Intake Fraction Excreted During Interval 1-µm-AMAD 5-µm-AMAD 1-µm-AMAD 5-µm-AMAD
Days Post Intake Class
W Class
Y Class
W Class
Y Class
W Class
Y Class
W Class
Y 1 ( 0 – 24 hours) 0.044 0.054 0.091 0.106 0.044 0.054 0.091 0.106 2 (24 – 48 hours) 0.13 0.160 0.26 0.30 0.17 0.21 0.35 0.41 3 (48 – 72 hours) 0.11 0.130 0.20 0.23 0.28 0.34 0.55 0.64 4 (72 – 96 hours) 0.063 0.071 0.11 0.12 0.35 0.42 0.66 0.76 5 (96 – 120 hours) 0.033 0.035 0.048 0.053 0.38 0.45 0.71 0.81
(a) Modeled using 239Pu with f1 factors as given in Section 8.2.2.

PNNL-MA-860 Appendix C Issued: September 30, 2000 Page C.8
obtained, including additional fecal samples collected from 20 to 100 days post intake, after early clearance to aid in distinguishing ingestion, class W, or Y components. In some situations these additional fecal samples may still be more sensitive to intake than other bioassay measurements, but special care is necessary to avoid further small intakes prior to collection of these additional samples. Samples collected after 5 to 7 days post intake show a marked decrease in sensitivity to intake detection. If workplace monitoring results indicate a more serious intake, all fecal excretion from about 6 to 72 hours post intake should be collected. The total result from all samples collected during this period is divided by the fractional accumulated excretion for the first 3 days post intake to provide an estimate of intake. Table C.2 can be used for isotopes of plutonium and uranium (also other radionuclides where GI absorption and radioactive decay can be neglected); NUREG/CR-4884 (Lessard et al. 1987) can be used for other radionuclides (1-µm-AMAD particles only). The fecal samples obtained after 20 days post intake can help deter-mine the inhalation class and clearance rate from the pulmonary region to the GI tract. But recognize that, despite appearances in the ICRP lung model, the clearance rate from the pulmonary region to the GI tract (compartment g) is not necessarily identical to the clear-ance rates from the pulmonary region to the blood or lymph system (compartments e and h). Urine data provide the best estimates of the latter clearance rates. Lacking good urine data, default values should be used. For example, if fecal data indicate a long-term clearance half-time of 400 days and urine data are lacking or are not definitive, the material should be assumed to be class Y and clearance half-times of 500 days should be used for compartments e and h.
Reference Man (ICRP 1974) excretion for adult’s ranges from 60 to 500 g/day, with a recommended average of 135 g/day for an adult male and 110 g/day for an adult female. Note that these values represent excretion “per day” not excretion “per bowel movement.” When a single bowel movement is collected, it is generally interpret-ed as representing excretion for 1 day. If the sample is greater than 60 g, no normalization is used. If the sample is less than 60 g, the sample results should be normalized to 135 g for males and 110 g for females. If total accumulated excretion over a time period was requested and there is no apparent reason to suspect that total excre-tion was not provided, then all sample results should be used as is, without regard for the mass of individual samples. If excretions

Issued: September 30, 2000 PNNL-MA-860 Appendix C Page C.9
were missed during the time period, then normalization of the total mass to the total mass expected based on the reference values given above should be used.
There are problems with interpretation of fecal data for which the dosimetrist needs to stay alert. One is the possibility of interference by ingested material. In Figure C.4, curve C shows the expected daily fecal excretion from a unit intake of class Y material by inhalation and a unit intake by ingestion. Note that curve C follows the same general shape of the other curves, and hence a combined inhalation/ ingestion intake of nearly equal proportions would not be readily discernible using early fecal data. Also note that the influence of the ingestion remains significant until about 8 days post intake. The accumulated fecal excretion in the first 3 days from this intake would be 3.5 times the accumulated fecal excretion from inhalation alone, and hence the estimate of intake determined in this manner would be 3.5 times too great. The point is that because ingested material contributes in toto to fecal excretion, it has a magnifying effect on the determination of inhalation intake. For sufficiently large intakes, this problem can be overcome by sampling during the slow clearance phase. Interpretation of fecal data is also sensitive to the size of the particles inhaled. For example, Figure C.5 shows fractional daily excretion for class W and class Y plutonium for 3- and 8-µm-AMAD particles. In these cases collection of the first 3 days’ feces and assumption of 1-µm-AMAD particles would result in overestimation of the intake by 1.7 and 2.2 for intakes actually involving class W 3- and 8-µm-AMAD particles, respectively, and by 1.6 and 2.0 for class Y 3- and 8-µm-AMAD particles, respectively. Additional error would then be made in the calculation of doses to the lung and systemic organs because the fraction of intake deposited in the pulmonary region of the lung and/or transferred to the blood would be overestimated also. Another difficulty arises from single-voiding samples. These are generally easier to obtain than total excretion over a specific period. But both inter- and intra-individual variation in the regularity of bowel movements can introduce large uncertainties if a single void-ing is used to represent daily excretion. Normalization by mass can help reduce error when a single sample represents a fraction of a day’s excretion, but it does not help when a single sample represents excretion for several days.

PNNL-MA-860 Appendix C Issued: September 30, 2000 Page C.10
Contamination of a fecal sample by urine should be avoided, but generally will not introduce significant error if it occurs. For uranium, natural daily ingestion (about 2 µg but variable [ICRP 1979]) needs to be taken into account.
Figure C.5. Daily Fecal Excretion of Plutonium as a Fraction of Inhalation
Intake for Four Intake Scenarios A – class W, 3-µm-AMAD particles B – class W, 8-µm-AMAD particles C – class Y, 3-µm-AMAD particles D – class Y, 8-µm-AMAD particles
C.4 References
Eckerman, K. F., S. B. Watson, and M. R. Ford. 1981. Internal Dosimetry Data and Methods of the ICRP Part 2, Volume 1: Committed Dose Equivalent and Secondary Limits. NUREG/CR-1962, U.S. Nuclear Regulatory Commission, Washington, D.C. International Commission on Radiological Protection (ICRP). 1974. Report of the Task Group on Reference Man. ICRP publication 23. Pergamon Press, New York.

Issued: September 30, 2000 PNNL-MA-860 Appendix C Page C.11
International Commission on Radiological Protection (ICRP). 1979. “Limits for intakes of radionuclides by workers.” (ICRP publication 30, part 1). Annals of the ICRP, 2:3/4. Pergamon Press, New York. International Commission on Radiological Protection (ICRP). 1994. “Human respiratory tract model for radiological protection.” (ICRP publication 66). Annals of the ICRP, 24:1-3. Pergamon Press, New York. Lessard, E. T., X. Yihua, K. W. Skrable, G. E. Chabot, C. S. French, T. R. La Bone, J. R. Johnson, D. R. Fisher, R. Belanger, and J. L. Lipsztein. 1987. Interpretation of Bioassay Measurements. NUREG/CR-4884, U.S. Nuclear Regulatory Commission, Washington, D.C. National Council on Radiation Protection and Measurements (NCRP). 1997. Deposition, Retention, and Dosimetry of Inhaled Radioactive Substances. NCRP Report No. 125, Bethesda, Maryland.

D Level 1 Heading
THIS PAGE CONTAINS A LEVEL 1 HEADING WHICH ACTIVATES THE APPENDIX LETTER IN THE PAGE NUMBER. THE HEADING 1 STYLE MUST BE
MODIFIED IN ORDER TO CHANGE THE APPENDIX LETTER.
PLEASE RECYCLE THIS PAGE.

Appendix D
Computer Codes

Issued: September 30, 2000 PNNL-MA-860 Appendix D Supersedes: New Page D.1
Appendix D
Computer Codes
Computer codes are important to internal dosimetry because of the number and complexity of biokinetic models used for bioassay interpretation and dose assessment. The models have to factor in basic radiological decay parameters, intake parameters such as particle size and breathing rate, initial deposition within the body, subsequent distribution and translocation within body organs and tissues, excretion pathways, energy absorption in a target tissue from a radionuclide decay in a source tissue, and the various tissue weighting factors. An appropriate data-fitting routine is required for assessment of bioassay data and codes need various output routines to display data in useful formats such as reports and graphs. The Hanford Internal Dosimetry Program (HIDP) has several computer programs at its disposal to aid with internal dosimetry evaluations. These programs are listed below and discussed in the following sections:
• CINDY
• PUCALC
• AMERIN
• PU.EXE The HIDP maintains historical archives of computer codes used. This appendix only addresses codes in current use. In addition to the currently used codes, the HIDP may have codes that are undergoing consideration or testing but are not used for formal Hanford applica-tions. Also, common commercially available spreadsheet and database software are not described here.
D.1 CINDY
The Code for INternal DosimetrY (CINDY) is the principal computer code used by the HIDP for dosimetry. The code can do intake calculations based on curve-fitting of bioassay data; calculate committed (or any specified interval) organ, tissue, and effective dose equivalents; and make bioassay projections. The wide range of radionuclides encompassed by the code library includes all those

PNNL-MA-860 Appendix D Issued: September 30, 2000 Page D.2 Supersedes: New
addressed by this manual. A two-part manual details the conceptual models used by the code (Strenge et al. 1992a) and provides a user’s guide to loading and executing the code (Strenge et al. 1992b). The HIDP currently uses Version 1.4. The code was developed at Pacific Northwest National Laboratory (PNNL) in the late 1980s and early 1990s under U.S. Department of Energy (DOE) funding specifically for implementing the dose provisions originally specified in DOE 5480.11 (1988). It is commercially available through Canberra Nuclear, Inc.(a) The code was originally designed for a DOS-based personal computer. The HIDP has also used the code on WINDOWS 3.1, WINDOWS 95, and WINDOWS 98 platforms. Difficulty was encountered when installing the code onto a WINDOWS 98 machine from the original disks. This was overcome by copying the files directly from a WINDOWS 95 machine. Initial attempts to install the code on a WINDOWS 2000 platform have been problematic.
D.1.1 Models Included in CINDY CINDY incorporates the International Commission on Radiological Protection publication 30 (ICRP 1979) models for radionuclides, but permits modification of many parameters. Identification of some of the key adjustable parameters is discussed below. The exposure scenario options permit inhalation, ingestion, and direct intake (which can be considered as either absorption through skin or wound injection). Inhalation and ingestion intakes use the ICRP 30 models. Inhalation permits use of class D, W, or Y, or any combination thereof, and allows for specification of particle size. Ingestion may be of soluble or insoluble forms (with user-variable f1 factors). Direct intake allows uptake to blood from one or more independent compartments, each exhibiting a user-defined clearance half-time to blood. Exposures may be either acute (instantaneous) intakes or chronic (continuous over a user-specified interval). The respiratory tract model permits adjustment of both the compartment fraction and clearance half-time for the individual compartments of the ICRP 30 model. Regional deposition fractions for the nasal-pharengeal, tracheobronchial, and pulmonary regions are set by the code based on the particle size specified. The gastrointestinal (GI) tract model permits adjustment of the mean resident times (in hours) for the stomach, small intestine, upper large
(a) Canberra Nuclear, Inc., One State Street, Meriden, CT. 06450. Phone (203) 238-2351.

Issued: September 30, 2000 PNNL-MA-860 Appendix D Supersedes: New Page D.3
intestine, and lower large intestine. Absorption within the GI tract is established by setting the GI uptake (f1) factor for individual radionuclide biokinetic models. Systemic distribution, retention, and excretion models are provided based on chemical elements. Typically the parameters for distribution compartment fractions and clearance half-times are adjustable by the user. The default model used by CINDY for most elements is the ICRP 30 model, however element-specific models are also provided for iodine, alkaline earths, radium/radon, tritium, carbon, tellurium/iodine, and uranium. The GI uptake (f1) factor is an element-specific variable. Detailed descriptions of the specific models are contained in Part 1 of the CINDY manual (Strenge et al. 1992a)
D.1.2 Bioassay Data Input The excretion models used by CINDY are based on daily excretion rates. Because bioassay data are often provided using different formats, protocols for automatically manipulating data to give total daily bioassay values are incorporated into CINDY. The user must be aware of these protocols, otherwise biased conclusions can be reached by unanticipated, unrecognized, or unintended data adjust-ment. Table D.1 contains the CINDY bioassay data normalization protocols.
Table D.1. CINDY Normalization Protocols for Biosassay Data
Input Data Sample Period
Sample Volume Manipulation for Daily Result Used in Curve Fitting
Total activity units Unknown (no input)
Unknown (no input)
Sample is assumed to be 1-day excretion. No data normalization.
Total activity units Known (input)
Unknown (no input)
Sample is normalized to 24-hour period.
Total activity units Unknown (no input)
Known (input)
Sample is normalized using reference daily volume.
Total activity units Known (input)
Known (input)
Sample is normalized to 24-hour period. Volume ignored.
Concentration units Unknown (no input)
Unknown (no input)
Concentration assumed for one day and daily result calculated based on reference daily volume.
Concentration units Known (input)
Unknown (no input)
Daily result is calculated based on reference daily volume. Period ignored.
Concentration units Unknown (no input)
Known (input)
Concentration assumed for one day and daily result calculated based on reference daily volume.
Concentration units Known (input)
Known (input)
Concentration multiplied by volume and normalized by period to give daily result.

PNNL-MA-860 Appendix D Issued: September 30, 2000 Page D.4 Supersedes: New
On the other hand, bioassay projection values, based on user-input intake values, are provided as instantaneous rates, so for the first few days after an intake, CINDY-generated excretion rates will not be exactly representative of total 24-hour excretion.
D.1.3 Intake Assessment Curve-Fitting Routines Four methods for intake assessment by curve-fitting of bioassay data are included in CINDY. All are based on assumptions about the variance of the measurement value. Brief descriptions of the techniques are given below. The unweighted least-squares (or uniform weighting) method assumes that weighting factors are constant and equal, implying that the variance is independent of the measurement magnitudes. This method is appropriate if all measured values are believed to have similar accuracy and are significantly above the detection limits of the measurement method. The ratio of the means (or weighted least-squares) method assumes that data point weighting factors are inversely proportional to the expected value, implying that the variance is proportional to the magnitude of the expected value. This method avoids having the calculation dominated by a few large data points that may have poor precision. The average of the slopes method assumes data point weighting factors are inversely proportional to the square of the expected value, implying that the variance is proportional to the square of the expected value. This method is appropriate when the variance is due primarily to biological factors rather than the detection precision of the measurement. CINDY also has a user-defined weighting method in which the user supplies the estimate of variance for each measurement value. The weighting factors are calculated by CINDY as the inverse of the supplied variance.
D.1.4 Dose Calculation CINDY calculates organ and tissue doses by determining the number of radionuclide transformations in a source organ or tissue over the time frame of interest (i.e., the time-integrated activity) and multiplying it by the specific effective energy (SEE) factor for the appropriate source-to-target combination contained in the code

Issued: September 30, 2000 PNNL-MA-860 Appendix D Supersedes: New Page D.5
library. The library SEE factors were obtained from the Oak Ridge National Laboratory (ORNL) modeling group that developed them for ICRP 30.
D.1.5 Acceptance Testing by the HIDP Prior to its initial adoption in 1991 at Hanford, the CINDY Code underwent extensive testing and benchmarking by the HIDP. It was compared with the standard Hanford code then being used (GENMOD) and was found to be in reasonable agreement. The 1995 revision to CINDY (Version 1.4) also underwent HIDP testing prior to acceptance.
D.1.6 HIDP User Experience with CINDY After 9 years of using CINDY, the HIDP has identified a number of caveats and recommendations for its use. Among them are the following: • Don’t mix intake units for different radionuclides in the same
calculation. All units have to be the same. • CINDY automatically uses three types of curve-fitting routines
to determine intake from bioasaay data, and it allows for the user to insert a fourth method. Experience has not shown that any one method is always best. The user should carefully review the plot of the various fits to the actual data before choosing an intake value. An average intake value may be acceptable if none of the fits appear to be the best choice. The intake assessment mode data-plotting routine plots only those data used in a “connect-the-dots” straight-line approach. The bioassay projec-tion mode shows the actual retention pattern, but does not show the bioassay data points themselves.
• Using the user-defined inverse variance method for curve-fitting
can result in the greatest weight being given to data that show no detectable activity, even though bracketed by data showing detectable activity. Caution is needed no matter which curve-fitting scheme is used.
• The end time for a chronic intake cannot be given as 12/31/xxxx
24:00 or as 01/01/xxxx 00:00 (the exact end or start of a year). The end time must be offset by at least one minute if the end time is the actual end of the year. Otherwise, the year of the specified end time will not be reported in the calendar year results and a 2-year period will be used in its place.

PNNL-MA-860 Appendix D Issued: September 30, 2000 Page D.6 Supersedes: New
• The maximum number of report times allowed for a calculation is 70 (69 for continuous intakes). More data may be inputted, but some must then be flagged to reduce the total number of data points used in any given calculation to 70.
• In the bioassay projection mode, including a report time of “0”
can eliminate reporting of some organs that might be of interest (e.g., thyroid retention for iodines, bone surface for uranium, plutonium). If retention for a time immediately post intake is needed, 0.1 or 0.01 day can be used and will provide results for the full scope of organs and tissues included in the nuclide library.
• Bioassay projections for accumulated excretion values for early
times post intake can be obtained by running the bioassay projection mode using increments of 0.1 day for the first few days of interest and summing the resulting instantaneous excretion rates over the period of interest.
• For tritium, the inhalation intake mode automatically factors in a
skin absorption component equal to 50% of the inhalation. Thus, the total uptake from an inhalation is 1.5 times the inhalation intake.
• When two uranium isotopes are flagged as isotopes of concern,
the intake assessment mode calculates the intake of the first correctly, but not the second. Run the uranium isotopes separately in the intake assessment mode.
• Ingrowth of 241Am from 241Pu is not accounted for in the intake
assessment mode. Don’t use long-term 241Am in the lung to determine plutonium intakes if 241Am ingrowth is a potential concern. Ingrowth is appropriately addressed in the bioassay projection mode.
• The error tolerance setting should be 1E-06 or 1E-07 when
performing analyses using the Jones or Durbin excretion models. Instabilities can occur in the intake assessment or bioassay projection modes using the Jones or Durbin excretion models, usually at times following intake on the order of 1,000 to 10,000 days. The instabilities are easily observed in the display graphic results to screen mode. If instabilities are observed, rerun the case with a different error tolerance. Generally 1E-06 will provide acceptable results; be cautious of 1E-08.

Issued: September 30, 2000 PNNL-MA-860 Appendix D Supersedes: New Page D.7
D.2 PUCALC Family PUCALC is a family of computer codes developed by the HIDP in the mid-1980s to simplify the process of determining the presystemic deposition of plutonium in an individual, based on urine data. The code uses the Jones excretion model to allow matching of observed excretion data to predicted excretion by varying the presystemic deposition magnitude and the its transfer rate into the systemic compartment. The PUCALC program creates a database of urine sample results. PCPLOT graphs the data points on the computer screen using a log-log scale, and upon input of values for presystemic deposition and transfer rate, overlays a curve on the screen. By iteration, the dosimetrist can quickly compare many different combinations and subjectively select a preferred fit. With the adoption of CINDY, the PUCALC family became seldom used, though it does include capability for addressing multiple intakes, which CINDY lacks. Much of the PUCALC family has been rendered obsolete by advances in personal computer (PC) technology and the code is seldom used now. No effort has been made to update the family to advanced microprocessors beyond the 486 and Pentium.
D.3 AMERIN
The AMERIN code is used for calculating the biological half-life and ingrowth for mixtures of 241Am and 241Pu. The code is executable on a PC from a WINDOWS 95 or 98 environment. It can calculate the biological clearance half-time from a single compart-ment using 241Pu and 241Am activities, or alternatively, calculate the activity of 241Am at various times after intake when the biological half-time is given. The code was developed by the HIDP for use primarily with in vivo measurement data.
D.4 PU.EXE
PU.EXE is a plutonium utility developed at Hanford to calculate information about mixtures of plutonium isotopes. The HIDP uses it to show the isotopic composition of plutonium mixtures by weight, total mass, and total activity, and then age those mixtures and recompute the compositions. Heat generation rates, neutron production rates, and an inhalation dose factor are included in the utility but are not used by the HIDP. The utility was developed by Paul Rittman, based on his earlier work (Rittman 1984).

PNNL-MA-860 Appendix D Issued: September 30, 2000 Page D.8 Supersedes: New
D.5 References
International Commission on Radiological Protection (ICRP). 1979. “Limits for intakes of radionuclides by workers.” (ICRP publication 30, part 1.) Annals of the ICRP, 2:3-4, Pergamon Press, New York. Strenge, D. L., R. A. Kennedy, M. J. Sula, and J. R. Johnson. 1992a. Code for Internal Dosimetry (CINDY Version 1.2) Part 1: Conceptual Representation. PNL-7493 Pt. 1, Rev. 1. Pacific Northwest Laboratory, Richland, Washington. Strenge, D. L., R. A. Kennedy, M. J. Sula, and J. R. Johnson. 1992b. Code for Internal Dosimetry (CINDY Version 1.2) Part 2: Users’ Guide. PNL-7493 Pt. 2, Rev. 1. Pacific Northwest Laboratory, Richland, Washington. Rittmann, P. D. 1984. Seven Health Physics Calculator Programs for the HP-41CV. RHO-HS-ST-5P. Rockwell Hanford Operations, Richland, Washington. U.S. Department of Energy (DOE). 1988. Radiation Protection for Occupational Workers. DOE 5480.11, Washington, D.C.

E Level 1 Heading
THIS PAGE CONTAINS A LEVEL 1 HEADING WHICH ACTIVATES THE APPENDIX LETTER IN THE PAGE NUMBER. THE HEADING 1 STYLE MUST BE
MODIFIED IN ORDER TO CHANGE THE APPENDIX LETTER.
PLEASE RECYCLE THIS PAGE.

Appendix E
Mixtures and Tracer Radionuclides

Issued: September 30, 2000 PNNL-MA-860 Appendix E Supersedes: New Page E.1
Appendix E
Mixtures and Tracer Radionuclides
Mixtures of radionuclides at Hanford can be found in reactor facili-ties, former processing facilities, waste management facilities, and laboratories. The radionuclides most commonly encountered in mixtures include 137Cs, 90Sr, and plutonium, although others are also possible. This appendix discusses the bioassay capability for mix-tures of 137Cs and 90Sr, 137Cs and plutonium, and 90Sr and plutonium. Where the composition of a mixture can be well-characterized, (e.g., a potential intake identified at the time by field indicators), then bioassay for a tracer radionuclide may provide optimum monitoring capability, with determination of nuclides not detectable by bioassay inferred by ratio using intake characterization information, such as a representative nasal or surface smear or an air sample. Depending upon the isotope ratios in the mixture, the tracer radionuclide may be important from a bioassay perspective, but may not be a dominant contributor to internal dose. Bioassay for a tracer radionuclide can provide a reasonable indicator of potential intake as a cost-effective alternative to multiple bio-assays when the mixture is well-characterized. However, detection of the tracer radionuclide as a high routine measurement can lead to complicated assessments. For high routine bioassay measurements, there may not be any obvious specific material to which a worker was exposed. For many years an assumption of a 1:1 137Cs:90Sr activity ratio was used as a fission product mixture, however, the wide range of waste management practices that have occurred at Hanford do not provide assurance that the 1:1 ratio is valid. Thus, where one nuclide is used as an indicator for others, detection of that nuclide by routine measurement is most appropriately used as a trigger for supplemental bioassay for other, potentially significant, radionuclides. Once the bioassay analyses have been completed, intakes are confirmed only for those nuclides detected or that can confidently be inferred from tracer nuclide detection and knowledge of the workplace mixture. Bioassay capability (in terms of minimum detectable doses) has been evaluated for combinations of 137Cs and 90Sr, 137Cs and plutonium, and 90Sr and plutonium. For convenience, it is considered irrelevant as to whether the plutonium is 239Pu, 238Pu, Pu-alpha, or 241Am, because the dose coefficients are reasonably close. The dose

PNNL-MA-860 Appendix E Issued: September 30, 2000 Page E.2 Supersedes: New
coefficients and retention fractions used for these analyses are taken from the chapters of this manual that address the specific radioisotopes.
E.1 Cesium-137 and Strontium-90 Mixtures Mixtures of 137Cs and 90Sr are particularly common in waste manage-ment facilities and are especially prevalent in the 200 Area tank farms. It is assumed that both nuclides are class D. Table E.1 and Figure E.1 show the minimum detectable doses associated with a preview whole body count and a 90Sr urinalysis for several mixtures of 137Cs and 90Sr. Collectively, these show that an annual whole body count using the NaI Preview Counter meets the 100-mrem bioassay goal for minimum detectable committed effective dose equivalent for mixtures having 137Cs:90Sr activity ratios of up to approximately 1:20. Use of the germanium coaxial counter improves the ratio to about 1:40 for meeting the 100-mrem bioassay goal, as shown in Table E.1 and Figure E.2.
E.2 Cesium-137 and Plutonium Mixtures
Mixtures of 137Cs and plutonium can be found primarily in facilities associated with spent fuel management, and in wastes associated with such buildings. Examples include the spent fuel basins, fuel processing hot cells, and waste tank sludges. By radioactivity, these mixtures are likely to be mostly 137Cs, with 137Cs:plutonium ratios ranging from perhaps 1000:1 to 1:1. Until the mid-1990s, little attention was given to trace amounts of plutonium in predominantly fission product contamination. However, recognition of the dosimetric importance of trace plutonium developed with the implementation of the committed dose system and as more detailed facility contamination characterization data became available. Determining whether the plutonium might be class W or Y is problematic; if the plutonium contamination resulted from leaching out of fuel or residuals from processing of fuel, then a class W assumption would be appropriate. If it resulted from corroded, unreprocessed fuel, then a class Y assumption would probably be more appropriate. Bioassay program capabilities for 137Cs and 239Pu as tracer nuclides for several cesium-plutonium mixtures are shown in Table E.2 and Figures E.3 and E.4. The source material considered here is assumed to be class D 137Cs and class W plutonium. This assumption provides a reasonably conservative estimate of minimum detectable dose (MDD) based on a whole body count and the assumed isotopic ratio. Doses associated with plutonium detection by urinalysis would be substantially higher if the plutonium was a class Y form.

Issued: September 30, 2000
PN
NL-M
A-860 A
ppendix ESupersedes: N
ew
Page E.3
Table E.1. Minimum Detectable Dose (HE,50, in mrem) for Mixtures(a) of 137Cs and 90Sr Based on Tracer Nuclide Bioassay
1:1 Cs:Sr 1:10 Cs:Sr 1:20 Cs:Sr Days Post Intake Preview(b) Coax (c) Urine (d) Preview(b) Coax (c) Urine (d) Preview(b) Coax (c) Urine (d)
1 0.46 0.28 0.03 4.0 2.5 0.02 8.0 4.9 0.02 2 0.48 0.29 0.03 4.2 2.6 0.03 8.2 5.1 0.03 7 0.52 0.32 0.08 4.5 2.8 0.07 9.0 5.5 0.07
14 0.55 0.34 0.25 4.8 2.9 0.22 9.4 5.8 0.22 30 0.60 0.37 2.2 5.2 3.2 1.9 10 6.4 1.9 60 0.73 0.45 7.5 6.4 3.9 6.5 13 7.8 6.5 90 0.89 0.55 9.5 7.8 4.8 8.2 15 9.5 8.2
180 1.6 0.97 15 14 8.4 13 27 17 13 365 5.1 3.2 30 45 27 26 88 54 26 730 52 32 71 450 280 62 900 550 61
1:40 Cs:Sr 1:100 Cs:Sr 1:1000 Cs:Sr Days Post Intake Preview(b) Coax (c) Urine (d) Preview(b) Coax (c) Urine (d) Preview(b) Coax (c) Urine (d)
1 16 9.7 0.02 40 24 0.02 394 243 0.02 2 16 10 0.03 41 25 0.03 408 251 0.03 7 18 11 0.07 45 27 0.07 444 273 0.07
14 19 12 0.21 47 29 0.21 468 288 0.21 30 21 13 1.9 52 32 1.8 516 318 1.8 60 25 15 6.4 63 39 6.4 627 386 6.4 90 31 19 8.1 76 47 8.1 763 470 8.1
180 54 33 13 135 83 13 1350 831 13 365 180 110 26 439 270 26 4388 2700 26 730 1800 1100 61 4500 2700 61 44,000 27,000 61
(a) Assumes acute inhalation of class D, 5-µm-AMAD particles for both 137Cs and 90Sr. (b) Preview count MDA of 1.3 nCi 137Cs. (c) Coaxial count MDA of 0.8 nCi 137Cs. (d) 90Sr urinalysis MDA of 10 dpm/d.

PNNL-MA-860 Appendix E Issued: September 30, 2000 Page E.4 Supersedes: New
0.01
0.10
1.00
10.00
100.00
1000.00
10000.00
1 10 100 1000
Days Post Intake
Min
imu
m D
etec
tab
le D
ose
, HE
,50
(m
rem
)
1:1 Preview
1:10 Preview
1:20 Preview
1:100 Preview
1:1 SrU
1:10 SrU
1:20 SrU
1:100 SrU
Figure E.1. Bioassay Capability Comparison for 137Cs:90Sr Mixtures Based on Preview Whole Body
Count (WBC) and 90Sr Urinalysis (SrU)
0.01
0.10
1.00
10.00
100.00
1000.00
10000.00
1 10 100 1000
Days Post Intake
Min
imu
m D
etec
tab
le D
ose
, HE
,50
(mre
m)
1:1 Coax
1:10 Coax
1:40 Coax
1:100 Coax
1:1 SrU
1:10 SrU
1:40 SrU
1:100 SrU
Figure E.2. Bioassay Capability Comparison for 137Cs:90Sr Mixtures Based on Coaxial Whole Body
Count (WBC) and 90Sr Urinalysis (SrU)

Issued: September 30, 2000
PN
NL-M
A-860 A
ppendix ESupersedes: N
ew
Page E.5
Table E.2. Minimum Detectable Dose (HE,50, in mrem) for Mixtures(a) of 137Cs and 239Pu Based on Tracer Nuclide Bioassay
1000:1 Cs:Pu 100:1 Cs:Pu 80:1 Cs:Pu Days Post Intake Preview(b) Coax (c) Urine (d) Preview(b) Coax (c) Urine (d) Preview(b) Coax (c) Urine (d)
1 0.77 0.47 14 7.1 4.4 12 8.8 5.4 12 2 0.80 0.49 22 7.3 4.5 20 9.1 5.6 20 7 0.87 0.53 69 8.0 4.9 63 9.9 6.1 63
14 0.91 0.56 108 8.4 5.2 99 10 6.4 99 30 1.0 0.62 169 9.3 5.7 160 12 7.1 160 60 1.2 0.75 237 11 6.9 220 14 8.6 220 90 1.5 0.91 338 14 8.4 310 17 11 310
180 2.6 1.6 431 24 15 400 30 19 400 365 8.5 5.3 585 79 48 540 98 60 540 730 87 53 970 800 490 890 1000 610 890
40:1 Cs:Pu 10:1 Cs:Pu 1:1 Cs:Pu Days Post Intake Preview(b) Coax (c) Urine (d) Preview(b) Coax (c) Urine (d) Preview(b) Coax (c) Urine (d)
1 18 10.8 12 70 43 12 701 430 12 2 18 11 20 73 45 20 730 450 20 7 20 12 63 79 49 63 790 490 63
14 21 13 99 83 51 98 830 510 98 30 23 14 160 92 57 160 920 570 150 60 28 17 220 110 69 220 1100 690 220 90 34 21 310 140 84 310 1400 840 310
180 60 37 400 240 150 390 2400 1500 390 365 200 120 540 780 480 530 7800 4800 530 730 20,000 1200 890 7900 4900 880 79,000 49,000 880
(a) Assumes acute inhalation of class D, 5-µm-AMAD particles for 137Cs and class W, 5-µm-AMAD particles for 239Pu. (b) Preview count MDA of 1.3 nCi 137Cs. (c) Coaxial count MDA of 0.8 nCi 137Cs. (d) 239Pu urinalysis MDA of 0.02 dpm/d.

PNNL-MA-860 Appendix E Issued: September 30, 2000 Page E.6 Supersedes: New
0.10
1.00
10.00
100.00
1000.00
10000.00
100000.00
1 10 100 1000
Days Post Intake
Min
imu
m D
etec
tab
le D
ose
, HE
,50
(mre
m)
1000:1 Preview
100:1 Preview
10:1 Preview
1:1 Preview
1000:1 PuU
100:1 PuU
10:1 PuU
1:1 PuU
Figure E.3. Bioassay Capability Comparison for 137Cs:239Pu Mixtures Based on Preview Whole Body
Count (WBC) and 239Pu Urinalysis (PuU)
0.10
1.00
10.00
100.00
1000.00
10000.00
100000.00
1 10 100 1000
Days Post Intake
Min
imu
m D
etec
tab
le D
ose
, H
E,5
0 (m
rem
)
1000:1 Coax
100:1 Coax
10:1 Coax
1:1 Coax
1000:1 PuU
100:1 PuU
10:1 PuU
1:1 PuU
Figure E.4. Bioassay Capability Comparison for 137Cs:239Pu Mixtures Based on Coaxial Whole Body
Count (WBC) and 239Pu Urinalysis (PuU)

Issued: September 30, 2000 PNNL-MA-860 Appendix E Supersedes: New Page E.7
Based on the data presented, an annual whole body count using the preview counter is capable of meeting the 100-mrem bioassay goal for mixtures down to about an 80:1 ratio of 137Cs:plutonium. Using the coax counter allows reduction to approximately 40:1. If the potential exists for exposure to material with 137Cs:plutonium ratios lower than these, then the worker should be considered for routine plutonium bioassay as might be performed for a pure plutonium source.
E.3 Strontium-90 and Plutonium Mixtures
Mixtures of 90Sr and plutonium are considered most likely to occur in tank farm facilities, probably associated with contamination originating from waste tank sludges. The 90Sr is assumed to be a class D material and the plutonium a class W material, consistent with the nitrate nature of most waste tank contents. It is possible that dry plutonium contamination exposed to dry air and a normal building/outdoor temperature environment could undergo gradual oxidation over long time periods and approach a class Y material. However, the use of class W dose coefficients for plutonium provides a conservative approach to the estimations of MDD based on 90Sr as a tracer radionuclide. Bioassay program capabilities for 90Sr and 239Pu as tracer nuclides for several strontium-plutonium mixtures are shown in Table E.3 and Figures E.5. The source material considered here is assumed to be class D 90Sr and class W plutonium. This assumption provides a reasonably conservative estimate of MDD based on radiostronitum urinalysis and the assumed isotopic ratio. Doses associated with plutonium detection by urinalysis would be substantially higher if the plutonium was a class Y form. Based on the data presented, an annual 90Sr urinalysis is capable of meeting the 100-mrem bioassay goal for mixtures down to about a 600:1 ratio of 90Sr:plutonium. The mixture for which a 90Sr urinalysis would provide essentially equal MDD capability with a plutonium urinalysis for class W material was calculated to be 86:1, and the MDD was calculated to be 560 mrem. If the potential exists for exposure to material with 90Sr:plutonium ratios lower than these, then the worker should be considered for routine plutonium bioassay as might be performed for a pure plutonium source.

PNNL-MA-860 Appendix E Issued: September 30, 2000 Page E.8 Supersedes: New
Table E.3. Minimum Detectable Dose (HE,50, in mrem) for Mixtures(a) of 90Sr and 239Pu Based on Tracer Nuclide Bioassay
1000:1 90Sr:Pu 600:1 90Sr:Pu 100:1 90Sr:Pu 10:1 90Sr:Pu
Days Post Intake
90Sr Urine(b)
239Pu Urine(c)
90Sr Urine(b)
239Pu Urine(c)
90Sr Urine(b)
239Pu Urine(c)
90Sr Urine(b)
239Pu Urine(c)
1 0.06 19 0.1 17 0.4 13 4.0 12 2 0.08 31 0.1 26 0.5 21 4.9 20 7 0.20 98 0.3 84 1.3 66 13 63
14 0.59 150 0.8 130 4 104 38 99 30 5.1 240 7.3 210 35 160 330 160 60 18 340 25 290 120 230 1100 220 90 23 480 32 410 150 330 1500 310
180 36 610 52 530 250 420 2300 400 365 72 830 100 710 490 560 4600 540 730 170 1400 240 1200 1100 930 11,000 890
(a) Assumes acute inhalation of class D, 5-µm-AMAD particles for 90Sr and class W, 5-µm particles for plutonium. (b) 90Sr urinalysis MDA of 10 dpm/d. (c) 239Pu urinalysis MDA of 0.02 dpm/d.
Figure E.5. Bioassay Capability Comparison for 90Sr:239Pu Mixtures Based on 90S Urinalysis (SrU)r and
239Pu Urinalysis (PuU)
0.01
0.10
1.00
10.00
100.00
1000.00
10000.00
1 10 100 1000
Days Post Intake
Min
imu
m D
etec
tab
le D
ose
, HE
,50
(m
rem
)
1000:1 SrU
600:1 SrU
100:1 SrU
10:1 SrU
1000:1 PuU
600:1 PuU
100:1 PuU
10:1 PuU

